Directional Driver Hazard Advisory System
31
DIRECTIONAL DRIVER HAZARD ADVISORY SYSTEM ECE 445 Final Report, Spring 2017 Ben Moore and Vasil Pendavinji Team: 24 TA: Yuchen He May 2017
Transcript of Directional Driver Hazard Advisory System

DIRECTIONAL DRIVER HAZARD
ADVISORY SYSTEM
ECE 445 Final Report, Spring 2017
Ben Moore and Vasil Pendavinji
Team: 24
TA: Yuchen He
May 2017

ii
Abstract
Our project is a device that can be mounted to a vehicle to facilitate the receiving and sending of data
packets over an Infrared channel between drivers on the same road. This allows drivers to communicate
potential road hazards through manual entry or automatic sending triggered by sensor data. Infrared is
used to keep the device independent of additional infrastructure and directional to only inform affected
drivers. We use a lens to extend the IR Range to a point suitable for road applications (up to speeds of
~35 mph) and designed a communication control flow to improve the safety and reliability potential of
the device.

iii
Table of Contents 1. Introduction .............................................................................................................................................. 1
1.1 Objective ............................................................................................................................................. 1
1.2 Background ......................................................................................................................................... 1
1.3 General Design .................................................................................................................................... 2
2 Design ......................................................................................................................................................... 3
2.1 Communication ................................................................................................................................... 3
2.2 Microcontroller ................................................................................................................................... 4
2.3 Input .................................................................................................................................................... 5
2.4 Output ................................................................................................................................................. 6
2.5 Power .................................................................................................................................................. 7
2.6 Software .............................................................................................................................................. 7
3. Design Verification .................................................................................................................................. 10
3.1 Communication ................................................................................................................................. 10
3.2 Microcontroller ................................................................................................................................. 11
3.3 Input .................................................................................................................................................. 11
3.4 Output ............................................................................................................................................... 12
3.5 Power ................................................................................................................................................ 12
3.6 Software ............................................................................................................................................ 12
4. Costs ........................................................................................................................................................ 14
4.1 Parts .................................................................................................................................................. 14
4.2 Labor ................................................................................................................................................. 14
5. Conclusion ............................................................................................................................................... 15
5.1 Accomplishments .............................................................................................................................. 15
5.2 Safety and Ethics ............................................................................................................................... 15
5.3 Future Work ...................................................................................................................................... 15
6. Additional Figures ................................................................................................................................... 17
References .................................................................................................................................................. 19
Appendix A Requirement and Verification Table ....................................................................................... 20
Appendix B Code Snippets .......................................................................................................................... 24
Appendix C Additional Data ........................................................................................................................ 26

1
1. Introduction
1.1 Objective
Even with self-driving cars on the horizon, there is still more that we can do to make driving safer with
technology for human operators. In the United States, there were 35,092 fatalities and 2.44 million
injuries from motor vehicle accidents in 2015 [1]. This makes it one of the leading causes of death in the
United States [2]. With some of the top causes of most accidents being distracted driving, reckless
driving, and hazardous conditions on the road [3], a driver can benefit from increased awareness and
information about the road and nearby drivers.
Our project aims to augment driver awareness of the road by using motion data from sensors within a
car to detect and directionally communicate hazards to nearby cars. This information will propagate
from car to car using IR transmitters and receivers to keep drivers informed of potential advisories
through audio cues. Some hazards, like rapid deceleration or hard swerves could be automatically
detected which would send a propagating notification backwards to advise other drivers. In addition to
those automatically detected, the passenger can put up advisories for less immediate hazards, such as
road obstructions, dangerous road conditions, or recent accidents.
In this report, we will explore the general design of our project, dive deeper into all our specific
components, and how we assessed and verified their requirements within the project through testing.
Following that we will review the success that we found with our device, both in fulfilling all
requirements that we originally laid out as well as meeting major technical objectives such as the
maximum IR range and IMU Hazard Detection. Lastly, we will discuss the safety considerations of our
project and work that we can do for improvements in the future.
1.2 Background
Currently most new vehicles on the road today already come equipped with additional sensors to
attempt to keep the driver more alert and aware of unsafe driver behavior or road conditions. Sensors
like blind spot sensors, lane departure sensors [4] and backup cameras greatly help driver awareness,
but are limited to the immediate area around the car. Given that hazards that can be detected by one
car can affect several behind it, our system propagates and shares information to ensure all drivers are
aware.
Other technologies that work to provide a similar sharing of information are mobile apps like Waze and
CB radio (an old-school approach). Our system differentiates itself in that responds to hazards like
unsafe braking automatically, unlike Waze which relies solely on crowdsourcing for data. Also, our
system is directional, meaning a notification will be propagated directionally as to only notify drivers
who would be affected by that notification. It is also worth noting that because every system can
communicate with any another system independently, it requires no internet connection or backend
system to operate.

2
1.3 General Design
We decided to compartmentalize our project into functional components (As seen below in Figure 1).
See Figure 13 for a schematic of our design and Figure 14 for our board design. Each block represents an
individual function, contributing in a different way to the goal of the project. The Input block represents
the two user inputs to our system: passenger button inputs, and IMU readings. The output block
represents the two ways in which we will communicate with the driver and passenger: the speaker and
LCD. The communication block represents communication between devices. Each component is
controlled by a microcontroller. Finally, the power block provides suitable power to each block.
Figure 1

3
2 Design
2.1 Communication
Each device has both an IR receiver and transmitter for the purpose of communication. Communication
is a critical component of our project. We spent a lot of time carefully selecting and integrating our
components to achieve range which IR is not normally capable of. We chose IR specifically because it
provides a number of benefits to our application. IR is directional, which was a key feature that we
wanted our device to have. Directional communication allows us to communicate hazards only to users
who need to know about them. IR also allows our product to operate without any additional
infrastructure, such as cell tower or GPS access. Alternative communication media such as RF or the
internet would force us to give up these benefits.
2.1.1 IR Receiver
Our IR receiver is an off the shelf product manufactured by Vishay Semiconductors model no.
TSOP38338. It has a number of characteristics that make it well suited to our project. It has a field of
view of 45° which allows to have directionality in our communication. Additionally, it has noise filtering
capabilities built in, which is important for our application since we have to deal with a lot of
environmental IR radiation. Alternatively, we could have designed our own IR receiver, but the
TSOP38338 met all our requirements and saved us a lot of time over rolling our own circuit. Figure 2
shows the internal design of the IR receiver.
Figure 2: TSOP38338 Schematic (from manufacturer datasheet)[5]
2.1.2 IR Transmitter
The IR transmitter consists of two components: a high-powered IR LED and a plano-convex lens which
focuses the light emitted by the LED into a beam, allowing us to transmit at ranges greater than would
be possible with the bare LED. The lens must be paired with the LED so that given the LED’s angle of half
intensity, with the LED at the lens’s focal point, the lens spans the most intense part of the LED’s light, as
is illustrated by Figure 3. The relationship between the lens’s diameter D, the LED’s angle of half
intensity a, and the focal length f is expressed by Equation 1. Alternatively, we could have used an IR
specific MCU dedicated to transmission purposes. This would have freed up CPU cycles on our main
MCU but would have also added to the cost and complexity of our system. Additionally, we made a
change to our design from its initial form. We initially had a 100Ω resistor in series with our LED, but
after doing some reading on designs people have used this LED in, it turns out that in IR communication,

4
the duty cycle of the signal is low enough that you can run the LED without a resistor without burning it
out. This allows it to draw more current and transmit at a higher intensity, greatly increasing its range.
Figure 4 shows the manufacturer’s recommended circuit for our chosen receiver.
𝑓(𝐷, 𝑎) =𝐷
2tan(𝑎) (1)
Figure 3
Figure 4: TSOP38338 Recommended Circuit (from manufacturer datasheet)[5]
2.2 Microcontroller
We used the Atmega 1284 to control our circuit. This microcontroller wound up being very well suited to
our project. It had ample I/O pins for everything that we needed, with pins to spare so there is plenty of
room to grow. Additionally, the support for SPI and I2C made communicating with our SPI and I2C
devices (our LCD controller communicates over SPI and our IMU communicates over I2C) relatively
simple. The onboard timers allow us to perform modulation of the transmitter signal without the need
for any additional hardware. Finally, the biggest benefit that the Atmega 1284’s architecture is fairly
similar to the to the AVR parts used by Arduino, so we were able to use the Arduino core (see Figure 5
for pin mappings) with our microcontroller. This had two benefits to us: it allowed us to use the Arduino
libraries and development environment which are well documented and easy to use, and it also allowed
us to write code that could be tested on Arduino hardware which has features that our device does not,
such as a serial out for logging purposes. The Atmega1284 wound up being a safe choice for our project

5
is it is very feature packed, but we found that we did not need all the pinouts and features that it has
available so in future iterations we would consider using a simpler and cheaper microcontroller.
Figure 5: Atmega1284 Arduino Pin Mappings [6]
2.3 Input
Overall, we wanted the user to have minimal input into our system as to minimize its distractive
potential on the road. For most of our hazards we are relying on data from the IMU combined with our
Hazard Detection algorithm to automatically detect and trigger a propagating message. With other
hazards that we believe can benefit from manual entry from the user, we have designed a pad of 5
buttons for the user to interact with.
2.3.1 IMU
When making our design decisions as to what sensors to put onto our device for the automatic
detection of messages, our priority was for an accelerometer. We chose to use the MPU9255 as it had
not only a 3-axis accelerometer, but also a 3-axis gyroscope and 3-axis digital compass that we could use
for more data when we added detection of other hazards in the future. The IMU communicated with
our ATMEGA 1284 on I2C interface, and could be sampled at a rate much higher than our required
100Hz. Figure 6 contains IMU with its pins in our circuit schematic.

6
Figure 6: IMU Schematic
2.3.2 Buttons
We decided on a strip of 5 buttons for manual entry of other preset hazards to keep the user
interactions with our device extremely simple. Other things we considered were touchscreens or
number pads, yet those would require more attention to the device than we wanted. One of our only
requirements was that we wanted to be sure that they gave a tactile push as a user could be sure that
they had triggered a message without looking at their input.
2.4 Output
2.4.1 Speaker
We decided to use a speaker to interface with the driver because it follows the standards of many other
driver-awareness tools currently implemented into vehicles like blind-spot sensors or lane departure
sensors which use auditory notifications for the driver. Because we only wanted to vary the duration
and volume of the speaker, the “Large Piezo 3kHz Alarm” that we picked was a smart choice because we
simply had to run a voltage (3.3-18V) through it to produce the sound we wanted. We set out a sound
goal of at least 70 dB which we believed would be plenty to alert the driver with the ambient noise in a
car as well as music playing at an average volume.
2.4.2 LCD
The LCD we wound up using is a part out of the Nokia 5110. We chose this display because it is compact,
high contrast, and cheap. The display is driven by the PCD8544 controller which allows us to update the
entire framebuffer relatively easily. The controller communicates with our microcontroller over the SPI
protocol, so running the display Is simple given our choice of microcontroller. The display has a
Resolution of 84x48 pixels which allows us to display rich and easily distinguished icons as well as text.
Alternatively, we could have used a higher resolution display, but we would not have found much
benefit in more pixels given that the 84x48 resolution was sufficient to display both icons and text.

7
2.5 Power
2.5.1 Cigarette Lighter Adapter
The cigarette lighter adapter is the most common power connection found in cars in the US, so we
decided to use it as the source of power for our device. This has the benefit of giving us access to a lot of
power if we need it, since the car should be able to supply ample current if it either has charge in its
battery or is running. Alternatively, we could have used a USB connector to power our device, but those
are less common in older cars while the cigarette lighter is ubiquitous. We could have also used a
battery, but that would have complicated both our design and the use of our product since the user
would need to worry about charging the battery.
2.5.2 Voltage Regulator
Given that our device can run off a car’s 12V supply, power consumption is not a huge concern, but we
did do our best to keep it to a minimum since it is desirable to keep heat dissipation low. We used the
Texas Instruments LM1086IT-3.3, a linear regulator, for simplicity. The regulator’s simulated
characteristics can be seen in Figure 7.
2.6 Software
Our project relies on two important software implementations. The IR Message Protocol which
describes the way that the message data is formatted, sent, and propagated from IR Transmitter to
receiver, and the IMU Hazard Detection algorithm which is focused on detection of dangerous braking
patterns. These two components are described in more detail below.
2.6.1 IR Message Protocol
Our send and receive protocol is an at-least-once protocol. When a vehicle wants to alert other drivers
of an advisory the transmitter will spam a message continuously for 3 seconds which allows us to
combat the relatively high packet loss rate while also delivering vehicles who come into range of the
transmitter while sending. We have set a reasonable packet loss rate of around 47%, at a worst case
Figure 7: Voltage Regulator Simulation

8
following distance of 100ft. Under worst case conditions, where a driver in front of you begins breaking
hard, a car going 55mph, which is the speed limit on most US highways in urban environments, will
travel 100ft in 1.24s. With a driver reaction time of 1s [7], that leaves us 0.24s to transmit our message
for a driver to notice it before having driven 100ft. In 0.24s, with a message length of 50ms, we can send
at most 4 full messages. Since we would like to successfully alert the driver at least 95% of the time, the
chance of a message failing 4 times in a row must be less than 5%. With a packet loss rate of 47%, the
chance of 4 messages in a row being lost is 4.9%. Additionally, we have two parity bits (one for each half
of the message). If an error is detected (see Figure 15 in Appendix B), the packet will be thrown out. Our
protocol models the Sony IR protocol [8]. The code that creates packets can be found in Figure 16 in
Appendix B. We use pulse width encoding of data, so a 1 bit has a different pulse width than a 0 bit (see
Figure 9). Messages have 5 components, a header, a 4-bit message ID, a 4-bit hops to live field, a 6-bit
message field, and two bits for parity checking (seen in Figure 8). The message ID is a unique identifier
for each message and is used to suppress repeated messages. Hops to live is used for relaying and
propagating messages. When a message is received with a positive hops-to-live field, its hops to live
field is decremented and then it is sent backwards by the receiver. The message field is where the type
of message is encoded. We currently have 5 messages which can be sent: 1. Hard braking 2. Accident
ahead 3. Obstruction ahead 4. Ice/snow ahead 5. Rain ahead. Given the fact that we allocated 6 bits for
this field, we could potentially add more message types in the future.
Figure 9: Modulated Signal [8]
2.6.2 IMU Hazard Detection
Our IMU Hazard Detection algorithm uses the accelerometer data from the IMU in the X axis to
determine if a vehicle is braking at an unsafe rate. Firstly, we set an unsafe deceleration threshold that
will be used to trigger the message send, which we set at 0.8g or 7.98 m/s2. According to sources we
researched [7], under ideal conditions skilled drivers can achieve 1g deceleration, however on a public
road this is not realistic. Then we determined that we will sample the IMU at a rate of 100Hz which is
well within the range of being able to detect extreme decelerations. Using the readings from the
accelerometer, we will be keeping a time moving average of the last 10 readings. We selected the last
Figure 8: Message Format

9
10 readings as a compromise between the amount of smoothing we could do to counteract the noise
from the IMU sensor and our reaction time to the start of rapid deceleration, which with a sampling of
100 Hz will be 100ms. Finally, to determine whether to send a propagating hazard notification, we test
that if at any point that average moved higher than our set safe braking threshold of 7.98 m/s2 (See
Equation 2). Once we hit this threshold, the vehicle will send a message alerting other cars to brake
immediately.
𝑆𝑇+𝑆𝑇−1+⋯+𝑆𝑇−8+𝑆𝑇−9
10< 7.98𝑚/𝑠2 (2)

10
3. Design Verification
3.1 Communication
To verify our IR transmitter and receiver, we performed several tests, both indoors and outdoors. For
the outdoor tests, we set our device up on a sidewalk (see Figure 10) on a sunny day (which we believe
to be worst case conditions barring precipitation or inclement weather). The first test we ran was a
range test. We measured 100ft between our IR receiver and transmitter using measuring tape for the
first test. We then transmitted 50 packets from our device and printed out the results on the other
device. We repeated this test for 125ft and 150ft. We then looked at the number of packets that were
successfully received vs. the number of packets sent to determine the packet loss rate for each test.
Finally, we repeated the range tests with the receiver at various distances off-center from the
transmitter to determine the radius of the signal at each distance. We performed the same test, sending
several packets and counting how many were received. Any test with a packet loss rate of less than 47%
were deemed successful. The results for each of these tests can be found in Table 1.
Table 1
Test Packets Sent
Packets Successfully Received
Packet Loss Rate (%)
100ft centered 50 50 0
125ft centered 50 50 0
150ft centered 10 0 100
100ft, 4ft off center 10 10 0
100ft, 6ft off center 10 1 90
125ft, 2ft off center 10 9 10
125ft, 4ft off center 10 0 100

11
Figure 10: Testing Setup
3.2 Microcontroller
To verify our microcontroller block, we first verified the power requirement. To do this, we had to
connect our Arduino ISP programmer (which operates on 5V logic) to a logic converter in order to bring
the logic levels down to 3.3V. We then connected the MCU to our test setup with 3.3V powering it. We
programmed the MCU with simple code that is meant to blink an LED and verified that it did in fact
cause the LED to blink. We then repeated this procedure for each of the 16 I/O pins to verify their
output functionality. Then we connected buttons to the pins in input mode to verify their input
functionality. To test the PWM functionality, we varied the effective voltage on the LED which produced
the expected dimming functionality. Finally, to test the I2C functionality, we connected our IMU to the
I2C pins and verified that we could read from it. See Figure 5 for pin mappings.
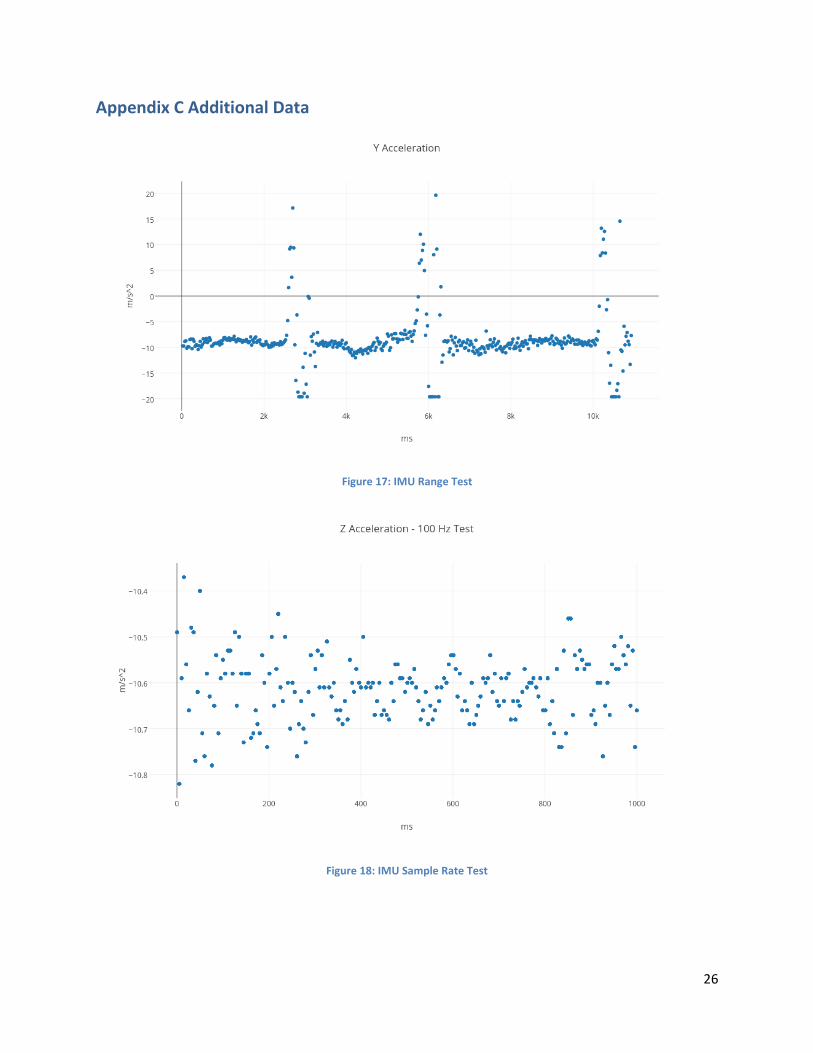
3.3 Input
The main requirements for the Input Block as seen in Table 3 in Appendix A, that we needed to test
were for the range and sampling rate of the IMU. Our set requirements were that the range needed to
be at least 2g and the sampling rate would be at least 100 Hz. To verify this first requirement, we
followed the procedure and simply induced these ranges through accelerating the IMU quickly along the
Y axis. This experiment is seen Figure 17 in Appendix C, where we can confirm our ability to measure up
to 2g along the preset axis. Secondly, we did a sampling test by simply counting the number of samples
that we could receive in a certain amount of time. During our test, we read from the IMU 201 times
within 1000ms, thereby yielding a sampling rate of 201Hz, well beyond our requirement. This data is
seen graphed in Figure 18 in Appendix C.

12
3.4 Output
The main verification needed for the speaker was the dB minimum that our device required to
effectively notify the driver. As we needed above 70dB, we originally set out to run the speaker at 12V.
However even at 1 meter at 12V, the speaker produced a tone > 100 dB. As this was too loud for our
purposes, we attempted to run the speaker at 3.3V like the rest of the circuit and still hit above 70 dB.
We used an iPhone decibel meter at 1 meter away to measure the alarm (Figure 19 in Appendix C), and
could achieve a max reading of > 84.7dB. Also seen is an average of 73.4 dB even with the alarm only
periodically being sounded.
To verify our LCD, we connected it to our prototype and loaded several images on it. We first loaded an
icon with 84x48 resolution to verify that we were successfully addressing every pixel in the framebuffer.
We then loaded a black image and then a white image to verify that we could display both black and
white pixels.
3.5 Power
To verify our power requirement, we connected the entire circuit to an ammeter, powered it up, and
loaded the MCU with code that runs the speaker and transmitter constantly. We found that the power
draw for the entire circuit was under 20mA, well below our requirement. You can see the reading in
Figure 11 below.
Figure 11: Current Draw
3.6 Software
3.6.1 IR Message Protocol
To verify the first software requirement, we wrote a test program that measures the amount of time it
takes our prototype to send 1000 messages. We wanted to test the worst-case scenario, so we had our
prototype send messages all 1’s, since a binary 1 takes longer to send with our pulse width encoding
scheme. The test wound up taking 32.3 seconds to send 1000 messages (see Figure 12), which means it
took 32.3ms on average for each message, well below the target 50ms. We then wrote a test program
to verify our error detection. This program would send messages with flipped bits to our prototype,
which succeeded in detecting and discarding the erroneous messages while accepting and displaying the

13
correct messages. Lastly, we wrote a test program that spams messages with the same message ID. We
could verify that our prototype only displays the message once, discarding the repeat messages.
Figure 12: 1000 Message Test
3.6.2 IMU Hazard Detection
To verify our IMU Hazard Detection Algorithm, we attempted to induce rapid deceleration by braking in
one of our personal vehicles. For our personal safety and the wellbeing of the car, we did lower the
threshold to 0.6g as opposed to 0.8g which is what our design calls for. We ran several trials and used an
iPhone application that we wrote to record the raw accelerometer values of our phones to compare
against the positive or negative readings that we observed from our device. As seen in Figure 20 in
Appendix C, we received a positive reading from our device and can see graphically that we recorded
deceleration of greater than 0.6g for a period of greater than 100ms which confirms the positive output
of our device. In another trial seen in Figure 21 in Appendix C, we received a negative reading from our
device and in the graph, we can see that we never reached the threshold of 0.6g which confirms the
negative output of our device. We ran 6 trials in total, and in each the iPhone data confirmed the output
from our device.

14
4. Costs
4.1 Parts
A breakdown of the cost of our prototype is shown in Table 2 below.
Table 2 Parts Costs
Part Vendor Quantity Cost (Prototype)
Cost (Bulk)
IR Receiver Vishay Semiconductor TSOP38338
Digikey 5 $5.60 $2.05
IR Transmitter Vishay Semiconductor TSAL6100
Digikey 1 $0.57 $0.13
User Input Buttons 4Pin DIP Micro PCB tactile Push Button
Amazon 5 $5.29 $5.29
IMU XYG-Module Inertial Measurement Unit MPU9255
Amazon 1 $21.96 $21.96
Microcontroller Microchip Technology ATMEGA1284-PU
Digikey 1 $5.15 $4.27
LCD Display Nokia 5110 Graphic LCD 84x48
Sparkfun 1 $9.95 $8.96
Speaker Large Piezo 3KHz Alarm
Sparkfun 1 $2.95
$2.66
Voltage Regulator Texas Instruments LM1086IT-3.3/NOPB
Digikey 1 $1.67 $0.82
12V Power ROHS Car Adapter Plug PRT-11474
Sparkfun 1 $0.50 $0.50
Transistors STMicroelectronics STN3NF06L
Digikey 2 $0.43
$0.36
Resistors (x4 10K, x1 10. X1 100), Capacitors (.33µF, .1 µF)
Digikey 8 $0.05 $0.03
PCB 100x100mm 2 Layer PCB Way 1 $10.00 $10.00
Total $64.12 $57.03
4.2 Labor
The second cost is our development cost, which we will estimate at $30 per hour, 10 hours per week,
and 16 weeks of development each for the two members of our group. (See Equation 3)
$30
ℎ𝑟∗10ℎ𝑟
𝑤𝑒𝑒𝑘∗ 16𝑤𝑒𝑒𝑘𝑠 ∗ 2 = $9600(3)
With our $9600 of development cost and 2 x $64.12 (the prototype cost of our board), we estimate our
total cost to be $9728.24. (See Equation 4)
$9600 + (2 ∗ $64.12) = $9728.24(4)

15
5. Conclusion
5.1 Accomplishments
In the end, our project met all the objectives and high-level requirements that we set out to fulfill at the
beginning of the semester including everything we detailed in our original design document. Major
technical objectives that were achieved included long range directional IR communication of at least
100ft with line of sight during the day which we exceeded when we achieved ranges of greater than
125ft. We also maintained a packet loss less than our predetermined 47%, usually achieving all or none
in terms of packets within the ranges that we tested. Finally, our IMU Hazard Detection could
determine whether a vehicles deceleration exceeded our preset safe value and reacted by sending a
message to alert trailing drivers. Overall this allowed for the automatic detection and directional
communication of hazards that our project set out to accomplish.
5.2 Safety and Ethics
Working on a project that involves inherently involves a lot of safety considerations that we researched
and implemented into our design. Firstly, we followed the example of existing driving awareness tools
(i.e. blind spot sensors, lane departure sensors, etc.) and limited the driver interacting with our device to
the auditory notifications and icons displayed on the screen to minimize driver distraction. The input
buttons are only to be used by a front seat passenger which is reinforced with a warning message that is
displayed on the device’s startup. We also attempted to mitigate false positives with several error
checking techniques and false negatives with redundancies built in to our transmissions. At the same
time, we limited the spamming potential with an at-most-once delivery behavior on the receiving end,
as well as software timeouts to limit the amount of sends during a specified time from one device.
Another risk factor that we made sure to mitigate is IR radiation. Though some IR sources such as IR
lasers can cause damage to the eyes, the TSAL6100 LED that we used is safe for the naked eye.
According to semiconductor manufacturer Vishay Intertechnology Inc., “nearly all LEDs are far below the
Exempt limits.” [9]
Our safety risks and mitigations follow the IEEE code of ethics first point, “to accept responsibility in
making decisions consistent with the safety, health, and welfare of the public, and to disclose promptly
factors that might endanger the public or the environment” [10]. We believe that the benefits provided
through increased driver awareness outweigh the potential risk of driver distraction given our
distraction mitigation techniques.
5.3 Future Work
To continue expanding on the progress we made creating and iterating on this project, we have outlined
several paths that we can explore to enhance our device. Firstly, we would like to have more real-world
testing with actual vehicles on the road which was difficult during this semester both for safety and
logistical difficulties. Secondly, we would like to improve the overall range and versatility or our IR
communication. A range of 300ft would allow our device to communicate even for vehicles following
the 3 second rule at speeds up to 65 mph, which would cover much of the U.S. road infrastructure. Also,

16
we would still like our IR communication to work through several weather conditions like fog, rain, etc.
and different angles to account for roads of different elevations and curvature.

17
6. Additional Figures
Figure 13: Schematic

18
Figure 14: Board Design

19
References [1] US Department of Transportation, ‘2015 Motor Vehicle Crashes’, 2016. [Online].
Available: https://crashstats.nhtsa.dot.gov/Api/Public/ViewPublication/812318
[2] Centers for Disease Control and Prevention, ‘Health, United States 2015’, 2016. [Online].
Available: https://www.cdc.gov/nchs/data/hus/hus15.pdf#019
[3] Law Offices of Michael Pines, APC, ‘Top 25 Causes of Car Accidents’, 2016. [Online].
Available: https://seriousaccidents.com/legal-advice/top-causes-of-car-accidents/
[4] Mercedes-Benz Luxury Cars, ‘Active Blind Spot Assist’, 2016. [Online].
Available: https://www.mbusa.com/mercedes/technology/
[5] Mouser, ‘IR Receiver Modules for Remote Control Systems’, 2017. [Online].
Available: http://www.mouser.com/ds/2/427/tsop381-542565.pdf
[6] Protoneer, ‘The Unofficial Arduino Pinout Diagram’, 2017. [Online].
Available: http://blog.protoneer.co.nz/wp-content/uploads/2013/05/atmega1284_pinout.png
[7] NACTO, ‘Vehicle Stopping Distance and Time’, 2017. [Online].
Available: http://nacto.org/docs/usdg/vehicle_stopping_distance_and_time_upenn.pdf
[8] SB Projects, ‘Sony SIRC Protocol’, 2017. [Online].
Available: http://www.sbprojects.com/knowledge/ir/sirc.php
[9] Vishay Semiconductors, ‘Eye Safety Risk Assessment of Infrared Emitting Diodes’, 2015. [Online].
Available: http://www.vishay.com/docs/81935/eyesafe.pdf
[10] Institute of Electrical and Electronics Engineers, ‘IEEE Code of Ethics’, 2017. [Online]. Available:
http://www.ieee.org/about/corporate/governance/p7-8.html

20
Appendix A Requirement and Verification Table Table 3 System Requirements and Verifications
Block Requirements Verification Verification status
(Y or N)
Communication Must be able to correctly receive a message from 0-100ft during daylight and night with good visibility and with optics.
1. Place IR Receiver and lens assembly exactly 100ft downrange from IR Transmitter (Once at night and once during the day).
2. Send message with random data.
3. Ensure message was received correctly.
Y
Must be able to correctly receive a message from 0-30ft during daylight and night with good visibility and without optics.
1. Place IR Receiver and lens assembly exactly 30ft downrange from IR Transmitter (Once at night and once during the day).
2. Send message with random data.
3. Ensure message was received correctly.
Y
Must maintain at most a 47% packet loss rate at a 16-bit message size.
1. Place IR Receiver exactly 100ft downrange from IR Transmitter.
2. Send 50 messages with predefined data.
3. Ensure at least 53% of the messages were received by comparing sent and received.
Y
Must have a field of view between 25° and 180°.
1. Place IR Receiver exactly 10ft downrange from IR Transmitter.
2. Move the IR Transmitter 2.22ft in a perpendicular direction, creating a ~12.5°angle.
3. Send a message and ensure that it was received.
Y
Must be able to transmit one message of size 16 bits in under 50ms
1. Write program to transmit/receive 1000 messages.
2. Run program and use profiling tool on the
Y

21
Table 3 System Requirements and Verifications
receiving side to time how long it takes.
Input Buttons must be momentary and be tactile so the User knows it is pushed.
1. Press button. 2. Should feel a sharp, tactile
click. 3. Check continuity of
electrical path through button (there should be continuity).
4. Release button. 5. Check continuity of
electrical path through button (there should be no continuity).
y
IMU must be able to measure acceleration/deceleration from +60 ft/s2 to -60 ft/s2 in X and Y axes.
1. Connect IMU to MCU. 2. Start measurement of
acceleration in all axes. 3. Move MCU 1ft in less than
120 ms. 4. Verify that the acceleration
reading is over 60ft/s2 5. Move MCU 1ft in less than
240 ms. 6. Verify that the acceleration
reading is over 30ft/s2 7. Repeat for each axis.
Y
IMU must be able to measure at a resolution of 0.1 ft/s2 [15] and maintain a sample rate of 100Hz.
1. Connect IMU to MCU. 2. Start measurement of
acceleration in all axes. 3. Leave IMU static. 4. Compare accuracy of
measurement of gravitational acceleration to 32.2ft/s2.
5. Verify that at least 100 distinct samples were collected in 1 second.
Y
IMU must be able to communicate on I2C interface and draw less than 10mA at 3.3V.
1. Connect to I2C driver. 2. Connect ammeter. 3. Start measurement. 4. Measure current. 5. Place IMU on surface
parallel to ground, do not move IMU.
6. Verify that one axis of data reads gravitational
Y

22
Table 3 System Requirements and Verifications
acceleration and that the others read 0.
Microcontroller Must have sufficient IO pins to talk to 5 IR receivers, 1 LED, an I2C bus (2 pins), 5 buttons (3 pins), speaker (1 pin), and display (5 pins) (16 total). Must have PWM for at least 2 pins.
1. Verify that MCU has at least 16 I/O pins.
2. Drive each pin high and low and read from each pin.
3. Write high and low to each pin and verify output using a multimeter.
4. Verify that MCU has at least two PWM capable pins.
Y
Must work with a 3.3V power source and consume less than 100mA.
1. Connect MCU to 3.3V source and ammeter.
2. Measure current. 3. Load MCU with program. 4. Verify output of program.
Y
Output LCD must be larger than 1” and be able to display at least a 64*48 resolution black and white icon.
1. Load icon onto display and verify that entire icon is visible
2. Connect to controller and load driver.
3. Load black and white image onto screen.
4. Verify that there are black and white pixels.
Y
LCD must draw less than 500ma with a 3.3V source when display is on with backlight on.
1. Connect ammeter and measure current.
Y
Speaker must be at least 50-70 dB and be able to produce a tone at 3kHz.
1. Connect to 12v source. 2. Measure volume with
decibel meter. 3. Measure frequency of
sound emitted with a spectrum analyzer.
Y
Speaker must work with a 3.3V or 12V power source at less than 50mA.
1. Connect to 3.3v source. 2. Connect ammeter 3. Leave connected for 2
minutes. 4. Verify that a tone is
emitted and that the unit is not hot.
5. Measure current.
Y
Power Voltage regulator must be 1. Connect to bench power Y

23
Table 3 System Requirements and Verifications
able to take an input of 12V±10% and output 3.3V±10% and must be able to output 0-1A.
supply and voltmeter. Vary input voltage and measure input and output voltages.
2. Connect to bench power supply and wire a potentiometer in series.
3. Connect ammeter. 4. Turn potentiometer to
maximum resistance. 5. Lower resistance until the
ammeter reads 1A.
Circuit must draw less than 3.755±1W
1. Connect circuit to power supply and ammeter.
2. Start circuit operation. 3. Measure current draw of
circuit.
Y
Software IR message protocol notifies user only once when receiving the same message more than once.
1. Spam messages with varying message IDs.
2. Verify that only one notification is made to the user for each message ID.
Y
In case of single flipped bit, data should be rejected by IR message protocol.
1. Send messages with no error.
2. Verify that message is accepted.
3. Send messages with error. 4. Verify that message is not
accepted.
Y
Data that crosses acceleration threshold triggers a message send event.
1. Provide simulated IMU input that contains a fake hard braking event.
2. Verify that the function that sends a message is called.
Y
Pressing a button sends a message for the corresponding advisory.
1. Press a button on one unit. 2. Verify that the correct
advisory is set on the other unit.
3. Repeat for each button.
Y
Displays a different icon for each advisory.
1. A. Simulate receiving a message for each type of advisory.
Y

24
Appendix B Code Snippets
Figure 15

25
Figure 16
26
Appendix C Additional Data
Figure 17: IMU Range Test
Figure 18: IMU Sample Rate Test

27
Figure 19: Speaker Decibel Test
Figure 20: IMU Hazard Detection Test Positive

28
Figure 21: IMU Hazard Detection Negative