Direct Peptide Reactivity Assay (DPRA) ECVAM … · Direct Peptide Reactivity Assay (DPRA) ECVAM...
74
EUROPEAN COMMISSION JOINT RESEARCH CENTRE Institute for Health and Consumer Protection European Union Reference Laboratory for Alternative Methods to Animal Testing (ECVAM) Direct Peptide Reactivity Assay (DPRA) ECVAM Validation Study Report Page 1 of 74 Direct Peptide Reactivity Assay (DPRA) ECVAM Validation Study Report January 2012
Transcript of Direct Peptide Reactivity Assay (DPRA) ECVAM … · Direct Peptide Reactivity Assay (DPRA) ECVAM...
EUROPEAN COMMISSION JOINT RESEARCH CENTRE Institute for Health and Consumer Protection European Union Reference Laboratory for Alternative Methods to Animal Testing (ECVAM)
Direct Peptide Reactivity Assay (DPRA) ECVAM Validation Study Report Page 1 of 74
Direct Peptide Reactivity Assay (DPRA) ECVAM Validation Study Report
January 2012
Direct Peptide Reactivity Assay (DPRA) ECVAM Validation Study Report Page 2 of 74
SUMMARY.............................................................................................................................................................. 4
BACKGROUND...................................................................................................................................................... 5
MANAGEMENT OF THE STUDY....................................................................................................................... 8 1. STUDY OBJECTIVES ...................................................................................................................................... 8 2. PROJECT PLAN ........................................................................................................................................... 8
a. Structure of the study.............................................................................................................................. 9 b. Validation Management Group .......................................................................................................... 10 c. Laboratories......................................................................................................................................... 11 d. Quality Systems of the Participating Laboratories ............................................................................. 12
3. STUDY EXPERIMENTAL DESIGN AND SAMPLE SIZE ................................................................................. 13 4. SELECTION OF TEST CHEMICALS ............................................................................................................ 14 5. CHEMICALS PURCHASE, CODING AND DISTRIBUTION ............................................................................. 20
a. Solvent Compatibility assessment........................................................................................................ 20 b. Coding/Decoding ................................................................................................................................. 20
6. DATA MANAGEMENT ................................................................................................................................ 21 7. STATISTICAL ANALYSIS OF EXPERIMENTAL DATA ................................................................................ 22
a. Analysis performed on the experimental data .................................................................................... 22 b. Criteria for Assessing the Study Outcome .......................................................................................... 22
TEST DEFINITION (MODULE 1) .................................................................................................................... 24 1. INTENDED PURPOSE OF THE TEST METHOD ............................................................................................. 24 2. EVIDENCE DEMONSTRATING THE NEED OF THE TEST METHOD.............................................................. 24 3. STATUS OF DEVELOPMENT OF THE TEST METHOD .................................................................................. 24 4. SCIENTIFIC BASIS – BIOLOGICAL AND/OR MECHANISTIC RELEVANCE OF THE DPRA........................... 25 5. PROTOCOL OF THE TEST METHOD ........................................................................................................... 25 CONCLUSION OF THE VALIDATION MANAGEMENT TEAM ON MODULE 1 ............................................................ 31
TRANSFERABILITY (MODULE 3) .................................................................................................................. 33 1. GENERAL ASPECTS ................................................................................................................................... 33 2. TRAINING.................................................................................................................................................. 33 3. TRANSFER OF THE TEST METHOD TO THE NAÏVE LABORATORIES.......................................................... 35 4. QUALIFICATION RUNS FOR A SUCCESSFUL COMPLETION OF THE TRANSFER PHASE ............................. 37 CONCLUSION OF THE VALIDATION MANAGEMENT TEAM ON MODULE 3 ............................................................ 39
WITHIN-LABORATORY REPRODUCIBILITY (MODULE 2) .................................................................... 41 1. P&G.......................................................................................................................................................... 41
a. Reproducibility (concordance in predictions).................................................................................... 41 b. Reproducibility of depletion values for cysteine and lysine................................................................ 42 c. Reproducibility of the controls values................................................................................................. 44
2. RICERCA ................................................................................................................................................ 46 a. Reproducibility (concordance in predictions).................................................................................... 46 b. Reproducibility of depletion values for cysteine and lysine................................................................ 47 c. Reproducibility of controls values....................................................................................................... 48
3. IVMU ....................................................................................................................................................... 50 a. Reproducibility of the controls values................................................................................................. 50 b. Reproducibility (concordance in predictions).................................................................................... 52 c. Reproducibility of depletion values for cysteine and lysine................................................................ 53
CONCLUSION OF THE VALIDATION MANAGEMENT TEAM ON MODULE 2 ............................................................ 54 BETWEEN LABORATORY REPRODUCIBILITY (MODULE 4)................................................................ 55
1. REPRODUCIBILITY (CONCORDANCE IN PREDICTIONS) ........................................................................... 57 2. REPRODUCIBILITY OF DEPLETION VALUES FOR CYSTEINE AND LYSINE (FOR THE 24 CHEMICALS) ......... 60 CONCLUSION OF THE VALIDATION MANAGEMENT TEAM ON MODULE 4 ............................................................ 64
PREDICTIVE CAPACITY (MODULE 5) ......................................................................................................... 65 CONCLUSION OF THE VALIDATION MANAGEMENT TEAM ON MODULE 5 ............................................................ 67
Direct Peptide Reactivity Assay (DPRA) ECVAM Validation Study Report Page 3 of 74
VMG OVERALL CONCLUSIONS AND RECOMMENDATIONS ............................................................... 69 OVERALL CONCLUSIONS ................................................................................................................................... 69 RECOMMENDATIONS ......................................................................................................................................... 71
LIST OF APPENDICES....................................................................................................................................... 72
LIST OF REFERENCES...................................................................................................................................... 73
Direct Peptide Reactivity Assay (DPRA) ECVAM Validation Study Report Page 4 of 74
Summary The evaluation of the skin sensitisation potential represents an important component of the safety assessment of new and existing substances. Traditionally this is achieved with animal tests such as the Local Lymph Node Assay (LLNA) and the guinea pig tests (Buehler Test and Guinea Pig Maximisation Test). To date, there is a pressing need for having alternative non-animal methods available to reduce and eliminate the need for animals for this endpoint as advocated by some European regulations aiming at the protection of human health and the environment (i.e. Cosmetics Regulation and REACH). Several mechanistically-based non-animal test methods for the assessment of skin sensitisation are currently under development/evaluation. The validation of the Direct Peptide Reactivity Assay (DPRA) was part of a study coordinated by ECVAM in which two other methods (the human Cell Line Activation Test (h-CLAT) and the Myeloid U937 Skin Sensitisation Test (MUSST)) are still in the evaluation process. The study was designed to allow sound conclusions to be drawn on the transferability and reproducibility (within- and between-laboratories) of the DPRA in view of its future use as part of a non-animal testing strategy for skin sensitisation hazard assessment. Having reviewed the information generated in the study, the Validation Management Group (VMG) concluded that this appropriately completes the information requirement for modules 1-4 (test definition, within laboratory reproducibility, transferability, between laboratory reproducibility) and contributes to module 5 (predictive capacity) and module 6 (applicability domain) of the ECVAM modular approach to validation. In addition, the VMG concluded that the information generated in the study shows that the DPRA is a robust and reliable test method. Therefore the VMG supports the use of the DPRA in a weight-of-evidence approach to support regulatory decision making and the acceptance of positive DPRA results in the context of specific regulations (e.g. REACH in the EU). The VMG also considers the DPRA deserves further evaluation as part of an integrated testing strategy for the full replacement of the in vivo assays for skin sensitisation hazard identification and for the role it might play in the determination of skin sensitisation potency.
Direct Peptide Reactivity Assay (DPRA) ECVAM Validation Study Report Page 5 of 74
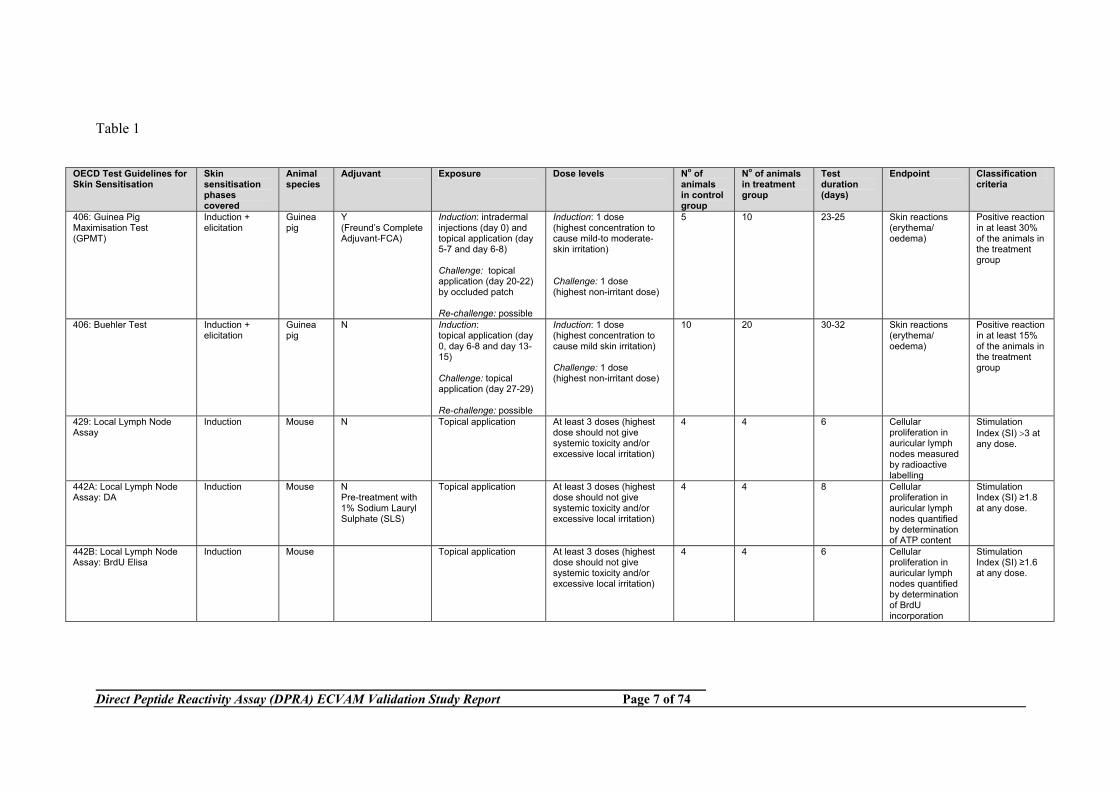
Background Skin sensitisation is the toxicological endpoint associated with substances that have the intrinsic ability to cause skin allergy, termed allergic contact dermatitis (ACD) in humans, and represents the most common manifestation of immunotoxicity. The identification of the skin sensitisation potential represents an important component of the safety assessment of new and existing substances including cosmetic ingredients. Current regulatory predictive tests for skin sensitisation rely on the use of animals. These include the traditional guinea pig tests (Buehler Test and Guinea-pig Maximisation Test (OECD TG 406, TG B06 EU Regulation 440-2008), and the Local Lymph Node Assay (LLNA, OECD TG 429, TG B42 EU Regulation 440-2008) including non-radio-isotopic variants (OECD TG 422A and OECD TG 422B). Summary details of the animal tests currently in use are provided in Table 1. The LLNA is considered a reduction/refinement method with respect to the traditional guinea-pig tests and of greater value in generating skin sensitisation potency information which is required for full risk assessment to establish safe levels of human exposure. With the entry into force of the 7th Amendment to the Cosmetics Directive and the new European chemicals regulation REACH (Registration, Evaluation, Authorisation and Restriction of Chemicals) there is a greater need for having alternative non-animal methods available for this endpoint. Skin sensitisation is a delayed-type hypersensitivity reaction induced by low molecular weight reactive chemicals. It develops in two distinct phases; the induction phase which sensitises the immune system for an allergic response and the elicitation phase which occurs following a subsequent contact with the allergen and which leads to the clinical signs and symptoms of allergic contact dermatitis (ACD) in humans or contact hypersensitivity (CHS) in the rodent models. The key underlying biological mechanisms of the induction of skin sensitisation are relatively well understood although not fully characterised. These include: 1) the ability of the chemical to penetrate the skin and reach the site of haptenation (skin bioavailability), 2) the covalent binding of the chemical sensitiser to the skin protein (haptenation), 3) the release of pro-inflammatory signals by epidermal keratinocytes (skin inflammation) 4) the activation and maturation of Dendritic cells (DC) the skin immunocompetent cells, 5) the migration of DC from skin to the regional lymph nodes, 6) the expansion of memory T cells (lymphocytes capable of being stimulated and activated specifically by the haptenised chemical). Progress has been made in recent years in the development of mechanistically-based alternative methods for hazard identification some of which might also be able to contribute to potency characterisation. However none of mechanistically-based non-animal tests currently under development/evaluation is considered to have the potential to function as a stand-alone method to fully replace the currently used animal tests. Instead it is proposed that a combination of such tests, addressing the key biological mechanisms of skin sensitisation, will be needed to achieve this goal. A comprehensive overview of the currently available methods targeting the key mechanisms described above was published in 2011 (Adler et al., 2010). In the first quarter of 2009 three partial replacement methods for skin sensitisation testing were formally submitted to ECVAM for evaluation. These methods, namely the Direct Peptide Reactivity Assay (DPRA), the human Cell Line Activation Test (h-CLAT) and the Myeloid U937 Skin Sensitisation Test (MUSST) were developed by the European Cosmetics Association (Colipa) associated industries and optimised within Colipa ring trials. These three test methods are proposed as candidates for regulatory use as part of an integrated alternative
Direct Peptide Reactivity Assay (DPRA) ECVAM Validation Study Report Page 6 of 74
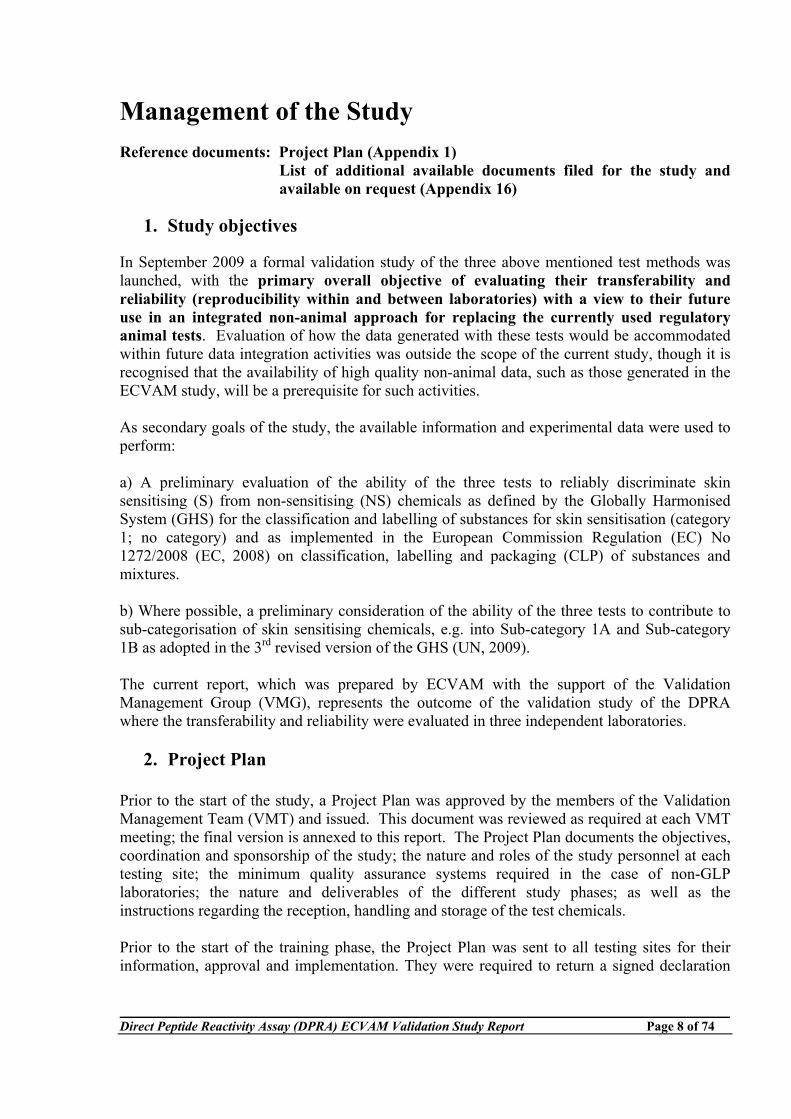
approach for replacing the current regulatory in vivo tests. How the information generated with these test methods could potentially be integrated to achieve this goal still has to be determined. Following the evaluation of the information provided on these test methods and after review of the submitted protocols (i.e. SOPs) ECVAM concluded that they were sufficiently developed and standardised to be included in the ECVAM validation process.
Direct Peptide Reactivity Assay (DPRA) ECVAM Validation Study Report Page 7 of 74
Table 1
OECD Test Guidelines for Skin Sensitisation
Skin sensitisation phases covered
Animal species
Adjuvant Exposure Dose levels No of animals in control group
No of animals in treatment group
Test duration (days)
Endpoint Classification criteria
406: Guinea Pig Maximisation Test (GPMT)
Induction + elicitation
Guinea pig
Y (Freund’s Complete Adjuvant-FCA)
Induction: intradermal injections (day 0) and topical application (day 5-7 and day 6-8) Challenge: topical application (day 20-22) by occluded patch Re-challenge: possible
Induction: 1 dose (highest concentration to cause mild-to moderate-skin irritation) Challenge: 1 dose (highest non-irritant dose)
5 10 23-25 Skin reactions (erythema/ oedema)
Positive reaction in at least 30% of the animals in the treatment group
406: Buehler Test Induction + elicitation
Guinea pig
N Induction: topical application (day 0, day 6-8 and day 13-15) Challenge: topical application (day 27-29) Re-challenge: possible
Induction: 1 dose (highest concentration to cause mild skin irritation) Challenge: 1 dose (highest non-irritant dose)
10 20 30-32 Skin reactions (erythema/ oedema)
Positive reaction in at least 15% of the animals in the treatment group
429: Local Lymph Node Assay
Induction Mouse N Topical application At least 3 doses (highest dose should not give systemic toxicity and/or excessive local irritation)
4 4 6 Cellular proliferation in auricular lymph nodes measured by radioactive labelling
Stimulation Index (SI) >3 at any dose.
442A: Local Lymph Node Assay: DA
Induction Mouse N Pre-treatment with 1% Sodium Lauryl Sulphate (SLS)
Topical application At least 3 doses (highest dose should not give systemic toxicity and/or excessive local irritation)
4 4 8 Cellular proliferation in auricular lymph nodes quantified by determination of ATP content
Stimulation Index (SI) ≥1.8 at any dose.
442B: Local Lymph Node Assay: BrdU Elisa
Induction Mouse Topical application At least 3 doses (highest dose should not give systemic toxicity and/or excessive local irritation)
4 4 6 Cellular proliferation in auricular lymph nodes quantified by determination of BrdU incorporation
Stimulation Index (SI) ≥1.6 at any dose.
Direct Peptide Reactivity Assay (DPRA) ECVAM Validation Study Report Page 8 of 74
Management of the Study Reference documents: Project Plan (Appendix 1) List of additional available documents filed for the study and available on request (Appendix 16)
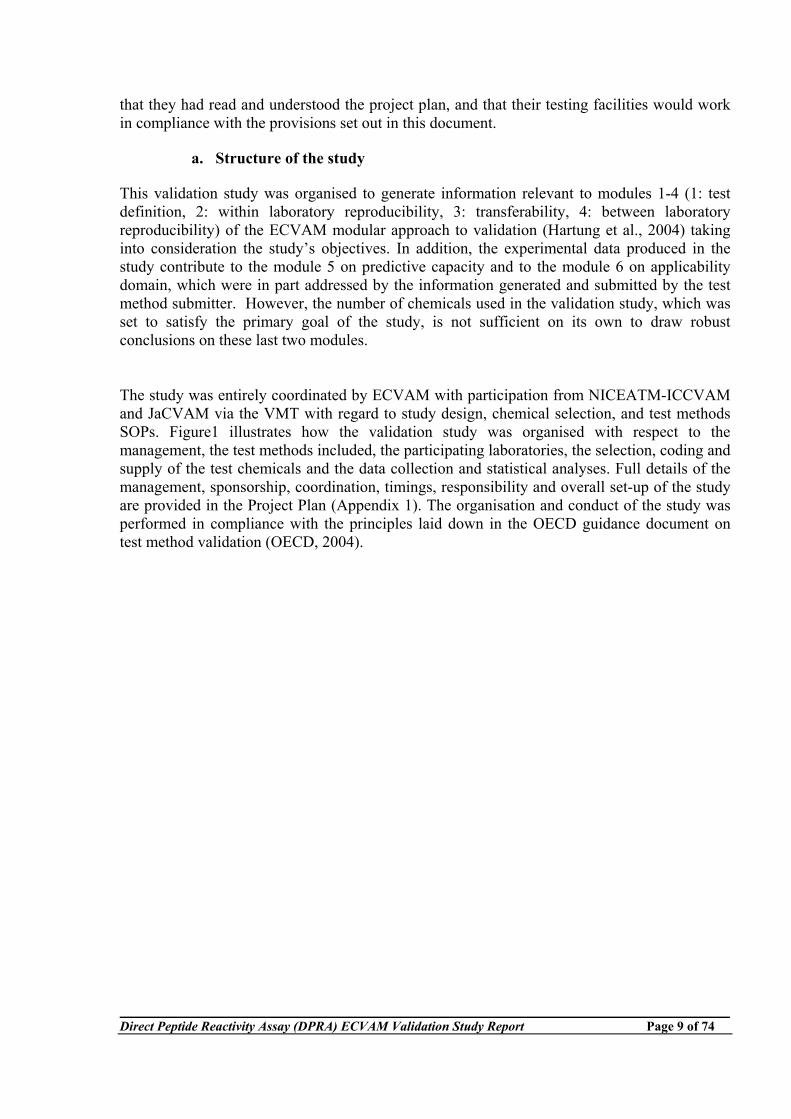
1. Study objectives In September 2009 a formal validation study of the three above mentioned test methods was launched, with the primary overall objective of evaluating their transferability and reliability (reproducibility within and between laboratories) with a view to their future use in an integrated non-animal approach for replacing the currently used regulatory animal tests. Evaluation of how the data generated with these tests would be accommodated within future data integration activities was outside the scope of the current study, though it is recognised that the availability of high quality non-animal data, such as those generated in the ECVAM study, will be a prerequisite for such activities. As secondary goals of the study, the available information and experimental data were used to perform: a) A preliminary evaluation of the ability of the three tests to reliably discriminate skin sensitising (S) from non-sensitising (NS) chemicals as defined by the Globally Harmonised System (GHS) for the classification and labelling of substances for skin sensitisation (category 1; no category) and as implemented in the European Commission Regulation (EC) No 1272/2008 (EC, 2008) on classification, labelling and packaging (CLP) of substances and mixtures. b) Where possible, a preliminary consideration of the ability of the three tests to contribute to sub-categorisation of skin sensitising chemicals, e.g. into Sub-category 1A and Sub-category 1B as adopted in the 3rd revised version of the GHS (UN, 2009). The current report, which was prepared by ECVAM with the support of the Validation Management Group (VMG), represents the outcome of the validation study of the DPRA where the transferability and reliability were evaluated in three independent laboratories.
2. Project Plan Prior to the start of the study, a Project Plan was approved by the members of the Validation Management Team (VMT) and issued. This document was reviewed as required at each VMT meeting; the final version is annexed to this report. The Project Plan documents the objectives, coordination and sponsorship of the study; the nature and roles of the study personnel at each testing site; the minimum quality assurance systems required in the case of non-GLP laboratories; the nature and deliverables of the different study phases; as well as the instructions regarding the reception, handling and storage of the test chemicals. Prior to the start of the training phase, the Project Plan was sent to all testing sites for their information, approval and implementation. They were required to return a signed declaration
Direct Peptide Reactivity Assay (DPRA) ECVAM Validation Study Report Page 9 of 74
that they had read and understood the project plan, and that their testing facilities would work in compliance with the provisions set out in this document.
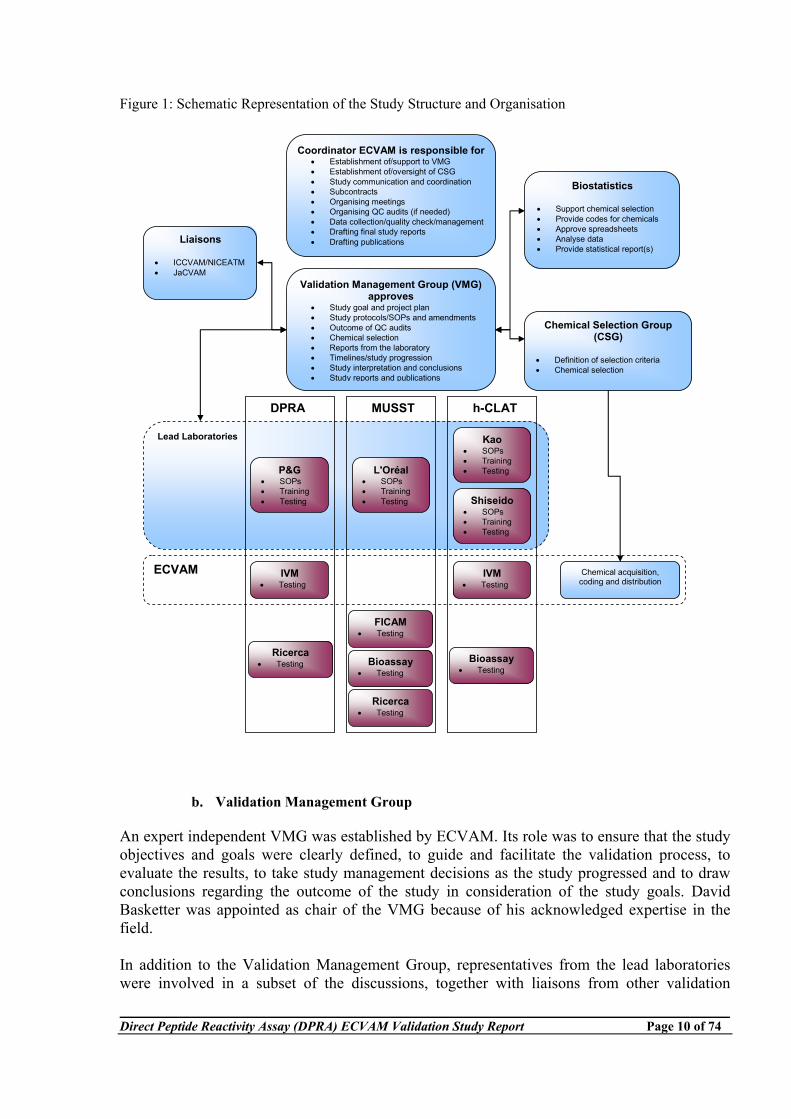
a. Structure of the study This validation study was organised to generate information relevant to modules 1-4 (1: test definition, 2: within laboratory reproducibility, 3: transferability, 4: between laboratory reproducibility) of the ECVAM modular approach to validation (Hartung et al., 2004) taking into consideration the study’s objectives. In addition, the experimental data produced in the study contribute to the module 5 on predictive capacity and to the module 6 on applicability domain, which were in part addressed by the information generated and submitted by the test method submitter. However, the number of chemicals used in the validation study, which was set to satisfy the primary goal of the study, is not sufficient on its own to draw robust conclusions on these last two modules. The study was entirely coordinated by ECVAM with participation from NICEATM-ICCVAM and JaCVAM via the VMT with regard to study design, chemical selection, and test methods SOPs. Figure1 illustrates how the validation study was organised with respect to the management, the test methods included, the participating laboratories, the selection, coding and supply of the test chemicals and the data collection and statistical analyses. Full details of the management, sponsorship, coordination, timings, responsibility and overall set-up of the study are provided in the Project Plan (Appendix 1). The organisation and conduct of the study was performed in compliance with the principles laid down in the OECD guidance document on test method validation (OECD, 2004).
Direct Peptide Reactivity Assay (DPRA) ECVAM Validation Study Report Page 10 of 74
Figure 1: Schematic Representation of the Study Structure and Organisation
Coordinator ECVAM is responsible for
• Establishment of/support to VMG • Establishment of/oversight of CSG • Study communication and coordination • Subcontracts • Organising meetings • Organising QC audits (if needed) • Data collection/quality check/management • Drafting final study reports • Drafting publications
Validation Management Group (VMG) approves
• Study goal and project plan • Study protocols/SOPs and amendments • Outcome of QC audits • Chemical selection • Reports from the laboratory • Timelines/study progression • Study interpretation and conclusions • Study reports and publications
Liaisons
• ICCVAM/NICEATM • JaCVAM
Biostatistics
• Support chemical selection • Provide codes for chemicals • Approve spreadsheets • Analyse data • Provide statistical report(s)
Chemical Selection Group(CSG)
• Definition of selection criteria • Chemical selection
Lead Laboratories
DPRA MUSST h-CLAT
P&G • SOPs • Training • Testing
L'Oréal• SOPs • Training • Testing
Kao• SOPs • Training • Testing
Shiseido• SOPs • Training • Testing
ECVAM IVM • Testing
FICAM• Testing
IVM• Testing
Ricerca • Testing Bioassay
• Testing
Chemical acquisition, coding and distribution
Bioassay • Testing
Ricerca• Testing
b. Validation Management Group An expert independent VMG was established by ECVAM. Its role was to ensure that the study objectives and goals were clearly defined, to guide and facilitate the validation process, to evaluate the results, to take study management decisions as the study progressed and to draw conclusions regarding the outcome of the study in consideration of the study goals. David Basketter was appointed as chair of the VMG because of his acknowledged expertise in the field. In addition to the Validation Management Group, representatives from the lead laboratories were involved in a subset of the discussions, together with liaisons from other validation
Direct Peptide Reactivity Assay (DPRA) ECVAM Validation Study Report Page 11 of 74
bodies, ICCVAM/NICEATM (USA), and JaCVAM (Japan). This extended group is referred to as the "Validation Management Team" (VMT). The strategic decisions, including the selection and approval of the test chemicals to be used in the study, were taken by the VMG only. The liaisons were involved in all discussions. The lead laboratories representatives were not involved in discussions related to the selection of the chemicals. Validation Management Team Composition: Validation Management Group Chair David Basketter (DABMEB Consultancy Ltd) Co-chair Silvia Casati (ECVAM) Study Coordinator Alexandre Angers (ECVAM) Chair of the Chemical Selection Group Thomas Cole (ECVAM) Statistician André Kleensang (ECVAM, up to September
2010), Anna Compagnoni (ECVAM, up to January 2011), Els Adriaens (Adriaens Consulting, since June 2011)
Industry representative Pierre Aeby (Colipa) External expert Sebastian Hoffmann (seh consulting + services) External expert Jon Richmond (dr.jonrichmond: Advice &
Consultancy) JaCVAM representative Aiba Setsuya (Tohoku University Graduate
School of Medicine) Lead laboratory Representatives Procter & Gamble (DPRA) Frank G. Gerberick L’Oréal (MUSST) Jean-Marc Ovigne (up to June 2011),
Nathalie Alépée (since October 2010) Shiseido (h-CLAT) Takao Ashikaga Kao Corporation (h-CLAT) Hitoshi Sakaguchi Liaisons JaCVAM Hajime Kojima; alternate Yasuo Ohno NICEATM William S. Stokes; alternate Eleni Salicru (up to
May 2011); alternate Judy Strickland (since June 2011)
ICCVAM Joanna M. Matheson; alternate Abigail Jacobs
c. Laboratories Three laboratories participated in the validation of the DPRA and they are listed below. Procter& Gamble (P&G), in which the test method was developed and which has the most experience in performing it, acted as lead laboratory.
Direct Peptide Reactivity Assay (DPRA) ECVAM Validation Study Report Page 12 of 74
Laboratory 2 was involved in the study as a naïve laboratory which had experience with HPLC techniques but was never involved with peptide reactivity assays. Laboratory 3 was selected through an open call for tender published by the Institute for Health and Consumer Protection of the JRC. The criteria for selection were primarily based on the technical merit of the tender which included demonstrated awareness of the work involved. The signatory of the tender from Laboratory 3, an international Contract Research Organisation, indicated that the laboratory is systematically searching the literature for new in vitro technologies/methods for inclusion in its portfolio and had already performed some peptide reactivity work on the basis of information published in the literature. Therefore, although this laboratory was not involved directly in the development or performance of the specific DPRA SOP, this laboratory was not considered entirely naïve with respect to peptide reactivity assays. Laboratory 1 (Study Director: Leslie Foertsch) Procter & Gamble Company Miami Valley Innovation Center Cincinnati, USA Laboratory 2 (Study Director: Siegfried Morath) In-House Validation and Training Laboratory In-Vitro Methods Unit/ECVAM Institute for Health and Consumer Protection Joint Research Centre European Commission Ispra, Italy Laboratory 3 (Study Director: Fabien Marguerite) Ricerca Biosciences SAS Saint Germain sur l'Arbresle, France Note: At the initiation of the study, Ricerca Biosciences was called "MDS Pharma".
d. Quality Systems of the Participating Laboratories Only Laboratory 3 was fully Good Laboratory Practice (GLP) accredited and subject to inspections by relevant agencies at the time of the blind testing phase. The laboratory declared that the blind testing phase (study phases B Stage 1 and Stage 2) had been conducted fully in compliance with the OECD Principles of Good Laboratory Practice and with the Principles of Good Laboratory Practice as described in the French Official Journal, and that the final reports had been audited internally. Laboratory 2 was in the formal process of requesting GLP accreditation during the conduct of the study. However, as Laboratory 2 had not yet been audited or approved by a national authority, it cannot be deemed to have been GLP accredited or compliant at the time the study was performed. Laboratory 1 was not GLP accredited.
Direct Peptide Reactivity Assay (DPRA) ECVAM Validation Study Report Page 13 of 74
For the laboratories participating in the pre-validation study which do not have formally implemented GLP, the VMG defined and requested the application of a set of quality assurance requirements considered essential for the acceptance of information and data produced in the validation process. These requirements formed part of the Project Plan which was sent to, and accepted by, all participating laboratories prior to the initiation of the study. These minimum requirements were: • Qualified personnel, and appropriate facilities, equipment and materials shall be provided. • Records of the qualifications, training and experience, and a job description for each professional and technical individual, shall be maintained.
• For each study, an individual with appropriate qualifications, training and experience shall be appointed to be responsible for its overall conduct and for any report issued.
• Instruments used for the generation of experimental data shall be inspected regularly, cleaned, maintained and calibrated according to established SOPs, if available, or to manufacturers' instructions. Records of these processes shall be kept, and made available for inspection on request.
• Reagents shall be labelled, as appropriate, to indicate their source, identity, concentration and stability. The labelling shall include the preparation and expiry dates, and specific storage conditions.
• All data generated during a study shall be recorded directly, promptly and legibly by the
individual(s) responsible. These entries shall be attributable and dated. •All changes to data shall be identified with the date and the identity of the individual responsible, and a reason for the change shall be documented and explained at the time.
3. Study Experimental Design and sample size Reference document: Experimental design (Appendix 2) The number and nature of the chemicals involved in the training and transfer phases were at the discretion of the lead laboratories For the blind testing phase, the ECVAM biostatisticians calculated the number of chemicals that would be required to properly evaluate the performance of the tests in light of the primary study goal, i.e. to perform a statistically sound evaluation of the Within Laboratory Reproducibility (WLR) and of the Between Laboratory Reproducibility (BLR). Preliminary parameters for the statistical analysis and evaluation of the WLR and the BLR were defined at the beginning of the process taking into consideration the expected proportion of concordant classifications derived from the data reported in the test submissions to ECVAM (see Appendix 2 for full details). From these parameters, the number of chemicals required was
Direct Peptide Reactivity Assay (DPRA) ECVAM Validation Study Report Page 14 of 74
calculated to be at least 21 chemicals for the evaluation of the BLR and at least 13 chemicals for the evaluation of the WLR. To ensure coverage of the range of sensitisation potencies, and since it was expected that weak and moderate sensitisers would be more informative for the evaluation of the reproducibility of the test methods under consideration; the ratio of sensitisers to non-sensitisers was set to 2:1. On the basis of the above considerations, the following design was approved by the VMG:
• For evaluation of the BLR, 24 chemicals tested once in every laboratory (16 sensitisers and 8 non-sensitisers).
• For evaluation of the WLR, a subset of 15 chemicals from those used for the evaluation of the BLR, tested two additional times in each laboratory, the same subset being tested at every site (10 sensitisers and 5 non-sensitisers).
It was deemed that this experimental design would provide the information needed to perform a sufficiently robust assessment of the WLR and BLR of both the prediction results and the raw data for the three test methods evaluated. Study Phases: The study was structured and conducted in two sequential phases: Phase A: training of the participating laboratories (phase A1), test method transfer to the trained laboratories and verification of the Test Method Protocols (phase A2).
Phase B: assessment of the protocol performance by testing chemicals, under blind conditions, in all the laboratories. Since 15 of the 24 chemicals selected would be tested three times in each laboratory (to evaluate the WLR, see above), and 9 would be tested only once, it was decided to separate the Phase B into two phases: first, Phase B Stage I with the 9 chemicals being tested once at each site, and Phase B Stage II for the remaining 15 chemicals tested three times at each site. The laboratories were required to prepare and submit an interim report at the end of the Phase B Stage I, with the results being evaluated by the VMG before allowing the laboratories to proceed to the next phase. This provided for an additional review and control point, following the initiation of the testing phase, in order to verify that no serious issues were arising before the bulk of the testing was performed.
4. Selection of Test Chemicals Reference documents: - Chemical Selection report (Appendix 3) - Selection of the Phase B Stage I chemicals (Appendix 4) The test chemicals for validation study were selected by an independent Chemicals Selection Group (CSG) appointed by ECVAM and chaired by Dr. Thomas Cole (ECVAM). In addition
Direct Peptide Reactivity Assay (DPRA) ECVAM Validation Study Report Page 15 of 74
to the chair, the CSG was composed of Dr. Luca Tosti (ECVAM); Dr. David Basketter (chair of the study) and Dr. Bill Stokes (NICEATM/ICCVAM). The general strategy for the chemical selection was presented and approved by the VMG at its 1st meeting. The final list of chemicals was presented and endorsed by the VMG at its 4th meeting, before the initiation of the blind testing phase. To facilitate the chemical selection process and in view of the use of the experimental data generated in this study to support future activities on data integrations to achieve ultimately full replacement, it was deemed important to use a common set of test chemicals for the three test methods under evaluation. Two recognised databases provided a convenient master source of authoritative data for selection of eligible substances:
1) The ICCVAM database of 103 chemicals, subsequently supplemented with unpublished additions, provided by NICEATM.
2) The LLNA database of 341 chemicals, extracted by the CSG from published compilations (Gerberick et al., 2005; Kern et al., 2010).
A primary eligibility criterion for the chemical selection was the availability of robust in vivo data to allow a proper comparative evaluation of the in vitro results. In particular, availability of both LLNA and GPMT in vivo data, with concordance of their corresponding skin sensitisation classification as an assurance of quality, formed the basis for short-listing candidate chemicals. Availability of accepted human data was adopted as a secondary criterion, in cases of insufficient eligibile chemicals under the primary criterion.
During their respective development and optimisation, the three in vitro methods had been used to evaluate certain chemicals listed in these databases, as described in the original submissions of the methods to ECVAM. Acknowledging this, the chemical selection for this study was designed to include: - A small quota of "tested" substances (i.e. substances reported as being previously tested by the method in the original submission to ECVAM) - A majority of "untested" substances (i.e. substances not being reported as previously tested in the original submission to ECVAM) The ratio of tested to untested chemicals was set in advance at around 1:2 by the VMG. The final selection was composed of 9 tested chemicals and 15 untested chemicals for the DPRA. To ensure parity between the three in vitro methods involved in the validation study, the only "tested" chemicals that were considered were those already tested by all three methods and that have been correctly predicted by each method with respect to the in vivo classifications. The only exception to this criterion was the inclusion in the final list of 2-Mercaptobenzothiazole, a chemical previously tested in the DPRA and in the h-CLAT but not in the MUSST.
Direct Peptide Reactivity Assay (DPRA) ECVAM Validation Study Report Page 16 of 74
Inclusion in the final list of a proportion of chemicals already successfully tested provided an opportunity to confirm the reproducibility of the test method with these chemicals when tested under blind conditions and by other laboratories.
Applying the primary criterion (available and concordant LLNA and GPMT data), the source database yielded 11 eligible chemicals reported as previously tested in all three methods, all of which correctly classified by the three methods. Applying the primary criterion on the 215 untested chemicals found in the original lists resulted in another 24 eligible substances. Therefore, in collaboration with NICEATM, 8 additional untested chemicals were identified from an unpublished updated version of the ICCVAM database, increasing the total number of candidates to 43, an adequate and practical shortlist.
This list of 43 substances was further reduced to 24 for different pragmatic reasons (see Appendix 3) and by expert judgment by the CSG. The final selected chemicals covered the range of sensitisation potency (i.e.: extreme, strong, moderate, weak). Inclusion of a small subset of substances known to be misclassified or classified inconsistently by the in vivo tests made provision for evaluating whether these limitations were shared by the in vitro tests. Furthermore, the chemical selection aimed for a balance of physical states(solid versus liquid) and avoided association of structural analogues, unless contrasting skin sensitisation potential was evident (e.g. 1-Thioglycerol (S) and Glycerol (NS)).
The list of 43 chemicals, and its refinement to the final selection of 24 chemicals (together with detailed comments about these choices) can be found in Appendix 3.
The final selection included 9 LLNA performance standards (PS) reference chemicals (OECD, 2010a). In particular, nickel chloride and xylene (both with ambiguous or inconsistent in vivo classification from LLNA and GPMT, but known human response) were considered eligible under the secondary selection criterion. Nickel chloride (human positive, GPMT positive, LLNA negative) is accepted as a PS true positive reference chemical (i.e., LLNA false negative). Xylene (human negative, LLNA positive) is accepted as a PS true negative reference chemical (i.e., LLNA false positive). In addition, Kathon CG, a commercial aqueous mixture including 1.2% CMI (5-chloro-2-methyl-4-isothiazolin-3-one) was selected, making exception to a general preference for pure substances with discrete chemical composition. CMI is a LLNA PS reference chemical of extreme potency, and the commercial preparation is a recognised source.
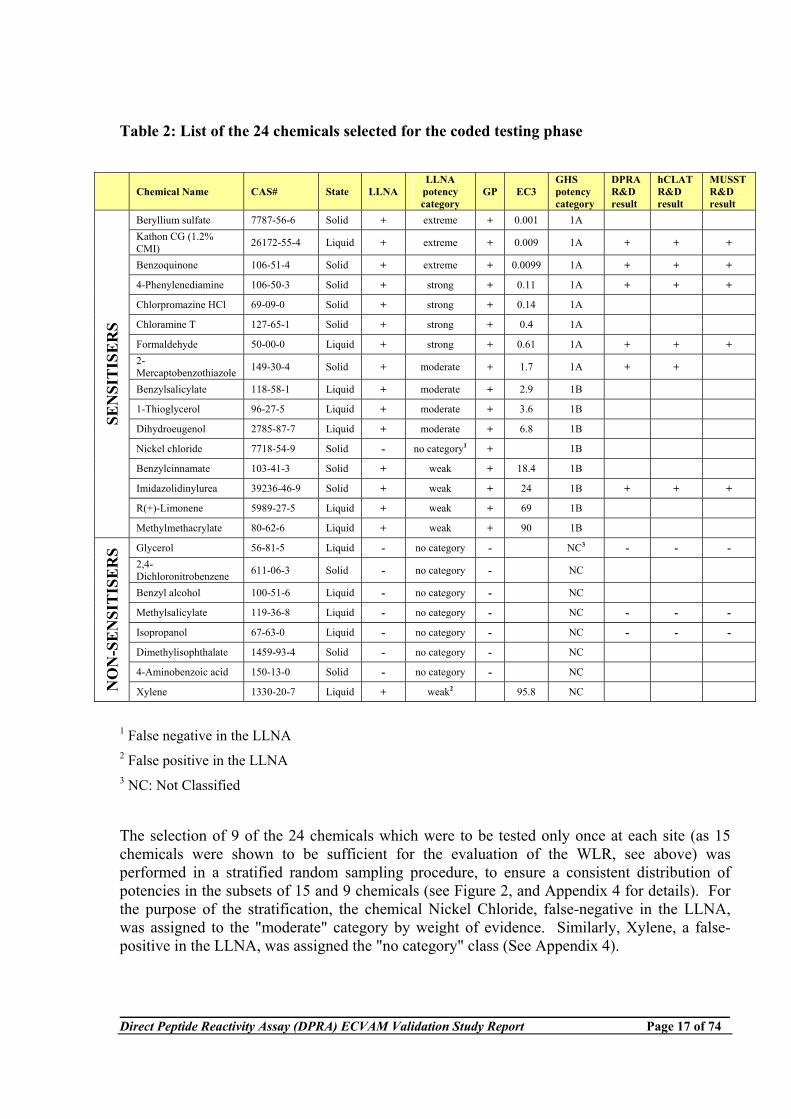
Table 2 lists the final set of chemicals selected for the study.
Direct Peptide Reactivity Assay (DPRA) ECVAM Validation Study Report Page 17 of 74
Table 2: List of the 24 chemicals selected for the coded testing phase
Chemical Name CAS# State LLNA
LLNA potency category
GP EC3 GHS potency category
DPRA R&D result
hCLAT R&D result
MUSST R&D result
Beryllium sulfate 7787-56-6 Solid + extreme + 0.001 1A Kathon CG (1.2% CMI) 26172-55-4 Liquid + extreme + 0.009 1A + + +
Benzoquinone 106-51-4 Solid + extreme + 0.0099 1A + + +
4-Phenylenediamine 106-50-3 Solid + strong + 0.11 1A + + +
Chlorpromazine HCl 69-09-0 Solid + strong + 0.14 1A
Chloramine T 127-65-1 Solid + strong + 0.4 1A Formaldehyde 50-00-0 Liquid + strong + 0.61 1A + + + 2-Mercaptobenzothiazole 149-30-4 Solid + moderate + 1.7 1A + +
Benzylsalicylate 118-58-1 Liquid + moderate + 2.9 1B 1-Thioglycerol 96-27-5 Liquid + moderate + 3.6 1B Dihydroeugenol 2785-87-7 Liquid + moderate + 6.8 1B Nickel chloride 7718-54-9 Solid - no category1 + 1B Benzylcinnamate 103-41-3 Solid + weak + 18.4 1B Imidazolidinylurea 39236-46-9 Solid + weak + 24 1B + + +
R(+)-Limonene 5989-27-5 Liquid + weak + 69 1B
SEN
SIT
ISE
RS
Methylmethacrylate 80-62-6 Liquid + weak + 90 1B Glycerol 56-81-5 Liquid - no category - NC3 - - - 2,4-Dichloronitrobenzene 611-06-3 Solid - no category - NC Benzyl alcohol 100-51-6 Liquid - no category - NC Methylsalicylate 119-36-8 Liquid - no category - NC - - -
Isopropanol 67-63-0 Liquid - no category - NC - - -
Dimethylisophthalate 1459-93-4 Solid - no category - NC 4-Aminobenzoic acid 150-13-0 Solid - no category - NC
NO
N-S
EN
SIT
ISE
RS
Xylene 1330-20-7 Liquid + weak2 95.8 NC
1 False negative in the LLNA 2 False positive in the LLNA 3 NC: Not Classified
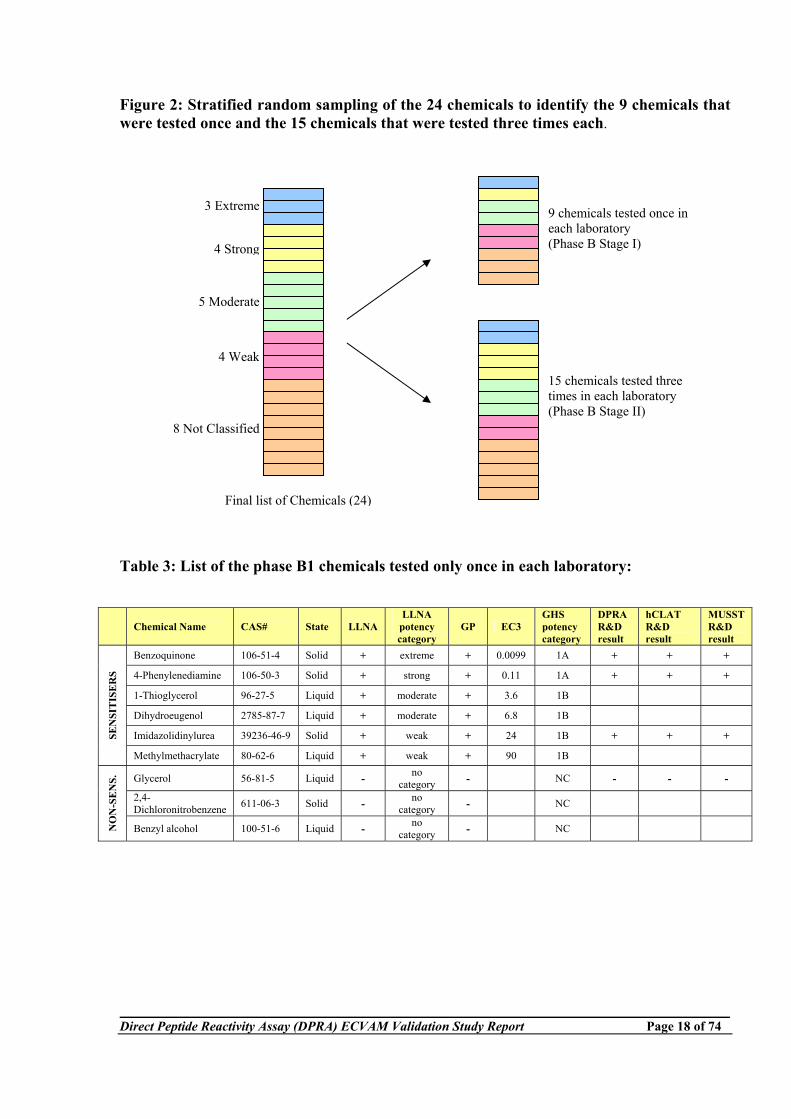
The selection of 9 of the 24 chemicals which were to be tested only once at each site (as 15 chemicals were shown to be sufficient for the evaluation of the WLR, see above) was performed in a stratified random sampling procedure, to ensure a consistent distribution of potencies in the subsets of 15 and 9 chemicals (see Figure 2, and Appendix 4 for details). For the purpose of the stratification, the chemical Nickel Chloride, false-negative in the LLNA, was assigned to the "moderate" category by weight of evidence. Similarly, Xylene, a false-positive in the LLNA, was assigned the "no category" class (See Appendix 4).
Direct Peptide Reactivity Assay (DPRA) ECVAM Validation Study Report Page 18 of 74
Figure 2: Stratified random sampling of the 24 chemicals to identify the 9 chemicals that were tested once and the 15 chemicals that were tested three times each.
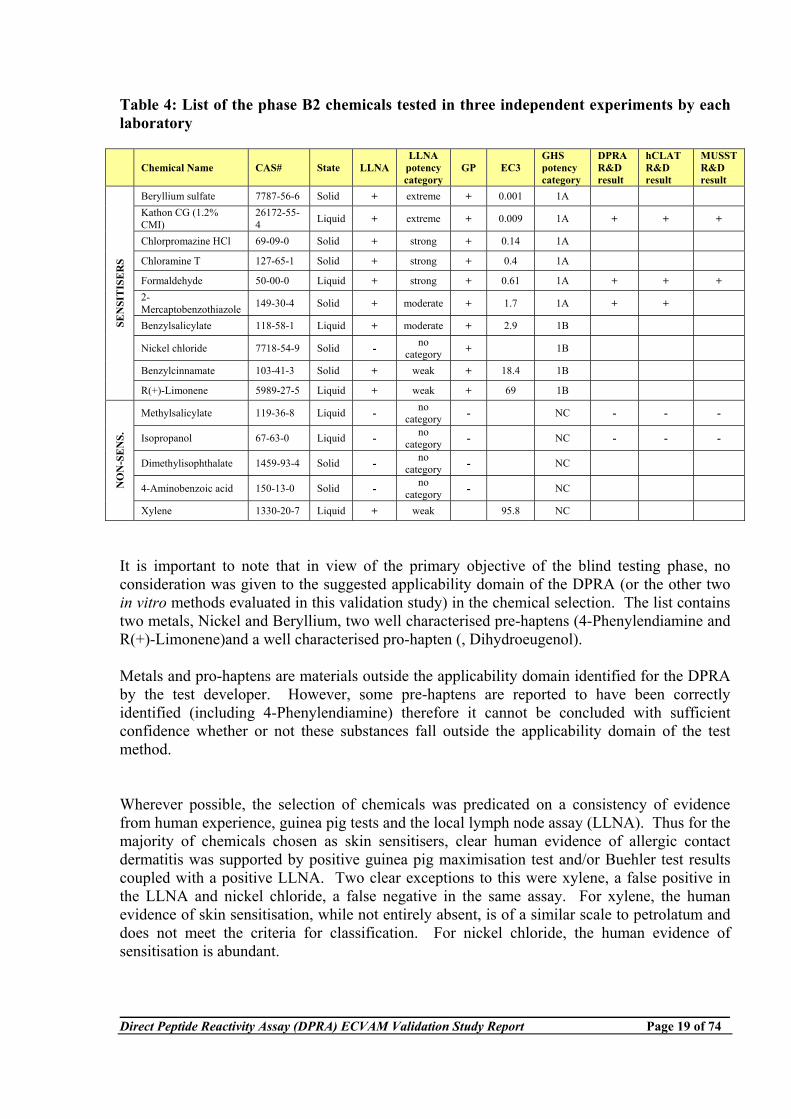
Table 3: List of the phase B1 chemicals tested only once in each laboratory:
Chemical Name CAS# State LLNA
LLNA potency category
GP EC3 GHS potency category
DPRA R&D result
hCLAT R&D result
MUSST R&D result
Benzoquinone 106-51-4 Solid + extreme + 0.0099 1A + + +
4-Phenylenediamine 106-50-3 Solid + strong + 0.11 1A + + +
1-Thioglycerol 96-27-5 Liquid + moderate + 3.6 1B Dihydroeugenol 2785-87-7 Liquid + moderate + 6.8 1B Imidazolidinylurea 39236-46-9 Solid + weak + 24 1B + + + SE
NSI
TIS
ER
S
Methylmethacrylate 80-62-6 Liquid + weak + 90 1B
Glycerol 56-81-5 Liquid - no category - NC - - -
2,4-Dichloronitrobenzene 611-06-3 Solid - no
category - NC
NO
N-S
EN
S.
Benzyl alcohol 100-51-6 Liquid - no category - NC
3 Extreme
4 Strong
5 Moderate
4 Weak
8 Not Classified
Final list of Chemicals (24)
9 chemicals tested once in each laboratory (Phase B Stage I)
15 chemicals tested three times in each laboratory (Phase B Stage II)
Direct Peptide Reactivity Assay (DPRA) ECVAM Validation Study Report Page 19 of 74
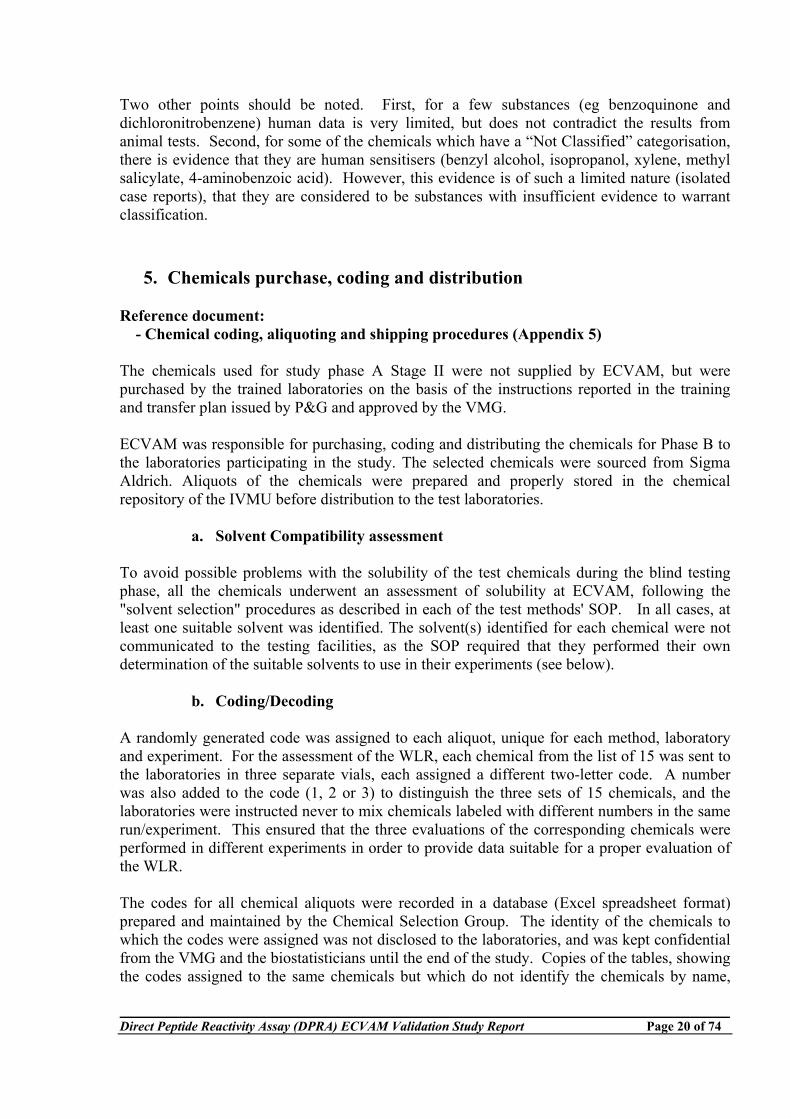
Table 4: List of the phase B2 chemicals tested in three independent experiments by each laboratory
Chemical Name CAS# State LLNA
LLNA potency category
GP EC3 GHS potency category
DPRA R&D result
hCLAT R&D result
MUSST R&D result
Beryllium sulfate 7787-56-6 Solid + extreme + 0.001 1A Kathon CG (1.2% CMI)
26172-55-4 Liquid + extreme + 0.009 1A + + +
Chlorpromazine HCl 69-09-0 Solid + strong + 0.14 1A
Chloramine T 127-65-1 Solid + strong + 0.4 1A Formaldehyde 50-00-0 Liquid + strong + 0.61 1A + + + 2-Mercaptobenzothiazole 149-30-4 Solid + moderate + 1.7 1A + +
Benzylsalicylate 118-58-1 Liquid + moderate + 2.9 1B
Nickel chloride 7718-54-9 Solid - no category + 1B
Benzylcinnamate 103-41-3 Solid + weak + 18.4 1B
SEN
SIT
ISE
RS
R(+)-Limonene 5989-27-5 Liquid + weak + 69 1B
Methylsalicylate 119-36-8 Liquid - no category - NC - - -
Isopropanol 67-63-0 Liquid - no category - NC - - -
Dimethylisophthalate 1459-93-4 Solid - no category - NC
4-Aminobenzoic acid 150-13-0 Solid - no category - NC
NO
N-S
EN
S.
Xylene 1330-20-7 Liquid + weak 95.8 NC It is important to note that in view of the primary objective of the blind testing phase, no consideration was given to the suggested applicability domain of the DPRA (or the other two in vitro methods evaluated in this validation study) in the chemical selection. The list contains two metals, Nickel and Beryllium, two well characterised pre-haptens (4-Phenylendiamine and R(+)-Limonene)and a well characterised pro-hapten (, Dihydroeugenol). Metals and pro-haptens are materials outside the applicability domain identified for the DPRA by the test developer. However, some pre-haptens are reported to have been correctly identified (including 4-Phenylendiamine) therefore it cannot be concluded with sufficient confidence whether or not these substances fall outside the applicability domain of the test method. Wherever possible, the selection of chemicals was predicated on a consistency of evidence from human experience, guinea pig tests and the local lymph node assay (LLNA). Thus for the majority of chemicals chosen as skin sensitisers, clear human evidence of allergic contact dermatitis was supported by positive guinea pig maximisation test and/or Buehler test results coupled with a positive LLNA. Two clear exceptions to this were xylene, a false positive in the LLNA and nickel chloride, a false negative in the same assay. For xylene, the human evidence of skin sensitisation, while not entirely absent, is of a similar scale to petrolatum and does not meet the criteria for classification. For nickel chloride, the human evidence of sensitisation is abundant.
Direct Peptide Reactivity Assay (DPRA) ECVAM Validation Study Report Page 20 of 74
Two other points should be noted. First, for a few substances (eg benzoquinone and dichloronitrobenzene) human data is very limited, but does not contradict the results from animal tests. Second, for some of the chemicals which have a “Not Classified” categorisation, there is evidence that they are human sensitisers (benzyl alcohol, isopropanol, xylene, methyl salicylate, 4-aminobenzoic acid). However, this evidence is of such a limited nature (isolated case reports), that they are considered to be substances with insufficient evidence to warrant classification.
5. Chemicals purchase, coding and distribution Reference document: - Chemical coding, aliquoting and shipping procedures (Appendix 5) The chemicals used for study phase A Stage II were not supplied by ECVAM, but were purchased by the trained laboratories on the basis of the instructions reported in the training and transfer plan issued by P&G and approved by the VMG. ECVAM was responsible for purchasing, coding and distributing the chemicals for Phase B to the laboratories participating in the study. The selected chemicals were sourced from Sigma Aldrich. Aliquots of the chemicals were prepared and properly stored in the chemical repository of the IVMU before distribution to the test laboratories.
a. Solvent Compatibility assessment To avoid possible problems with the solubility of the test chemicals during the blind testing phase, all the chemicals underwent an assessment of solubility at ECVAM, following the "solvent selection" procedures as described in each of the test methods' SOP. In all cases, at least one suitable solvent was identified. The solvent(s) identified for each chemical were not communicated to the testing facilities, as the SOP required that they performed their own determination of the suitable solvents to use in their experiments (see below).
b. Coding/Decoding A randomly generated code was assigned to each aliquot, unique for each method, laboratory and experiment. For the assessment of the WLR, each chemical from the list of 15 was sent to the laboratories in three separate vials, each assigned a different two-letter code. A number was also added to the code (1, 2 or 3) to distinguish the three sets of 15 chemicals, and the laboratories were instructed never to mix chemicals labeled with different numbers in the same run/experiment. This ensured that the three evaluations of the corresponding chemicals were performed in different experiments in order to provide data suitable for a proper evaluation of the WLR. The codes for all chemical aliquots were recorded in a database (Excel spreadsheet format) prepared and maintained by the Chemical Selection Group. The identity of the chemicals to which the codes were assigned was not disclosed to the laboratories, and was kept confidential from the VMG and the biostatisticians until the end of the study. Copies of the tables, showing the codes assigned to the same chemicals but which do not identify the chemicals by name,
Direct Peptide Reactivity Assay (DPRA) ECVAM Validation Study Report Page 21 of 74
were prepared to be given to the biostatistician for analysis of the reproducibility, and to the ECVAM study coordinator(s) to assist the VMG consideration of the experimental data. A detailed description of the chemical coding and distribution procedures applied is provided in Appendix 5. The Chemical Selection Group provided the VMG with the final decoding list for the chemicals only once all the experimental data had been generated by the laboratories, quality checked by ECVAM and analysed by the biostatistician for the assessment of the WLR and BLR. The decoding list was then used by the VMG and the biostatistician to analyse and assess the information generated in this study on the predictive capacity of the DPRA.
c. Emergency procedure implemented at the laboratories during the blind testing phase.
An emergency procedure was established to allow the laboratories to obtain the necessary chemical safety information in the event of an accident. Individual sealed envelopes, each containing a Material Safety Data Sheet (MSDS) relating to one specific chemical and labelled with the corresponding code, were sent with the test chemicals to a named recipient at each laboratory not associated with the testing (typically the Safety Officer at each participating laboratories) with the instruction to return the unopened MSDSs to ECVAM upon completion of the testing phase. During the testing of the DPRA, no such incident was reported and none of the envelopes had to be unsealed, and all sealed envelopes were returned to ECVAM upon completion of the validation study. The laboratories were instructed to treat all coded test chemicals as potential sensitisers and to dispose of laboratory waste as toxic waste.
6. Data management Reference documents: - DPRA reporting template (Appendix 6) - DPRA QC template (Appendix 7) Prior to the start of the study a standard reporting template was distributed to the participating laboratories. This template was developed for the study by ECVAM, in collaboration with the lead laboratory, as no standard templates were available at the time of the submission to ECVAM. The template contained formulae tested by the ECVAM biostatistician in a documented exercise to quality assure the template before it was distributed. The laboratories were asked to use the template during the Transfer phase A to communicate their results to the lead laboratory, so that they could familiarise themselves with it and to ensure that the instructions included in the template were clear and understood. All the results from the Phase B were submitted by the laboratories directly and exclusively to ECVAM by e-mail. Since the templates were not sent protected/locked, upon receipt at
Direct Peptide Reactivity Assay (DPRA) ECVAM Validation Study Report Page 22 of 74
ECVAM each completed template underwent a formal Quality Check procedure that was developed in the form of a checklist (See appendix VII). The quality check focused on the acceptance criteria for the run and for each of the chemicals to ensure the results were valid, and the proper choice of solvent controls used for the calculations of the peptide depletions. Once completed, the checklist were scanned as a PDF file and added to the Excel sheet as an object. The template was then added to the official results folder for the study. For the statistical analyses, a summary template was designed by the statistician, and the results were transferred to this template by ECVAM. Preparation of this summary template contained internal checks that ensured that no transcription errors were made in the transfer of the results. As an additional check, the final conclusions/outcomes for each chemical were then compared to the conclusions/outcomes in the reports sent by the laboratories.
7. Statistical Analysis of Experimental Data Reference document: Experimental Design (Appendix 2)
a. Analysis performed on the experimental data A detailed statistical analysis plan was produced and agreed by the VMG before the start of the testing phase (see Appendix 2 for full details). It was determined that only data from the valid experiments would be considered within the statistical analyses, although failed runs and experiments were also documented in order to report their occurrence. The statistical analysis on the test method's reproducibility focused on the concordance of the predictions obtained in terms of the Yes/No predictions and of the specific reactivity classes assigned. Reproducibility was evaluated with respect to both WLR and BLR. Additionally, descriptive and inferential statistical analyses were performed on the raw data obtained, the results of which are provided as additional descriptive information.
b. Criteria for Assessing the Study Outcome The VMG considered it appropriate to define in advance indicative assessment criteria to be used to enable a transparent judgment and decision on the performance of the test methods in consideration of the study primary goal. When defining such indicative criteria the following factors were considered important:
1. the background and specific objectives of the validation study; 2. the standards of performance that can realistically be expected from an in vitro test and
standards of performance which have been considered acceptable in previous validation studies;
3. the proposed used of the in vitro tests (i.e. as a partial replacement method to become part of a toolbox of tests to be used in combination); and
4. the power of the design of the validation study. In consideration of the above the target performance for this study was set at 80% for the Between Laboratory Reproducibility and 85% for the Within Laboratory Reproducibility.
Direct Peptide Reactivity Assay (DPRA) ECVAM Validation Study Report Page 23 of 74
The target performance informed the sample size calculation and is consistent with the reproducibility values, in terms of reproducibility in the concordance of predictions, elaborated from the data submitted by the test developer in which the DPRA showed a between laboratory reproducibility of 91% (see Appendix 2 for further details).
Direct Peptide Reactivity Assay (DPRA) ECVAM Validation Study Report Page 24 of 74
Test definition (Module 1) Reference Documents: - DPRA SOP version 2 (Appendix 8) - DPRA SOP version 3 (Appendix 9) - Gerberick et al (2004) (Appendix 10) - Gerberick et al (2007) (Appendix 11)
1. Intended purpose of the test method The DPRA is partial replacement in chemico test method designed to be part of a non-animal battery or integrated testing strategy for assessing the skin sensitisation potential of chemicals. As such it could contribute to the reduction of the number of animal used for skin sensitisation testing and to the replacement of current regulatory in vivo tests for skin sensitisation hazard classification and labelling (OECD TG 406, OECD TG 429, OECD TG 442A, OECD TG 442B). The information the DPRA generates can in any case already be used in a weight-of-evidence approach to support regulatory decision making (i.e. to better characterise equivocal responses in in vivo studies). For example, REACH already permits the use of methods under validation for this purpose.
2. Evidence demonstrating the need of the test method This test method is of importance due to the forthcoming European Union ban on in vivo testing of cosmetic and toiletry ingredients and products following the publication of the Seventh Amendment to the Cosmetics Directive and for the European Regulation on Registration, Evaluation, and Authorisation of Chemicals (REACH) that requires evaluation of a large number of chemicals. The successful validation of the DPRA along with other assays (e.g., cell-based assay) would allow their use in the assessment of a chemical’s skin sensitisation potential and reduce or eliminate the need for animal testing for skin sensitisation.
3. Status of development of the test method
The DPRA was developed by Procter & Gamble.
The initial work to determine if chemical reactivity toward nucleophilic amino acids correlated with skin sensitisation potential examined the reactivity of 38 different chemicals with varying degrees of sensitisation potency: 11 non sensitisers, 7 weak sensitisers, 11 moderate sensitisers, 5 strong sensitisers, and 4 extreme sensitisers.
82 substances (including the 38 chemicals mentioned above) were then evaluated in the course of development of the Prediction Model (56 chemicals to initially define the Prediction Model, and further 26 to demonstrate its robustness). For all test materials LLNA test data was also available.
Additional work was undertaken pre-submission to ECVAM by P&G to provide insights into the likely within laboratory reproducibility, transferability, and between laboratory reproducibility. This work included two ring trials (involving the testing of 15 and 28
Direct Peptide Reactivity Assay (DPRA) ECVAM Validation Study Report Page 25 of 74
chemicals respectively) with the participation of three external laboratories (Kao Corporation, L’Oréal and Givaudan).
In the test submission to ECVAM (received February 2009) P&G reported data on the test performance with 135 chemicals (98 sensitisers – 33 extreme/strong, 36 moderate, 29 weak – and 37 non-sensitisers) with reported 86% accuracy (calculated for 133 chemicals since two chemicals co-eluted with the cysteine peptide and were not included in the accuracy calculation), and had trained six laboratories in its use.
4. Scientific basis – biological and/or mechanistic relevance of the DPRA There are a variety of properties that determine whether a chemical can function as a skin contact sensitiser (or allergen) including the ability to penetrate into the skin, react with protein, and be recognised as antigenic by immune cells. The correlation of protein reactivity with skin sensitisation potential is well established (Dupuis and Benezra, 1982; Lepoittevin et al, 1998). In fact, Landsteiner and Jacobs (1936) presented the origin of the reactivity hypothesis in their landmark paper looking at the underlying mechanisms of contact allergy. Thus, if a chemical is capable of reacting with proteins either directly or after appropriate biotransformation, then it may have the potential to act as a contact allergen. The majority of known chemical skin allergens (or their metabolites/oxidation products) have electrophilic properties and are able to react with various nucleophiles to form covalent bonds. In proteins, the side chains of many amino acids contain electron-rich groups, nucleophiles, capable of reacting with electrophilic allergens. Lysine and cysteine are well characterised as nucleophiles, but other amino acids containing nucleophilic heteroatoms, such as histidine, methionine, and tyrosine have been reported to react with electrophiles (Dupuis and Benezra, 1982; Lepoittevin et al, 1998; Ahlfors et al, 2003). Since protein reactivity is a key step in the induction of ACD it was hypothesised that in vitro methods based on the detection of protein reactivity could be developed to screen the sensitisation potential of chemicals. Recently, a detailed review on using chemical reactivity measurement for the identification of skin sensitisers was published as part of an ECVAM Workshop (Gerberick et al., 2008).
5. Protocol of the test method The detailed updated DPRA test method protocol used during the testing phase is described in Appendix 8. The DPRA is a chemistry based assay. Nucleophile-containing synthetic peptides are used to screen for skin sensitisation potential by measuring peptide depletion following incubation with test materials (allergens and non-allergens). For the synthetic heptapeptides that contain either cysteine or lysine, the peptide to chemical ratio used is 1:10 and 1:50, respectively. Following a 24 hour reaction period with the two synthetic peptides, the samples are analysed by HPLC using UV detection to monitor the depletion of peptide following the reaction. Average peptide depletion data for cysteine and lysine are then used in a classification tree
Direct Peptide Reactivity Assay (DPRA) ECVAM Validation Study Report Page 26 of 74
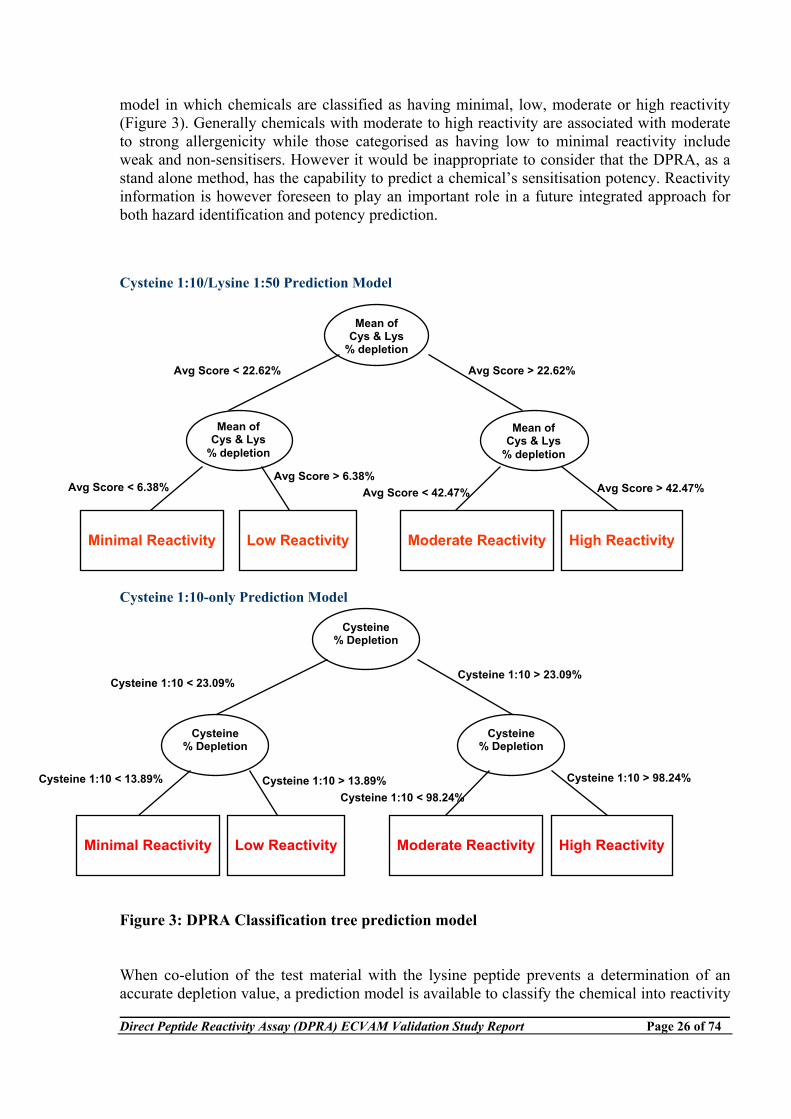
model in which chemicals are classified as having minimal, low, moderate or high reactivity (Figure 3). Generally chemicals with moderate to high reactivity are associated with moderate to strong allergenicity while those categorised as having low to minimal reactivity include weak and non-sensitisers. However it would be inappropriate to consider that the DPRA, as a stand alone method, has the capability to predict a chemical’s sensitisation potency. Reactivity information is however foreseen to play an important role in a future integrated approach for both hazard identification and potency prediction. Cysteine 1:10/Lysine 1:50 Prediction Model
Cysteine 1:10-only Prediction Model
Figure 3: DPRA Classification tree prediction model When co-elution of the test material with the lysine peptide prevents a determination of an accurate depletion value, a prediction model is available to classify the chemical into reactivity
Mean of Cys & Lys
% depletion
Minimal Reactivity
Low Reactivity
Avg Score < 6.38%
Avg Score < 22.62% Avg Score > 22.62%
Moderate Reactivity
High Reactivity
Avg Score < 42.47%Avg Score > 6.38%
Avg Score > 42.47%
Mean of Cys & Lys
% depletion
Mean ofCys & Lys
% depletion
Cysteine% Depletion
Cysteine% Depletion
Minimal Reactivity
Low Reactivity
Cysteine 1:10 < 13.89%
Cysteine 1:10 < 23.09% Cysteine 1:10 > 23.09%
Cysteine% Depletion
Moderate Reactivity
High Reactivity
Cysteine 1:10 < 98.24%Cysteine 1:10 > 13.89% Cysteine 1:10 > 98.24%
Direct Peptide Reactivity Assay (DPRA) ECVAM Validation Study Report Page 27 of 74
classes based on the depletion value for the cysteine peptide alone. A prediction model based on the depletion value of the lysine peptide alone is not available. The test developer reported in the submission to ECVAM that the reason for this is that the lysine reactivity does not carry enough weight to drive a lysine-only prediction model and that the cysteine depletion value is required in order to accurately predict the reactivity classes.. Modifications made to original protocol prior to the initiation of the validation study The DPRA protocol used in the validation study is almost identical to the protocol originally submitted to ECVAM by P&G. Following the assessment made by ECVAM of the original protocol, minor technical revisions were made in collaboration with P&G prior to the initiation of the validation study. No major modifications were made to the experimental procedure itself. The minor changes included clarification of sections of the SOP which were felt not to be sufficiently well described and could thus impact on the interpretation, performance, and outputs of the protocol. However, it was also deemed important to include additional run acceptance criteria which were not set out in the original document. These include:
1. The establishment of acceptance criteria for the positive control cinnamic aldehyde to be used to ensure that the test method is responding with adequate and reproducible sensitivity to this substance, for which the magnitude of response is well characterised. For this purpose the range of percent peptide depletion values of the positive control cinnamic aldhehyde was based on 95% tolerance intervals calculated from the historical data submitted to ECVAM for both the cysteine and the lysine peptides.
2. The application of acceptance criteria for the Reference Control C replicate injections
(peptide alone dissolved in the appropriate solvent) in the analysis sequence according to which the mean of the peptide concentrations in the three replicates should correspond to the theoretical concentration of (0.50mM) plus or minus 10%. This acceptance criterion has to be used as a run acceptance criterion to verify accuracy of the peptide concentrations since the related peptide peak area is then used in the formula to calculate the Percent Peptide Depletion.
As described above, all modifications to the SOP, including the addition of acceptance criteria not originally foreseen, were made in close collaboration with the lead laboratory to make sure that such modifications/additions did not invalidate or compromise the historical data generated with the DPRA prior to the submission to ECVAM.
Additional minor technical revisions were made before the start of the blind testing phase in order to incorporate the experience and knowledge gained during the transfer of the method. The revised protocol (Version 2, see Appendix 8) was then used by all testing facilities for the generation of the results with the coded chemicals. A summary of the protocol revisions is outlined in Table 5:
Direct Peptide Reactivity Assay (DPRA) ECVAM Validation Study Report Page 28 of 74
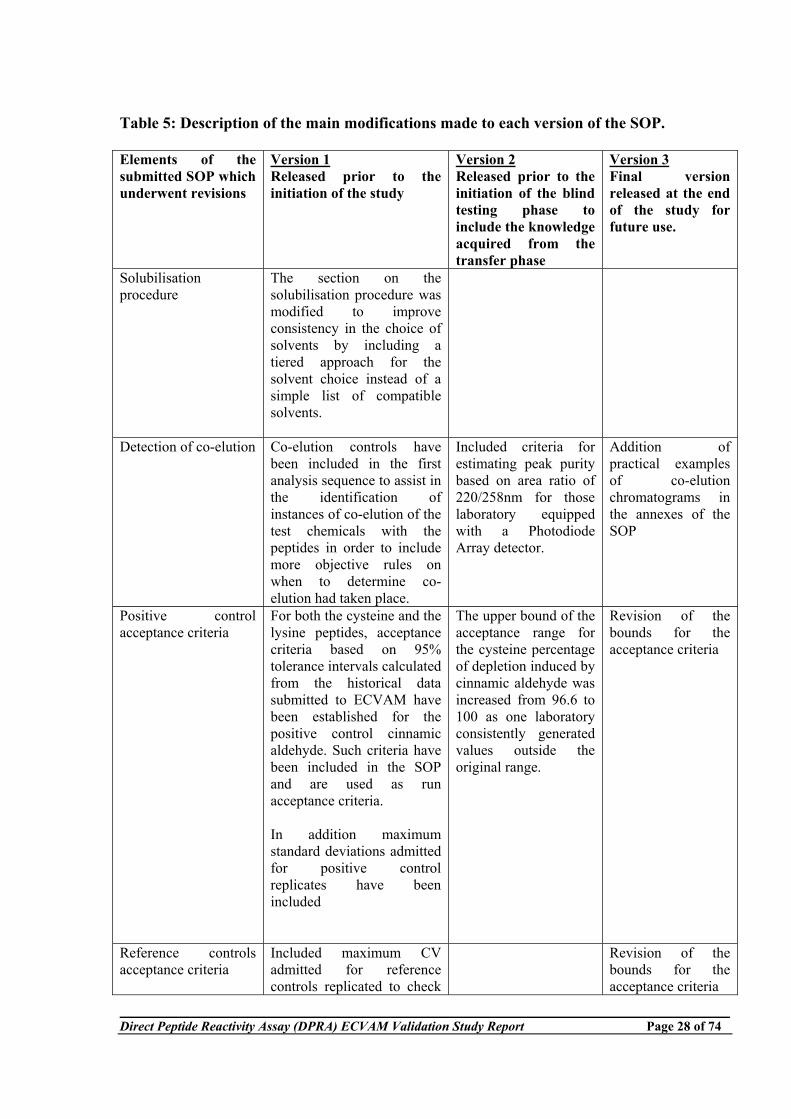
Table 5: Description of the main modifications made to each version of the SOP. Elements of the submitted SOP which underwent revisions
Version 1 Released prior to the initiation of the study
Version 2 Released prior to the initiation of the blind testing phase to include the knowledge acquired from the transfer phase
Version 3 Final version released at the end of the study for future use.
Solubilisation procedure
The section on the solubilisation procedure was modified to improve consistency in the choice of solvents by including a tiered approach for the solvent choice instead of a simple list of compatible solvents.
Detection of co-elution Co-elution controls have been included in the first analysis sequence to assist in the identification of instances of co-elution of the test chemicals with the peptides in order to include more objective rules on when to determine co-elution had taken place.
Included criteria for estimating peak purity based on area ratio of 220/258nm for those laboratory equipped with a Photodiode Array detector.
Addition of practical examples of co-elution chromatograms in the annexes of the SOP
Positive control acceptance criteria
For both the cysteine and the lysine peptides, acceptance criteria based on 95% tolerance intervals calculated from the historical data submitted to ECVAM have been established for the positive control cinnamic aldehyde. Such criteria have been included in the SOP and are used as run acceptance criteria. In addition maximum standard deviations admitted for positive control replicates have been included
The upper bound of the acceptance range for the cysteine percentage of depletion induced by cinnamic aldehyde was increased from 96.6 to 100 as one laboratory consistently generated values outside the original range.
Revision of the bounds for the acceptance criteria
Reference controls acceptance criteria
Included maximum CV admitted for reference controls replicated to check
Revision of the bounds for the acceptance criteria
Direct Peptide Reactivity Assay (DPRA) ECVAM Validation Study Report Page 29 of 74
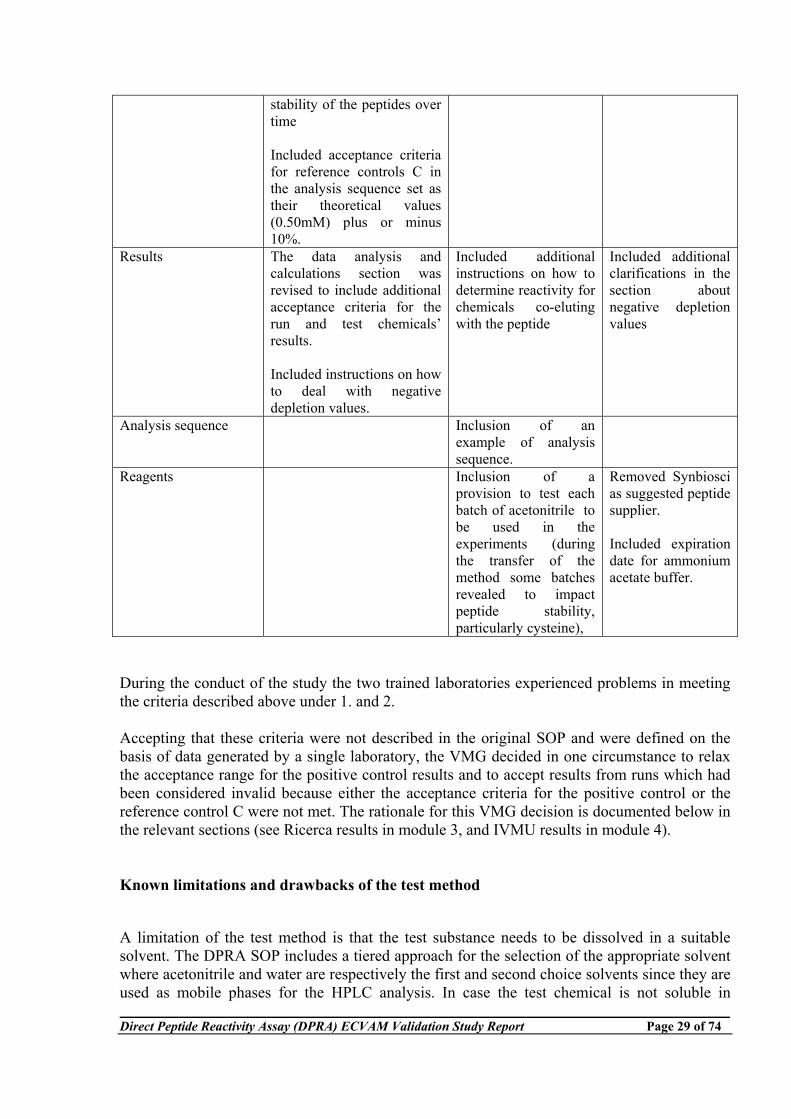
stability of the peptides over time Included acceptance criteria for reference controls C in the analysis sequence set as their theoretical values (0.50mM) plus or minus 10%.
Results The data analysis and calculations section was revised to include additional acceptance criteria for the run and test chemicals’ results. Included instructions on how to deal with negative depletion values.
Included additional instructions on how to determine reactivity for chemicals co-eluting with the peptide
Included additional clarifications in the section about negative depletion values
Analysis sequence Inclusion of an example of analysis sequence.
Reagents Inclusion of a provision to test each batch of acetonitrile to be used in the experiments (during the transfer of the method some batches revealed to impact peptide stability, particularly cysteine),
Removed Synbiosci as suggested peptide supplier. Included expiration date for ammonium acetate buffer.
During the conduct of the study the two trained laboratories experienced problems in meeting the criteria described above under 1. and 2. Accepting that these criteria were not described in the original SOP and were defined on the basis of data generated by a single laboratory, the VMG decided in one circumstance to relax the acceptance range for the positive control results and to accept results from runs which had been considered invalid because either the acceptance criteria for the positive control or the reference control C were not met. The rationale for this VMG decision is documented below in the relevant sections (see Ricerca results in module 3, and IVMU results in module 4). Known limitations and drawbacks of the test method
A limitation of the test method is that the test substance needs to be dissolved in a suitable solvent. The DPRA SOP includes a tiered approach for the selection of the appropriate solvent where acetonitrile and water are respectively the first and second choice solvents since they are used as mobile phases for the HPLC analysis. In case the test chemical is not soluble in
Direct Peptide Reactivity Assay (DPRA) ECVAM Validation Study Report Page 30 of 74
acetonitrile or water, other solvents are suggested: these include isopropanol, DMSO, and combinations of the solvents described above. The solvent choice provided should allow the testing of the vast majority of chemicals. In fact P&G reported in their submission that so far in their experience they faced solubility problems with only one chemical (squaric acid).
For the purpose of the current study none of the chemicals selected had to be discarded because of solvent incompatibility as a result of the solubility assessment performed by ECVAM (see Section 5a above). This was also consistent with the fact that no problems were subsequently encountered by the laboratories during the solubility assessment for the blind testing phase
Another limitation of the DPRA is that some chemicals, or the reaction products formed following incubation with the peptide, may interfere with the peptide determination because they elute at the same time of the peptide, a phenomenon referred to as co-elution. Since in the DPRA the HPLC separation occurs by gradient elution (i.e. the mobile phase composition is changed during the separation process), retention time of a chemical may be influenced by the solvent mixing system which vary in different instruments. For this reason, and as was confirmed during the current study (see section on Module 4, below), co-elution with the peptide can be systematically observed in one laboratory but not necessarily observed in the others if different instruments are used.
In the DPRA, in cases of co-elution of the chemical with the cysteine peptide alone or with both the cysteine and the lysine peptides an accurate calculation of the peptide depletion cannot be performed, however the depletion can always be estimated as described in the relevant section of the SOP (see page 20 of Annex 8) and the conclusion for this chemical adapted accordingly. In the case of co-elution with the lysine peptide, the value for the lysine peptide depletion is ignored and a different prediction model (using only the cysteine peptide depletion) is used. The DPRA can thus accommodate most cases of co-elution.
In their submission to ECVAM, P&G reported that in the set of 135 chemicals they have tested in-house 2 chemicals co-eluted with the cysteine peptide and 5 chemicals co-eluted with the lysine peptide.
Applicability domain of the test method The DPRA test method has been shown by the test submitter in their submission to ECVAM to be applicable to a broad range of chemicals covering relevant chemical classes, reaction mechanisms, skin sensitisation potency (as determined with in vivo studies) and physico-chemical properties.
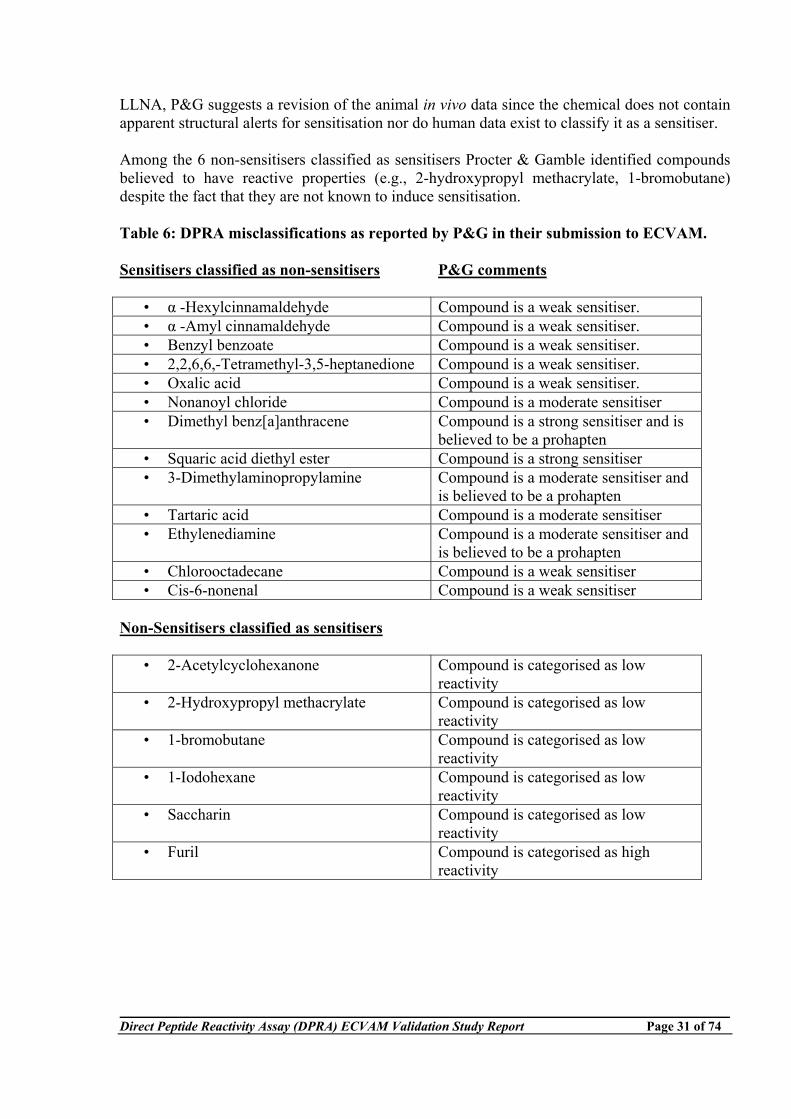
However the DPRA test method does not contain a metabolic/bioactivation system, therefore pre-haptens (i.e. chemicals requiring biochemical activation) and pro-haptens (i.e. chemicals requiring enzymatic activation) are not systematically detected. In addition, metals which sensitise via non-covalent bonding mechanisms or interact with amino acids other than cysteine and lysine (e.g. nickel) fall outside the applicability domain. In their submission to ECVAM, P&G reported that of the 133 chemicals tested, 13 sensitisers have been classified as non-sensitisers and 6 non-sensitisers have been classified as sensitisers (Table 6). Of the 13 sensitisers classified as non-sensitisers, seven of them are weak sensitisers (e.g., α-hexylcinnamaldehyde, benzyl benzoate). A few of the sensitisers classified as non-sensitisers are also considered by P&G to be pro-haptens (e.g., 3-dimethylaminopropylamine, dimethyl benz[a]anthracene). For oxalic acid which is categorised as weak sensitiser in the
Direct Peptide Reactivity Assay (DPRA) ECVAM Validation Study Report Page 31 of 74
LLNA, P&G suggests a revision of the animal in vivo data since the chemical does not contain apparent structural alerts for sensitisation nor do human data exist to classify it as a sensitiser. Among the 6 non-sensitisers classified as sensitisers Procter & Gamble identified compounds believed to have reactive properties (e.g., 2-hydroxypropyl methacrylate, 1-bromobutane) despite the fact that they are not known to induce sensitisation. Table 6: DPRA misclassifications as reported by P&G in their submission to ECVAM. Sensitisers classified as non-sensitisers
P&G comments
• α -Hexylcinnamaldehyde Compound is a weak sensitiser. • α -Amyl cinnamaldehyde Compound is a weak sensitiser. • Benzyl benzoate Compound is a weak sensitiser. • 2,2,6,6,-Tetramethyl-3,5-heptanedione Compound is a weak sensitiser. • Oxalic acid Compound is a weak sensitiser. • Nonanoyl chloride Compound is a moderate sensitiser • Dimethyl benz[a]anthracene Compound is a strong sensitiser and is
believed to be a prohapten • Squaric acid diethyl ester Compound is a strong sensitiser • 3-Dimethylaminopropylamine Compound is a moderate sensitiser and
is believed to be a prohapten • Tartaric acid Compound is a moderate sensitiser • Ethylenediamine Compound is a moderate sensitiser and
is believed to be a prohapten • Chlorooctadecane Compound is a weak sensitiser • Cis-6-nonenal Compound is a weak sensitiser
Non-Sensitisers classified as sensitisers
• 2-Acetylcyclohexanone Compound is categorised as low reactivity
• 2-Hydroxypropyl methacrylate Compound is categorised as low reactivity
• 1-bromobutane Compound is categorised as low reactivity
• 1-Iodohexane Compound is categorised as low reactivity
• Saccharin Compound is categorised as low reactivity
• Furil Compound is categorised as high reactivity
Direct Peptide Reactivity Assay (DPRA) ECVAM Validation Study Report Page 32 of 74
Conclusion of the Validation Management Team on Module 1 The DPRA protocol proved to be generally robust for the purposes of this study, only minor clarifications were made to the SOP during the course of the study in relation to specific elements of the procedure and the data interpretation to minimise the sources of variability. The additions in the sections describing the analysis sequence, data recording and analysis and calculation of results were introduced largely to resolve ambiguities and minor omissions in the original SOP in order to improve clarity and consistency of data generation and interpretation. To improve consistency of choice of solvent, a strategy was provided for solvent selection resulting in concordance across the three laboratories with respect to 22 of 24 chemicals subsequently tested (see section on Module 4, below). Co-elution of peptide and test chemical or reaction products was known from the outset to occur in some instances, and more detailed guidance was included to ensure recognition of this problem when it occurred in practice. The upper bound of the acceptance range for the cysteine peptide depletion induced by cinnamic aldehyde, which was originally set on the basis of the lead laboratory’s historical findings, was revised prior to the testing phase taking into account the experience of the other laboratories. The aim was to avoid wrongly discarding runs which were generating good quality results. The acceptance ranges for the values of reference control C in the different solvents were pragmatically established by taking over the acceptance range for reference controls A that was included in the SOP submitted to ECVAM by P&G. During the blind testing phase one of the laboratories generated a number of runs in which the reference control C values were consistently marginally below the preset lower limit. Acknowledging the limitations of the way those acceptance criteria were set, allowed for acceptance of these results and their inclusion in the statistical analysis with no negative discernable impact on the reliability and repeatability of the test (see section on Module 2, below). The VMG believes that the acceptance range should be revised for future use of the DPRA (see Recommendations section). The issue related to the significance of the source/batch of acetonitrile used for the test was unexpected (see section on Module 3, below), and was resolved with the inclusion of a preliminary acetonitrile suitability experiment in the SOP. Following these procedural clarifications to the SOP, the VMG believes the supporting documents (including the original submission to ECVAM and associated scientific publications) and the current study findings adequately demonstrate the intended purpose, the need for, the status of development, and the scientific and mechanistic basis and relevance of the DPRA test method. In conclusion, the VMG believes that Module 1, Test Method Definition, is satisfied.
Direct Peptide Reactivity Assay (DPRA) ECVAM Validation Study Report Page 33 of 74
Transferability (Module 3) Reference documents: - DPRA Training and Transfer Plan (Appendix 12) - Training reports for Ricerca and IVMU (Appendices 13-14) - List of additional available documents filed for the study and available on request (Appendix 16)
1. General aspects The DPRA procedure can be performed in analytical chemistry laboratories equipped with standard high performance liquid chromatography (HPLC) instrumentation and with laboratory personnel trained and experienced in HPLC. All apparatus/instruments and reagents needed for the performance of the method are readily available commercially. P&G being the lead laboratory and having developed the method was responsible for both the training of the personnel at the other testing facilities participating in the study and for overseeing and providing advice during the test method transfer in order to make sure that the procedure for performing the DPRA as described in the SOP was clearly understood and properly implemented. P&G provided training to the study personnel of Ricerca and IVMU at P&G (Phase A Stage I). The trained personnel were then responsible for the transfer of the test method to their own laboratories under the supervision of the lead laboratory P&G (Phase A Stage II). The schedule for the training of these laboratories as well as the details of the transfer experiments, were drafted by the lead laboratory on the basis of its experience with the test method. To demonstrate successful method transfer, the laboratories had to perform the test method procedure by testing in-house a number of chemicals and meet the transfer acceptance criteria as defined in the Transfer Plan. The chemicals used for these qualification runs, as well as the criteria for a successful achievement of the transfer of the method, were selected by the lead laboratory, and approved by the VMG prior to the initiation of the training. The chemicals used for this phase A were not supplied by ECVAM, but were purchased by the trained laboratories on the basis of the instructions set out in the training and transfer plan (Appendix 12). All chemicals were tested uncoded, and the results sent directly to the lead laboratories for evaluation.
2. Training Ricerca and IVMU personnel received theoretical and procedural training at P&G. The training sessions for Ricerca and IVMU staff took place on March 2-4 and on March 15-17 2010, respectively. The training included a theoretical component with discussion on the different aspects of the SOP and a practical part were the trainees were given the opportunity to setup an actual DPRA test run for cysteine and lysine depletion, to apply the prediction model and to analyse the results.
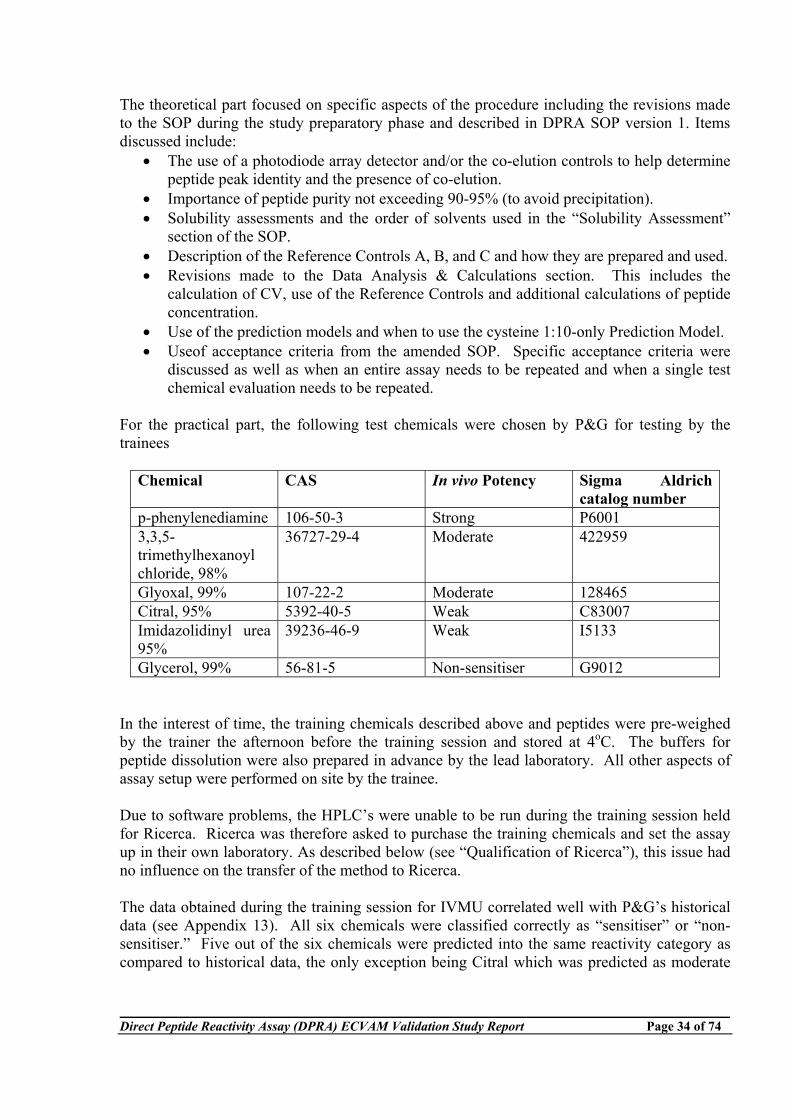
Direct Peptide Reactivity Assay (DPRA) ECVAM Validation Study Report Page 34 of 74
The theoretical part focused on specific aspects of the procedure including the revisions made to the SOP during the study preparatory phase and described in DPRA SOP version 1. Items discussed include:
• The use of a photodiode array detector and/or the co-elution controls to help determine peptide peak identity and the presence of co-elution.
• Importance of peptide purity not exceeding 90-95% (to avoid precipitation). • Solubility assessments and the order of solvents used in the “Solubility Assessment”
section of the SOP. • Description of the Reference Controls A, B, and C and how they are prepared and used. • Revisions made to the Data Analysis & Calculations section. This includes the
calculation of CV, use of the Reference Controls and additional calculations of peptide concentration.
• Use of the prediction models and when to use the cysteine 1:10-only Prediction Model. • Useof acceptance criteria from the amended SOP. Specific acceptance criteria were
discussed as well as when an entire assay needs to be repeated and when a single test chemical evaluation needs to be repeated.
For the practical part, the following test chemicals were chosen by P&G for testing by the trainees
Chemical CAS In vivo Potency Sigma Aldrich catalog number
p-phenylenediamine 106-50-3 Strong P6001 3,3,5-trimethylhexanoyl chloride, 98%
36727-29-4 Moderate 422959
Glyoxal, 99% 107-22-2 Moderate 128465 Citral, 95% 5392-40-5 Weak C83007 Imidazolidinyl urea 95%
39236-46-9 Weak I5133
Glycerol, 99% 56-81-5 Non-sensitiser G9012 In the interest of time, the training chemicals described above and peptides were pre-weighed by the trainer the afternoon before the training session and stored at 4oC. The buffers for peptide dissolution were also prepared in advance by the lead laboratory. All other aspects of assay setup were performed on site by the trainee. Due to software problems, the HPLC’s were unable to be run during the training session held for Ricerca. Ricerca was therefore asked to purchase the training chemicals and set the assay up in their own laboratory. As described below (see “Qualification of Ricerca”), this issue had no influence on the transfer of the method to Ricerca. The data obtained during the training session for IVMU correlated well with P&G’s historical data (see Appendix 13). All six chemicals were classified correctly as “sensitiser” or “non-sensitiser.” Five out of the six chemicals were predicted into the same reactivity category as compared to historical data, the only exception being Citral which was predicted as moderate
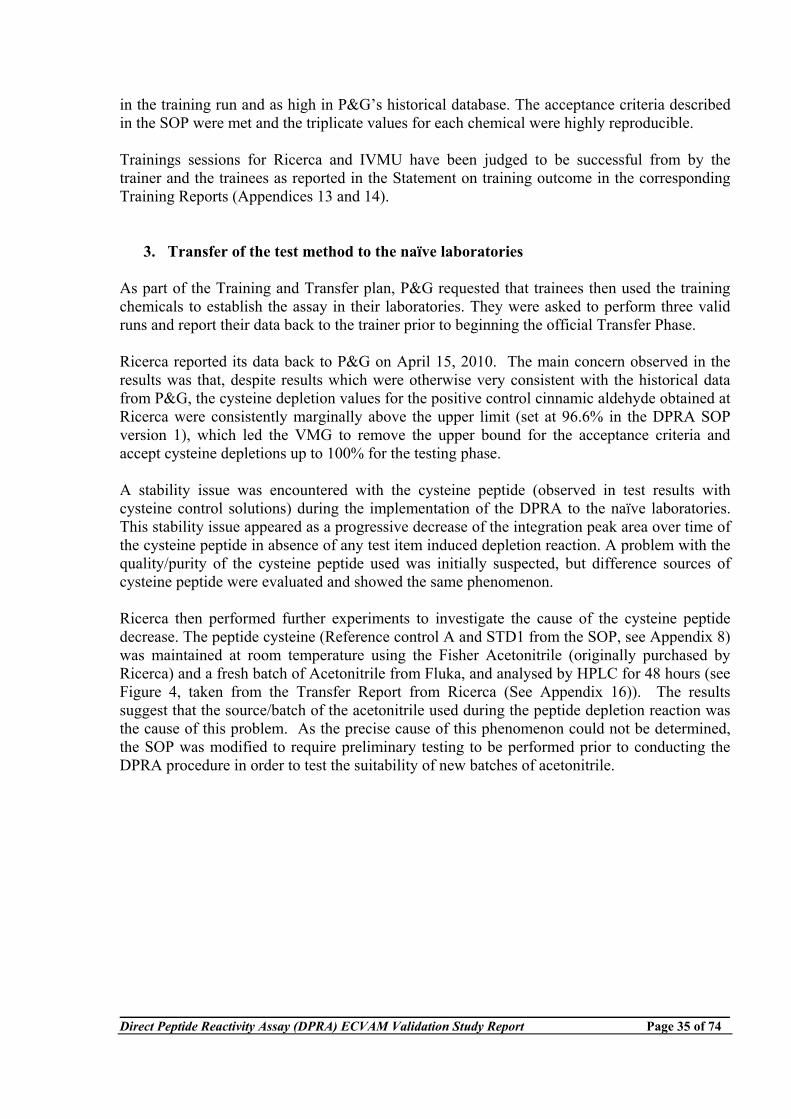
Direct Peptide Reactivity Assay (DPRA) ECVAM Validation Study Report Page 35 of 74
in the training run and as high in P&G’s historical database. The acceptance criteria described in the SOP were met and the triplicate values for each chemical were highly reproducible. Trainings sessions for Ricerca and IVMU have been judged to be successful from by the trainer and the trainees as reported in the Statement on training outcome in the corresponding Training Reports (Appendices 13 and 14).
3. Transfer of the test method to the naïve laboratories As part of the Training and Transfer plan, P&G requested that trainees then used the training chemicals to establish the assay in their laboratories. They were asked to perform three valid runs and report their data back to the trainer prior to beginning the official Transfer Phase. Ricerca reported its data back to P&G on April 15, 2010. The main concern observed in the results was that, despite results which were otherwise very consistent with the historical data from P&G, the cysteine depletion values for the positive control cinnamic aldehyde obtained at Ricerca were consistently marginally above the upper limit (set at 96.6% in the DPRA SOP version 1), which led the VMG to remove the upper bound for the acceptance criteria and accept cysteine depletions up to 100% for the testing phase. A stability issue was encountered with the cysteine peptide (observed in test results with cysteine control solutions) during the implementation of the DPRA to the naïve laboratories. This stability issue appeared as a progressive decrease of the integration peak area over time of the cysteine peptide in absence of any test item induced depletion reaction. A problem with the quality/purity of the cysteine peptide used was initially suspected, but difference sources of cysteine peptide were evaluated and showed the same phenomenon. Ricerca then performed further experiments to investigate the cause of the cysteine peptide decrease. The peptide cysteine (Reference control A and STD1 from the SOP, see Appendix 8) was maintained at room temperature using the Fisher Acetonitrile (originally purchased by Ricerca) and a fresh batch of Acetonitrile from Fluka, and analysed by HPLC for 48 hours (see Figure 4, taken from the Transfer Report from Ricerca (See Appendix 16)). The results suggest that the source/batch of the acetonitrile used during the peptide depletion reaction was the cause of this problem. As the precise cause of this phenomenon could not be determined, the SOP was modified to require preliminary testing to be performed prior to conducting the DPRA procedure in order to test the suitability of new batches of acetonitrile.
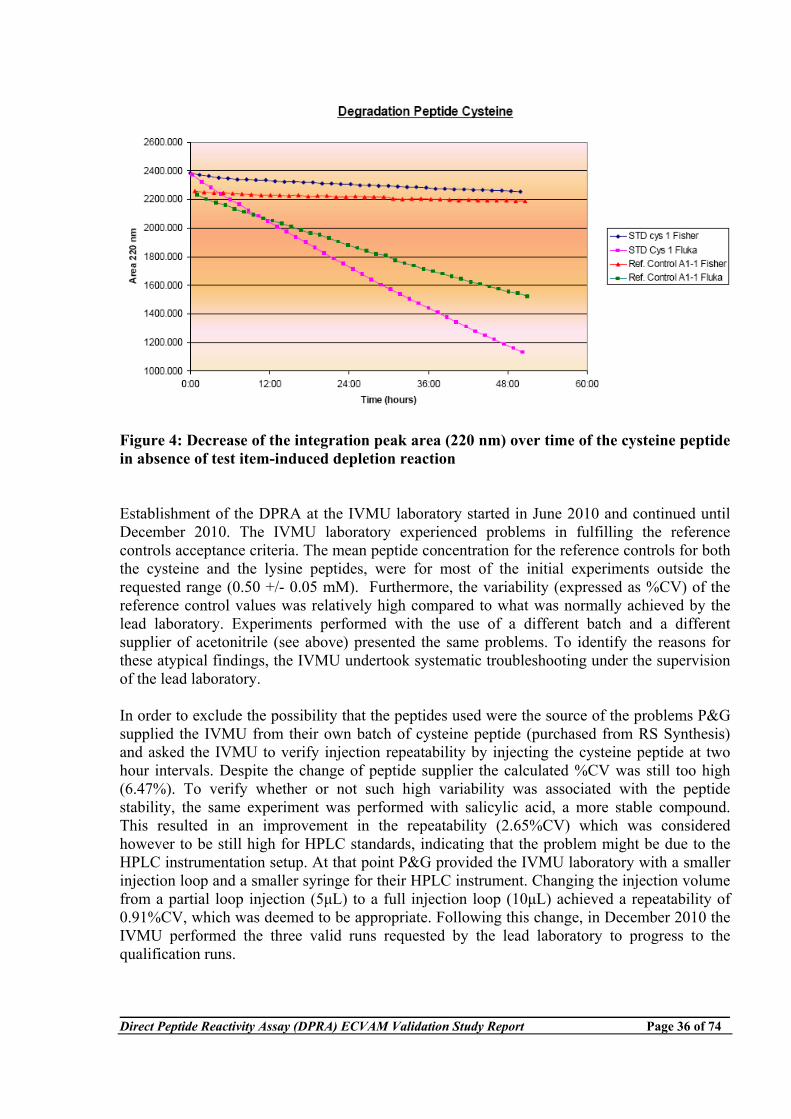
Direct Peptide Reactivity Assay (DPRA) ECVAM Validation Study Report Page 36 of 74
Figure 4: Decrease of the integration peak area (220 nm) over time of the cysteine peptide in absence of test item-induced depletion reaction Establishment of the DPRA at the IVMU laboratory started in June 2010 and continued until December 2010. The IVMU laboratory experienced problems in fulfilling the reference controls acceptance criteria. The mean peptide concentration for the reference controls for both the cysteine and the lysine peptides, were for most of the initial experiments outside the requested range (0.50 +/- 0.05 mM). Furthermore, the variability (expressed as %CV) of the reference control values was relatively high compared to what was normally achieved by the lead laboratory. Experiments performed with the use of a different batch and a different supplier of acetonitrile (see above) presented the same problems. To identify the reasons for these atypical findings, the IVMU undertook systematic troubleshooting under the supervision of the lead laboratory. In order to exclude the possibility that the peptides used were the source of the problems P&G supplied the IVMU from their own batch of cysteine peptide (purchased from RS Synthesis) and asked the IVMU to verify injection repeatability by injecting the cysteine peptide at two hour intervals. Despite the change of peptide supplier the calculated %CV was still too high (6.47%). To verify whether or not such high variability was associated with the peptide stability, the same experiment was performed with salicylic acid, a more stable compound. This resulted in an improvement in the repeatability (2.65%CV) which was considered however to be still high for HPLC standards, indicating that the problem might be due to the HPLC instrumentation setup. At that point P&G provided the IVMU laboratory with a smaller injection loop and a smaller syringe for their HPLC instrument. Changing the injection volume from a partial loop injection (5μL) to a full injection loop (10μL) achieved a repeatability of 0.91%CV, which was deemed to be appropriate. Following this change, in December 2010 the IVMU performed the three valid runs requested by the lead laboratory to progress to the qualification runs.
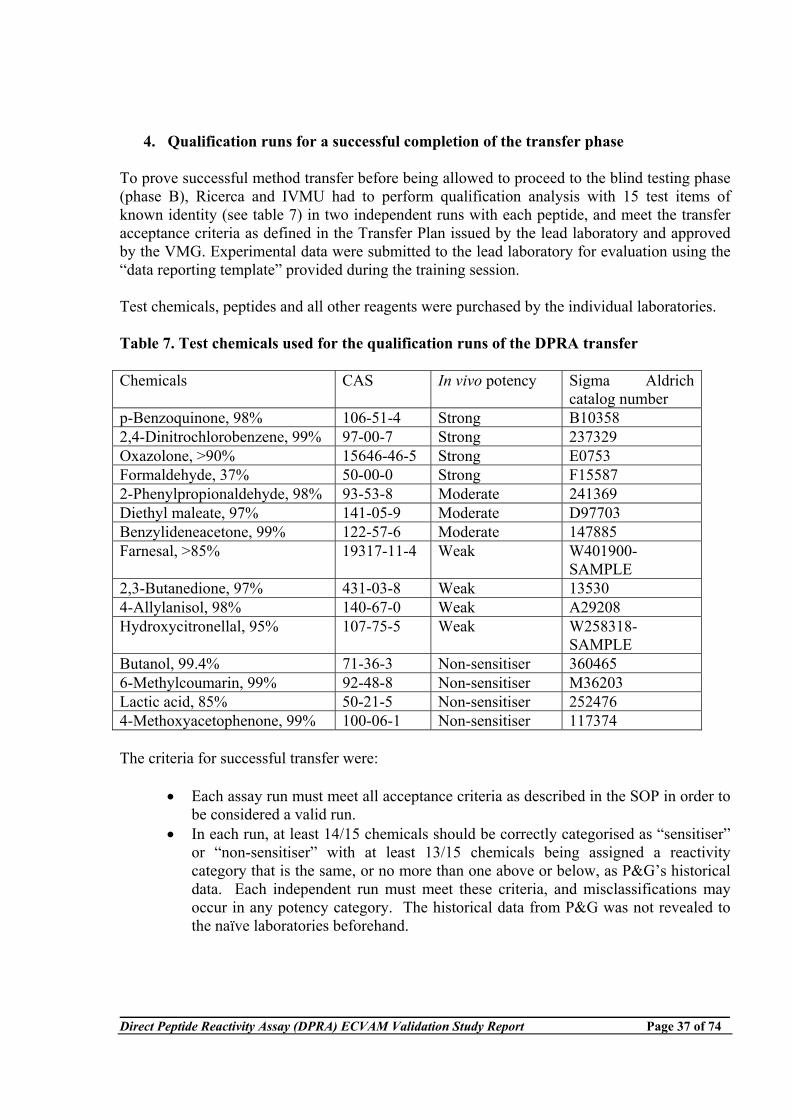
Direct Peptide Reactivity Assay (DPRA) ECVAM Validation Study Report Page 37 of 74
4. Qualification runs for a successful completion of the transfer phase To prove successful method transfer before being allowed to proceed to the blind testing phase (phase B), Ricerca and IVMU had to perform qualification analysis with 15 test items of known identity (see table 7) in two independent runs with each peptide, and meet the transfer acceptance criteria as defined in the Transfer Plan issued by the lead laboratory and approved by the VMG. Experimental data were submitted to the lead laboratory for evaluation using the “data reporting template” provided during the training session. Test chemicals, peptides and all other reagents were purchased by the individual laboratories. Table 7. Test chemicals used for the qualification runs of the DPRA transfer Chemicals CAS In vivo potency Sigma Aldrich
catalog number p-Benzoquinone, 98% 106-51-4 Strong B10358 2,4-Dinitrochlorobenzene, 99% 97-00-7 Strong 237329 Oxazolone, >90% 15646-46-5 Strong E0753 Formaldehyde, 37% 50-00-0 Strong F15587 2-Phenylpropionaldehyde, 98% 93-53-8 Moderate 241369 Diethyl maleate, 97% 141-05-9 Moderate D97703 Benzylideneacetone, 99% 122-57-6 Moderate 147885 Farnesal, >85% 19317-11-4 Weak W401900-
SAMPLE 2,3-Butanedione, 97% 431-03-8 Weak 13530 4-Allylanisol, 98% 140-67-0 Weak A29208 Hydroxycitronellal, 95% 107-75-5 Weak W258318-
SAMPLE Butanol, 99.4% 71-36-3 Non-sensitiser 360465 6-Methylcoumarin, 99% 92-48-8 Non-sensitiser M36203 Lactic acid, 85% 50-21-5 Non-sensitiser 252476 4-Methoxyacetophenone, 99% 100-06-1 Non-sensitiser 117374 The criteria for successful transfer were:
• Each assay run must meet all acceptance criteria as described in the SOP in order to be considered a valid run.
• In each run, at least 14/15 chemicals should be correctly categorised as “sensitiser” or “non-sensitiser” with at least 13/15 chemicals being assigned a reactivity category that is the same, or no more than one above or below, as P&G’s historical data. Each independent run must meet these criteria, and misclassifications may occur in any potency category. The historical data from P&G was not revealed to the naïve laboratories beforehand.
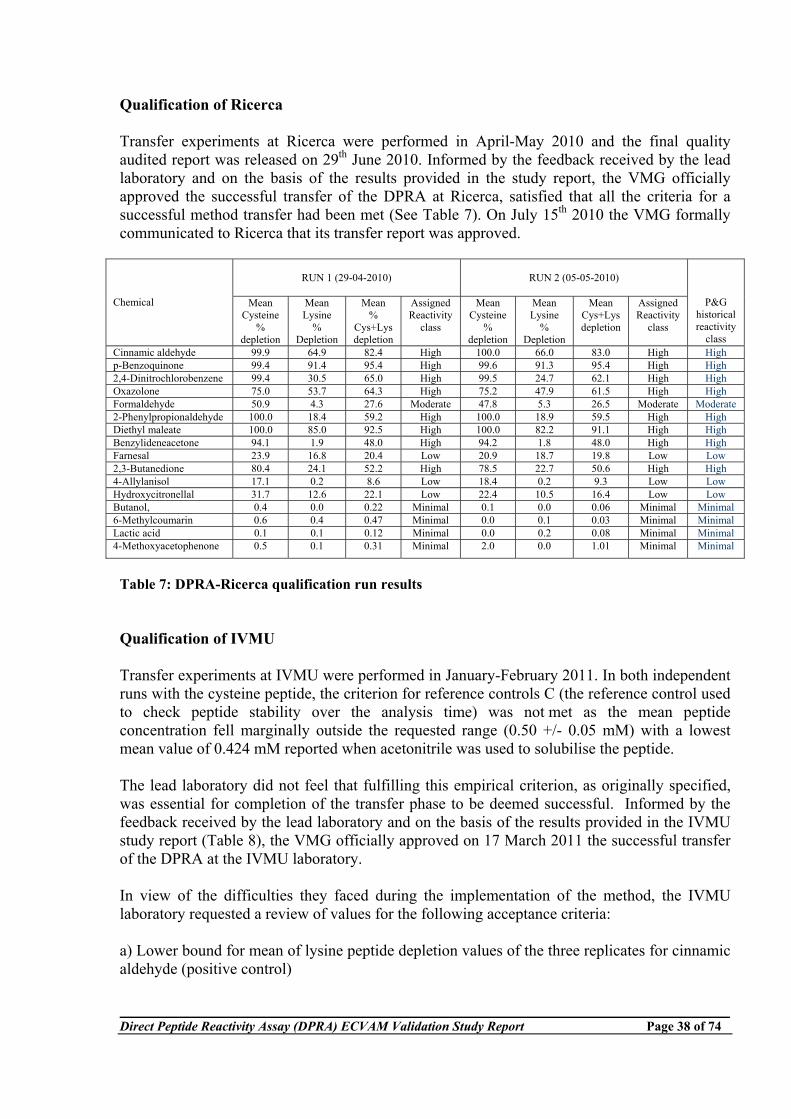
Direct Peptide Reactivity Assay (DPRA) ECVAM Validation Study Report Page 38 of 74
Qualification of Ricerca Transfer experiments at Ricerca were performed in April-May 2010 and the final quality audited report was released on 29th June 2010. Informed by the feedback received by the lead laboratory and on the basis of the results provided in the study report, the VMG officially approved the successful transfer of the DPRA at Ricerca, satisfied that all the criteria for a successful method transfer had been met (See Table 7). On July 15th 2010 the VMG formally communicated to Ricerca that its transfer report was approved.
RUN 1 (29-04-2010)
RUN 2 (05-05-2010)
Chemical Mean
Cysteine %
depletion
Mean Lysine
% Depletion
Mean %
Cys+Lys depletion
Assigned Reactivity
class
Mean Cysteine
% depletion
Mean Lysine
% Depletion
Mean Cys+Lys depletion
Assigned Reactivity
class
P&G historical reactivity
class Cinnamic aldehyde 99.9 64.9 82.4 High 100.0 66.0 83.0 High High p-Benzoquinone 99.4 91.4 95.4 High 99.6 91.3 95.4 High High 2,4-Dinitrochlorobenzene 99.4 30.5 65.0 High 99.5 24.7 62.1 High High Oxazolone 75.0 53.7 64.3 High 75.2 47.9 61.5 High High Formaldehyde 50.9 4.3 27.6 Moderate 47.8 5.3 26.5 Moderate Moderate 2-Phenylpropionaldehyde 100.0 18.4 59.2 High 100.0 18.9 59.5 High High Diethyl maleate 100.0 85.0 92.5 High 100.0 82.2 91.1 High High Benzylideneacetone 94.1 1.9 48.0 High 94.2 1.8 48.0 High High Farnesal 23.9 16.8 20.4 Low 20.9 18.7 19.8 Low Low 2,3-Butanedione 80.4 24.1 52.2 High 78.5 22.7 50.6 High High 4-Allylanisol 17.1 0.2 8.6 Low 18.4 0.2 9.3 Low Low Hydroxycitronellal 31.7 12.6 22.1 Low 22.4 10.5 16.4 Low Low Butanol, 0.4 0.0 0.22 Minimal 0.1 0.0 0.06 Minimal Minimal 6-Methylcoumarin 0.6 0.4 0.47 Minimal 0.0 0.1 0.03 Minimal Minimal Lactic acid 0.1 0.1 0.12 Minimal 0.0 0.2 0.08 Minimal Minimal 4-Methoxyacetophenone 0.5 0.1 0.31 Minimal 2.0 0.0 1.01 Minimal Minimal
Table 7: DPRA-Ricerca qualification run results Qualification of IVMU Transfer experiments at IVMU were performed in January-February 2011. In both independent runs with the cysteine peptide, the criterion for reference controls C (the reference control used to check peptide stability over the analysis time) was not met as the mean peptide concentration fell marginally outside the requested range (0.50 +/- 0.05 mM) with a lowest mean value of 0.424 mM reported when acetonitrile was used to solubilise the peptide. The lead laboratory did not feel that fulfilling this empirical criterion, as originally specified, was essential for completion of the transfer phase to be deemed successful. Informed by the feedback received by the lead laboratory and on the basis of the results provided in the IVMU study report (Table 8), the VMG officially approved on 17 March 2011 the successful transfer of the DPRA at the IVMU laboratory. In view of the difficulties they faced during the implementation of the method, the IVMU laboratory requested a review of values for the following acceptance criteria: a) Lower bound for mean of lysine peptide depletion values of the three replicates for cinnamic aldehyde (positive control)
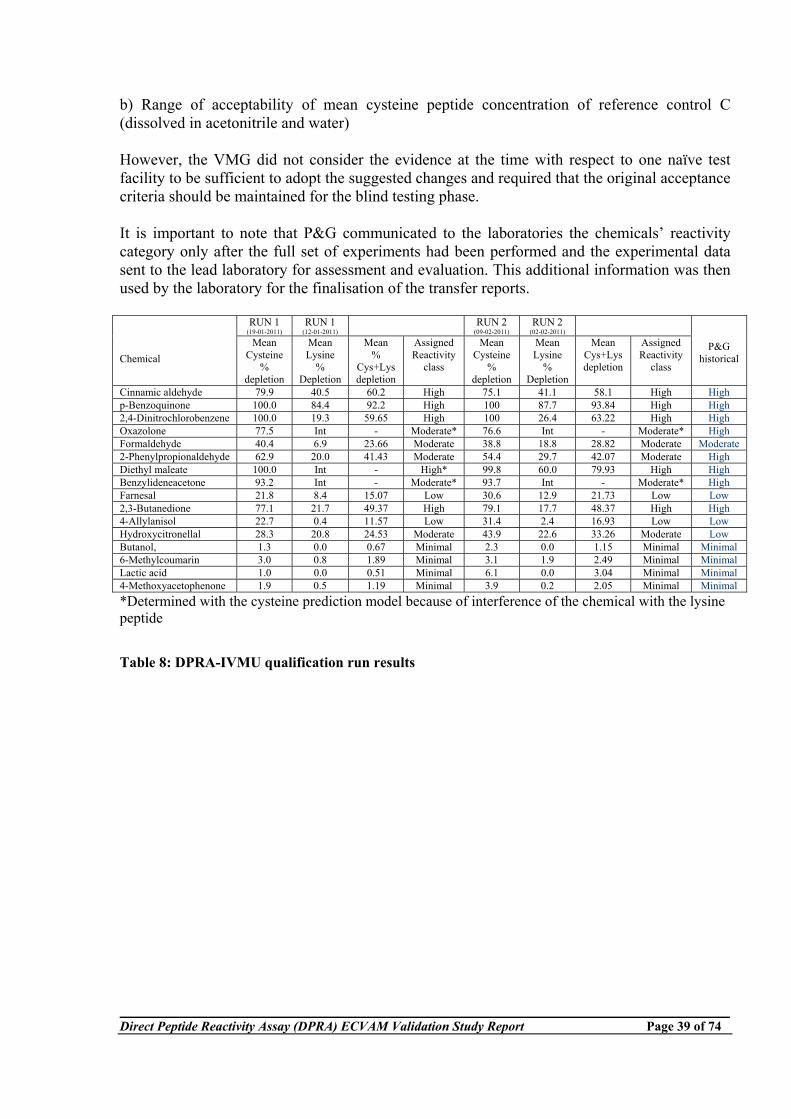
Direct Peptide Reactivity Assay (DPRA) ECVAM Validation Study Report Page 39 of 74
b) Range of acceptability of mean cysteine peptide concentration of reference control C (dissolved in acetonitrile and water) However, the VMG did not consider the evidence at the time with respect to one naïve test facility to be sufficient to adopt the suggested changes and required that the original acceptance criteria should be maintained for the blind testing phase. It is important to note that P&G communicated to the laboratories the chemicals’ reactivity category only after the full set of experiments had been performed and the experimental data sent to the lead laboratory for assessment and evaluation. This additional information was then used by the laboratory for the finalisation of the transfer reports.
RUN 1 (19-01-2011)
RUN 1 (12-01-2011)
RUN 2 (09-02-2011)
RUN 2 (02-02-2011)
Chemical
Mean Cysteine
% depletion
Mean Lysine
% Depletion
Mean %
Cys+Lys depletion
Assigned Reactivity
class
Mean Cysteine
% depletion
Mean Lysine
% Depletion
Mean Cys+Lys depletion
Assigned Reactivity
class
P&G historical
Cinnamic aldehyde 79.9 40.5 60.2 High 75.1 41.1 58.1 High High p-Benzoquinone 100.0 84.4 92.2 High 100 87.7 93.84 High High 2,4-Dinitrochlorobenzene 100.0 19.3 59.65 High 100 26.4 63.22 High High Oxazolone 77.5 Int - Moderate* 76.6 Int - Moderate* High Formaldehyde 40.4 6.9 23.66 Moderate 38.8 18.8 28.82 Moderate Moderate 2-Phenylpropionaldehyde 62.9 20.0 41.43 Moderate 54.4 29.7 42.07 Moderate High Diethyl maleate 100.0 Int - High* 99.8 60.0 79.93 High High Benzylideneacetone 93.2 Int - Moderate* 93.7 Int - Moderate* High Farnesal 21.8 8.4 15.07 Low 30.6 12.9 21.73 Low Low 2,3-Butanedione 77.1 21.7 49.37 High 79.1 17.7 48.37 High High 4-Allylanisol 22.7 0.4 11.57 Low 31.4 2.4 16.93 Low Low Hydroxycitronellal 28.3 20.8 24.53 Moderate 43.9 22.6 33.26 Moderate Low Butanol, 1.3 0.0 0.67 Minimal 2.3 0.0 1.15 Minimal Minimal 6-Methylcoumarin 3.0 0.8 1.89 Minimal 3.1 1.9 2.49 Minimal Minimal Lactic acid 1.0 0.0 0.51 Minimal 6.1 0.0 3.04 Minimal Minimal 4-Methoxyacetophenone 1.9 0.5 1.19 Minimal 3.9 0.2 2.05 Minimal Minimal *Determined with the cysteine prediction model because of interference of the chemical with the lysine peptide
Table 8: DPRA-IVMU qualification run results
Direct Peptide Reactivity Assay (DPRA) ECVAM Validation Study Report Page 40 of 74
Conclusion of the Validation Management Team on Module 3 The VMG concluded that the DPRA test method was successfully transferred from the lead laboratory to the other two laboratories. All the problems experienced by the naïve laboratories during the transfer phase proved to be due either to reagents or instrument configuration which were resolved and addressed in the revised SOP where appropriate. Concerning the acceptance criteria that were set prior to the initiation of the study both laboratories experienced problems in fully meeting some of them despite generating results otherwise consistent with P&G historical data. In the case of the upper bound for the positive control cysteine depletion the VMG agreed to remove it since it was already very close to 100% and since the upper bound is less relevant for the sensitivity of the test. In the case of the lower bounds for the lysine depletion for the positive control as well as for the lower bound for the reference controls C, the VMG concluded that there was insufficient evidence at the time to justify any modification. Despite being HPLC based, the DPRA test method does not require strict adherence to the more stringent and demanding criteria required for the implementation of bioanalytical methods for quantitative determination of test materials and metabolites, therefore it is easier to implement. However, as demonstrated by some of the issues encountered during this transfer phase and the solutions that were implemented, performance of the DPRA assay requires a detailed understanding of the HPLC techniques and strict adherence to the specified equipment and procedural details. In conclusion the VMG considers that the DPRA can be readily transferred among properly equipped and staffed laboratories. The techniques involved are commonly used in analytical laboratories. Experienced personnel can readily be trained in the test method, and the necessary equipment and supplies can be readily obtained. The DPRA SOP is clearly written and the analysis can be performed without difficulties.
Direct Peptide Reactivity Assay (DPRA) ECVAM Validation Study Report Page 41 of 74
Within-laboratory reproducibility (Module 2) Reference document: Statistical report (Appendix 15) List of additional documents filed for the study and available on request (Appendix 16) The within laboratory reproducibility was assessed with data generated with a subset of 15 chemicals tested in three independent experiments in each laboratory (Study Phase B2). As described in the SOP, each experiment is composed of one run to evaluate the cysteine depletion and another run to evaluate the lysine depletion. The SOP states that up to 25 chemicals can be accommodated within a single run, therefore the 15 chemicals were always tested within the same run. As already described in the coding/decoding section, a number was added to the codes to distinguish the three sets of 15 chemicals, and the laboratories were instructed never to include chemicals with different numbers in their codes in the same run/experiment. The data are presented laboratory by laboratory and the three required independent assessments of each chemical are referred to as experiment 1, experiment 2, and experiment 3. The main determinant of the test method's reliability assessment was the concordance of classification, sensitiser (S) versus non-sensitiser (NS), which were determined from the peptide depletion values. Furthermore the concordance of classification with regard to the 4 reactivity classes was considered. Additionally, descriptive and inferential statistical analyses (ANOVA) were performed on the raw peptide depletion data. However, because of the limited number of replicates (n=3), the results of the inferential tests applied cannot be consistently interpreted and are only considered as additional descriptive information. With a small number of replicates, violations of ANOVA assumptions (normal distribution of the errors and homogeneity of variances) are difficult to assess and confirm.
1. P&G
a. Reproducibility (concordance in predictions) In relation to the primary aim, the reproducibility in terms of classification S versus NS, for 11 of the 15 chemicals the same prediction was obtained in the 3 independent experiments resulting in a WLR of 73.3% (Table 9, left side). For the assignment to a reactivity class, 10 of 15 chemicals were assigned the same reactivity class in all 3 experiments. Note that in all cases of disagreement, the difference in the reactivity class assignment was only of one class, e.g. Formaldehyde (Table 9, right side), was classified as either LOW (twice) or MODERATE (once).
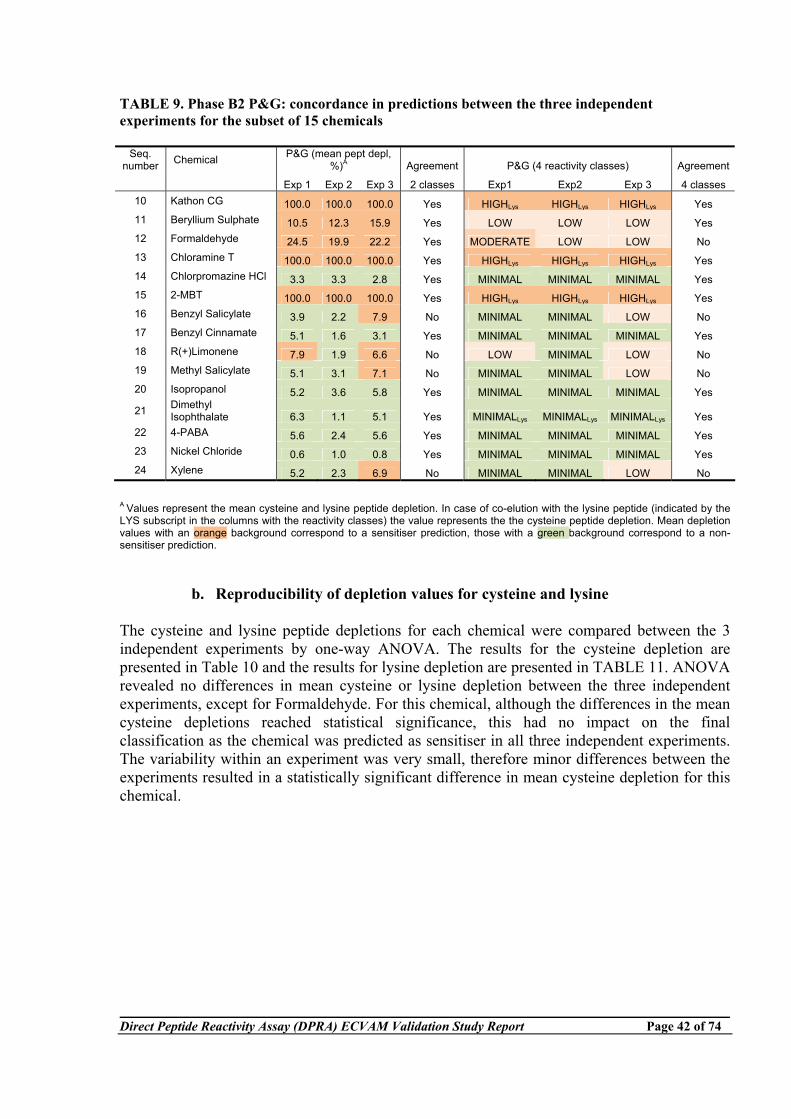
Direct Peptide Reactivity Assay (DPRA) ECVAM Validation Study Report Page 42 of 74
TABLE 9. Phase B2 P&G: concordance in predictions between the three independent experiments for the subset of 15 chemicals
Seq. number Chemical P&G (mean pept depl,
%)A Agreement P&G (4 reactivity classes) Agreement Exp 1 Exp 2 Exp 3 2 classes Exp1 Exp2 Exp 3 4 classes
10 Kathon CG 100.0 100.0 100.0 Yes HIGHLys HIGHLys HIGHLys Yes 11 Beryllium Sulphate 10.5 12.3 15.9 Yes LOW LOW LOW Yes 12 Formaldehyde 24.5 19.9 22.2 Yes MODERATE LOW LOW No 13 Chloramine T 100.0 100.0 100.0 Yes HIGHLys HIGHLys HIGHLys Yes 14 Chlorpromazine HCl 3.3 3.3 2.8 Yes MINIMAL MINIMAL MINIMAL Yes 15 2-MBT 100.0 100.0 100.0 Yes HIGHLys HIGHLys HIGHLys Yes 16 Benzyl Salicylate 3.9 2.2 7.9 No MINIMAL MINIMAL LOW No 17 Benzyl Cinnamate 5.1 1.6 3.1 Yes MINIMAL MINIMAL MINIMAL Yes 18 R(+)Limonene 7.9 1.9 6.6 No LOW MINIMAL LOW No 19 Methyl Salicylate 5.1 3.1 7.1 No MINIMAL MINIMAL LOW No 20 Isopropanol 5.2 3.6 5.8 Yes MINIMAL MINIMAL MINIMAL Yes
21 Dimethyl Isophthalate 6.3 1.1 5.1 Yes MINIMALLys MINIMALLys MINIMALLys Yes
22 4-PABA 5.6 2.4 5.6 Yes MINIMAL MINIMAL MINIMAL Yes 23 Nickel Chloride 0.6 1.0 0.8 Yes MINIMAL MINIMAL MINIMAL Yes 24 Xylene 5.2 2.3 6.9 No MINIMAL MINIMAL LOW No
A Values represent the mean cysteine and lysine peptide depletion. In case of co-elution with the lysine peptide (indicated by the LYS subscript in the columns with the reactivity classes) the value represents the the cysteine peptide depletion. Mean depletion values with an orange background correspond to a sensitiser prediction, those with a green background correspond to a non-sensitiser prediction.
b. Reproducibility of depletion values for cysteine and lysine The cysteine and lysine peptide depletions for each chemical were compared between the 3 independent experiments by one-way ANOVA. The results for the cysteine depletion are presented in Table 10 and the results for lysine depletion are presented in TABLE 11. ANOVA revealed no differences in mean cysteine or lysine depletion between the three independent experiments, except for Formaldehyde. For this chemical, although the differences in the mean cysteine depletions reached statistical significance, this had no impact on the final classification as the chemical was predicted as sensitiser in all three independent experiments. The variability within an experiment was very small, therefore minor differences between the experiments resulted in a statistically significant difference in mean cysteine depletion for this chemical.
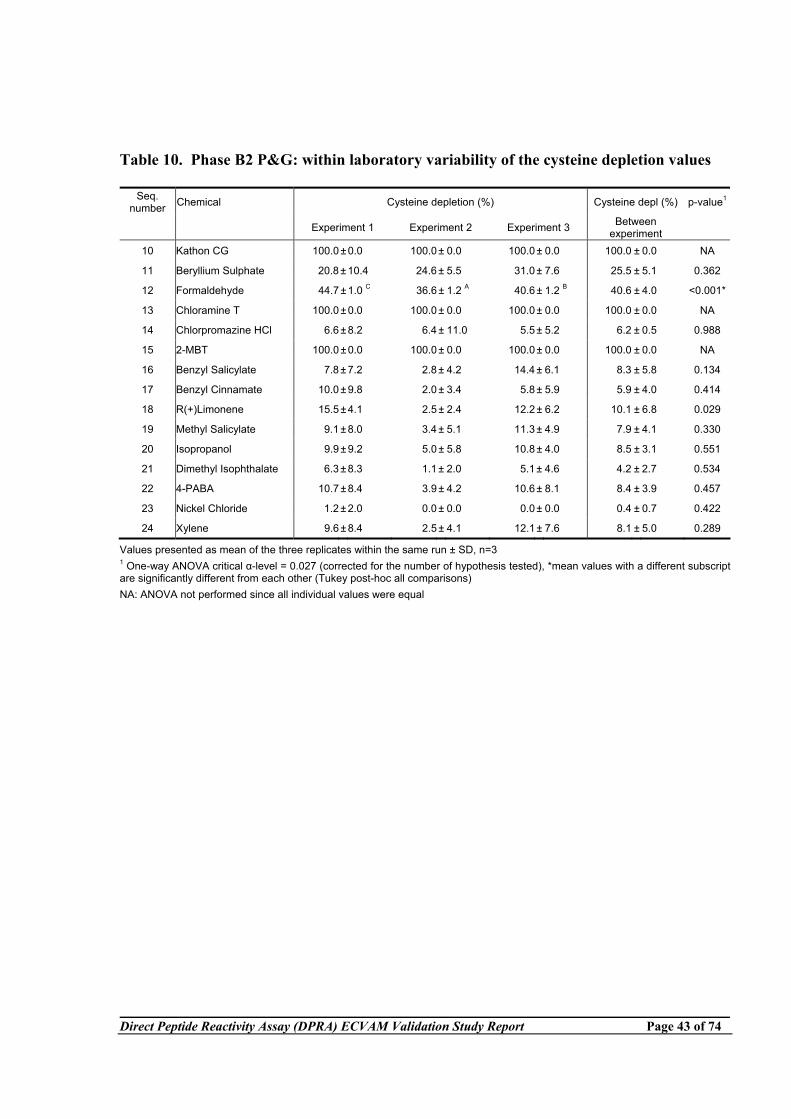
Direct Peptide Reactivity Assay (DPRA) ECVAM Validation Study Report Page 43 of 74
Table 10. Phase B2 P&G: within laboratory variability of the cysteine depletion values
Seq. number Chemical Cysteine depletion (%) Cysteine depl (%) p-value1
Experiment 1 Experiment 2 Experiment 3 Between experiment
10 Kathon CG 100.0 ± 0.0 100.0 ± 0.0 100.0± 0.0 100.0 ± 0.0 NA
11 Beryllium Sulphate 20.8 ± 10.4 24.6 ± 5.5 31.0± 7.6 25.5 ± 5.1 0.362
12 Formaldehyde 44.7 ± 1.0 C 36.6 ± 1.2 A 40.6± 1.2 B 40.6 ± 4.0 <0.001*
13 Chloramine T 100.0 ± 0.0 100.0 ± 0.0 100.0± 0.0 100.0 ± 0.0 NA
14 Chlorpromazine HCl 6.6 ± 8.2 6.4 ± 11.0 5.5± 5.2 6.2 ± 0.5 0.988
15 2-MBT 100.0 ± 0.0 100.0 ± 0.0 100.0± 0.0 100.0 ± 0.0 NA
16 Benzyl Salicylate 7.8 ± 7.2 2.8 ± 4.2 14.4± 6.1 8.3 ± 5.8 0.134
17 Benzyl Cinnamate 10.0 ± 9.8 2.0 ± 3.4 5.8± 5.9 5.9 ± 4.0 0.414
18 R(+)Limonene 15.5 ± 4.1 2.5 ± 2.4 12.2± 6.2 10.1 ± 6.8 0.029
19 Methyl Salicylate 9.1 ± 8.0 3.4 ± 5.1 11.3± 4.9 7.9 ± 4.1 0.330
20 Isopropanol 9.9 ± 9.2 5.0 ± 5.8 10.8± 4.0 8.5 ± 3.1 0.551
21 Dimethyl Isophthalate 6.3 ± 8.3 1.1 ± 2.0 5.1± 4.6 4.2 ± 2.7 0.534
22 4-PABA 10.7 ± 8.4 3.9 ± 4.2 10.6± 8.1 8.4 ± 3.9 0.457
23 Nickel Chloride 1.2 ± 2.0 0.0 ± 0.0 0.0± 0.0 0.4 ± 0.7 0.422
24 Xylene 9.6 ± 8.4 2.5 ± 4.1 12.1± 7.6 8.1 ± 5.0 0.289
Values presented as mean of the three replicates within the same run ± SD, n=3 1 One-way ANOVA critical α-level = 0.027 (corrected for the number of hypothesis tested), *mean values with a different subscript are significantly different from each other (Tukey post-hoc all comparisons) NA: ANOVA not performed since all individual values were equal
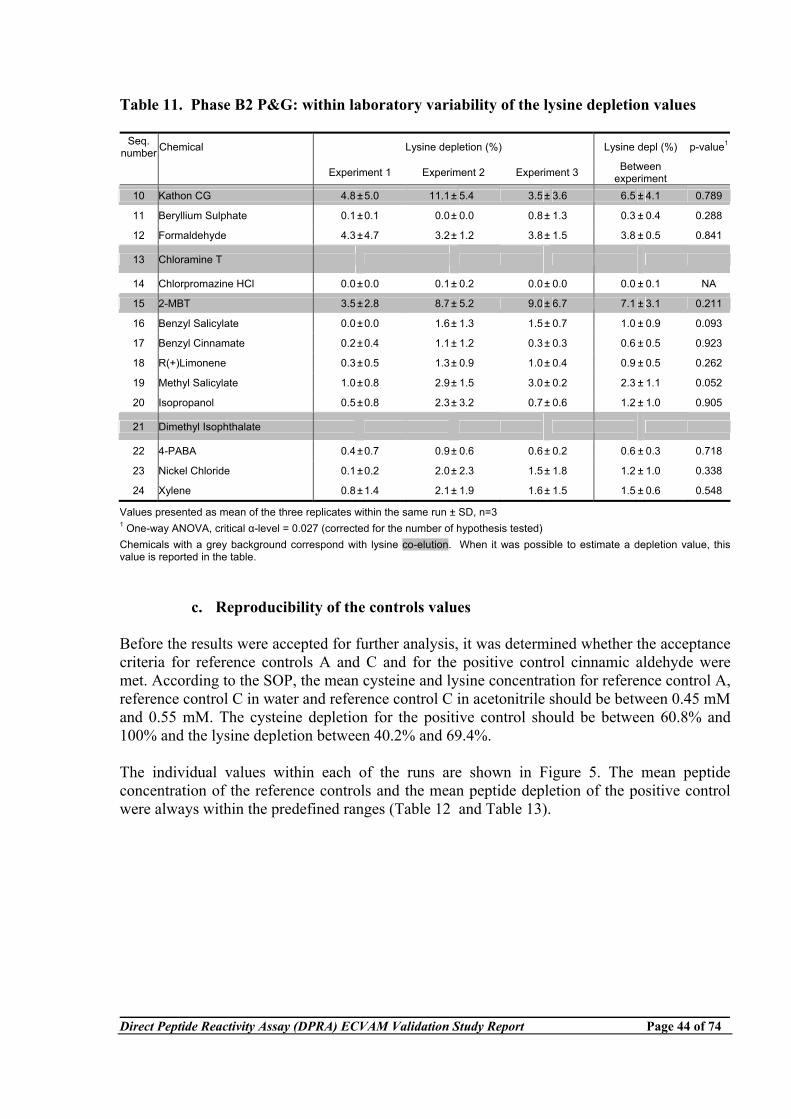
Direct Peptide Reactivity Assay (DPRA) ECVAM Validation Study Report Page 44 of 74
Table 11. Phase B2 P&G: within laboratory variability of the lysine depletion values
Seq. number Chemical Lysine depletion (%) Lysine depl (%) p-value1
Experiment 1 Experiment 2 Experiment 3 Between experiment
10 Kathon CG 4.8±5.0 11.1± 5.4 3.5± 3.6 6.5 ± 4.1 0.789
11 Beryllium Sulphate 0.1±0.1 0.0± 0.0 0.8± 1.3 0.3 ± 0.4 0.288
12 Formaldehyde 4.3±4.7 3.2± 1.2 3.8± 1.5 3.8 ± 0.5 0.841
13 Chloramine T
14 Chlorpromazine HCl 0.0±0.0 0.1± 0.2 0.0± 0.0 0.0 ± 0.1 NA
15 2-MBT 3.5±2.8 8.7± 5.2 9.0± 6.7 7.1 ± 3.1 0.211
16 Benzyl Salicylate 0.0±0.0 1.6± 1.3 1.5± 0.7 1.0 ± 0.9 0.093
17 Benzyl Cinnamate 0.2±0.4 1.1± 1.2 0.3± 0.3 0.6 ± 0.5 0.923
18 R(+)Limonene 0.3±0.5 1.3± 0.9 1.0± 0.4 0.9 ± 0.5 0.262
19 Methyl Salicylate 1.0±0.8 2.9± 1.5 3.0± 0.2 2.3 ± 1.1 0.052
20 Isopropanol 0.5±0.8 2.3± 3.2 0.7± 0.6 1.2 ± 1.0 0.905
21 Dimethyl Isophthalate
22 4-PABA 0.4±0.7 0.9± 0.6 0.6± 0.2 0.6 ± 0.3 0.718
23 Nickel Chloride 0.1±0.2 2.0± 2.3 1.5± 1.8 1.2 ± 1.0 0.338
24 Xylene 0.8±1.4 2.1± 1.9 1.6± 1.5 1.5 ± 0.6 0.548
Values presented as mean of the three replicates within the same run ± SD, n=3 1 One-way ANOVA, critical α-level = 0.027 (corrected for the number of hypothesis tested) Chemicals with a grey background correspond with lysine co-elution. When it was possible to estimate a depletion value, this value is reported in the table.
c. Reproducibility of the controls values Before the results were accepted for further analysis, it was determined whether the acceptance criteria for reference controls A and C and for the positive control cinnamic aldehyde were met. According to the SOP, the mean cysteine and lysine concentration for reference control A, reference control C in water and reference control C in acetonitrile should be between 0.45 mM and 0.55 mM. The cysteine depletion for the positive control should be between 60.8% and 100% and the lysine depletion between 40.2% and 69.4%. The individual values within each of the runs are shown in Figure 5. The mean peptide concentration of the reference controls and the mean peptide depletion of the positive control were always within the predefined ranges (Table 12 and Table 13).
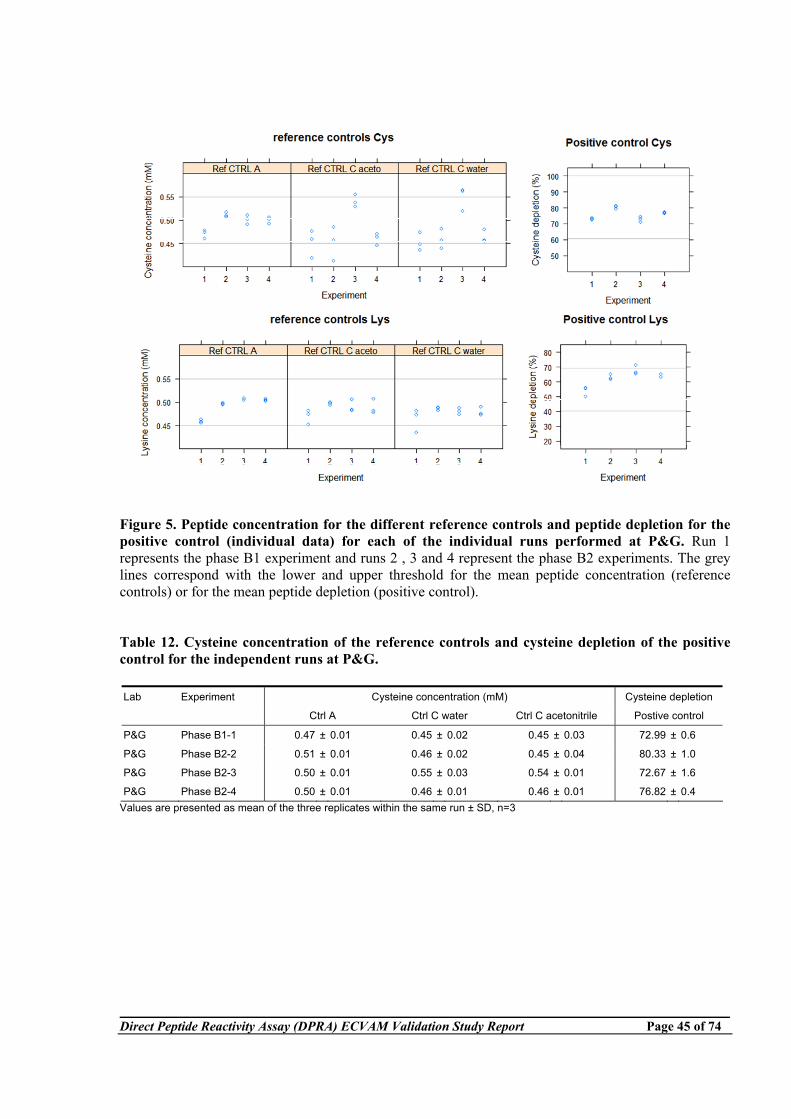
Direct Peptide Reactivity Assay (DPRA) ECVAM Validation Study Report Page 45 of 74
Figure 5. Peptide concentration for the different reference controls and peptide depletion for the positive control (individual data) for each of the individual runs performed at P&G. Run 1 represents the phase B1 experiment and runs 2 , 3 and 4 represent the phase B2 experiments. The grey lines correspond with the lower and upper threshold for the mean peptide concentration (reference controls) or for the mean peptide depletion (positive control). Table 12. Cysteine concentration of the reference controls and cysteine depletion of the positive control for the independent runs at P&G. Lab Experiment Cysteine concentration (mM) Cysteine depletion
Ctrl A Ctrl C water Ctrl C acetonitrile Postive control
P&G Phase B1-1 0.47 ± 0.01 0.45 ± 0.02 0.45 ± 0.03 72.99 ± 0.6
P&G Phase B2-2 0.51 ± 0.01 0.46 ± 0.02 0.45 ± 0.04 80.33 ± 1.0
P&G Phase B2-3 0.50 ± 0.01 0.55 ± 0.03 0.54 ± 0.01 72.67 ± 1.6
P&G Phase B2-4 0.50 ± 0.01 0.46 ± 0.01 0.46 ± 0.01 76.82 ± 0.4 Values are presented as mean of the three replicates within the same run ± SD, n=3
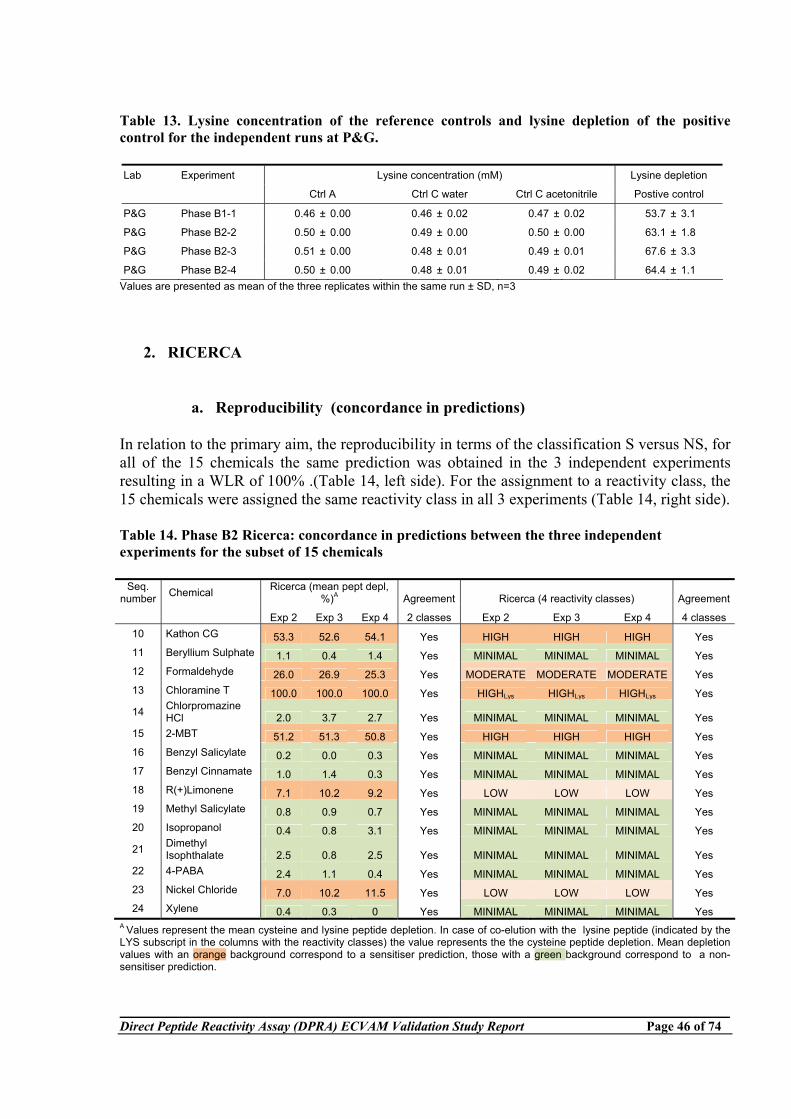
Direct Peptide Reactivity Assay (DPRA) ECVAM Validation Study Report Page 46 of 74
Table 13. Lysine concentration of the reference controls and lysine depletion of the positive control for the independent runs at P&G. Lab Experiment Lysine concentration (mM) Lysine depletion
Ctrl A Ctrl C water Ctrl C acetonitrile Postive control
P&G Phase B1-1 0.46 ± 0.00 0.46 ± 0.02 0.47 ± 0.02 53.7 ± 3.1
P&G Phase B2-2 0.50 ± 0.00 0.49 ± 0.00 0.50 ± 0.00 63.1 ± 1.8
P&G Phase B2-3 0.51 ± 0.00 0.48 ± 0.01 0.49 ± 0.01 67.6 ± 3.3
P&G Phase B2-4 0.50 ± 0.00 0.48 ± 0.01 0.49 ± 0.02 64.4 ± 1.1 Values are presented as mean of the three replicates within the same run ± SD, n=3
2. RICERCA
a. Reproducibility (concordance in predictions) In relation to the primary aim, the reproducibility in terms of the classification S versus NS, for all of the 15 chemicals the same prediction was obtained in the 3 independent experiments resulting in a WLR of 100% .(Table 14, left side). For the assignment to a reactivity class, the 15 chemicals were assigned the same reactivity class in all 3 experiments (Table 14, right side). Table 14. Phase B2 Ricerca: concordance in predictions between the three independent experiments for the subset of 15 chemicals
Seq. number Chemical Ricerca (mean pept depl,
%)A Agreement Ricerca (4 reactivity classes) Agreement Exp 2 Exp 3 Exp 4 2 classes Exp 2 Exp 3 Exp 4 4 classes
10 Kathon CG 53.3 52.6 54.1 Yes HIGH HIGH HIGH Yes 11 Beryllium Sulphate 1.1 0.4 1.4 Yes MINIMAL MINIMAL MINIMAL Yes 12 Formaldehyde 26.0 26.9 25.3 Yes MODERATE MODERATE MODERATE Yes 13 Chloramine T 100.0 100.0 100.0 Yes HIGHLys HIGHLys HIGHLys Yes
14 Chlorpromazine HCl 2.0 3.7 2.7 Yes MINIMAL MINIMAL MINIMAL Yes
15 2-MBT 51.2 51.3 50.8 Yes HIGH HIGH HIGH Yes 16 Benzyl Salicylate 0.2 0.0 0.3 Yes MINIMAL MINIMAL MINIMAL Yes 17 Benzyl Cinnamate 1.0 1.4 0.3 Yes MINIMAL MINIMAL MINIMAL Yes 18 R(+)Limonene 7.1 10.2 9.2 Yes LOW LOW LOW Yes 19 Methyl Salicylate 0.8 0.9 0.7 Yes MINIMAL MINIMAL MINIMAL Yes 20 Isopropanol 0.4 0.8 3.1 Yes MINIMAL MINIMAL MINIMAL Yes
21 Dimethyl Isophthalate 2.5 0.8 2.5 Yes MINIMAL MINIMAL MINIMAL Yes
22 4-PABA 2.4 1.1 0.4 Yes MINIMAL MINIMAL MINIMAL Yes 23 Nickel Chloride 7.0 10.2 11.5 Yes LOW LOW LOW Yes 24 Xylene 0.4 0.3 0 Yes MINIMAL MINIMAL MINIMAL Yes
A Values represent the mean cysteine and lysine peptide depletion. In case of co-elution with the lysine peptide (indicated by the LYS subscript in the columns with the reactivity classes) the value represents the the cysteine peptide depletion. Mean depletion values with an orange background correspond to a sensitiser prediction, those with a green background correspond to a non-sensitiser prediction.
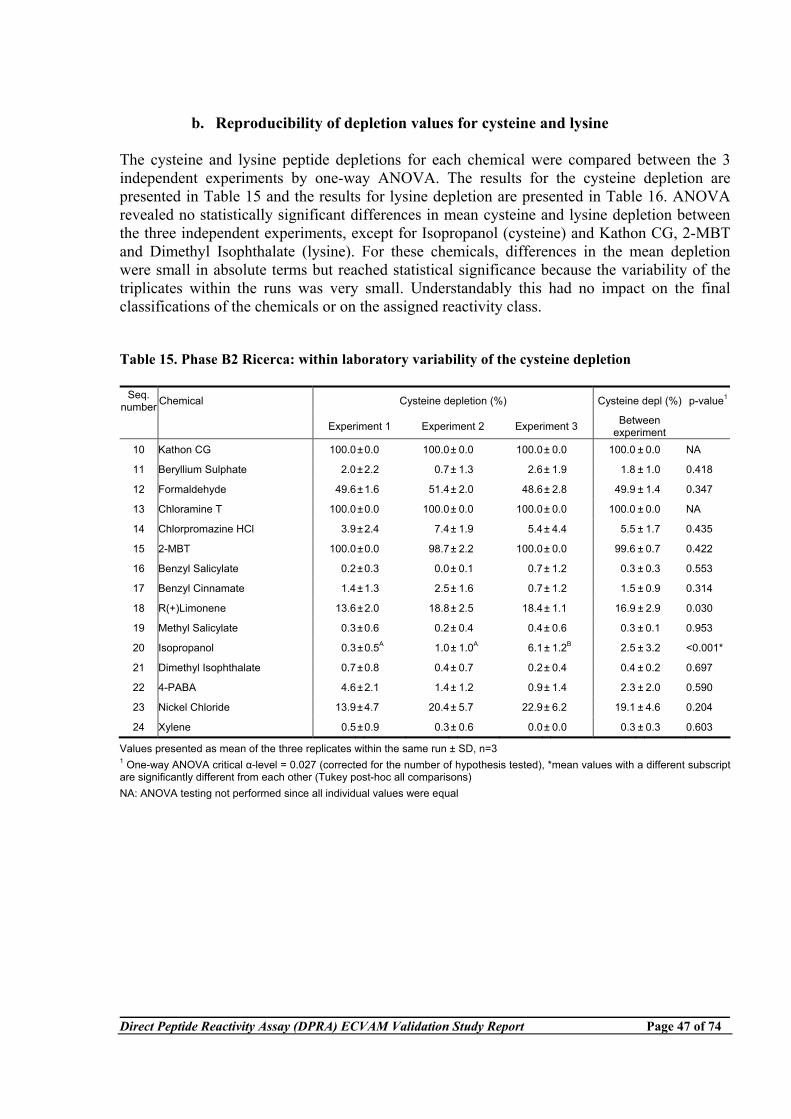
Direct Peptide Reactivity Assay (DPRA) ECVAM Validation Study Report Page 47 of 74
b. Reproducibility of depletion values for cysteine and lysine
The cysteine and lysine peptide depletions for each chemical were compared between the 3 independent experiments by one-way ANOVA. The results for the cysteine depletion are presented in Table 15 and the results for lysine depletion are presented in Table 16. ANOVA revealed no statistically significant differences in mean cysteine and lysine depletion between the three independent experiments, except for Isopropanol (cysteine) and Kathon CG, 2-MBT and Dimethyl Isophthalate (lysine). For these chemicals, differences in the mean depletion were small in absolute terms but reached statistical significance because the variability of the triplicates within the runs was very small. Understandably this had no impact on the final classifications of the chemicals or on the assigned reactivity class. Table 15. Phase B2 Ricerca: within laboratory variability of the cysteine depletion
Seq. number Chemical Cysteine depletion (%) Cysteine depl (%) p-value1
Experiment 1 Experiment 2 Experiment 3 Between experiment
10 Kathon CG 100.0±0.0 100.0± 0.0 100.0± 0.0 100.0 ± 0.0 NA
11 Beryllium Sulphate 2.0±2.2 0.7± 1.3 2.6± 1.9 1.8 ± 1.0 0.418
12 Formaldehyde 49.6±1.6 51.4± 2.0 48.6± 2.8 49.9 ± 1.4 0.347
13 Chloramine T 100.0±0.0 100.0± 0.0 100.0± 0.0 100.0 ± 0.0 NA
14 Chlorpromazine HCl 3.9±2.4 7.4± 1.9 5.4± 4.4 5.5 ± 1.7 0.435
15 2-MBT 100.0±0.0 98.7± 2.2 100.0± 0.0 99.6 ± 0.7 0.422
16 Benzyl Salicylate 0.2±0.3 0.0± 0.1 0.7± 1.2 0.3 ± 0.3 0.553
17 Benzyl Cinnamate 1.4±1.3 2.5± 1.6 0.7± 1.2 1.5 ± 0.9 0.314
18 R(+)Limonene 13.6±2.0 18.8± 2.5 18.4± 1.1 16.9 ± 2.9 0.030
19 Methyl Salicylate 0.3±0.6 0.2± 0.4 0.4± 0.6 0.3 ± 0.1 0.953
20 Isopropanol 0.3±0.5A 1.0± 1.0A 6.1± 1.2B 2.5 ± 3.2 <0.001*
21 Dimethyl Isophthalate 0.7±0.8 0.4± 0.7 0.2± 0.4 0.4 ± 0.2 0.697
22 4-PABA 4.6±2.1 1.4± 1.2 0.9± 1.4 2.3 ± 2.0 0.590
23 Nickel Chloride 13.9±4.7 20.4± 5.7 22.9± 6.2 19.1 ± 4.6 0.204
24 Xylene 0.5±0.9 0.3± 0.6 0.0± 0.0 0.3 ± 0.3 0.603
Values presented as mean of the three replicates within the same run ± SD, n=3 1 One-way ANOVA critical α-level = 0.027 (corrected for the number of hypothesis tested), *mean values with a different subscript are significantly different from each other (Tukey post-hoc all comparisons) NA: ANOVA testing not performed since all individual values were equal
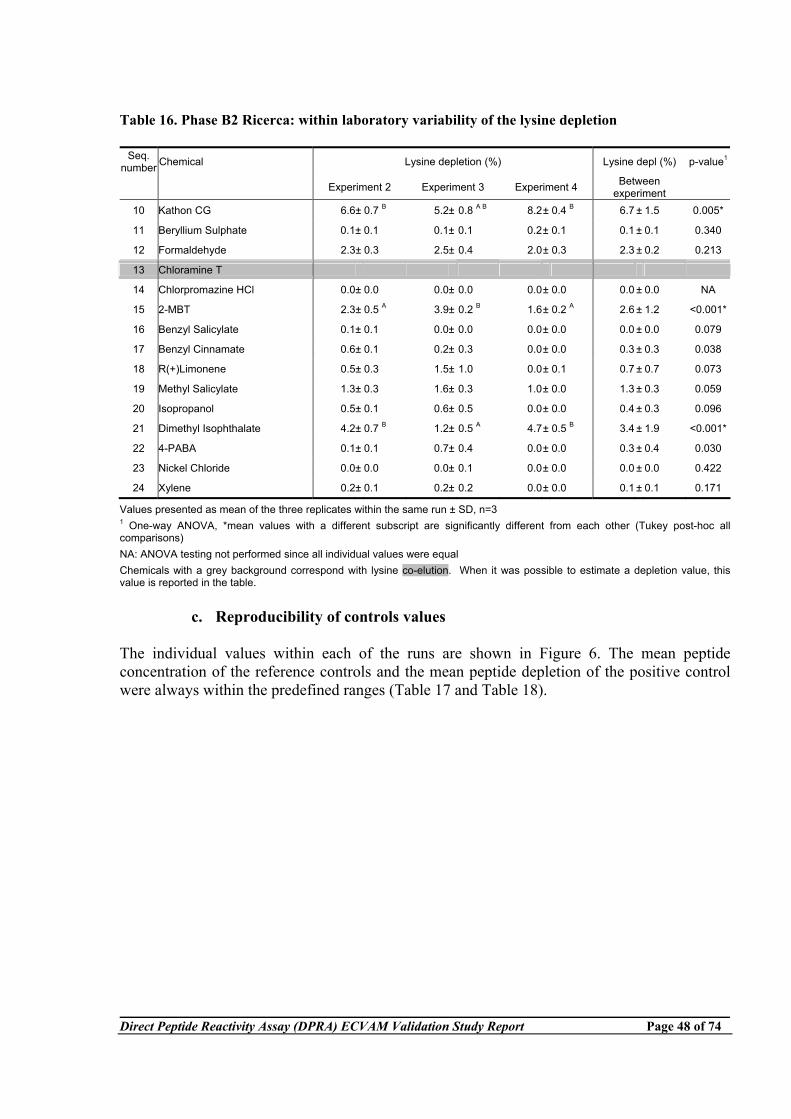
Direct Peptide Reactivity Assay (DPRA) ECVAM Validation Study Report Page 48 of 74
Table 16. Phase B2 Ricerca: within laboratory variability of the lysine depletion
Seq. number Chemical Lysine depletion (%) Lysine depl (%) p-value1
Experiment 2 Experiment 3 Experiment 4 Between experiment
10 Kathon CG 6.6± 0.7 B 5.2± 0.8 A B 8.2± 0.4 B 6.7 ± 1.5 0.005*
11 Beryllium Sulphate 0.1± 0.1 0.1± 0.1 0.2± 0.1 0.1 ± 0.1 0.340
12 Formaldehyde 2.3± 0.3 2.5± 0.4 2.0± 0.3 2.3 ± 0.2 0.213
13 Chloramine T
14 Chlorpromazine HCl 0.0± 0.0 0.0± 0.0 0.0± 0.0 0.0 ± 0.0 NA
15 2-MBT 2.3± 0.5 A 3.9± 0.2 B 1.6± 0.2 A 2.6 ± 1.2 <0.001*
16 Benzyl Salicylate 0.1± 0.1 0.0± 0.0 0.0± 0.0 0.0 ± 0.0 0.079
17 Benzyl Cinnamate 0.6± 0.1 0.2± 0.3 0.0± 0.0 0.3 ± 0.3 0.038
18 R(+)Limonene 0.5± 0.3 1.5± 1.0 0.0± 0.1 0.7 ± 0.7 0.073
19 Methyl Salicylate 1.3± 0.3 1.6± 0.3 1.0± 0.0 1.3 ± 0.3 0.059
20 Isopropanol 0.5± 0.1 0.6± 0.5 0.0± 0.0 0.4 ± 0.3 0.096
21 Dimethyl Isophthalate 4.2± 0.7 B 1.2± 0.5 A 4.7± 0.5 B 3.4 ± 1.9 <0.001*
22 4-PABA 0.1± 0.1 0.7± 0.4 0.0± 0.0 0.3 ± 0.4 0.030
23 Nickel Chloride 0.0± 0.0 0.0± 0.1 0.0± 0.0 0.0 ± 0.0 0.422
24 Xylene 0.2± 0.1 0.2± 0.2 0.0± 0.0 0.1 ± 0.1 0.171
Values presented as mean of the three replicates within the same run ± SD, n=3 1 One-way ANOVA, *mean values with a different subscript are significantly different from each other (Tukey post-hoc all comparisons) NA: ANOVA testing not performed since all individual values were equal Chemicals with a grey background correspond with lysine co-elution. When it was possible to estimate a depletion value, this value is reported in the table.
c. Reproducibility of controls values The individual values within each of the runs are shown in Figure 6. The mean peptide concentration of the reference controls and the mean peptide depletion of the positive control were always within the predefined ranges (Table 17 and Table 18).
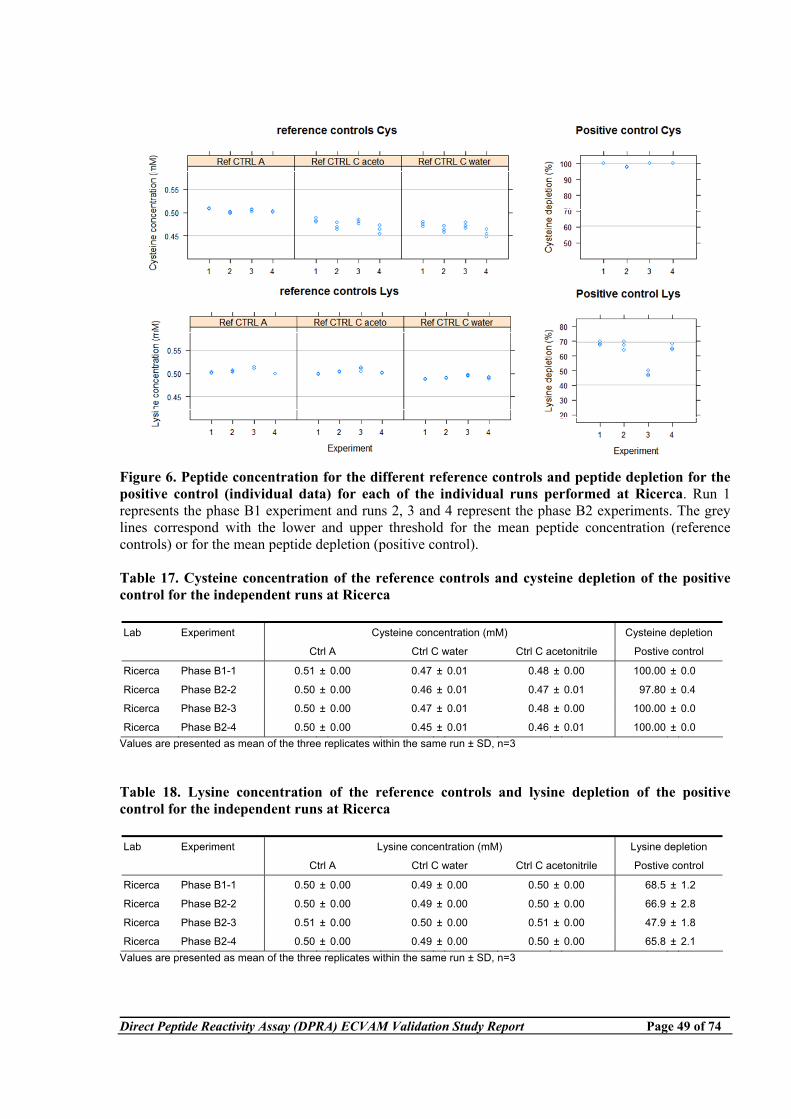
Direct Peptide Reactivity Assay (DPRA) ECVAM Validation Study Report Page 49 of 74
Figure 6. Peptide concentration for the different reference controls and peptide depletion for the positive control (individual data) for each of the individual runs performed at Ricerca. Run 1 represents the phase B1 experiment and runs 2, 3 and 4 represent the phase B2 experiments. The grey lines correspond with the lower and upper threshold for the mean peptide concentration (reference controls) or for the mean peptide depletion (positive control). Table 17. Cysteine concentration of the reference controls and cysteine depletion of the positive control for the independent runs at Ricerca Lab Experiment Cysteine concentration (mM) Cysteine depletion
Ctrl A Ctrl C water Ctrl C acetonitrile Postive control
Ricerca Phase B1-1 0.51 ± 0.00 0.47 ± 0.01 0.48 ± 0.00 100.00 ± 0.0
Ricerca Phase B2-2 0.50 ± 0.00 0.46 ± 0.01 0.47 ± 0.01 97.80 ± 0.4
Ricerca Phase B2-3 0.50 ± 0.00 0.47 ± 0.01 0.48 ± 0.00 100.00 ± 0.0
Ricerca Phase B2-4 0.50 ± 0.00 0.45 ± 0.01 0.46 ± 0.01 100.00 ± 0.0 Values are presented as mean of the three replicates within the same run ± SD, n=3 Table 18. Lysine concentration of the reference controls and lysine depletion of the positive control for the independent runs at Ricerca Lab Experiment Lysine concentration (mM) Lysine depletion
Ctrl A Ctrl C water Ctrl C acetonitrile Postive control
Ricerca Phase B1-1 0.50 ± 0.00 0.49 ± 0.00 0.50 ± 0.00 68.5 ± 1.2
Ricerca Phase B2-2 0.50 ± 0.00 0.49 ± 0.00 0.50 ± 0.00 66.9 ± 2.8
Ricerca Phase B2-3 0.51 ± 0.00 0.50 ± 0.00 0.51 ± 0.00 47.9 ± 1.8
Ricerca Phase B2-4 0.50 ± 0.00 0.49 ± 0.00 0.50 ± 0.00 65.8 ± 2.1 Values are presented as mean of the three replicates within the same run ± SD, n=3
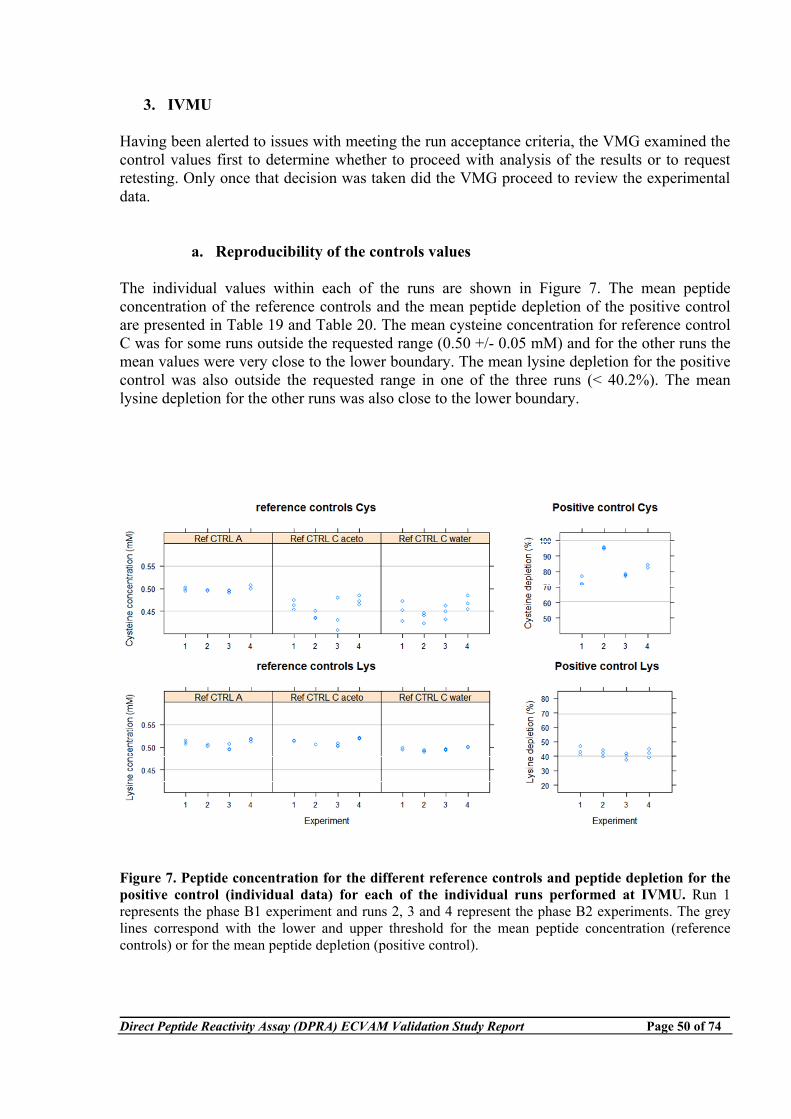
Direct Peptide Reactivity Assay (DPRA) ECVAM Validation Study Report Page 50 of 74
3. IVMU
Having been alerted to issues with meeting the run acceptance criteria, the VMG examined the control values first to determine whether to proceed with analysis of the results or to request retesting. Only once that decision was taken did the VMG proceed to review the experimental data.
a. Reproducibility of the controls values The individual values within each of the runs are shown in Figure 7. The mean peptide concentration of the reference controls and the mean peptide depletion of the positive control are presented in Table 19 and Table 20. The mean cysteine concentration for reference control C was for some runs outside the requested range (0.50 +/- 0.05 mM) and for the other runs the mean values were very close to the lower boundary. The mean lysine depletion for the positive control was also outside the requested range in one of the three runs (< 40.2%). The mean lysine depletion for the other runs was also close to the lower boundary.
Figure 7. Peptide concentration for the different reference controls and peptide depletion for the positive control (individual data) for each of the individual runs performed at IVMU. Run 1 represents the phase B1 experiment and runs 2, 3 and 4 represent the phase B2 experiments. The grey lines correspond with the lower and upper threshold for the mean peptide concentration (reference controls) or for the mean peptide depletion (positive control).
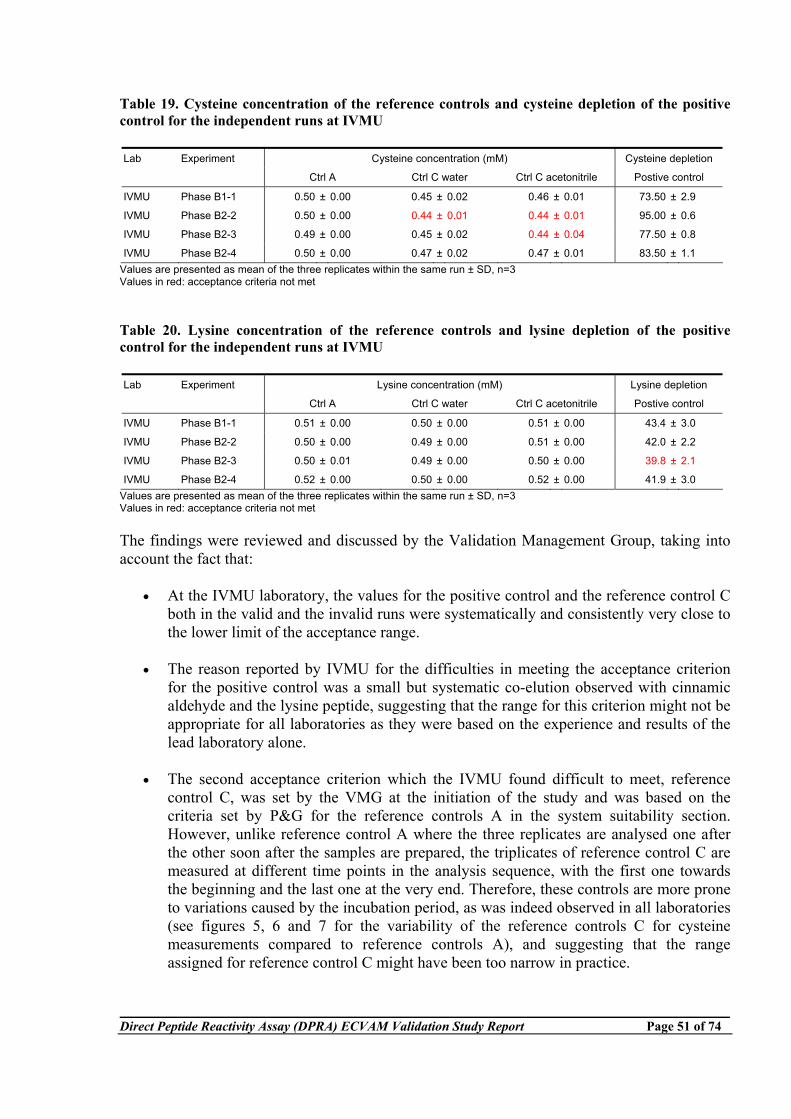
Direct Peptide Reactivity Assay (DPRA) ECVAM Validation Study Report Page 51 of 74
Table 19. Cysteine concentration of the reference controls and cysteine depletion of the positive control for the independent runs at IVMU Lab Experiment Cysteine concentration (mM) Cysteine depletion
Ctrl A Ctrl C water Ctrl C acetonitrile Postive control
IVMU Phase B1-1 0.50 ± 0.00 0.45 ± 0.02 0.46 ± 0.01 73.50 ± 2.9
IVMU Phase B2-2 0.50 ± 0.00 0.44 ± 0.01 0.44 ± 0.01 95.00 ± 0.6
IVMU Phase B2-3 0.49 ± 0.00 0.45 ± 0.02 0.44 ± 0.04 77.50 ± 0.8
IVMU Phase B2-4 0.50 ± 0.00 0.47 ± 0.02 0.47 ± 0.01 83.50 ± 1.1 Values are presented as mean of the three replicates within the same run ± SD, n=3 Values in red: acceptance criteria not met Table 20. Lysine concentration of the reference controls and lysine depletion of the positive control for the independent runs at IVMU Lab Experiment Lysine concentration (mM) Lysine depletion
Ctrl A Ctrl C water Ctrl C acetonitrile Postive control
IVMU Phase B1-1 0.51 ± 0.00 0.50 ± 0.00 0.51 ± 0.00 43.4 ± 3.0
IVMU Phase B2-2 0.50 ± 0.00 0.49 ± 0.00 0.51 ± 0.00 42.0 ± 2.2
IVMU Phase B2-3 0.50 ± 0.01 0.49 ± 0.00 0.50 ± 0.00 39.8 ± 2.1
IVMU Phase B2-4 0.52 ± 0.00 0.50 ± 0.00 0.52 ± 0.00 41.9 ± 3.0 Values are presented as mean of the three replicates within the same run ± SD, n=3 Values in red: acceptance criteria not met The findings were reviewed and discussed by the Validation Management Group, taking into account the fact that:
• At the IVMU laboratory, the values for the positive control and the reference control C both in the valid and the invalid runs were systematically and consistently very close to the lower limit of the acceptance range.
• The reason reported by IVMU for the difficulties in meeting the acceptance criterion
for the positive control was a small but systematic co-elution observed with cinnamic aldehyde and the lysine peptide, suggesting that the range for this criterion might not be appropriate for all laboratories as they were based on the experience and results of the lead laboratory alone.
• The second acceptance criterion which the IVMU found difficult to meet, reference
control C, was set by the VMG at the initiation of the study and was based on the criteria set by P&G for the reference controls A in the system suitability section. However, unlike reference control A where the three replicates are analysed one after the other soon after the samples are prepared, the triplicates of reference control C are measured at different time points in the analysis sequence, with the first one towards the beginning and the last one at the very end. Therefore, these controls are more prone to variations caused by the incubation period, as was indeed observed in all laboratories (see figures 5, 6 and 7 for the variability of the reference controls C for cysteine measurements compared to reference controls A), and suggesting that the range assigned for reference control C might have been too narrow in practice.
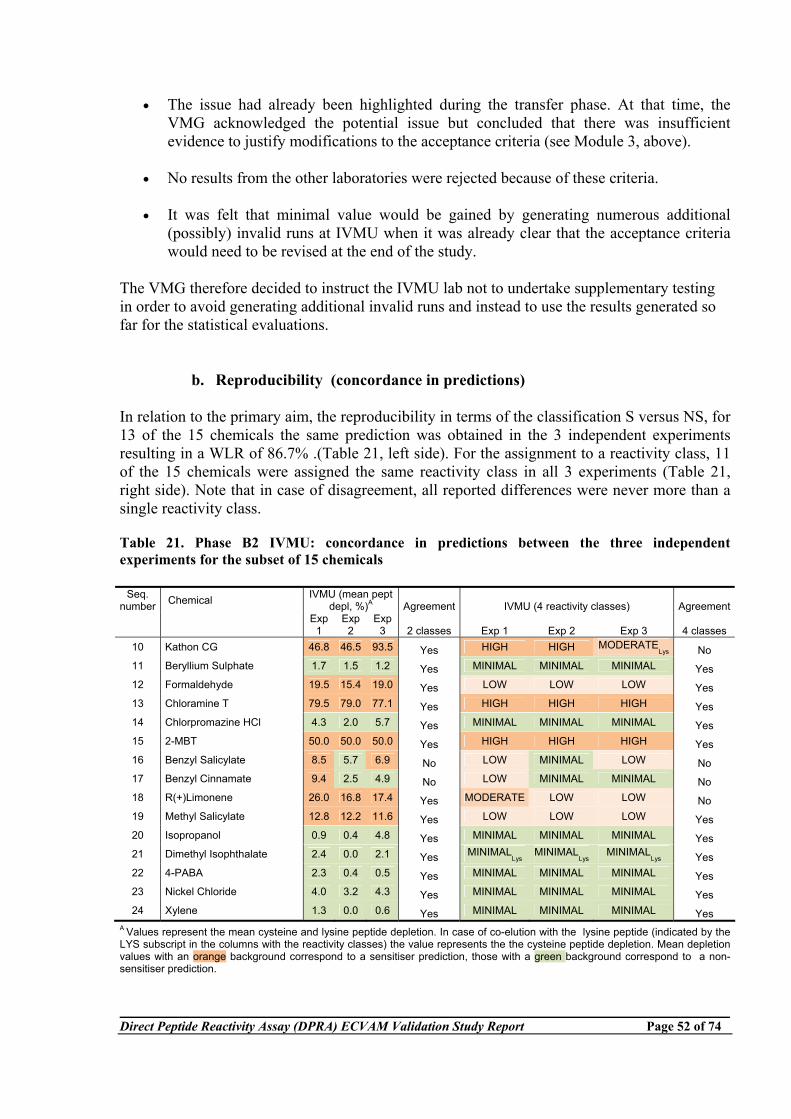
Direct Peptide Reactivity Assay (DPRA) ECVAM Validation Study Report Page 52 of 74
• The issue had already been highlighted during the transfer phase. At that time, the VMG acknowledged the potential issue but concluded that there was insufficient evidence to justify modifications to the acceptance criteria (see Module 3, above).
• No results from the other laboratories were rejected because of these criteria.
• It was felt that minimal value would be gained by generating numerous additional
(possibly) invalid runs at IVMU when it was already clear that the acceptance criteria would need to be revised at the end of the study.
The VMG therefore decided to instruct the IVMU lab not to undertake supplementary testing in order to avoid generating additional invalid runs and instead to use the results generated so far for the statistical evaluations.
b. Reproducibility (concordance in predictions) In relation to the primary aim, the reproducibility in terms of the classification S versus NS, for 13 of the 15 chemicals the same prediction was obtained in the 3 independent experiments resulting in a WLR of 86.7% .(Table 21, left side). For the assignment to a reactivity class, 11 of the 15 chemicals were assigned the same reactivity class in all 3 experiments (Table 21, right side). Note that in case of disagreement, all reported differences were never more than a single reactivity class. Table 21. Phase B2 IVMU: concordance in predictions between the three independent experiments for the subset of 15 chemicals
Seq. number Chemical IVMU (mean pept
depl, %)A Agreement IVMU (4 reactivity classes) Agreement
Exp 1
Exp 2
Exp 3 2 classes Exp 1 Exp 2 Exp 3 4 classes
10 Kathon CG 46.8 46.5 93.5 Yes HIGH HIGH MODERATELys No
11 Beryllium Sulphate 1.7 1.5 1.2 Yes MINIMAL MINIMAL MINIMAL Yes 12 Formaldehyde 19.5 15.4 19.0 Yes LOW LOW LOW Yes 13 Chloramine T 79.5 79.0 77.1 Yes HIGH HIGH HIGH Yes 14 Chlorpromazine HCl 4.3 2.0 5.7 Yes MINIMAL MINIMAL MINIMAL Yes 15 2-MBT 50.0 50.0 50.0 Yes HIGH HIGH HIGH Yes 16 Benzyl Salicylate 8.5 5.7 6.9 No LOW MINIMAL LOW No 17 Benzyl Cinnamate 9.4 2.5 4.9 No LOW MINIMAL MINIMAL No 18 R(+)Limonene 26.0 16.8 17.4 Yes MODERATE LOW LOW No 19 Methyl Salicylate 12.8 12.2 11.6 Yes LOW LOW LOW Yes 20 Isopropanol 0.9 0.4 4.8 Yes MINIMAL MINIMAL MINIMAL Yes 21 Dimethyl Isophthalate 2.4 0.0 2.1 Yes MINIMAL
LysMINIMAL
Lys MINIMAL
Lys Yes 22 4-PABA 2.3 0.4 0.5 Yes MINIMAL MINIMAL MINIMAL Yes 23 Nickel Chloride 4.0 3.2 4.3 Yes MINIMAL MINIMAL MINIMAL Yes 24 Xylene 1.3 0.0 0.6 Yes MINIMAL MINIMAL MINIMAL Yes
A Values represent the mean cysteine and lysine peptide depletion. In case of co-elution with the lysine peptide (indicated by the LYS subscript in the columns with the reactivity classes) the value represents the the cysteine peptide depletion. Mean depletion values with an orange background correspond to a sensitiser prediction, those with a green background correspond to a non-sensitiser prediction.
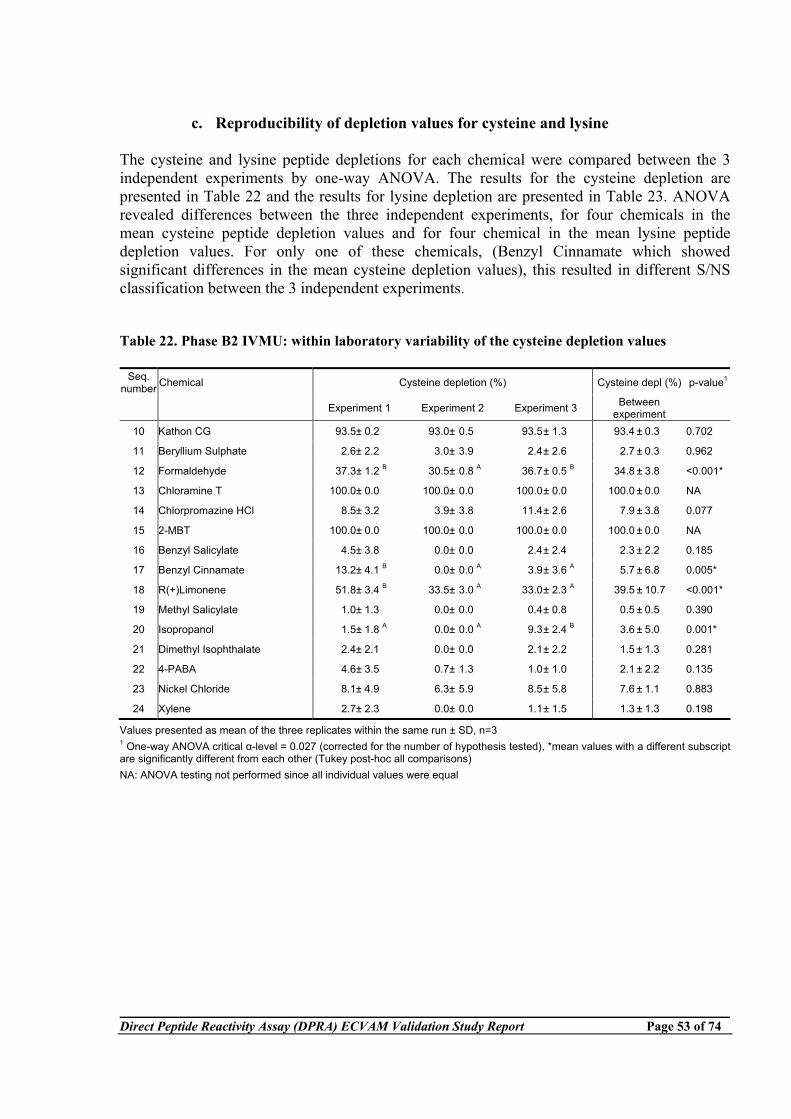
Direct Peptide Reactivity Assay (DPRA) ECVAM Validation Study Report Page 53 of 74
c. Reproducibility of depletion values for cysteine and lysine
The cysteine and lysine peptide depletions for each chemical were compared between the 3 independent experiments by one-way ANOVA. The results for the cysteine depletion are presented in Table 22 and the results for lysine depletion are presented in Table 23. ANOVA revealed differences between the three independent experiments, for four chemicals in the mean cysteine peptide depletion values and for four chemical in the mean lysine peptide depletion values. For only one of these chemicals, (Benzyl Cinnamate which showed significant differences in the mean cysteine depletion values), this resulted in different S/NS classification between the 3 independent experiments.
Table 22. Phase B2 IVMU: within laboratory variability of the cysteine depletion values
Seq. number Chemical Cysteine depletion (%) Cysteine depl (%) p-value1
Experiment 1 Experiment 2 Experiment 3 Between experiment
10 Kathon CG 93.5± 0.2 93.0± 0.5 93.5± 1.3 93.4 ± 0.3 0.702
11 Beryllium Sulphate 2.6± 2.2 3.0± 3.9 2.4± 2.6 2.7 ± 0.3 0.962
12 Formaldehyde 37.3± 1.2 B 30.5± 0.8 A 36.7± 0.5 B 34.8 ± 3.8 <0.001*
13 Chloramine T 100.0± 0.0 100.0± 0.0 100.0± 0.0 100.0 ± 0.0 NA
14 Chlorpromazine HCl 8.5± 3.2 3.9± 3.8 11.4± 2.6 7.9 ± 3.8 0.077
15 2-MBT 100.0± 0.0 100.0± 0.0 100.0± 0.0 100.0 ± 0.0 NA
16 Benzyl Salicylate 4.5± 3.8 0.0± 0.0 2.4± 2.4 2.3 ± 2.2 0.185
17 Benzyl Cinnamate 13.2± 4.1 B 0.0± 0.0 A 3.9± 3.6 A 5.7 ± 6.8 0.005*
18 R(+)Limonene 51.8± 3.4 B 33.5± 3.0 A 33.0± 2.3 A 39.5 ± 10.7 <0.001*
19 Methyl Salicylate 1.0± 1.3 0.0± 0.0 0.4± 0.8 0.5 ± 0.5 0.390
20 Isopropanol 1.5± 1.8 A 0.0± 0.0 A 9.3± 2.4 B 3.6 ± 5.0 0.001*
21 Dimethyl Isophthalate 2.4± 2.1 0.0± 0.0 2.1± 2.2 1.5 ± 1.3 0.281
22 4-PABA 4.6± 3.5 0.7± 1.3 1.0± 1.0 2.1 ± 2.2 0.135
23 Nickel Chloride 8.1± 4.9 6.3± 5.9 8.5± 5.8 7.6 ± 1.1 0.883
24 Xylene 2.7± 2.3 0.0± 0.0 1.1± 1.5 1.3 ± 1.3 0.198
Values presented as mean of the three replicates within the same run ± SD, n=3 1 One-way ANOVA critical α-level = 0.027 (corrected for the number of hypothesis tested), *mean values with a different subscript are significantly different from each other (Tukey post-hoc all comparisons) NA: ANOVA testing not performed since all individual values were equal
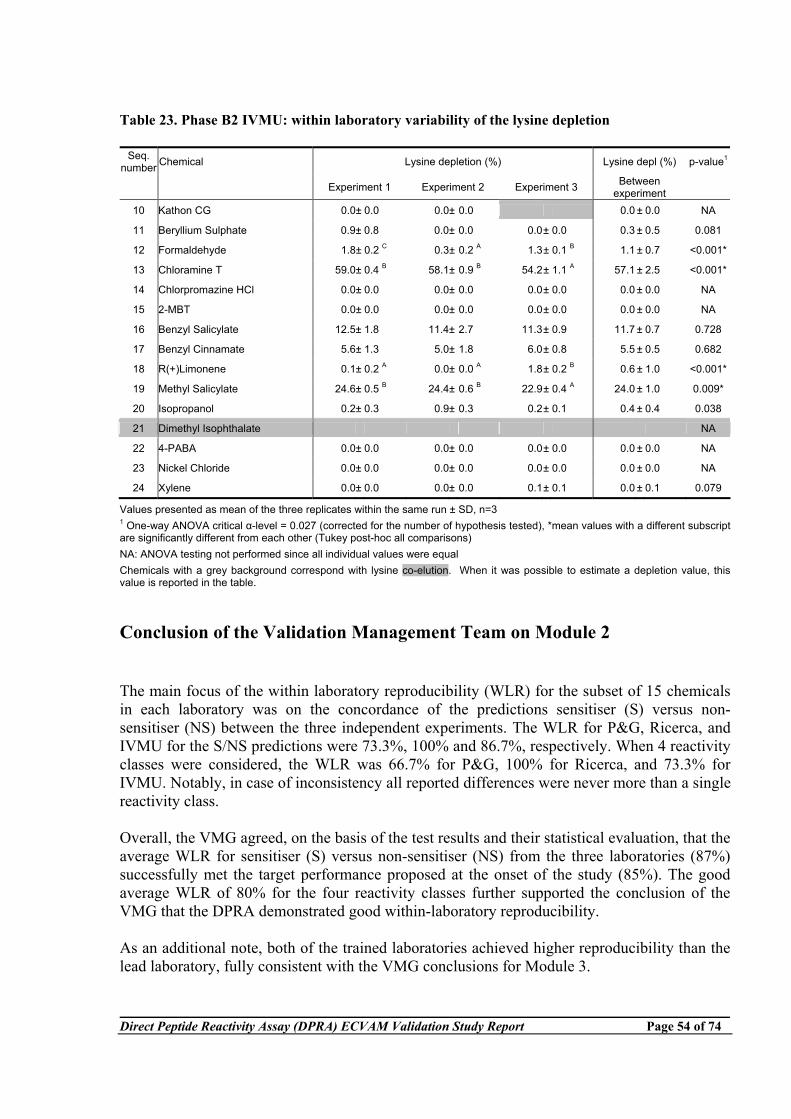
Direct Peptide Reactivity Assay (DPRA) ECVAM Validation Study Report Page 54 of 74
Table 23. Phase B2 IVMU: within laboratory variability of the lysine depletion
Seq. number Chemical Lysine depletion (%) Lysine depl (%) p-value1
Experiment 1 Experiment 2 Experiment 3 Between experiment
10 Kathon CG 0.0± 0.0 0.0± 0.0 0.0 ± 0.0 NA
11 Beryllium Sulphate 0.9± 0.8 0.0± 0.0 0.0± 0.0 0.3 ± 0.5 0.081
12 Formaldehyde 1.8± 0.2 C 0.3± 0.2 A 1.3± 0.1 B 1.1 ± 0.7 <0.001*
13 Chloramine T 59.0± 0.4 B 58.1± 0.9 B 54.2± 1.1 A 57.1 ± 2.5 <0.001*
14 Chlorpromazine HCl 0.0± 0.0 0.0± 0.0 0.0± 0.0 0.0 ± 0.0 NA
15 2-MBT 0.0± 0.0 0.0± 0.0 0.0± 0.0 0.0 ± 0.0 NA
16 Benzyl Salicylate 12.5± 1.8 11.4± 2.7 11.3± 0.9 11.7 ± 0.7 0.728
17 Benzyl Cinnamate 5.6± 1.3 5.0± 1.8 6.0± 0.8 5.5 ± 0.5 0.682
18 R(+)Limonene 0.1± 0.2 A 0.0± 0.0 A 1.8± 0.2 B 0.6 ± 1.0 <0.001*
19 Methyl Salicylate 24.6± 0.5 B 24.4± 0.6 B 22.9± 0.4 A 24.0 ± 1.0 0.009*
20 Isopropanol 0.2± 0.3 0.9± 0.3 0.2± 0.1 0.4 ± 0.4 0.038
21 Dimethyl Isophthalate NA
22 4-PABA 0.0± 0.0 0.0± 0.0 0.0± 0.0 0.0 ± 0.0 NA
23 Nickel Chloride 0.0± 0.0 0.0± 0.0 0.0± 0.0 0.0 ± 0.0 NA
24 Xylene 0.0± 0.0 0.0± 0.0 0.1± 0.1 0.0 ± 0.1 0.079
Values presented as mean of the three replicates within the same run ± SD, n=3 1 One-way ANOVA critical α-level = 0.027 (corrected for the number of hypothesis tested), *mean values with a different subscript are significantly different from each other (Tukey post-hoc all comparisons) NA: ANOVA testing not performed since all individual values were equal Chemicals with a grey background correspond with lysine co-elution. When it was possible to estimate a depletion value, this value is reported in the table.
Conclusion of the Validation Management Team on Module 2 The main focus of the within laboratory reproducibility (WLR) for the subset of 15 chemicals in each laboratory was on the concordance of the predictions sensitiser (S) versus non-sensitiser (NS) between the three independent experiments. The WLR for P&G, Ricerca, and IVMU for the S/NS predictions were 73.3%, 100% and 86.7%, respectively. When 4 reactivity classes were considered, the WLR was 66.7% for P&G, 100% for Ricerca, and 73.3% for IVMU. Notably, in case of inconsistency all reported differences were never more than a single reactivity class. Overall, the VMG agreed, on the basis of the test results and their statistical evaluation, that the average WLR for sensitiser (S) versus non-sensitiser (NS) from the three laboratories (87%) successfully met the target performance proposed at the onset of the study (85%). The good average WLR of 80% for the four reactivity classes further supported the conclusion of the VMG that the DPRA demonstrated good within-laboratory reproducibility. As an additional note, both of the trained laboratories achieved higher reproducibility than the lead laboratory, fully consistent with the VMG conclusions for Module 3.
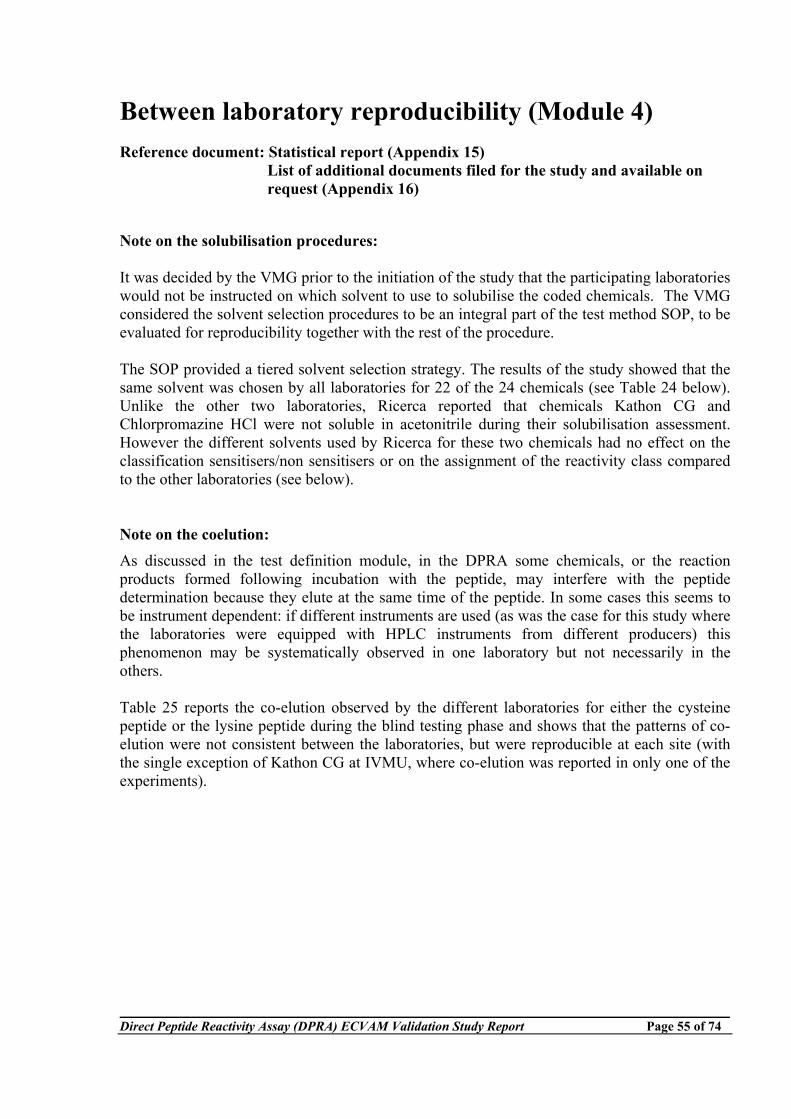
Direct Peptide Reactivity Assay (DPRA) ECVAM Validation Study Report Page 55 of 74
Between laboratory reproducibility (Module 4) Reference document: Statistical report (Appendix 15) List of additional documents filed for the study and available on request (Appendix 16) Note on the solubilisation procedures: It was decided by the VMG prior to the initiation of the study that the participating laboratories would not be instructed on which solvent to use to solubilise the coded chemicals. The VMG considered the solvent selection procedures to be an integral part of the test method SOP, to be evaluated for reproducibility together with the rest of the procedure. The SOP provided a tiered solvent selection strategy. The results of the study showed that the same solvent was chosen by all laboratories for 22 of the 24 chemicals (see Table 24 below). Unlike the other two laboratories, Ricerca reported that chemicals Kathon CG and Chlorpromazine HCl were not soluble in acetonitrile during their solubilisation assessment. However the different solvents used by Ricerca for these two chemicals had no effect on the classification sensitisers/non sensitisers or on the assignment of the reactivity class compared to the other laboratories (see below). Note on the coelution: As discussed in the test definition module, in the DPRA some chemicals, or the reaction products formed following incubation with the peptide, may interfere with the peptide determination because they elute at the same time of the peptide. In some cases this seems to be instrument dependent: if different instruments are used (as was the case for this study where the laboratories were equipped with HPLC instruments from different producers) this phenomenon may be systematically observed in one laboratory but not necessarily in the others. Table 25 reports the co-elution observed by the different laboratories for either the cysteine peptide or the lysine peptide during the blind testing phase and shows that the patterns of co-elution were not consistent between the laboratories, but were reproducible at each site (with the single exception of Kathon CG at IVMU, where co-elution was reported in only one of the experiments).
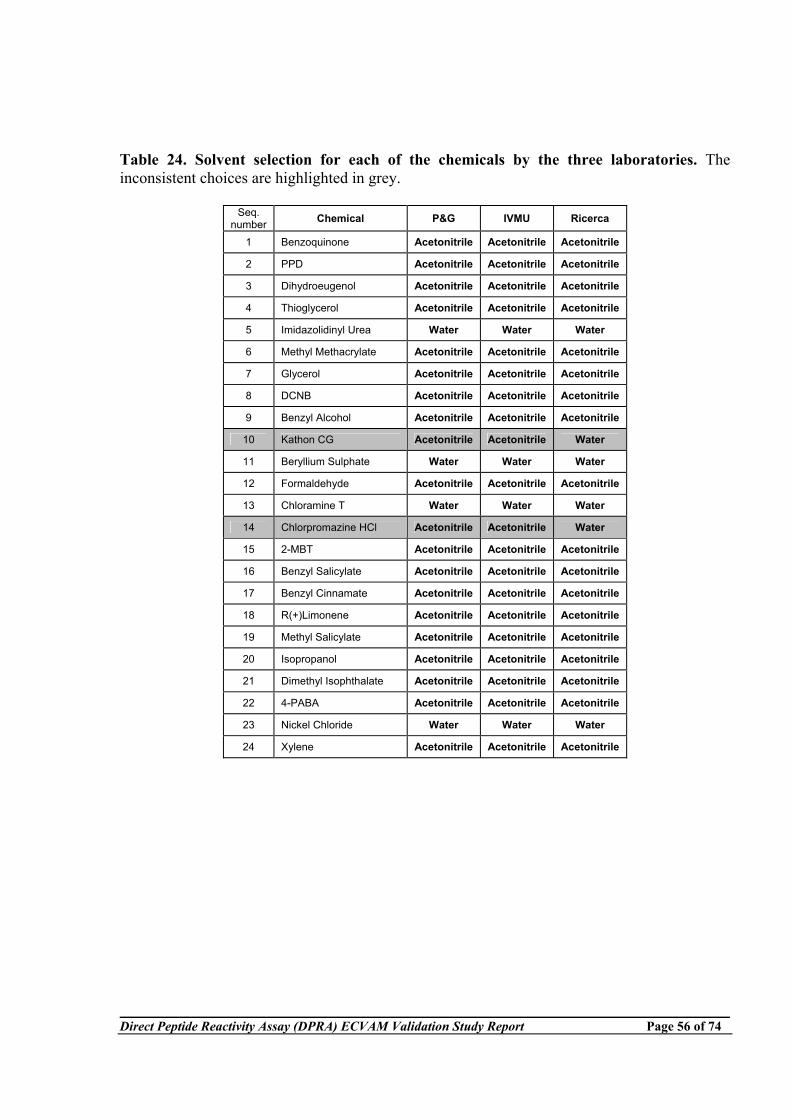
Direct Peptide Reactivity Assay (DPRA) ECVAM Validation Study Report Page 56 of 74
Table 24. Solvent selection for each of the chemicals by the three laboratories. The inconsistent choices are highlighted in grey.
Seq. number Chemical P&G IVMU Ricerca
1 Benzoquinone Acetonitrile Acetonitrile Acetonitrile
2 PPD Acetonitrile Acetonitrile Acetonitrile
3 Dihydroeugenol Acetonitrile Acetonitrile Acetonitrile
4 Thioglycerol Acetonitrile Acetonitrile Acetonitrile
5 Imidazolidinyl Urea Water Water Water
6 Methyl Methacrylate Acetonitrile Acetonitrile Acetonitrile
7 Glycerol Acetonitrile Acetonitrile Acetonitrile
8 DCNB Acetonitrile Acetonitrile Acetonitrile
9 Benzyl Alcohol Acetonitrile Acetonitrile Acetonitrile
10 Kathon CG Acetonitrile Acetonitrile Water
11 Beryllium Sulphate Water Water Water
12 Formaldehyde Acetonitrile Acetonitrile Acetonitrile
13 Chloramine T Water Water Water
14 Chlorpromazine HCl Acetonitrile Acetonitrile Water
15 2-MBT Acetonitrile Acetonitrile Acetonitrile
16 Benzyl Salicylate Acetonitrile Acetonitrile Acetonitrile
17 Benzyl Cinnamate Acetonitrile Acetonitrile Acetonitrile
18 R(+)Limonene Acetonitrile Acetonitrile Acetonitrile
19 Methyl Salicylate Acetonitrile Acetonitrile Acetonitrile
20 Isopropanol Acetonitrile Acetonitrile Acetonitrile
21 Dimethyl Isophthalate Acetonitrile Acetonitrile Acetonitrile
22 4-PABA Acetonitrile Acetonitrile Acetonitrile
23 Nickel Chloride Water Water Water
24 Xylene Acetonitrile Acetonitrile Acetonitrile
Direct Peptide Reactivity Assay (DPRA) ECVAM Validation Study Report Page 57 of 74
Table 25. Co-elution reported for each of the chemicals in the three laboratories.
Seq. number Chemical P&G IVMU Ricerca
1 Benzoquinone - - LYS 2 PPD - - CYS/LYS 3 Dihydroeugenol - - LYS 4 Thioglycerol LYS CYS/LYS CYS/LYS 5 Imidazolidinyl Urea - - - 6 Methyl Methacrylate CYS/LYS - CYS/LYS 7 Glycerol - - - 8 DCNB - - - 9 Benzyl Alcohol - - -
10 Kathon CG LYS LYS LYS - - LYS - - - 11 Beryllium Sulphate - - - - - - - - - 12 Formaldehyde - - - - - - - - - 13 Chloramine T LYS LYS LYS - - - LYS LYS LYS 14 Chlorpromazine HCl - - - - - - - - - 15 2-MBT LYS LYS LYS - - - - - - 16 Benzyl Salicylate - - - - - - - - - 17 Benzyl Cinnamate - - - - - - - - - 18 R(+)Limonene - - - - - - - - - 19 Methyl Salicylate - - - - - - - - - 20 Isopropanol - - - - - - - - -
21 Dimethyl Isophthalate LYS LYS LYS LYS LYS LYS - - -
22 4-PABA - - - - - - - - - 23 Nickel Chloride - - - - - - - - - 24 Xylene - - - - - - - - -
Of the nine chemicals shown above to have different reported patterns of co-elution, only one (Dihydroeugenol) was not consistently classified (sensitisers/non sensitisers) by the three laboratories, demonstrating that the DPRA test method and prediction model are robust enough to accommodate different instances of co-elution caused by the specific equipment used and the fact that in the case of the cysteine co-elution the depletion values have to be estimated rather then measured.
1. Reproducibility (concordance in predictions) The between laboratory reproducibility was assessed on the basis of the 24 chemicals tested (9 chemicals tested once and 15 chemicals tested 3 times in each laboratory). The main focus of the evaluation of the between-laboratory reproducibility was on the concordance of the predictions sensitisers (S) versus non-sensitisers (NS) and for the assignment to one of the four reactivity classes. As discussed in the WLR section, descriptive and inferential statistical analyses were also performed on the raw peptide depletion data (ANOVA) but were not relied upon by the VMG to determine to what extent the primary objective of the study had been satisfied. For the evaluation of the BLR, the final prediction for the chemicals that were tested 3 times (chemicals 10 to 24) in each laboratory was based on the classification obtained using the
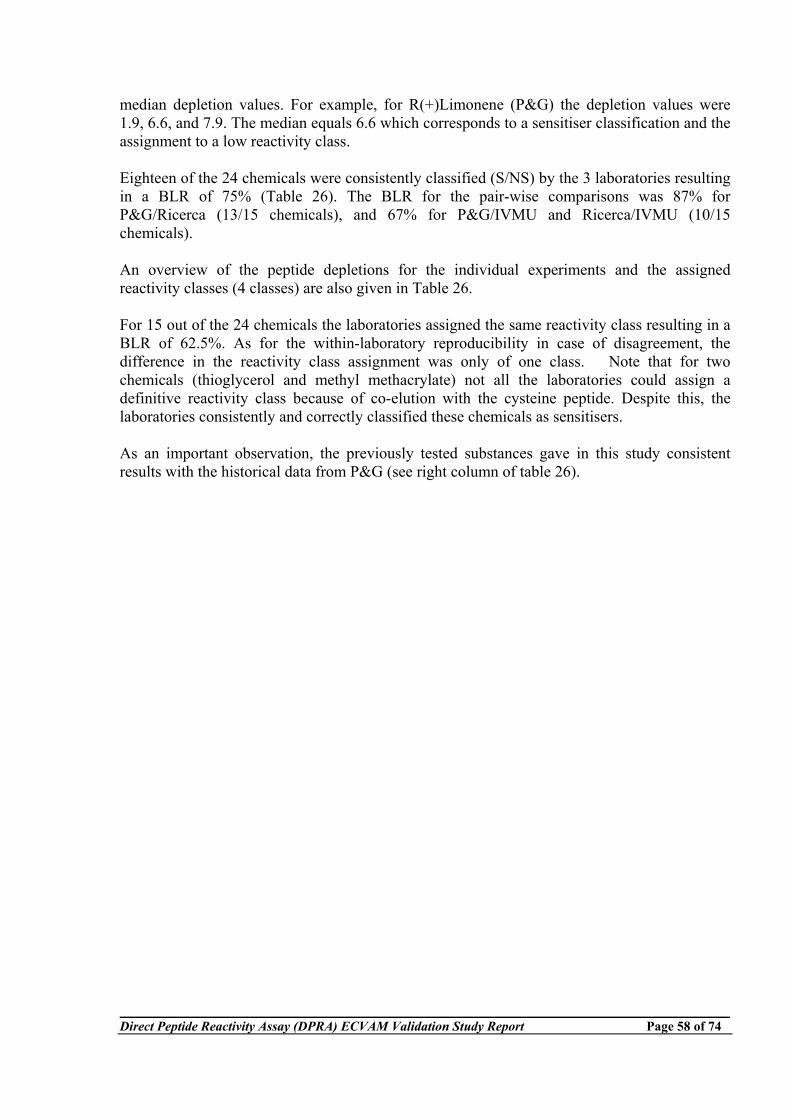
Direct Peptide Reactivity Assay (DPRA) ECVAM Validation Study Report Page 58 of 74
median depletion values. For example, for R(+)Limonene (P&G) the depletion values were 1.9, 6.6, and 7.9. The median equals 6.6 which corresponds to a sensitiser classification and the assignment to a low reactivity class. Eighteen of the 24 chemicals were consistently classified (S/NS) by the 3 laboratories resulting in a BLR of 75% (Table 26). The BLR for the pair-wise comparisons was 87% for P&G/Ricerca (13/15 chemicals), and 67% for P&G/IVMU and Ricerca/IVMU (10/15 chemicals). An overview of the peptide depletions for the individual experiments and the assigned reactivity classes (4 classes) are also given in Table 26. For 15 out of the 24 chemicals the laboratories assigned the same reactivity class resulting in a BLR of 62.5%. As for the within-laboratory reproducibility in case of disagreement, the difference in the reactivity class assignment was only of one class. Note that for two chemicals (thioglycerol and methyl methacrylate) not all the laboratories could assign a definitive reactivity class because of co-elution with the cysteine peptide. Despite this, the laboratories consistently and correctly classified these chemicals as sensitisers. As an important observation, the previously tested substances gave in this study consistent results with the historical data from P&G (see right column of table 26).
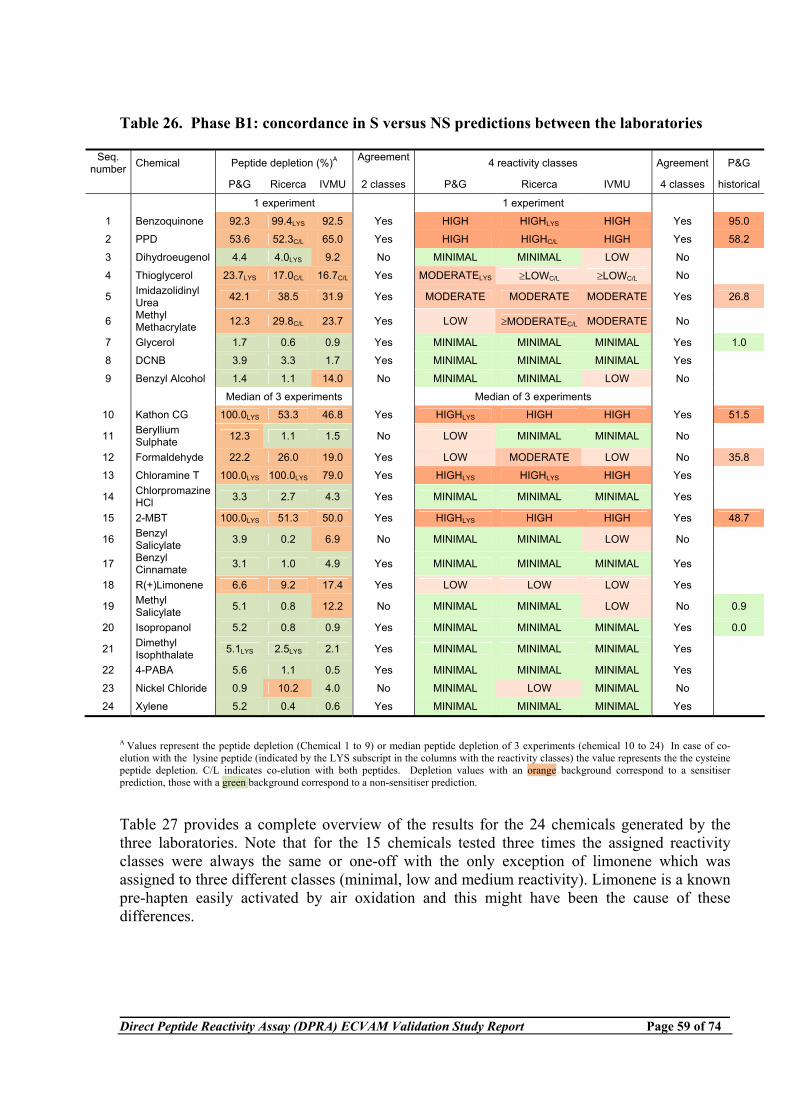
Direct Peptide Reactivity Assay (DPRA) ECVAM Validation Study Report Page 59 of 74
Table 26. Phase B1: concordance in S versus NS predictions between the laboratories
A Values represent the peptide depletion (Chemical 1 to 9) or median peptide depletion of 3 experiments (chemical 10 to 24) In case of co-elution with the lysine peptide (indicated by the LYS subscript in the columns with the reactivity classes) the value represents the the cysteine peptide depletion. C/L indicates co-elution with both peptides. Depletion values with an orange background correspond to a sensitiser prediction, those with a green background correspond to a non-sensitiser prediction.
Table 27 provides a complete overview of the results for the 24 chemicals generated by the three laboratories. Note that for the 15 chemicals tested three times the assigned reactivity classes were always the same or one-off with the only exception of limonene which was assigned to three different classes (minimal, low and medium reactivity). Limonene is a known pre-hapten easily activated by air oxidation and this might have been the cause of these differences.
Seq. number Chemical Peptide depletion (%)A Agreement
4 reactivity classes Agreement P&G
P&G Ricerca IVMU 2 classes P&G Ricerca IVMU 4 classes historical
1 experiment 1 experiment
1 Benzoquinone 92.3 99.4LYS 92.5 Yes HIGH HIGHLYS HIGH Yes 95.0
2 PPD 53.6 52.3C/L 65.0 Yes HIGH HIGHC/L HIGH Yes 58.2
3 Dihydroeugenol 4.4 4.0LYS 9.2 No MINIMAL MINIMAL LOW No
4 Thioglycerol 23.7LYS 17.0C/L 16.7C/L Yes MODERATELYS ≥LOWC/L ≥LOWC/L No
5 Imidazolidinyl Urea 42.1 38.5 31.9 Yes MODERATE MODERATE MODERATE Yes 26.8
6 Methyl Methacrylate 12.3 29.8C/L 23.7 Yes LOW ≥MODERATEC/L MODERATE No
7 Glycerol 1.7 0.6 0.9 Yes MINIMAL MINIMAL MINIMAL Yes 1.0
8 DCNB 3.9 3.3 1.7 Yes MINIMAL MINIMAL MINIMAL Yes
9 Benzyl Alcohol 1.4 1.1 14.0 No MINIMAL MINIMAL LOW No
Median of 3 experiments Median of 3 experiments
10 Kathon CG 100.0LYS 53.3 46.8 Yes HIGHLYS HIGH HIGH Yes 51.5
11 Beryllium Sulphate 12.3 1.1 1.5 No LOW MINIMAL MINIMAL No
12 Formaldehyde 22.2 26.0 19.0 Yes LOW MODERATE LOW No 35.8
13 Chloramine T 100.0LYS 100.0LYS 79.0 Yes HIGHLYS HIGHLYS HIGH Yes
14 Chlorpromazine HCl 3.3 2.7 4.3 Yes MINIMAL MINIMAL MINIMAL Yes
15 2-MBT 100.0LYS 51.3 50.0 Yes HIGHLYS HIGH HIGH Yes 48.7
16 Benzyl Salicylate 3.9 0.2 6.9 No MINIMAL MINIMAL LOW No
17 Benzyl Cinnamate 3.1 1.0 4.9 Yes MINIMAL MINIMAL MINIMAL Yes
18 R(+)Limonene 6.6 9.2 17.4 Yes LOW LOW LOW Yes
19 Methyl Salicylate 5.1 0.8 12.2 No MINIMAL MINIMAL LOW No 0.9
20 Isopropanol 5.2 0.8 0.9 Yes MINIMAL MINIMAL MINIMAL Yes 0.0
21 Dimethyl Isophthalate 5.1LYS 2.5LYS 2.1 Yes MINIMAL MINIMAL MINIMAL Yes
22 4-PABA 5.6 1.1 0.5 Yes MINIMAL MINIMAL MINIMAL Yes
23 Nickel Chloride 0.9 10.2 4.0 No MINIMAL LOW MINIMAL No
24 Xylene 5.2 0.4 0.6 Yes MINIMAL MINIMAL MINIMAL Yes
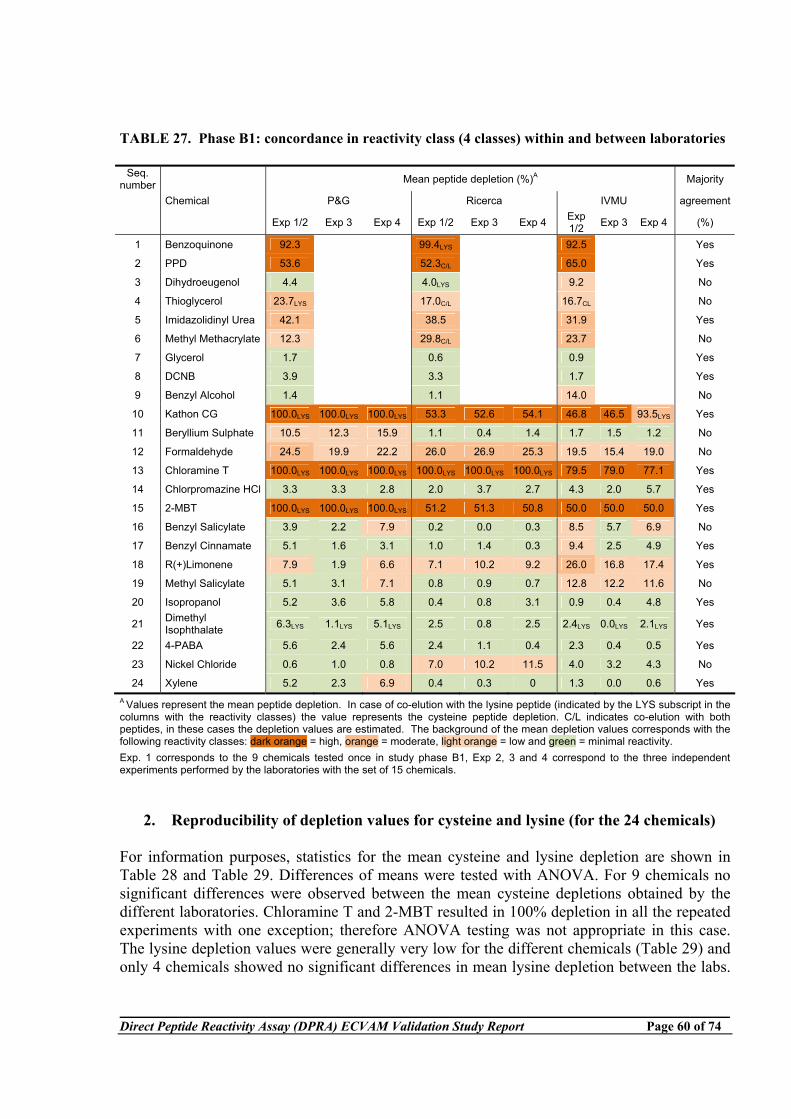
Direct Peptide Reactivity Assay (DPRA) ECVAM Validation Study Report Page 60 of 74
TABLE 27. Phase B1: concordance in reactivity class (4 classes) within and between laboratories
Seq. number Mean peptide depletion (%)A Majority
Chemical P&G Ricerca IVMU agreement
Exp 1/2 Exp 3 Exp 4 Exp 1/2 Exp 3 Exp 4 Exp 1/2 Exp 3 Exp 4 (%)
1 Benzoquinone 92.3 99.4LYS 92.5 Yes
2 PPD 53.6 52.3C/L 65.0 Yes
3 Dihydroeugenol 4.4 4.0LYS 9.2 No
4 Thioglycerol 23.7LYS 17.0C/L 16.7CL No
5 Imidazolidinyl Urea 42.1 38.5 31.9 Yes
6 Methyl Methacrylate 12.3 29.8C/L 23.7 No
7 Glycerol 1.7 0.6 0.9 Yes
8 DCNB 3.9 3.3 1.7 Yes
9 Benzyl Alcohol 1.4 1.1 14.0 No
10 Kathon CG 100.0LYS 100.0LYS 100.0LYS 53.3 52.6 54.1 46.8 46.5 93.5LYS Yes
11 Beryllium Sulphate 10.5 12.3 15.9 1.1 0.4 1.4 1.7 1.5 1.2 No
12 Formaldehyde 24.5 19.9 22.2 26.0 26.9 25.3 19.5 15.4 19.0 No
13 Chloramine T 100.0LYS 100.0LYS 100.0LYS 100.0LYS 100.0LYS 100.0LYS 79.5 79.0 77.1 Yes
14 Chlorpromazine HCl 3.3 3.3 2.8 2.0 3.7 2.7 4.3 2.0 5.7 Yes
15 2-MBT 100.0LYS 100.0LYS 100.0LYS 51.2 51.3 50.8 50.0 50.0 50.0 Yes
16 Benzyl Salicylate 3.9 2.2 7.9 0.2 0.0 0.3 8.5 5.7 6.9 No
17 Benzyl Cinnamate 5.1 1.6 3.1 1.0 1.4 0.3 9.4 2.5 4.9 Yes
18 R(+)Limonene 7.9 1.9 6.6 7.1 10.2 9.2 26.0 16.8 17.4 Yes
19 Methyl Salicylate 5.1 3.1 7.1 0.8 0.9 0.7 12.8 12.2 11.6 No
20 Isopropanol 5.2 3.6 5.8 0.4 0.8 3.1 0.9 0.4 4.8 Yes
21 Dimethyl Isophthalate 6.3LYS 1.1LYS 5.1LYS 2.5 0.8 2.5 2.4LYS 0.0LYS 2.1LYS Yes
22 4-PABA 5.6 2.4 5.6 2.4 1.1 0.4 2.3 0.4 0.5 Yes
23 Nickel Chloride 0.6 1.0 0.8 7.0 10.2 11.5 4.0 3.2 4.3 No
24 Xylene 5.2 2.3 6.9 0.4 0.3 0 1.3 0.0 0.6 Yes A Values represent the mean peptide depletion. In case of co-elution with the lysine peptide (indicated by the LYS subscript in the columns with the reactivity classes) the value represents the cysteine peptide depletion. C/L indicates co-elution with both peptides, in these cases the depletion values are estimated. The background of the mean depletion values corresponds with the following reactivity classes: dark orange = high, orange = moderate, light orange = low and green = minimal reactivity. Exp. 1 corresponds to the 9 chemicals tested once in study phase B1, Exp 2, 3 and 4 correspond to the three independent experiments performed by the laboratories with the set of 15 chemicals.
2. Reproducibility of depletion values for cysteine and lysine (for the 24 chemicals) For information purposes, statistics for the mean cysteine and lysine depletion are shown in Table 28 and Table 29. Differences of means were tested with ANOVA. For 9 chemicals no significant differences were observed between the mean cysteine depletions obtained by the different laboratories. Chloramine T and 2-MBT resulted in 100% depletion in all the repeated experiments with one exception; therefore ANOVA testing was not appropriate in this case. The lysine depletion values were generally very low for the different chemicals (Table 29) and only 4 chemicals showed no significant differences in mean lysine depletion between the labs.
Direct Peptide Reactivity Assay (DPRA) ECVAM Validation Study Report Page 61 of 74
The variability within the experiments was also low in the majority of the cases which resulted in significant differences between and within the laboratories for 17 of the 24 chemicals.
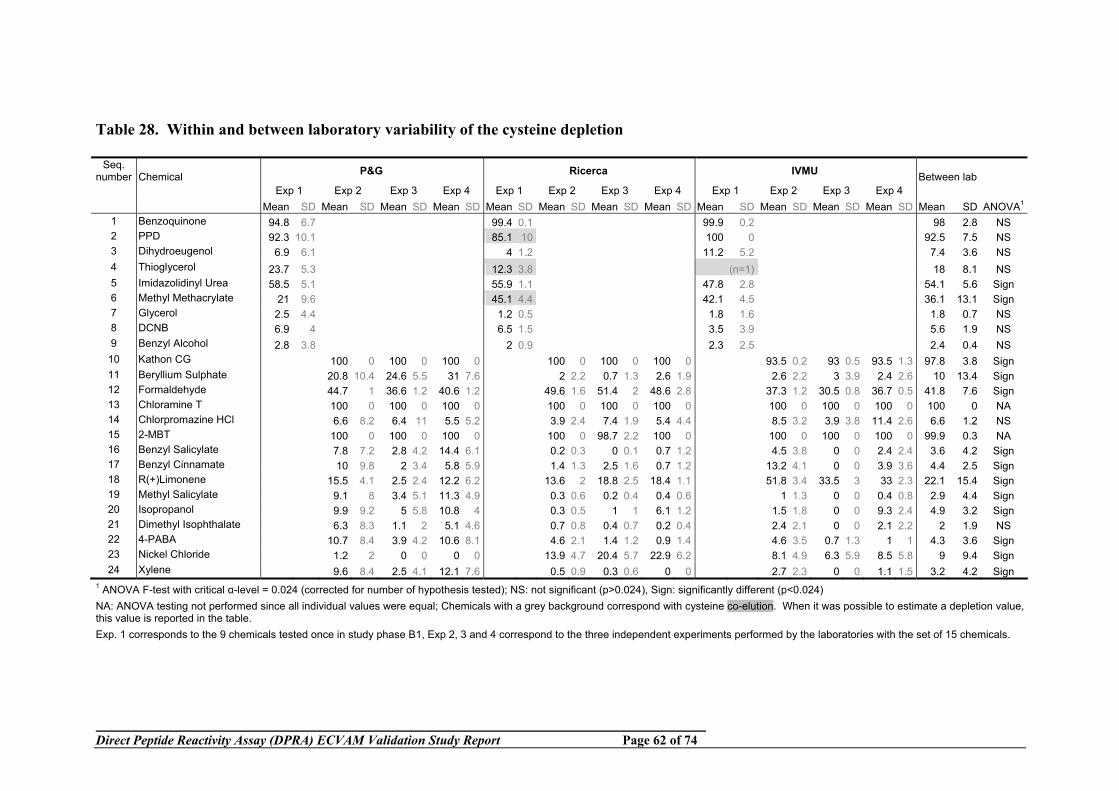
Direct Peptide Reactivity Assay (DPRA) ECVAM Validation Study Report Page 62 of 74
Table 28. Within and between laboratory variability of the cysteine depletion
Seq. number Chemical P&G Ricerca IVMU Between lab
Exp 1 Exp 2 Exp 3 Exp 4 Exp 1 Exp 2 Exp 3 Exp 4 Exp 1 Exp 2 Exp 3 Exp 4 Mean SD Mean SD Mean SD Mean SD Mean SD Mean SD Mean SD Mean SD Mean SD Mean SD Mean SD Mean SD Mean SD ANOVA1
1 Benzoquinone 94.8 6.7 99.4 0.1 99.9 0.2 98 2.8 NS 2 PPD 92.3 10.1 85.1 10 100 0 92.5 7.5 NS 3 Dihydroeugenol 6.9 6.1 4 1.2 11.2 5.2 7.4 3.6 NS 4 Thioglycerol 23.7 5.3 12.3 3.8 (n=1) 18 8.1 NS 5 Imidazolidinyl Urea 58.5 5.1 55.9 1.1 47.8 2.8 54.1 5.6 Sign 6 Methyl Methacrylate 21 9.6 45.1 4.4 42.1 4.5 36.1 13.1 Sign 7 Glycerol 2.5 4.4 1.2 0.5 1.8 1.6 1.8 0.7 NS 8 DCNB 6.9 4 6.5 1.5 3.5 3.9 5.6 1.9 NS 9 Benzyl Alcohol 2.8 3.8 2 0.9 2.3 2.5 2.4 0.4 NS
10 Kathon CG 100 0 100 0 100 0 100 0 100 0 100 0 93.5 0.2 93 0.5 93.5 1.3 97.8 3.8 Sign 11 Beryllium Sulphate 20.8 10.4 24.6 5.5 31 7.6 2 2.2 0.7 1.3 2.6 1.9 2.6 2.2 3 3.9 2.4 2.6 10 13.4 Sign 12 Formaldehyde 44.7 1 36.6 1.2 40.6 1.2 49.6 1.6 51.4 2 48.6 2.8 37.3 1.2 30.5 0.8 36.7 0.5 41.8 7.6 Sign 13 Chloramine T 100 0 100 0 100 0 100 0 100 0 100 0 100 0 100 0 100 0 100 0 NA 14 Chlorpromazine HCl 6.6 8.2 6.4 11 5.5 5.2 3.9 2.4 7.4 1.9 5.4 4.4 8.5 3.2 3.9 3.8 11.4 2.6 6.6 1.2 NS 15 2-MBT 100 0 100 0 100 0 100 0 98.7 2.2 100 0 100 0 100 0 100 0 99.9 0.3 NA 16 Benzyl Salicylate 7.8 7.2 2.8 4.2 14.4 6.1 0.2 0.3 0 0.1 0.7 1.2 4.5 3.8 0 0 2.4 2.4 3.6 4.2 Sign 17 Benzyl Cinnamate 10 9.8 2 3.4 5.8 5.9 1.4 1.3 2.5 1.6 0.7 1.2 13.2 4.1 0 0 3.9 3.6 4.4 2.5 Sign 18 R(+)Limonene 15.5 4.1 2.5 2.4 12.2 6.2 13.6 2 18.8 2.5 18.4 1.1 51.8 3.4 33.5 3 33 2.3 22.1 15.4 Sign 19 Methyl Salicylate 9.1 8 3.4 5.1 11.3 4.9 0.3 0.6 0.2 0.4 0.4 0.6 1 1.3 0 0 0.4 0.8 2.9 4.4 Sign 20 Isopropanol 9.9 9.2 5 5.8 10.8 4 0.3 0.5 1 1 6.1 1.2 1.5 1.8 0 0 9.3 2.4 4.9 3.2 Sign 21 Dimethyl Isophthalate 6.3 8.3 1.1 2 5.1 4.6 0.7 0.8 0.4 0.7 0.2 0.4 2.4 2.1 0 0 2.1 2.2 2 1.9 NS 22 4-PABA 10.7 8.4 3.9 4.2 10.6 8.1 4.6 2.1 1.4 1.2 0.9 1.4 4.6 3.5 0.7 1.3 1 1 4.3 3.6 Sign 23 Nickel Chloride 1.2 2 0 0 0 0 13.9 4.7 20.4 5.7 22.9 6.2 8.1 4.9 6.3 5.9 8.5 5.8 9 9.4 Sign 24 Xylene 9.6 8.4 2.5 4.1 12.1 7.6 0.5 0.9 0.3 0.6 0 0 2.7 2.3 0 0 1.1 1.5 3.2 4.2 Sign
1 ANOVA F-test with critical α-level = 0.024 (corrected for number of hypothesis tested); NS: not significant (p>0.024), Sign: significantly different (p<0.024) NA: ANOVA testing not performed since all individual values were equal; Chemicals with a grey background correspond with cysteine co-elution. When it was possible to estimate a depletion value, this value is reported in the table. Exp. 1 corresponds to the 9 chemicals tested once in study phase B1, Exp 2, 3 and 4 correspond to the three independent experiments performed by the laboratories with the set of 15 chemicals.
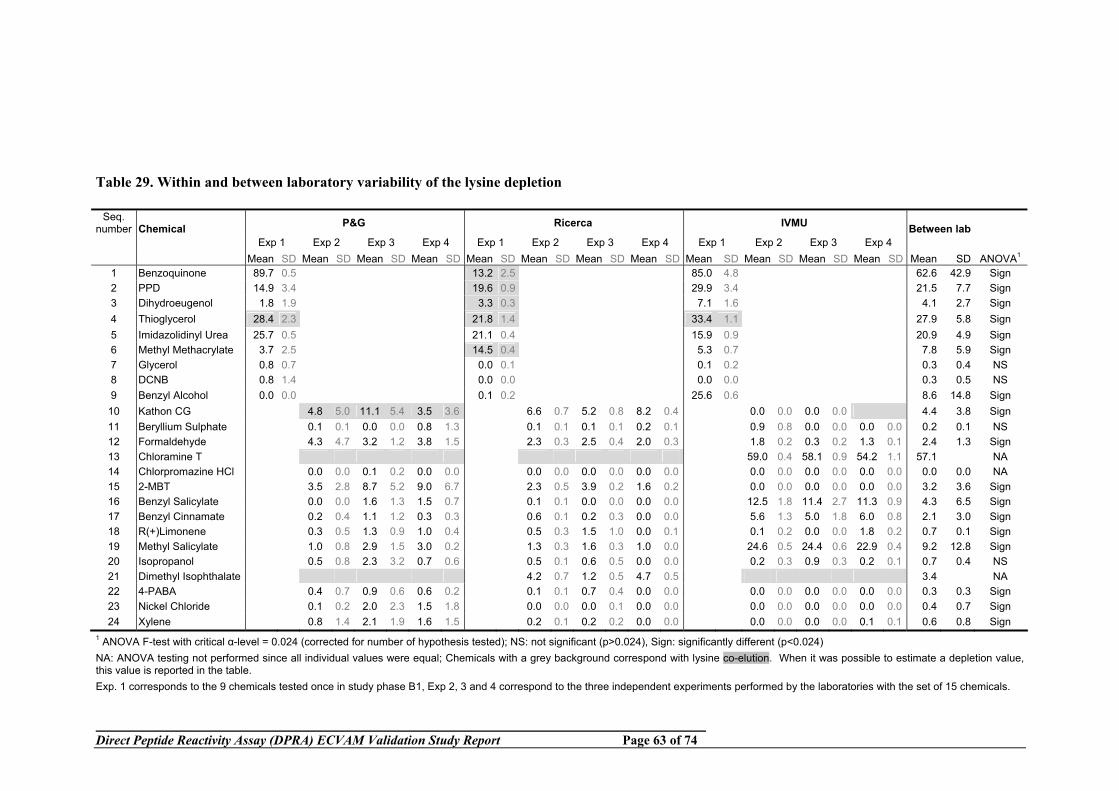
Direct Peptide Reactivity Assay (DPRA) ECVAM Validation Study Report Page 63 of 74
Table 29. Within and between laboratory variability of the lysine depletion
Seq. number Chemical P&G Ricerca IVMU Between lab
Exp 1 Exp 2 Exp 3 Exp 4 Exp 1 Exp 2 Exp 3 Exp 4 Exp 1 Exp 2 Exp 3 Exp 4 Mean SD Mean SD Mean SD Mean SD Mean SD Mean SD Mean SD Mean SD Mean SD Mean SD Mean SD Mean SD Mean SD ANOVA1
1 Benzoquinone 89.7 0.5 13.2 2.5 85.0 4.8 62.6 42.9 Sign 2 PPD 14.9 3.4 19.6 0.9 29.9 3.4 21.5 7.7 Sign 3 Dihydroeugenol 1.8 1.9 3.3 0.3 7.1 1.6 4.1 2.7 Sign 4 Thioglycerol 28.4 2.3 21.8 1.4 33.4 1.1 27.9 5.8 Sign 5 Imidazolidinyl Urea 25.7 0.5 21.1 0.4 15.9 0.9 20.9 4.9 Sign 6 Methyl Methacrylate 3.7 2.5 14.5 0.4 5.3 0.7 7.8 5.9 Sign 7 Glycerol 0.8 0.7 0.0 0.1 0.1 0.2 0.3 0.4 NS 8 DCNB 0.8 1.4 0.0 0.0 0.0 0.0 0.3 0.5 NS 9 Benzyl Alcohol 0.0 0.0 0.1 0.2 25.6 0.6 8.6 14.8 Sign
10 Kathon CG 4.8 5.0 11.1 5.4 3.5 3.6 6.6 0.7 5.2 0.8 8.2 0.4 0.0 0.0 0.0 0.0 4.4 3.8 Sign 11 Beryllium Sulphate 0.1 0.1 0.0 0.0 0.8 1.3 0.1 0.1 0.1 0.1 0.2 0.1 0.9 0.8 0.0 0.0 0.0 0.0 0.2 0.1 NS 12 Formaldehyde 4.3 4.7 3.2 1.2 3.8 1.5 2.3 0.3 2.5 0.4 2.0 0.3 1.8 0.2 0.3 0.2 1.3 0.1 2.4 1.3 Sign 13 Chloramine T 59.0 0.4 58.1 0.9 54.2 1.1 57.1 NA 14 Chlorpromazine HCl 0.0 0.0 0.1 0.2 0.0 0.0 0.0 0.0 0.0 0.0 0.0 0.0 0.0 0.0 0.0 0.0 0.0 0.0 0.0 0.0 NA 15 2-MBT 3.5 2.8 8.7 5.2 9.0 6.7 2.3 0.5 3.9 0.2 1.6 0.2 0.0 0.0 0.0 0.0 0.0 0.0 3.2 3.6 Sign 16 Benzyl Salicylate 0.0 0.0 1.6 1.3 1.5 0.7 0.1 0.1 0.0 0.0 0.0 0.0 12.5 1.8 11.4 2.7 11.3 0.9 4.3 6.5 Sign 17 Benzyl Cinnamate 0.2 0.4 1.1 1.2 0.3 0.3 0.6 0.1 0.2 0.3 0.0 0.0 5.6 1.3 5.0 1.8 6.0 0.8 2.1 3.0 Sign 18 R(+)Limonene 0.3 0.5 1.3 0.9 1.0 0.4 0.5 0.3 1.5 1.0 0.0 0.1 0.1 0.2 0.0 0.0 1.8 0.2 0.7 0.1 Sign 19 Methyl Salicylate 1.0 0.8 2.9 1.5 3.0 0.2 1.3 0.3 1.6 0.3 1.0 0.0 24.6 0.5 24.4 0.6 22.9 0.4 9.2 12.8 Sign 20 Isopropanol 0.5 0.8 2.3 3.2 0.7 0.6 0.5 0.1 0.6 0.5 0.0 0.0 0.2 0.3 0.9 0.3 0.2 0.1 0.7 0.4 NS 21 Dimethyl Isophthalate 4.2 0.7 1.2 0.5 4.7 0.5 3.4 NA 22 4-PABA 0.4 0.7 0.9 0.6 0.6 0.2 0.1 0.1 0.7 0.4 0.0 0.0 0.0 0.0 0.0 0.0 0.0 0.0 0.3 0.3 Sign 23 Nickel Chloride 0.1 0.2 2.0 2.3 1.5 1.8 0.0 0.0 0.0 0.1 0.0 0.0 0.0 0.0 0.0 0.0 0.0 0.0 0.4 0.7 Sign 24 Xylene 0.8 1.4 2.1 1.9 1.6 1.5 0.2 0.1 0.2 0.2 0.0 0.0 0.0 0.0 0.0 0.0 0.1 0.1 0.6 0.8 Sign
1 ANOVA F-test with critical α-level = 0.024 (corrected for number of hypothesis tested); NS: not significant (p>0.024), Sign: significantly different (p<0.024) NA: ANOVA testing not performed since all individual values were equal; Chemicals with a grey background correspond with lysine co-elution. When it was possible to estimate a depletion value, this value is reported in the table. Exp. 1 corresponds to the 9 chemicals tested once in study phase B1, Exp 2, 3 and 4 correspond to the three independent experiments performed by the laboratories with the set of 15 chemicals.
Direct Peptide Reactivity Assay (DPRA) ECVAM Validation Study Report Page 64 of 74
Conclusion of the Validation Management Team on Module 4 The main focus of the between laboratory reproducibility (BLR) for the 24 chemicals was on the concordance of the predictions sensitisers (S) versus non-sensitisers (NS) between the three laboratories. The BLR for the S/NS prediction was 75%. When 4 reactivity classes where considered the BLR was 62.5% The VMG agreed that the BLR results (75%) did not meet the target performance proposed at the onset of the study (80%). However, the VMG regarded the BLR result to be nevertheless acceptable bearing in mind the proposed use of the DPRA, as part of an integrated testing strategy for full replacement. In arriving at this conclusion, the VMG also took note of the fact that 80% between-laboratory reproducibility is considered an acceptable target performance for stand alone full replacement methods (OECD, 2010b). Furthermore, the VMG notes that exclusion of the three substances outside the applicability domain (dihydroeugenol, beryllium sulfate and nickel chloride, see below) would have increased the BLR to 87.5%.
Direct Peptide Reactivity Assay (DPRA) ECVAM Validation Study Report Page 65 of 74
Predictive Capacity (Module 5) Reference document: Statistical report (Appendix 15) List of additional documents filed for the study and available on request (Appendix 16) An overview of the predicted classification and the reference classification is presented in Table 30. When the test chemicals were selected for the current study, three of the 24 chemicals were known to fall outside the suggested applicability domain of the DPRA: dihydroeugenol which is well characterised pro-hapten, and beryllium sulfate and nickel chloride which are metal salts. Therefore, the analysis of the predictive capacity was performed using the results from the remaining 21 chemicals. The predictive capacity was evaluated for each laboratory (Table 31). For chemicals that were tested three times in each laboratory, the median was selected as the final conclusion for each laboratory, i.e. in the case of R(+)Limonene (P&G) that was two times predicted S and once NS by P&G, the final prediction for this laboratory was S. This resulted in an accuracy for S/NS classification of 85.7% for both P&G and Ricerca and 81% for IVMU. The sensitivity and specificity for P&G and Ricerca were 76.9% and 100%, respectively. The sensitivity and specificity for IVMU were 84.6% and 75% respectively. The overall accuracy (cumulative over three labs) was 84.1% with sensitivity of 79.5%, and specificity of 91.7%. Note that these numbers are for a total of 63 results, representing the results from the 21 chemicals tested in each of the three laboratories. Alternatively, the predictive parameters were calculated by assigning the median classification of the three laboratories to each chemical. These results are shown in table 32. In this case the overall accuracy was 85.7% with a sensitivity of 76.9% and a specificity of 100%. While the accuracies of both approaches are very similar, sensitivity and specificity are balanced differently. While the median approach has the advantages that it maintains the sample size of 21 and that it allows calculating confidence intervals, it reduces the available information to some extent. The cumulative approach increases the sample size by considering the individual, but dependent laboratory classifications per chemical. Therefore, confidence intervals are not reported. The VMG preferred to focus on the cumulative approach because the resulting estimates were deemed to better reflect the predictive capacity of the DPRA. Especially, the specificity of 100% of the median approach was considered misleading as one laboratory produced also false positive results (see Table 31). As already mentioned, chemicals previously tested in the DPRA were consistently and accurately identified (96.3%; 26/27 cumulative). Accuracy for chemicals not previously tested
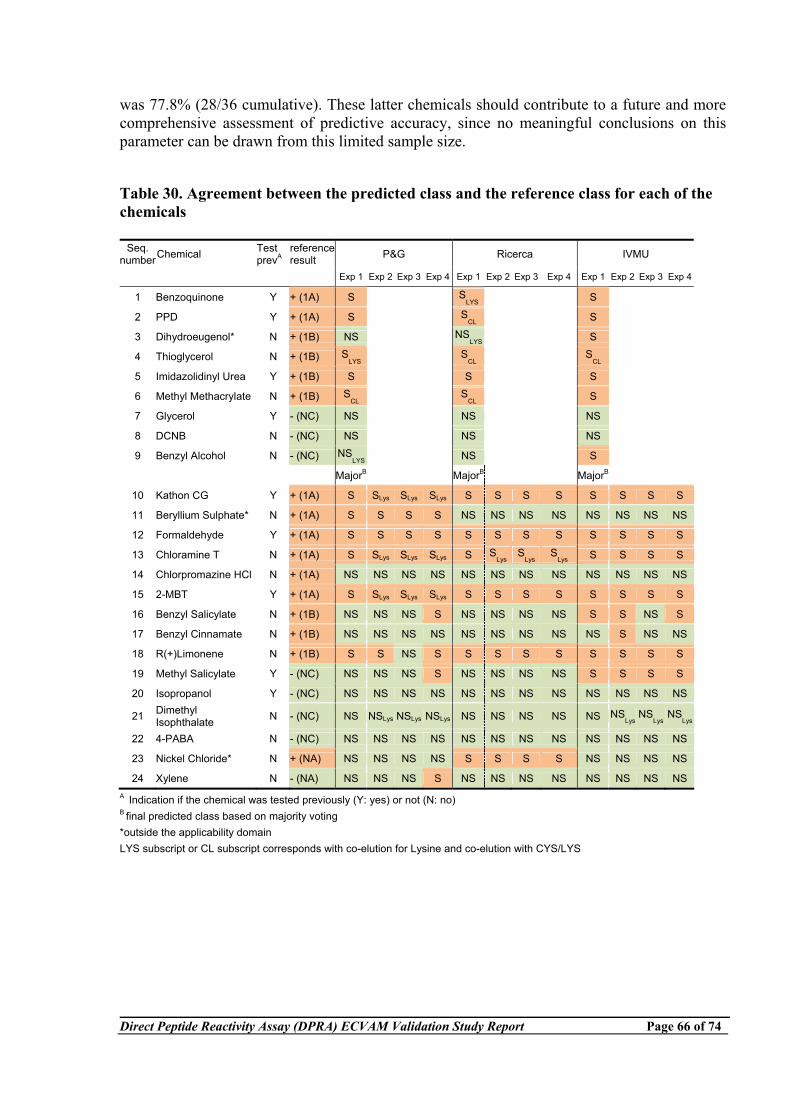
Direct Peptide Reactivity Assay (DPRA) ECVAM Validation Study Report Page 66 of 74
was 77.8% (28/36 cumulative). These latter chemicals should contribute to a future and more comprehensive assessment of predictive accuracy, since no meaningful conclusions on this parameter can be drawn from this limited sample size. Table 30. Agreement between the predicted class and the reference class for each of the chemicals
Seq. number Chemical Test
prevA reference result P&G Ricerca IVMU
Exp 1 Exp 2 Exp 3 Exp 4 Exp 1 Exp 2 Exp 3 Exp 4 Exp 1 Exp 2 Exp 3 Exp 4
1 Benzoquinone Y + (1A) S SLYS S
2 PPD Y + (1A) S SCL S
3 Dihydroeugenol* N + (1B) NS NSLYS S
4 Thioglycerol N + (1B) SLYS S
CL SCL
5 Imidazolidinyl Urea Y + (1B) S S S
6 Methyl Methacrylate N + (1B) SCL S
CL S
7 Glycerol Y - (NC) NS NS NS
8 DCNB N - (NC) NS NS NS
9 Benzyl Alcohol N - (NC) NSLYS NS S
MajorB MajorB MajorB
10 Kathon CG Y + (1A) S SLys SLys SLys S S S S S S S S
11 Beryllium Sulphate* N + (1A) S S S S NS NS NS NS NS NS NS NS
12 Formaldehyde Y + (1A) S S S S S S S S S S S S
13 Chloramine T N + (1A) S SLys SLys SLys S SLys
SLys
SLys S S S S
14 Chlorpromazine HCl N + (1A) NS NS NS NS NS NS NS NS NS NS NS NS
15 2-MBT Y + (1A) S SLys SLys SLys S S S S S S S S
16 Benzyl Salicylate N + (1B) NS NS NS S NS NS NS NS S S NS S
17 Benzyl Cinnamate N + (1B) NS NS NS NS NS NS NS NS NS S NS NS
18 R(+)Limonene N + (1B) S S NS S S S S S S S S S
19 Methyl Salicylate Y - (NC) NS NS NS S NS NS NS NS S S S S
20 Isopropanol Y - (NC) NS NS NS NS NS NS NS NS NS NS NS NS
21 Dimethyl Isophthalate N - (NC) NS NSLys NSLys NSLys NS NS NS NS NS NS
Lys NS
LysNS
Lys
22 4-PABA N - (NC) NS NS NS NS NS NS NS NS NS NS NS NS
23 Nickel Chloride* N + (NA) NS NS NS NS S S S S NS NS NS NS
24 Xylene N - (NA) NS NS NS S NS NS NS NS NS NS NS NSA Indication if the chemical was tested previously (Y: yes) or not (N: no)
B final predicted class based on majority voting *outside the applicability domain LYS subscript or CL subscript corresponds with co-elution for Lysine and co-elution with CYS/LYS
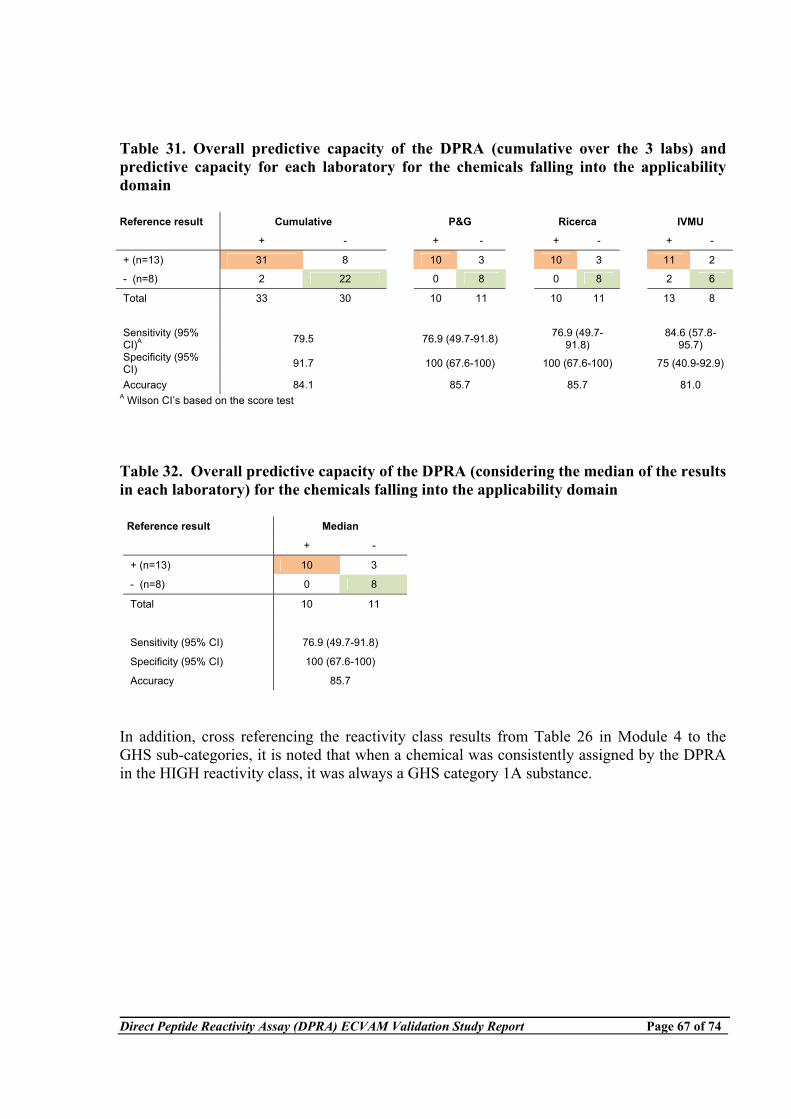
Direct Peptide Reactivity Assay (DPRA) ECVAM Validation Study Report Page 67 of 74
Table 31. Overall predictive capacity of the DPRA (cumulative over the 3 labs) and predictive capacity for each laboratory for the chemicals falling into the applicability domain Reference result Cumulative P&G Ricerca IVMU
+ - + - + - + -
+ (n=13) 31 8 10 3 10 3 11 2
- (n=8) 2 22 0 8 0 8 2 6
Total 33 30 10 11 10 11 13 8
Sensitivity (95% CI)A 79.5 76.9 (49.7-91.8) 76.9 (49.7-
91.8) 84.6 (57.8-95.7)
Specificity (95% CI) 91.7 100 (67.6-100) 100 (67.6-100) 75 (40.9-92.9)
Accuracy 84.1 85.7 85.7 81.0 A Wilson CI’s based on the score test Table 32. Overall predictive capacity of the DPRA (considering the median of the results in each laboratory) for the chemicals falling into the applicability domain
Reference result Median
+ -
+ (n=13) 10 3
- (n=8) 0 8
Total 10 11
Sensitivity (95% CI) 76.9 (49.7-91.8)
Specificity (95% CI) 100 (67.6-100)
Accuracy 85.7
In addition, cross referencing the reactivity class results from Table 26 in Module 4 to the GHS sub-categories, it is noted that when a chemical was consistently assigned by the DPRA in the HIGH reactivity class, it was always a GHS category 1A substance.
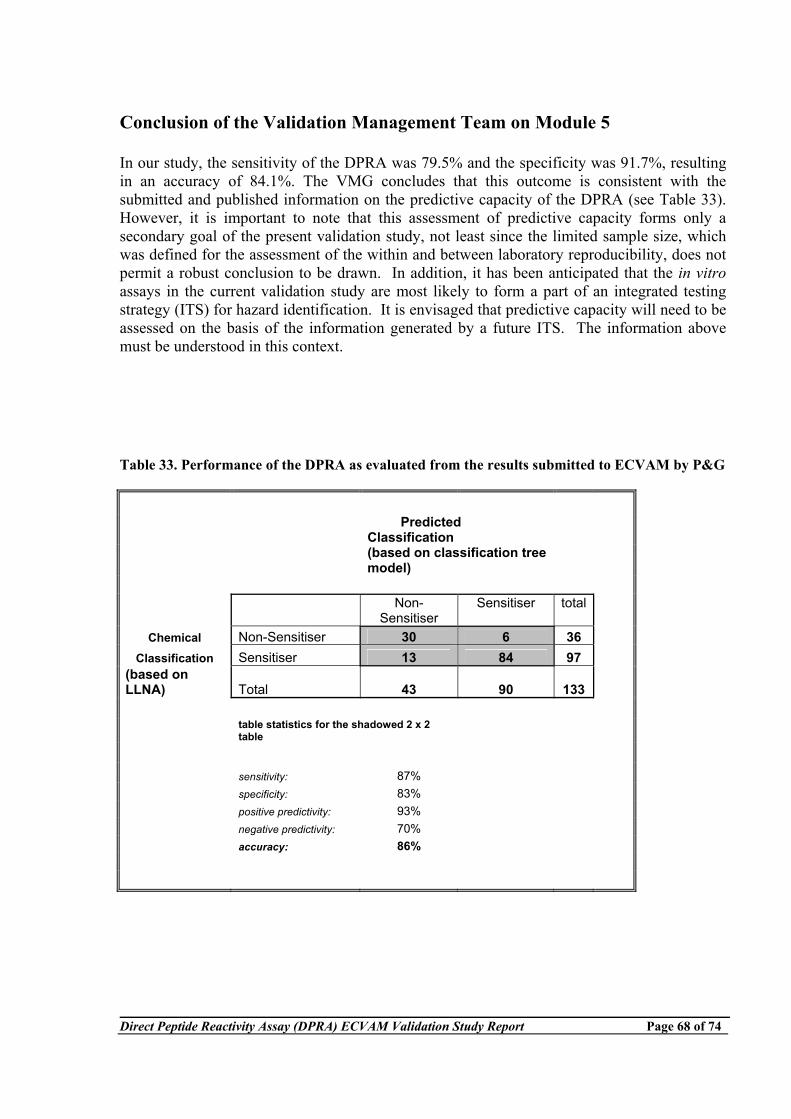
Direct Peptide Reactivity Assay (DPRA) ECVAM Validation Study Report Page 68 of 74
Conclusion of the Validation Management Team on Module 5 In our study, the sensitivity of the DPRA was 79.5% and the specificity was 91.7%, resulting in an accuracy of 84.1%. The VMG concludes that this outcome is consistent with the submitted and published information on the predictive capacity of the DPRA (see Table 33). However, it is important to note that this assessment of predictive capacity forms only a secondary goal of the present validation study, not least since the limited sample size, which was defined for the assessment of the within and between laboratory reproducibility, does not permit a robust conclusion to be drawn. In addition, it has been anticipated that the in vitro assays in the current validation study are most likely to form a part of an integrated testing strategy (ITS) for hazard identification. It is envisaged that predictive capacity will need to be assessed on the basis of the information generated by a future ITS. The information above must be understood in this context. Table 33. Performance of the DPRA as evaluated from the results submitted to ECVAM by P&G
Predicted Classification
(based on classification tree model)
Non-
Sensitiser Sensitiser total
Chemical Non-Sensitiser 30 6 36 Classification Sensitiser 13 84 97
(based on LLNA) Total 43 90 133
table statistics for the shadowed 2 x 2 table
sensitivity: 87% specificity: 83% positive predictivity: 93% negative predictivity: 70% accuracy: 86%
Direct Peptide Reactivity Assay (DPRA) ECVAM Validation Study Report Page 69 of 74
VMG overall conclusions and recommendations
Overall Conclusions The primary aim of this validation study was to assess the transferability, within laboratory and between laboratory reproducibility of the DPRA with a number of coded chemicals that were judged by the VMG to be suitable to permit robust conclusions to be drawn. The VMG considers that the information generated in the study completes the information requirement for modules 1-4 (test definition, within laboratory reproducibility, transferability, between laboratory reproducibility) of the ECVAM modular approach to validation (Hartung et al., 2007). In addition the information generated contributes to module 5 (predictive capacity) and module 6 (applicability domain) for which a substantial body of information is already available as evidenced in the material submitted to ECVAM and published in the scientific literature. The main conclusions of the VMG in relation to each module are set out in the table below:
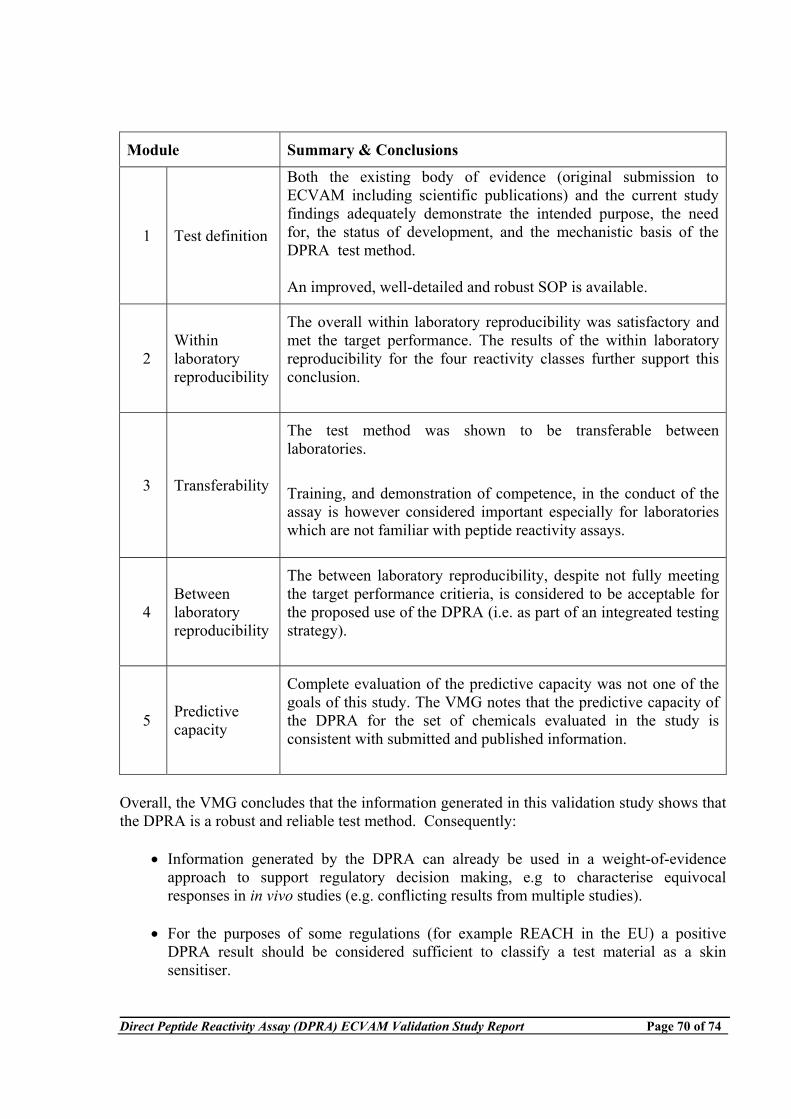
Direct Peptide Reactivity Assay (DPRA) ECVAM Validation Study Report Page 70 of 74
Module Summary & Conclusions
1 Test definition
Both the existing body of evidence (original submission to ECVAM including scientific publications) and the current study findings adequately demonstrate the intended purpose, the need for, the status of development, and the mechanistic basis of the DPRA test method. An improved, well-detailed and robust SOP is available.
2 Within laboratory reproducibility
The overall within laboratory reproducibility was satisfactory and met the target performance. The results of the within laboratory reproducibility for the four reactivity classes further support this conclusion.
3 Transferability
The test method was shown to be transferable between laboratories.
Training, and demonstration of competence, in the conduct of the assay is however considered important especially for laboratories which are not familiar with peptide reactivity assays.
4 Between laboratory reproducibility
The between laboratory reproducibility, despite not fully meeting the target performance critieria, is considered to be acceptable for the proposed use of the DPRA (i.e. as part of an integreated testing strategy).
5 Predictive capacity
Complete evaluation of the predictive capacity was not one of the goals of this study. The VMG notes that the predictive capacity of the DPRA for the set of chemicals evaluated in the study is consistent with submitted and published information.
Overall, the VMG concludes that the information generated in this validation study shows that the DPRA is a robust and reliable test method. Consequently:
• Information generated by the DPRA can already be used in a weight-of-evidence approach to support regulatory decision making, e.g to characterise equivocal responses in in vivo studies (e.g. conflicting results from multiple studies).
• For the purposes of some regulations (for example REACH in the EU) a positive
DPRA result should be considered sufficient to classify a test material as a skin sensitiser.
Direct Peptide Reactivity Assay (DPRA) ECVAM Validation Study Report Page 71 of 74
• The DPRA is suitable for further evaluation as a component of an ITS for full replacement of the in vivo assays for skin sensitisation hazard identification.
• Reliable categorisation into one of the four reactivity classes may play a role in the
determination of skin sensitisation potency, including GHS sub-categorisation. Recommendations
The predictive accuracy of the DPRA should be evaluated in terms of its inclusion into an integrated testing strategy for full replacement of current in vivo hazard identification assays. Considering the outcome of the study and in particular the consistency of the results obtained with the chemicals tested previously it is suggested that existing/historical results are taken into account for future formal evaluations on the predictive capacity. GHS sub-categorisation of sensitisers should form part of a wider assessment, it is envisaged that DPRA reactivity categories will provide useful information for this purpose. The experience gained within this validation trial suggests that the run acceptance criteria might be enhanced by their adaptation, by the lead laboratory, to take account of the information from other laboratories generated in this study and in other DPRA work. In view of the known limitations of the DPRA, including those related to the absence of a metabolic competent activity and the issue of co-elution in the HPLC analysis which can affect the accurate determination of a chemical’s reactivity, the VMG encourages continuing investment in the next generation peptide reactivity assays which offer an opportunity to overcome these limitations.
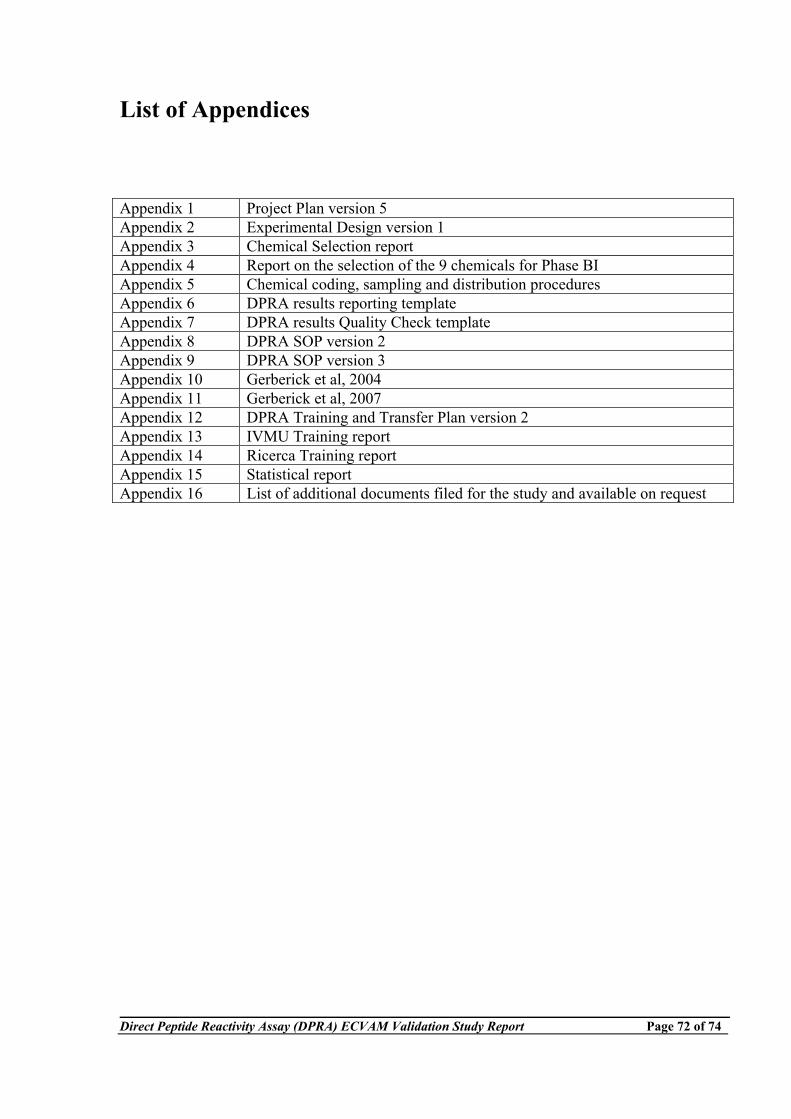
Direct Peptide Reactivity Assay (DPRA) ECVAM Validation Study Report Page 72 of 74
List of Appendices
Appendix 1 Project Plan version 5 Appendix 2 Experimental Design version 1 Appendix 3 Chemical Selection report Appendix 4 Report on the selection of the 9 chemicals for Phase BI Appendix 5 Chemical coding, sampling and distribution procedures Appendix 6 DPRA results reporting template Appendix 7 DPRA results Quality Check template Appendix 8 DPRA SOP version 2 Appendix 9 DPRA SOP version 3 Appendix 10 Gerberick et al, 2004 Appendix 11 Gerberick et al, 2007 Appendix 12 DPRA Training and Transfer Plan version 2 Appendix 13 IVMU Training report Appendix 14 Ricerca Training report Appendix 15 Statistical report Appendix 16 List of additional documents filed for the study and available on request
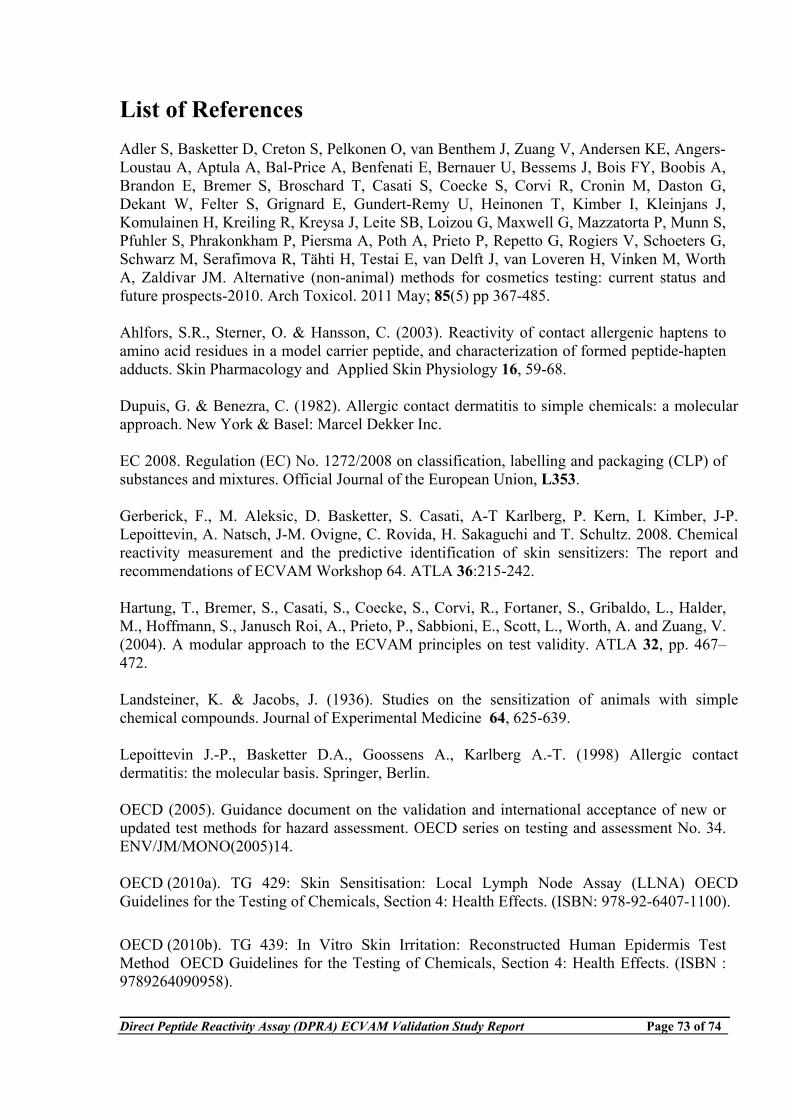
Direct Peptide Reactivity Assay (DPRA) ECVAM Validation Study Report Page 73 of 74
List of References Adler S, Basketter D, Creton S, Pelkonen O, van Benthem J, Zuang V, Andersen KE, Angers-Loustau A, Aptula A, Bal-Price A, Benfenati E, Bernauer U, Bessems J, Bois FY, Boobis A, Brandon E, Bremer S, Broschard T, Casati S, Coecke S, Corvi R, Cronin M, Daston G, Dekant W, Felter S, Grignard E, Gundert-Remy U, Heinonen T, Kimber I, Kleinjans J, Komulainen H, Kreiling R, Kreysa J, Leite SB, Loizou G, Maxwell G, Mazzatorta P, Munn S, Pfuhler S, Phrakonkham P, Piersma A, Poth A, Prieto P, Repetto G, Rogiers V, Schoeters G, Schwarz M, Serafimova R, Tähti H, Testai E, van Delft J, van Loveren H, Vinken M, Worth A, Zaldivar JM. Alternative (non-animal) methods for cosmetics testing: current status and future prospects-2010. Arch Toxicol. 2011 May; 85(5) pp 367-485. Ahlfors, S.R., Sterner, O. & Hansson, C. (2003). Reactivity of contact allergenic haptens to amino acid residues in a model carrier peptide, and characterization of formed peptide-hapten adducts. Skin Pharmacology and Applied Skin Physiology 16, 59-68. Dupuis, G. & Benezra, C. (1982). Allergic contact dermatitis to simple chemicals: a molecular approach. New York & Basel: Marcel Dekker Inc. EC 2008. Regulation (EC) No. 1272/2008 on classification, labelling and packaging (CLP) of substances and mixtures. Official Journal of the European Union, L353. Gerberick, F., M. Aleksic, D. Basketter, S. Casati, A-T Karlberg, P. Kern, I. Kimber, J-P. Lepoittevin, A. Natsch, J-M. Ovigne, C. Rovida, H. Sakaguchi and T. Schultz. 2008. Chemical reactivity measurement and the predictive identification of skin sensitizers: The report and recommendations of ECVAM Workshop 64. ATLA 36:215-242.
Hartung, T., Bremer, S., Casati, S., Coecke, S., Corvi, R., Fortaner, S., Gribaldo, L., Halder, M., Hoffmann, S., Janusch Roi, A., Prieto, P., Sabbioni, E., Scott, L., Worth, A. and Zuang, V. (2004). A modular approach to the ECVAM principles on test validity. ATLA 32, pp. 467–472.
Landsteiner, K. & Jacobs, J. (1936). Studies on the sensitization of animals with simple chemical compounds. Journal of Experimental Medicine 64, 625-639.
Lepoittevin J.-P., Basketter D.A., Goossens A., Karlberg A.-T. (1998) Allergic contact dermatitis: the molecular basis. Springer, Berlin. OECD (2005). Guidance document on the validation and international acceptance of new or updated test methods for hazard assessment. OECD series on testing and assessment No. 34. ENV/JM/MONO(2005)14.
OECD (2010a). TG 429: Skin Sensitisation: Local Lymph Node Assay (LLNA) OECD Guidelines for the Testing of Chemicals, Section 4: Health Effects. (ISBN: 978-92-6407-1100).
OECD (2010b). TG 439: In Vitro Skin Irritation: Reconstructed Human Epidermis Test Method OECD Guidelines for the Testing of Chemicals, Section 4: Health Effects. (ISBN : 9789264090958).
Direct Peptide Reactivity Assay (DPRA) ECVAM Validation Study Report Page 74 of 74
UN (2009). Globally Harmonised System (GHS) of classification and labelling of chemicals. ST/SG/AC.10/30/Rev.3. (ISBN: 978-92-1-117006).