Direct Observations of Oxygen-induced Platinum...
25
General rights Copyright and moral rights for the publications made accessible in the public portal are retained by the authors and/or other copyright owners and it is a condition of accessing publications that users recognise and abide by the legal requirements associated with these rights. • Users may download and print one copy of any publication from the public portal for the purpose of private study or research. • You may not further distribute the material or use it for any profit-making activity or commercial gain • You may freely distribute the URL identifying the publication in the public portal If you believe that this document breaches copyright please contact us providing details, and we will remove access to the work immediately and investigate your claim. Downloaded from orbit.dtu.dk on: Aug 26, 2018 Direct Observations of Oxygen-induced Platinum Nanoparticle Ripening Studied by In Situ TEM Simonsen, Søren Bredmose; Chorkendorff, Ib; Dahl, Søren; Skoglundh, M.; Sehested, J.; Helveg, S. Published in: Journal of the American Chemical Society Link to article, DOI: 10.1021/ja910094r Publication date: 2010 Document Version Peer reviewed version Link back to DTU Orbit Citation (APA): Simonsen, S. B., Chorkendorff, I., Dahl, S., Skoglundh, M., Sehested, J., & Helveg, S. (2010). Direct Observations of Oxygen-induced Platinum Nanoparticle Ripening Studied by In Situ TEM. Journal of the American Chemical Society, 132(23), 7968-7975. DOI: 10.1021/ja910094r
Transcript of Direct Observations of Oxygen-induced Platinum...

General rights Copyright and moral rights for the publications made accessible in the public portal are retained by the authors and/or other copyright owners and it is a condition of accessing publications that users recognise and abide by the legal requirements associated with these rights.
• Users may download and print one copy of any publication from the public portal for the purpose of private study or research. • You may not further distribute the material or use it for any profit-making activity or commercial gain • You may freely distribute the URL identifying the publication in the public portal
If you believe that this document breaches copyright please contact us providing details, and we will remove access to the work immediately and investigate your claim.
Downloaded from orbit.dtu.dk on: Aug 26, 2018
Direct Observations of Oxygen-induced Platinum Nanoparticle Ripening Studied by InSitu TEM
Simonsen, Søren Bredmose; Chorkendorff, Ib; Dahl, Søren; Skoglundh, M.; Sehested, J.; Helveg, S.
Published in:Journal of the American Chemical Society
Link to article, DOI:10.1021/ja910094r
Publication date:2010
Document VersionPeer reviewed version
Link back to DTU Orbit
Citation (APA):Simonsen, S. B., Chorkendorff, I., Dahl, S., Skoglundh, M., Sehested, J., & Helveg, S. (2010). DirectObservations of Oxygen-induced Platinum Nanoparticle Ripening Studied by In Situ TEM. Journal of theAmerican Chemical Society, 132(23), 7968-7975. DOI: 10.1021/ja910094r

Direct observations of oxygen induced platinum
nanoparticle ripening studied by in situ TEM
Søren B. Simonsen a, b, Ib Chorkendorff b, Søren Dahl b, Magnus Skoglundh c, Jens Sehested a, Stig
Helveg a,*
a Haldor Topsøe A/S, Nymøllevej 55, DK-2800 Kgs. Lyngby, Denmark, b CINF, Department of Physics,
Technical University of Denmark, DK-2800 Kgs. Lyngby, Denmark, c Competence Centre for Catalysis
(KCK) Chalmers University of Technology, SE-41296, Göteborg, Sweden.
*Corresponding author: Stig Helveg, e-mail: [email protected]
RECEIVED DATE (to be automatically inserted after your manuscript is accepted if required
according to the journal that you are submitting your paper to)
TITLE RUNNING HEAD: Pt nanoparticle ripening studied by in situ TEM
ABSTRACT: This study addresses the sintering mechanism of Pt nanoparticles dispersed on a planar,
amorphous Al2O3 support as a model system for a catalyst for automotive exhaust abatement. By means
of in situ transmission electron microscopy (TEM), the model catalyst is monitored during the exposure
to 10 mbar air at 650oC. Time-resolved image series unequivocally reveal that the sintering of Pt
nanoparticles is mediated by an Ostwald ripening process. A statistical analysis of an ensemble of Pt
nanoparticles shows that the particle size distributions change shape from an initial Gaussian
distribution via a lognormal distribution to a Lifshitz-Slyozov-Wagner (LSW) distribution. Furthermore,
the time-dependency of the ensemble-averaged particle size and particle density is determined. A mean
field kinetic description captures the main trends in the observed behavior. However, at the individual
1
nanoparticle level, deviations from the model are observed suggesting in part that the local environment
influences the atom exchange process.
KEYWORDS: Sintering, Ostwald ripening, nanoparticles, in situ TEM, Pt, catalysis, automotive
catalysts
Introduction
The size and shape of nano-scale structures
often play a crucial role for the physiochemical
properties of a nanomaterial1,2. Although a
variety of size-selected nanoparticle synthesis
methods are available, the stability of the
nanoscale structures is by no means guaranteed.
Due to their excess surface free energy, nanoscale
structures present a metastable solid state and
will inevitably tend to aggregate into larger
structures3-6. The stability of metal nanoparticles
dispersed on for example an oxide support is
important for their extensive use as efficient
catalysts in environmental technologies and in the
production of fuels and chemicals1,2. The high
temperature and reactive gas conditions
encountered during catalysis often accelerate the
sintering which results in loss of active surface
area of the nanoparticles causing an undesired
catalyst deactivation. To further advance the
synthesis and application of stable catalysts, and
nanostructures in general, a detailed
understanding of the mechanisms and kinetics
governing their stability is of utmost importance.
The sintering of supported nanoparticles is
typically attributed to mass transport mechanisms
involving crystallite or atomic migration. The
crystallite migration mechanism refers to
sintering mediated by the migration of the
nanoparticles and subsequent coalescence with
neighboring nanoparticles3. The atom migration
mechanism refers to the Ostwald ripening process
in which sintering occurs by diffusion of atoms or
atomic species between immobile nanoparticles
either on the surface of the support or through the
gas phase3,7. For both mechanisms, kinetic
models for the sintering of the supported
nanoparticles have been established3,7.
Specifically, the Ostwald ripening process is
influenced by the so-called Gibbs-Thomson
effect relating surface coverage to vapor pressure.
The result is here that the concentration of atomic
2
species in the vicinity of a particle is higher for
small particles than for large particles. This
concentration gradient leads to a net flux of
atomic species from the smaller particles towards
the larger ones, so the larger particles eventually
grow at the expense of the smaller ones. A mean-
field model for Ostwald ripening kinetics,
relevant for the present Pt catalyst described
below8, describes the so-called interface-
controlled rate of nanoparticle radius changes,
dR/dt, by3,9,
−= 1
*2 RR
RdtdR α (1)
where α is a system dependent parameter, R is
the particle radius and R* is the critical radius,
corresponding to the particle size which neither
shrinks nor grows and which is in equilibrium
with a constant concentration of atomic species in
the area between the particles (also referred to as
the mean-field) at the given time. R* will
increase with time as sintering proceeds and it
has been shown that R* equals the mean particle
radius10.
In the past, the sintering models were mainly
evaluated by comparing predictions with
experimental observations of ensemble averages
or distributions of particle sizes obtained by post-
mortem characterization3,8,11-17. Although this
approach has provided significant insight into
sintering, deviations of the experimental
observations from the model predictions have
spurred much debate on the use of indirect
observations to unambiguously obtain
mechanistic insight12,16,17. In this respect, the
ensemble-averaged measurements may be
beneficially complemented by time-resolved
microscopy of the individual nanoparticles using
e.g. scanning tunneling microscopy (STM)18-21,
low energy electron microscopy (LEEM)22 or
transmission electron microscopy (TEM)23-32.
Specifically, TEM of oxide-supported
nanoparticle catalysts may be performed by a
quasi in situ method, in which different or the
same areas of a catalyst is monitored repeatedly
in-between successive ageing treatments in
catalytic reactors3,13,29-32, or by an in situ method,
in which a specific catalyst area is monitored
while the ageing treatment is performed inside
the microscope23-28.
3

In the following, we focus on Pt nanoparticles
dispersed on an Al2O3 support. The Pt/Al2O3
system represents catalysts for e.g. oxidation
reactions in diesel and lean-burn engine exhaust
abatement. A net-oxidizing (lean) exhaust
composition is characteristic for this type of
automotive exhausts33. Previous studies suggest
that sintering of Pt nanoparticles dispersed on
either planar model or porous technical-relevant
alumina supports is strongly promoted by the
exposure to oxygen at temperatures above ca.
500°C3,34, but other components of the diesel
exhaust such as nitrogen oxides and CO may also
affect the catalyst stability35. Indirect
measurements have been pursued to reveal the
dominating oxygen-induced sintering
mechanism. For a range of Pt/Al2O3 catalyst
structures and oxidizing reaction conditions, it is
suggested that Ostwald ripening is
dominating31,36,37 whereas, for Pt particle sizes
below 4-5 nm, particle migration and coalescence
was suggested to be dominating3,30. However,
based on in situ observations, Baker et al. found
that Pt particles, larger than 2.5 nm, remained
stationary during exposure to 2mbar O2 at
temperatures up to 900°C and that ripening is
dominating24. Following the approach by Baker
et al, we here present in situ TEM observations of
Pt nanoparticles dispersed on a planar Al2O3
support during exposure to air at elevated
temperatures to mimic lean burn conditions.
Time-resolved TEM images of the individual
nanoparticles unequivocally reveal severe
sintering governed by Ostwald ripening. Based
on the in situ observations, we present a direct
examination of the applicability of equation (1)
for predicting the temporal evolution of the
particle size distributions and ensemble averages.
Experimental details
The model catalysts consisting of Pt
nanoparticles dispersed on a flat, amorphous
Al2O3 support were prepared on 40 nm thick,
amorphous Si3N4 windows supported on Si
wafers to enhance electron transparency (fig. 1a).
The flat, amorphous alumina support matches
closely a homogeneous medium, which is one of
the assumptions of equation (1). Moreover, the
uniform support further excludes the
inhomogeneous and porous structure of technical
support materials that may influence the sintering
4
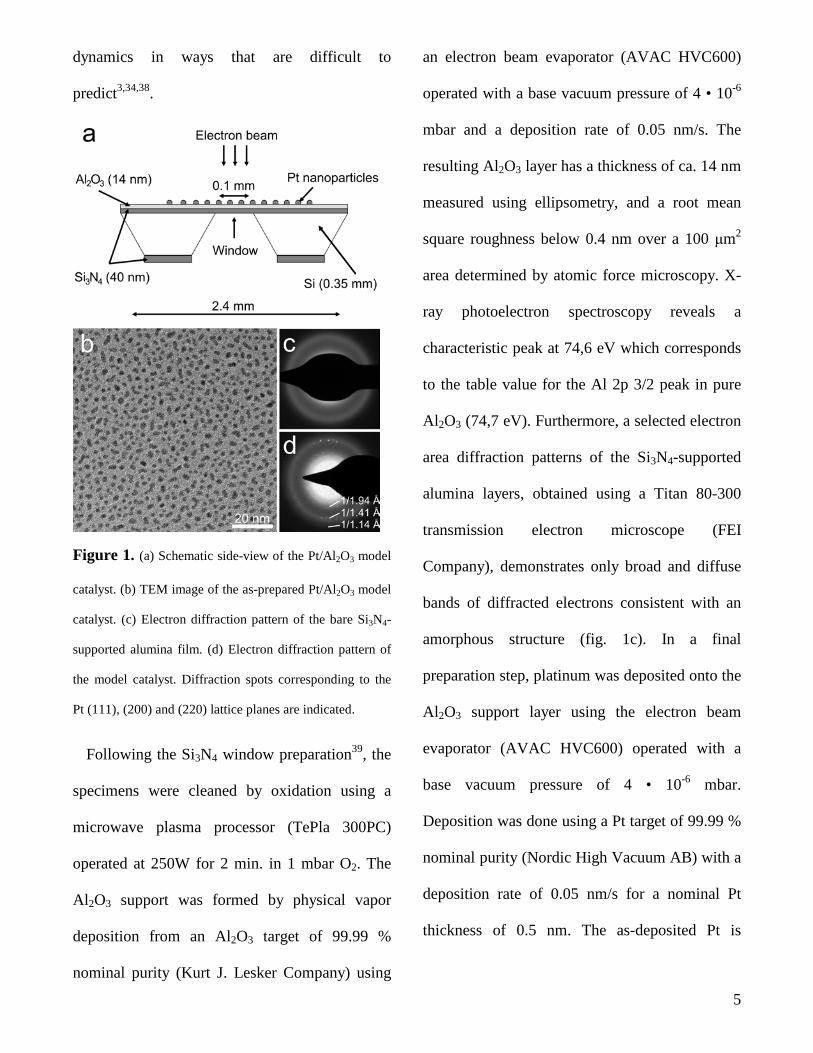
dynamics in ways that are difficult to
predict3,34,38.
Figure 1. (a) Schematic side-view of the Pt/Al2O3 model
catalyst. (b) TEM image of the as-prepared Pt/Al2O3 model
catalyst. (c) Electron diffraction pattern of the bare Si3N4-
supported alumina film. (d) Electron diffraction pattern of
the model catalyst. Diffraction spots corresponding to the
Pt (111), (200) and (220) lattice planes are indicated.
Following the Si3N4 window preparation39, the
specimens were cleaned by oxidation using a
microwave plasma processor (TePla 300PC)
operated at 250W for 2 min. in 1 mbar O2. The
Al2O3 support was formed by physical vapor
deposition from an Al2O3 target of 99.99 %
nominal purity (Kurt J. Lesker Company) using
an electron beam evaporator (AVAC HVC600)
operated with a base vacuum pressure of 4 • 10-6
mbar and a deposition rate of 0.05 nm/s. The
resulting Al2O3 layer has a thickness of ca. 14 nm
measured using ellipsometry, and a root mean
square roughness below 0.4 nm over a 100 μm2
area determined by atomic force microscopy. X-
ray photoelectron spectroscopy reveals a
characteristic peak at 74,6 eV which corresponds
to the table value for the Al 2p 3/2 peak in pure
Al2O3 (74,7 eV). Furthermore, a selected electron
area diffraction patterns of the Si3N4-supported
alumina layers, obtained using a Titan 80-300
transmission electron microscope (FEI
Company), demonstrates only broad and diffuse
bands of diffracted electrons consistent with an
amorphous structure (fig. 1c). In a final
preparation step, platinum was deposited onto the
Al2O3 support layer using the electron beam
evaporator (AVAC HVC600) operated with a
base vacuum pressure of 4 • 10-6 mbar.
Deposition was done using a Pt target of 99.99 %
nominal purity (Nordic High Vacuum AB) with a
deposition rate of 0.05 nm/s for a nominal Pt
thickness of 0.5 nm. The as-deposited Pt is
5

present as irregularly shaped and crystalline
islands with a width of ca. 3 nm (fig. 1b, d).
X-ray photoelectron spectroscopy reveals ca.
10 % atomic concentration of carbon
contamination on the as-prepared catalyst. Based
on a previous study of non-catalytic carbon black
oxidation40, it is most likely that the carbon
contamination on the Pt/Al2O3 sample will react
and/or desorbs during temperature ramping or
during the first few minutes at the constant
temperature of the experiment in which the
sample position stabilized from thermal drift.
In situ TEM experiments were performed using
a CM300 FEG-ST (Philips/FEI Company)
electron microscope equipped with a
differentially pumped environmental cell41. The
microscope is operated with a primary electron
energy of 300 keV and an ultimate information
limit of 0.14 nm while permitting images or time-
elapsed image series to be acquired of samples
during the exposure to reactive gases (up to ca.
15 mbar) and elevated temperatures (up to ca.
900oC). TEM imaging was performed in situ
using a 1k x 1k Tietz Fastscan F-114 CCD
camera, an objective aperture (scattering semi-
angle of 7.5 mrad) and at a magnification such
that the resulting pixel resolution was 0.26 nm. In
the electron microscope, the specimens were
exposed to 10 mbar technical air composed of 21
% O2 and 79 % N2 (class 2 from Air Liquide).
Each specimen exposed to this environment was
mounted with the Pt/Al2O3 side facing the bottom
of the Inconel furnace of a Gatan heating holder
(model 628). The holder facilitated the heating of
the specimens in the gas environment at a rate of
30°C/min. to a temperature in the range 200-
650°C where the temperature was kept constant
within ca. 3°C for up to 6 hours. The temperature
was measured using a Pt-Pt/Rh (13 %)
thermocouple spot-welded on the side of the
furnace. For temperature calibration, as-prepared
specimens were aged either in the microscope or
in a thermally equilibrated external tube reactor
in 10 mbar technical air at 740°C for 3 h.
Because the average Pt particle size after heat
treatment only differed by 0.5% for the
specimens, the temperature measured on the
furnace is concluded to be representative for the
specimen temperature in the present experiments.
From the acquired TEM images, Pt particle
sizes were measured by manually or
automatically outlining the particle perimeters,
6
using the software ImageJ, and the corresponding
projected areas of the particles were converted to
particle diameters using a circular approximation.
To check the consistency of the automatic
approach, images with 1000 particles were
automatically and manually analyzed and the best
agreement was obtained for an automatic analysis
of the images processed by a Gaussian blur filter
(Sigma = 3.0), and subsequently, by a Minimum
(Radius = 2.0 pixels) filter. For particles with
diameters larger than 2 nm, the error of the
particle diameter determined by the automated
measurements is approximately ±0.5 nm. A
disadvantage of the filter combination is that the
sizes of the very small particles (diameter less
than 2nm) are overestimated. To circumvent this
problem, particles with a diameter smaller than 2
nm were omitted in the present analysis. In two
cases it was necessary to measure diameters
below the limit of 2 nm, and in these cases
manual measurements were applied (fig. 2 and
fig. 4 below). The automatically measured
diameters are presented in the form of time-
elapsed particle size distributions (PSDs) with an
optimum bin size calculated according to42. Due
to sintering, the optimum bin size changes during
the experiment and, as a compromise, the bin size
is therefore calculated using the particle size
measurements after 3 hours in the in situ
experiment.
Before performing the actual experiments it is
mandatory to understand and control artifacts that
may be induced by the electron beam so that they
can be eliminated. The electron beam effects
were examined by observing the Pt/Al2O3
specimen during the exposure to 10 mbar
technical air and at a temperature of 400°C.
Under these conditions, different regions on the
specimen were observed, each at a different beam
current density below 1 A/cm2. The regions were
initially unexposed to the electron beam and were
subsequently imaged with a frame rate of 1.4
frames/s (exposure time = 0.5 s) for 30 min. The
image series revealed two main effects of the
electron beam; the shrinkage of the projected Pt
nanoparticle areas and the coalescence of
neighboring Pt nanoparticles.
To address the shrinkage, the diameters of 30
Pt nanoparticles were manually measured in the
first and last frame of the image series. For
particles that eventually disappeared during the
30 min. of exposure to the electron beam, the
7

final diameter measurement was obtained from
the last frame where the particles were clearly
visible, and the shorter beam exposure time was
taken into account.
Figure 2a shows a plot of the mean Pt
nanoparticle diameter shrinkage rate versus the
electron beam current density and it reveals a
linear increase in the diameter shrinkage rate of
the Pt nanoparticles with beam current densities
increasing up to 1 A/cm2. The diameter shrinkage
was absent in similar experiments conducted in
high vacuum (10-7 mbar) or 10 mbar N2 as well
as in the experiments with technical air, but with
the electron beam blinded off between the first
and last frame (corresponding to a beam current
density of 0 A/cm2 in fig. 2a). Hence, the
diameter shrinkage is therefore a combined effect
of the electron beam and the oxidizing gas
environment.
To address the mechanisms for the apparent
loss of Pt, the experiment at 400oC and 0.21
A/cm2 was repeated with a new specimen for a
prolonged period of 2 hours. Energy dispersive
spectroscopy of the same area on a specimen in
its as-prepared state and after the 2 hours
exposure to the electron beam revealed a
Figure 2. The mean particle diameter shrinkage rate and
the number of coalescence events of the Pt/Al2O3 catalyst
during exposure to 10 mbar air presented (a) as a function
of beam current density at constant temperature (400ºC),
and (b) as a function of temperature at constant beam
current density (0.21 A/cm2). For each data point, the mean
diameter shrinkage rate is based on measurements on 30
particles and the percentage of coalescence events is
calculated from more than 400 particles. Error bars refer to
the standard deviation of the mean diameter.
loss of Pt as seen from a reduction in the Pt L and
M peak intensity. The Pt is probably removed as
volatile Pt-oxygen species by the electron beam.
The study of the electron beam effects was
repeated to address the influence of temperature
variations by using a new specimen exposed to
8

the oxidizing conditions at a temperature of
200oC and 600oC. Figure 2b shows that the
shrinkage was independent of temperature in this
interval.
Finally, concerning the coalescence of
neighboring Pt particles, only a minor fraction of
ca. 1 % of the total number of nanoparticles
apparently coalesced in the oxidizing gas
environment irrespective of the electron beam
current density and temperature (fig. 2a-b).
Specifically, the coalescence events involved
only particles located in close vicinity with their
center of mass separated by ca. 3 nm and did not
involve migration of particles over longer
distances. The events could be coalescence
events or a localized, fast ripening effect in
accordance with43. Coalescence events of the type
described above were also observed at RT in the
high vacuum of 10-7 mbar in the electron
microscope.
The present series of experiments demonstrates
the importance of minimizing the electron dose
on the specimen in order to quantitatively
compare the changes in the ensemble of
supported Pt nanoparticles with sintering models
with a negligible effect of the electron beam.
Hence, in situ TEM was performed using a low
electron beam current density of 0.07 A/cm2 in
order to minimize the effect of the electron beam.
Due to the low electron beam current density the
noise level increases in the TEM images. To
improve the signal to noise ratio as well as to
reduce the effect of thermal drift of the specimen
in the TEM images, each TEM image presented
in the following represents the average of six
aligned TEM images recorded successively with
an exposure time of 0.5 s and a frame rate of 1.4
frames/s. For sample regions monitored over the
prolonged periods of the in situ experiment, TEM
imaging was performed in this way and repeated
every 30 min. for 6 hours. In the intervening
period, the electron beam was removed from the
region. Including time needed for focusing and
imaging, the sample regions used in the present
analyses were exposed to the electron beam for
ca. 1.3 min. per image giving a total exposure
time of ca. 17 min. Combined with the measured
shrinkage rates (Fig. 2), the total Pt particle
diameter shrinkage caused by the electron beam
can therefore be estimated to 0.2 nm, which is
negligible, compared to the particle sizes.
9

Results and discussion
Sintering of the Pt nanoparticles was activated by
heating the model catalyst by 30oC/min. up to
650°C in an atmosphere of 10 mbar technical air.
TEM images were acquired after the
establishment of isothermal conditions
(corresponding to time t = 0 min.) and the
stabilization of sample drift. In terms of mass-
thickness contrast, the Pt nanoparticles are
identified in the TEM images as the darker
contrast features which are superimposed at the
brighter background that corresponds to the
amorphous Al2O3 support. TEM images acquired
5 min. after the establishment of isothermal
conditions showed that the Pt nanoparticles were
very similar with respect to size and shape (fig.
3a). Specifically, the treatment resulted in a
transformation of the irregular shapes of the as-
prepared Pt nanoparticles (fig. 1b) to
predominantly circular projected shapes (fig. 3a).
A circular projected shape reflects a compact
three-dimensional shape consistent with surface
energy minimization for a metal nanoparticle.
The corresponding distribution of particle
diameters (fig. 3f) has an arithmetic mean value
of ca. 3 nm with full width at half maximum of
only 1.4 nm. Moreover, in this initial state the
particle density was 0.04 particles/nm2
corresponding to a mean particle-particle
separation of ca. 5 nm. The uniform ensemble of
Pt nanoparticles prevailed over the entire
specimen.
To monitor dynamical changes of the Pt
nanoparticles over the course of time,
consecutive TEM images were recorded in situ of
the same area of the specimen and played back in
the form of a movie (fig. 3a-e, Movie S1). The
image series directly reveals that the Pt particles
remained immobile during the experiment and
that the projected area of the Pt particles either
increased or decreased. The observations cannot
be due to a morphological transformation of the
Pt particles, such as a wetting/non-wetting
transformation44, because the smaller particles
eventually disappear and the larger particles
obtain a more pronounced dark contrast,
consistent with an increased particle height along
the electron beam direction. Hence, the
observations directly suggest that sintering of the
Pt nanoparticles is governed by an Ostwald
ripening mechanism, in agreement with24. The
corresponding mass-transport is possibly
10
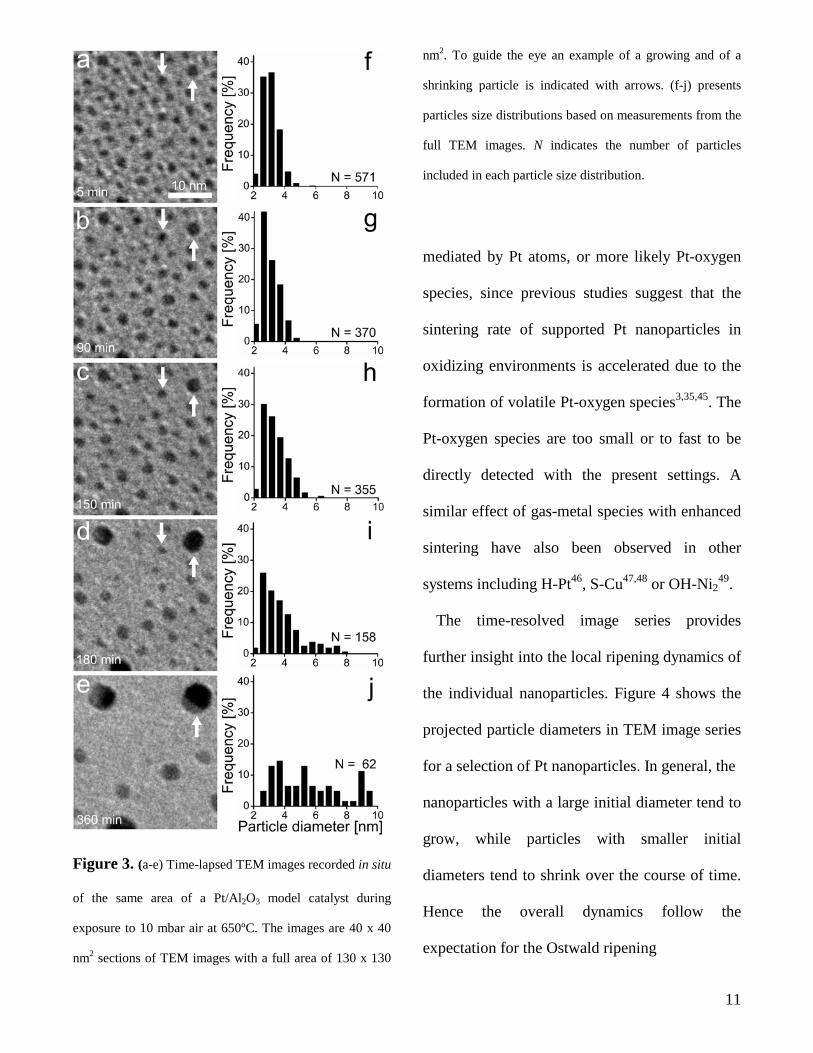
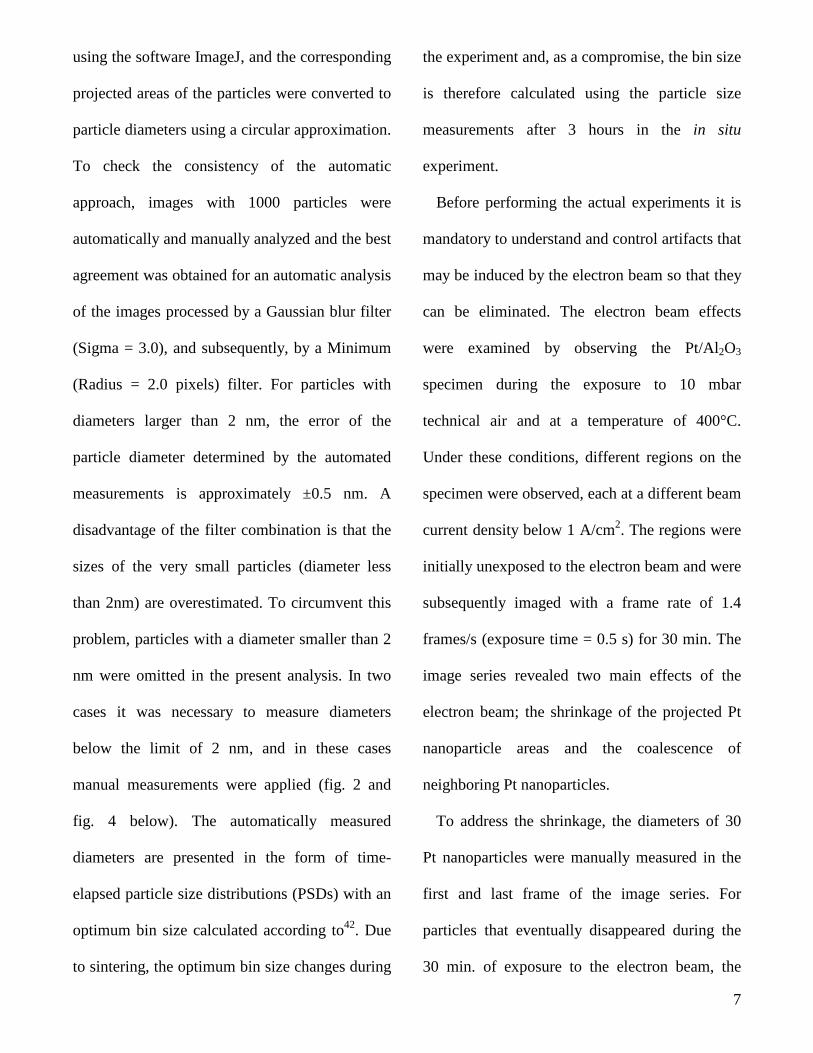
Figure 3. (a-e) Time-lapsed TEM images recorded in situ
of the same area of a Pt/Al2O3 model catalyst during
exposure to 10 mbar air at 650ºC. The images are 40 x 40
nm2 sections of TEM images with a full area of 130 x 130
nm2. To guide the eye an example of a growing and of a
shrinking particle is indicated with arrows. (f-j) presents
particles size distributions based on measurements from the
full TEM images. N indicates the number of particles
included in each particle size distribution.
mediated by Pt atoms, or more likely Pt-oxygen
species, since previous studies suggest that the
sintering rate of supported Pt nanoparticles in
oxidizing environments is accelerated due to the
formation of volatile Pt-oxygen species3,35,45. The
Pt-oxygen species are too small or to fast to be
directly detected with the present settings. A
similar effect of gas-metal species with enhanced
sintering have also been observed in other
systems including H-Pt46, S-Cu47,48 or OH-Ni249.
The time-resolved image series provides
further insight into the local ripening dynamics of
the individual nanoparticles. Figure 4 shows the
projected particle diameters in TEM image series
for a selection of Pt nanoparticles. In general, the
nanoparticles with a large initial diameter tend to
grow, while particles with smaller initial
diameters tend to shrink over the course of time.
Hence the overall dynamics follow the
expectation for the Ostwald ripening
11

Figure 4. (a) Selection of eight particles in fig. 3a (white
circles) for time-resolved analysis. (b) The diameters of the
selected particles presented as a function of time. The error
bars indicate estimated measuring errors from the manual
outlining of the particles.
process8. According to mean-field models such as
eq. (1), particles with the same size should grow
or decay at the same rate. However, a detailed
examination of the in situ TEM data in fig. 4
shows discrepancies from the mean-field model.
For instance, while the diameter increase of
particles 1 and 2 is similar, the diameters of
particles 6-8 decay at different rates although the
initial diameters are the same. The differences in
growth rate are also obvious for particles 3-5.
Similar deviations were previously reported for
metal systems under ultra high vacuum and for
Au/TiO2 under CO oxidation reaction18,21. In
accordance with those findings, the observations
from figure 4 may be attributed to a local effect.
That is, the exchange rate of diffusing species for
a Pt nanoparticle depends on the size of and the
distance to the neighboring nanoparticles rather
than on the mean-field concentration established
by all nanoparticles. Figure 4 also shows
surprisingly that the diameters of most particles
are almost stable during the initial stage of the
sintering process and that this initial period lasts
for up to 2 hours of the experiment. During the
initial stage a change in diameter is, however,
observed for the smallest particles (Fig. 4). Based
on equation (1), it is expected that the rate of
diameter change will be highest for the smallest
particles.
12
The apparent local effects on ripening raise the
question whether the mean field model is
applicable for describing the ripening kinetics for
an entire ensemble of Pt nanoparticles. Figure 3f-
j presents PSDs derived from particle
measurements in the area followed through the
experiment (corresponding to fig. 3a-e).
Interestingly, the initial Gaussian shape
transforms into a skew form as a tail of larger
particles emerges on the right side of the mean
value and consequently the distribution broadens
as a function of time. However, the number of
particles in the fixed field of view drops with
time. To circumvent the reduced counting
statistics, the observations are complemented by
a more thorough statistical analysis. This analysis
is based on a larger number of TEM images that
were acquired during the in situ experiment. At
each ageing stage (corresponding to the stages of
Fig. 3), several TEM images were acquired at
areas on the specimen that were previously not
exposed to the electron beam. Figure 5a-e
presents examples of TEM images of such
different areas and Figure 5f-j presents the PSDs
from all the TEM images obtained at a given
stage. Qualitatively, fig. 5 reveals changes in the
Figure 5. (a-e) TEM images of different randomly
chosen areas of a Pt/Al2O3 model catalyst during exposure
to 10 mbar air at 650ºC. The images are 40 x 40 nm2
sections of TEM images with a full area of 130 x 130 nm2.
(f-j) presents PSDs based on measurements from a number
13

of TEM images of areas previously unexposed to the
electron beam. A (f) Gaussian, (g) lognormal and (j) two-
dimensional LSW distribution is fitted to the data52. N
indicates the number of particles included in each particle
size distribution.
Pt nanoparticle sizes similar to the observations
in fig. 3. The improved statistical material,
however, results in more well-defined PSD
shapes. Specifically the initial shape is
approximately Gaussian (fig. 5f). At later stages
the PSD is fitted better with a log-normal
distribution (fig. 5g) as larger particles form at
the expense of the smaller particles. Eventually
the distribution peaks to the left of its mean value
(fig. 5j), and at this stage the distribution is fitted
well with the so-called Lifshitz-Slyozov-Wagner
(LSW) model50,51 modified to represent a two-
dimensional system52.
The LSW model was previously established to
describe Ostwald ripening mediated sintering50,51,
but the distinct LSW shaped PSD has not
previously been reported on technical catalysts.
Even after severe ageing in oxygen at ambient
pressures, lognormal like shapes are typical for
PSDs of technical catalysts16. It has been
discussed that the sintering mechanism may be
deduced from the specific shapes of the particle
size distributions3,8,11,12. However, Datye et al.
argued recently, based on indirect post-mortem
examinations of technical relevant catalysts, that
it indeed is difficult to infer the mechanism from
the particle size distributions16. In line with this
work, the present findings reveal that such
attempts are not straightforward because the PSD
may expose a time-dependency and that a
transitional period may exist, in which one
specific sintering mechanism results in several
different shapes of the PSD. A possible
explanation for why the LSW shape is found in
this study in contrast to studies on technical
catalysts is that the present uniform support and
homogeneous initial distribution of the Pt
nanoparticles resemble the assumptions
underlying the LSW model closer than the
inhomogeneous support structure and
nanoparticle distribution of technical catalysts.
Based on the PSDs, the temporal evolution of
ensemble-averaged properties, such as the
number-averaged mean particle diameter and
particle density, is determined (fig. 6a-b). Figure
6a shows that the overall trend of change in the
mean diameter with ageing time is similar for the
14

Figure 6. (a) Mean particle diameter, (b) particle density
and (c) Pt volume per support area as a function of aging
time for particles in an area followed over time,
corresponding to figure 3 (grey) and for areas previously
unexposed to the electron beam, corresponding to figure 5
(black). In (a-b) error bars refer to the standard deviation of
the particle diameters and density respectively. In (c) error
bars refer to the propagated measuring error. In (a) an
example of the statistical spread in mean particle diameter
for different areas on the specimen is presented with open
circles at 240 min.
limited area (corresponding to fig. 3) and the
additional areas (corresponding to fig. 5). The
mean diameter remains almost stable during the
initial period, but suddenly increases rapidly and
subsequently becomes roughly constant with
time. The error bars in fig. 6a show how the
standard deviation of the particle sizes changes
with time as well. Initially, the standard deviation
is small reflecting a narrow initial PSD. The
spread in particle sizes increases at the onset of
the fast increase in the mean particle diameter.
Finally both the mean diameter and the particle
spread remain almost constant. Figure 6b shows
that the particle density is high during the initial
stage and is reduced with time until it stabilizes
when the mean diameter stabilizes (fig. 6a-b).
The results in figures 6a and b clearly show that
the sintering rate slows down in the final
sintering stage. That the mean diameter is almost
stable in the initial stage (fig 6a) could indicate
that no sintering is taking place at this stage.
However, the decrease in density shows that
particles decay and that a slow sintering process
indeed proceeds (6b). This is also consistent with
figure 4b which shows that the smallest particle
diameters appear to shrink over time.
15

Although the data sets presented in fig. 6a-b
reflect the same overall trend, differences are also
apparent. Based on the consideration of electron
beam-induced shrinkage (fig. 2), the difference is
likely not dominated by such effects. It can not be
ruled out that the difference partly results from
removal of free diffusing Pt-oxygen species from
the specimen by the electron beam. However, the
volume of Pt in the nanoparticles can be
estimated using a hemispherical shape
approximation to the projected Pt particles
outlined in the TEM images. Figure 6c shows
that the Pt volume is stable throughout most of
the experiment and does not reflect a significant
loss of Pt, but rather a slight increase in the end.
Because Pt is not added to the sample, the
apparent volume increase indicates that the
particle shape changes to obtain a slightly larger
projected area and that the hemispherical shape
assumption is too simple. Hence the results in
figure 6c can only be taken as indicative. It is
noted that the mean particle diameter obtained
from single TEM images of different areas
indeed varies as indicated (fig. 6a, open circles)
and this intrinsic spread is likely the reason for
the discrepancy between the particle size
averaged over a single area and multiple areas.
To address the question whether the observed
temporal evolution of the PSDs, as well as the
mean particle diameter and particle density
reflect the Ostwald ripening characteristics, the
observations are compared to simulations based
on equation (1). The simulations follow the
procedure of Smet et. al.53 with discrete time
steps of 0.5 min. and using an initial Gaussian
distribution with a particle number and an initial
particle density corresponding to the PSD in
figure 5f. The simulations are performed in an
iterative way by varying a constant corresponding
to α of equation (1), until the particle density of
the simulated distribution fits the observed
particle density of figure 5 best for all times.
These simulations produce the PSDs presented in
fig. 7a, the mean particle diameter (black line)
presented in fig. 7b and the particle density (black
line) presented in fig. 7c. In another simulation
run, the simulation constant was tuned to obtain
the best match with the mean particle diameter of
figure 5. The simulated mean particle diameter
and corresponding density are shown as the grey
curves in figure 7b, c.
16
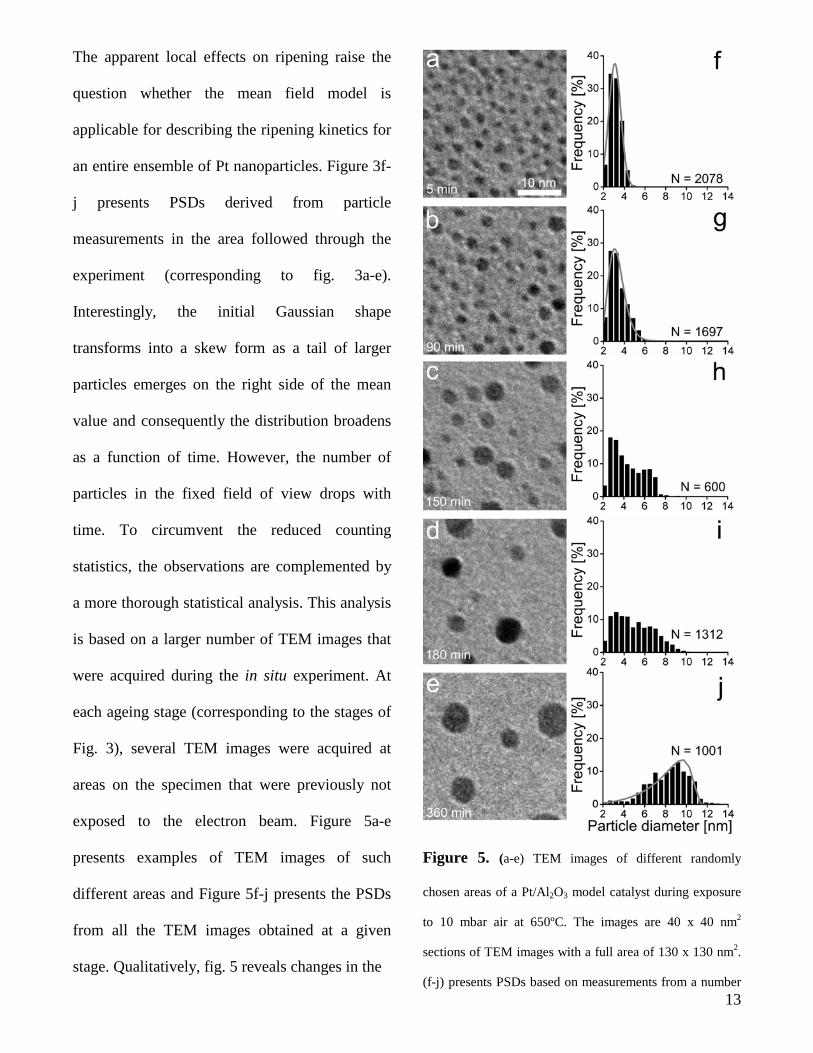
Figure 7. Simulations of the time evolved particle size
distribution (a), mean particle diameter (b) and the particle
density (c) following53. The initial particle size distribution
used for the simulation is a Gaussian distribution with mean
and width corresponding to the distribution in figure 5f.
Experimental measurements of the mean particle diameter
and density corresponding to figure 6a-b are included
(squares). For (b) and (c) the parameters of the simulation
is set to get the best possible agreement with the observed
mean diameter (grey) or particle density (black). To guide
the eye a zoom on the first 30 min. is inserted in (b).
The simulated PSDs as a function of time
shows that the initial Gaussian shape transforms
into a LSW shape over time. The simulated
enddistribution matches the experimentally
observed PSD (fig. 5j). However, while the
simulations indicate a gradual change of the
initial Gaussian distribution into the LSW shape,
the experimentally observed distributions show
transitional shapes with a tendency for a tail to
the right of their maximum until the LSW shape
emerges. The difference may reflect inherent
scatting of the experimental data or the short-
comings of the model that are discussed below.
The simulated mean particle diameter evolves
in time with an initial almost stationary period,
followed by a rapid increase and, subsequently,
by a period of slower growth (fig. 7b). The
simulated particle density evolves with an initial
fast decrease that then slows down. The trends in
the time-evolution of the mean particle diameter
have previously been reported for simulations
based on narrow Gaussian initial PSDs8,53. There
appears to be overall qualitatively agreement
between the simulated and the experimental data
17

for time-dependency of the mean particle
diameter and particle density whereas
quantitative differences are apparent.
Specifically, both the simulations and the
experiment show interestingly that the initial
stage with slow sintering is correlated with a
narrow PSD. One explanation for the coupling of
slow sintering with a narrow PSD is that even
though a concentration of atomic species is
believed to be generated from the initially small
particles, larger particles are needed to take up
the atomic species according to the Gibbs-
Tompson effect. This, in turn, means that a
broadening of the PSD will increase the sintering
rate. This result also suggests that one route to
suppress the deactivation of industrial catalysts
through sintering could be to aim for very narrow
initial PSDs. This will not be a route for
stabilizing the catalysts, but may be a route for
prolonging the meta-stable initial state resulting
in higher total activity. In comparison, a slow
onset for S induced ripening of Cu is also
previously reported, but attributed to a shift in S
concentration48.
The differences between the simulated and
observed time-dependencies of the mean particle
diameter and particle density include several
effects. First, the initial period with a stationary
mean particle size and narrow particle size
distribution is considerably shorter for the
simulated (ca. 10 min.) than for the experimental
data (ca. 2 hours). The longer stationary period in
the experiment could possibly be an additional
kinetic effect related to the establishment of the
concentration of Pt-oxide complexes on the
support or the difference in Pt particle size that
are governing the ripening process. Second, the
experimental observations show final mean
particle sizes and particle densities that are larger
and smaller, respectively, as compared to the
simulated parameters. It should also be noted that
although the present model systems was
generated to match closely the assumptions
underlying the model (eq. 1), the experimental
situation still may deviate from the model
assumptions. Because the particles are imaged in
a projection orthogonal to the support surface, the
projected particle diameter represents only a
simple measure for the Pt morphology. The
particle shape is determined by the surface free
energies of the exposed Pt surface sites and by
the Pt-alumina interface energy. As the nature of
18
the surface sites may change with size54 and
oxygen adsorption is site-dependent55,56, the
oxygen atmosphere may affect the surface free
energy and hence particle shapes in a size-
dependent way. Moreover, as surface defects
could act as anchor sites (as suggested for Pt on
gamma-alumina57) the interface energy may also
be speculated to be partly inhomogeneous. In
such a case the adhesion of the Pt particles with
different size could vary and thus also affect the
Pt morphology. Furthermore, it is noted that the
used model assumes that the concentration of
atomic species around the particles is described
by the Gibbs-Thompson equation and that the
concentration increases to the mean-field value,
which pertains in the area between the immobile
particles3. However, the high initial fractional Pt
coverage and a small mean Pt particle separation
of ca. 5 nm may cause a breakdown of the mean-
field approximation because of overlap in
concentration gradients of the atomic species
surrounding the particles. The particles may
therefore directly affect their neighbor’s growth
rates, rather than indirectly through the mean
field concentration of mass-transporting species.
The direct interaction with neighbor particles
could explain the local deviations from the mean
field model as observed in fig. 4. Moreover, a
local overlap of the concentration gradient can
be imagined to affect the time-dependency of the
changes in the whole ensemble of Pt
nanoparticles, as addressed by Dadyburjor et
al.58, and hence cause deviations in particle size
distributions, average particle size as well as
particle density from the mean field model
predictions as reflected in fig. 7.
Conclusion
In situ TEM is used to monitor Pt nanoparticles
dispersed on a planar, amorphous Al2O3 support
during exposure to 10 mbar of synthetic air at
650°C. Time-resolved image series
unequivocally reveal that Pt nanoparticle
sintering is mediated by an Ostwald ripening
process and allow for a direct comparison to the
mean-field model for Ostwald ripening. A
statistical analysis of an ensemble of Pt
nanoparticles shows that the particle size
distributions change shape as a function of time.
Specifically, the particle size distribution changes
from an initial Gaussian distribution via a
lognormal type distribution to a LSW distribution
19

under the present sintering conditions.
Furthermore, the overall trends of the time-
dependency of the ensemble-averaged particle
size and particle density agree with the mean-
field expectations. However, at the individual
nanoparticle level discrepancies are observed
suggesting that the local environment influences
the atom exchange process.
Acknowledgment. We gratefully acknowledge
Bengt Kasemo, Jonas Andersson, Elin Larsson
and Laurent Feuz (Chemical Physics Group) as
well as Eva Olsson (Microscopy and
Microanalysis Group) at Chalmers University of
Technology for contributing to sample
preparations. We thank the MC2-Access project
for financial support. We acknowledge the
participation of the CTCI Foundation, Taiwan, in
the establishment of the in situ TEM facility at
Haldor Topsøe A/S. CINF is funded by The
Danish National Research Foundation.
Supporting Information Available. Movie S1
shows the time-elapsed in situ TEM images of
the Pt/Al2O3 model catalyst during exposure to
10 mbar air at 650°C. The acquisition time
relative to the time of reaching the temperature
650°C is given for each frame. S1 shows the full
130 x 130 nm2 area corresponding to figure 3a-e.
This information is available free of charge via
the Internet at http://pubs.acs.org/
References
1 Somorjai, G. A.; Frei, H.; Park, J. Y. J.
Am. Chem. Soc. 2009, 131, 16589
2 Bell, A. T. Science, 2003, 299, 1688
3 Wynblatt, P.; Gjostein, N. A. Prog. Solid
State Ch. 1976, 9, 21
4 Bartholomew, C. H. Stud. Surf. Sci.
Catal. 1997, 111, 585
5 Fuentes, G. A.; Salinas-Rodriguez, E. In
Catalyst Deactivation; Bartholomew, C. H. Ed.;
Fuentes, G. A. Ed.; Elsevier Science B.V:
Amsterdam, 1999; 573-584
6 Campbell; C. T. Surf. Sci. Rep. 1997, 227,
1
7 Chakraverty, B. K. J. Phys. Chem. Solids
1967, 28, 2401
8 Flynn, P. C.; Wanke, S. E. J. Catal. 1974
34, 400
20
9 Coughlan, S. D.; Fortes, M. A. Scripta
Metallugica et Materialia 1993, 28, 1471
10 Finsy, R. Langmuir 2004, 20, 2975
11 Ruckenstein, E.; Pulvermacher, B. J.
Catal 1973, 29, 224
12 Granqvist, C. G.; Buhrman, R. A. J.
Catal. 1976, 42, 477
13 Harris, P. J. F. Int. mat. Rev. 1995, 40, 97
14 Campbell, C. T.; Parker, S. C.; Starr, D.
E. Science 2002, 298, 811
15 Sehested, J.; Gelten, J. A. P.; Remediakis,
I. N.; Bengaard, H.; Nørskov, J. K. J. Catal.
2004, 223, 432
16 Datye, A. K.; Xu, Q.; Kharas, K. C.;
McCarty, J. M. Catalysis Today 2006, 111, 59
17 Wanke, S. E. J. Catal., 1977, 46, 234
18 Morgenstern, K.; Rosenfeld, G.; Comsa,
G. Surface Science 1999, 441, 289
19 Linderoth, T. R.; Horch, S.; Petersen, L.;
Helveg, S.; Lægsgaard, E.; Steensgaard, I.;
Besenbacher, F. Phys. Rev. Lett. 1999, 82, 1494
20 Jak, M. J. J.; Konstapel, C.; Kreuningen,
A. van; Verhoeven, J.; Frenken, J. W. M. Surface
Science 2000, 457, 295
21 Yang, F.; Chen, M. S.; Goodman, D. W.
J. Phys. Chem. C 2009, 113, 254
22 Theis, W.; Bartelt, N. C.; Tromp, R. M.
Phys. Rev. Lett. 1995, 75, 3328
23 Baker, R. T. K.; Harris, P. S.; Thomas, P.
B. Surface Science 1974, 46, 311
24 Baker, R. T. K.; Thomas, C.; Thomas, R.
B. J. Catal. 1975, 38, 510
25 Heinemann, K.; Poppa, H. Thin Solid
Films 1976, 33, 237
26 Anton, R.; Kreutzer, P. Phys. Rev. B.
2000, 61, 16077
27 Liu, R. J.; Crozier, P. A.; Smith, C. M.;
Hucul, D. A.; Blackson, J.; Salaita, G. Appl.
Catal. A-Gen. 2005, 282, 111
28 Hannon, J. B.; Kodambaka, S.; Ross, F.
M.; Tromp, R. M. Nature 2006, 440, 69
29 Sushumna, I.; Ruckenstein, E, J. Catal.
1988 109, 433
21

30 Harris, P. J. F.; Boyes, E. D.; Cairns, J. A.
J. Catal. 1983, 82, 127
31 Bartholemew, C. H. Catalysis – A
Specialist Periodical Report, volume 10; The
Royal Society of Chemistry: Cambridge, 1993;
41-82.
32 Bellare, A.; Dadyburjor, D. B.; Kelly, M.
J. J. Catal. 1989, 117, 78,
33 Twigg, M. V. Appl. Catal B 2007, 70, 2
34 Wanke, S. E.; Flynn, P. C. Catal. Rev.
Sci. Eng. 1975, 12, 93
35 Lööf, P.; Stenbom, B.; Nordén, H.;
Kasemo, B. J. Catal. 1993, 144, 60
36 Lee, T. J.; Kim, Y. G. J. Catal. 1984, 90,
279
37 Rickard, J. M.; Genovese, L.; Moata, A.;
Nitsche, S. J. Catal. 1990, 121, 141
38 Ahn, T. M.; Tien, J. K.; Wynblatt, P. J.
Catal. 1980, 66, 335
39 Grant, A. W.; Hu, Q.-H.; Kasemo, B.
Nanotechnology 2004, 15, 1175
40 Simonsen, S. B.; Dahl, S.; Johnson, E.;
Helveg, S. J. Catal. 2008, 255, 1
41 Hansen, P. L.; Datye, A. K.; Helveg, S.
Adv. Catal. 2006, 50, 77.
42 Freedman, D.; Diaconis, P. Z.
Wahrscheinlichkeit 1981, 57, 453
43 Yang, W. C.; Zeman, M.; Ade, H.;
Nemanich, R. J. PRL 2003, 90, 136102
44 Hansen, P. L.; Wagner, J. B.; Helveg, S.;
Rostrup-Nielsen, J. R.; Clausen, B. S.; Topsøe,
H. Science 2002, 295, 2053
45 Chaston, J. C. Platinum Metals Rev.
1966, 10, 91
46 Horch, S.; Lorensen, H. T.; Helveg, S.;
Lægsgaard, E.; Stensgaard, I.; Jacobsen, K. W.;
Nørskov, J. K.; Besenbacher, F. Nature 1999,
398, 134
47 Feibelman, P. J. PRL 2000, 85, 606
48 Ling, W. L.; Bartelt, N. C.; Pohl, K.;
Figuera, J.; Hwang, R. Q.; McCarty, K. F. PRL
2004, 93, 166101
49 Sehested, J. J Catal. 2003, 217, 417
22

50 Lifshitz, I. M.; Slyozov, V. V. J. Phys.
Chem. Solids 1961, 19, 35.
51 Wagner, C. Z. Elektrochemie 1961, 65,
581
52 Rogers, T. M.; Desai, R. C.; PRB 1989
39, 11956
53 Smet, Y. D.; Deriemaeker, L.; Finsy, R.
Langmuir 1997, 13, 6884
54 Hardeveld, R.; Hartog, F.; Surf. Sci. 1969,
15, 189
55 Wand, L.; Roudgar, A.; Eikerling, M. J.
Phys. Chem. C 2009, 113, 17989
56 Sljivancanin, Z.; Hammer, B.; Surf. Sci.
2002, 515, 235
57 Kwak, J. H.; Hu, J.; Mei, D.; Yi, C.-W.;
Kim, D. H.; Peden, C. H. F.; Allard, L. F.;
Szanyi, J. Science 2009, 325,1670
58 Dadyburjor, D. B.; Marsh, S. P.;
Glicksman, M. E. J. Catal. 1986, 99, 358
23

TOC:
24