Direct measurement of blood pressure by liquid-filled ... · Direct measurement of blood pressure...
53
Direct measurement of blood pressure by liquid-filled catheter manometer systems Plasman, J.L.C.; Timmers, C.M.M. Published: 01/01/1981 Document Version Publisher’s PDF, also known as Version of Record (includes final page, issue and volume numbers) Please check the document version of this publication: • A submitted manuscript is the author's version of the article upon submission and before peer-review. There can be important differences between the submitted version and the official published version of record. People interested in the research are advised to contact the author for the final version of the publication, or visit the DOI to the publisher's website. • The final author version and the galley proof are versions of the publication after peer review. • The final published version features the final layout of the paper including the volume, issue and page numbers. Link to publication Citation for published version (APA): Plasman, J. L. C., & Timmers, C. M. M. (1981). Direct measurement of blood pressure by liquid-filled catheter manometer systems. (EUT report. E, Fac. of Electrical Engineering; Vol. 81-E-121). Eindhoven: Technische Hogeschool Eindhoven. General rights Copyright and moral rights for the publications made accessible in the public portal are retained by the authors and/or other copyright owners and it is a condition of accessing publications that users recognise and abide by the legal requirements associated with these rights. • Users may download and print one copy of any publication from the public portal for the purpose of private study or research. • You may not further distribute the material or use it for any profit-making activity or commercial gain • You may freely distribute the URL identifying the publication in the public portal ? Take down policy If you believe that this document breaches copyright please contact us providing details, and we will remove access to the work immediately and investigate your claim. Download date: 03. Jul. 2018
-
Upload
truongdung -
Category
Documents
-
view
214 -
download
0
Transcript of Direct measurement of blood pressure by liquid-filled ... · Direct measurement of blood pressure...

Direct measurement of blood pressure by liquid-filledcatheter manometer systemsPlasman, J.L.C.; Timmers, C.M.M.
Published: 01/01/1981
Document VersionPublisher’s PDF, also known as Version of Record (includes final page, issue and volume numbers)
Please check the document version of this publication:
• A submitted manuscript is the author's version of the article upon submission and before peer-review. There can be important differencesbetween the submitted version and the official published version of record. People interested in the research are advised to contact theauthor for the final version of the publication, or visit the DOI to the publisher's website.• The final author version and the galley proof are versions of the publication after peer review.• The final published version features the final layout of the paper including the volume, issue and page numbers.
Link to publication
Citation for published version (APA):Plasman, J. L. C., & Timmers, C. M. M. (1981). Direct measurement of blood pressure by liquid-filled cathetermanometer systems. (EUT report. E, Fac. of Electrical Engineering; Vol. 81-E-121). Eindhoven: TechnischeHogeschool Eindhoven.
General rightsCopyright and moral rights for the publications made accessible in the public portal are retained by the authors and/or other copyright ownersand it is a condition of accessing publications that users recognise and abide by the legal requirements associated with these rights.
• Users may download and print one copy of any publication from the public portal for the purpose of private study or research. • You may not further distribute the material or use it for any profit-making activity or commercial gain • You may freely distribute the URL identifying the publication in the public portal ?
Take down policyIf you believe that this document breaches copyright please contact us providing details, and we will remove access to the work immediatelyand investigate your claim.
Download date: 03. Jul. 2018

Direct measurement of blood pressure by liquid-filled catheter manometer systems
by
J. 1.. C. Plasman and C. M. M. Timmers
Eindhoven University of Technology Research Reports
EINDHOVEN UNIVERSITY OF TECHNOLOGY
Department of Electrical Engineering
Eindhoven The Netherlands
DIRECT MEASUREMENT OF BLOOD
PRESSURE BY LIQUID-FILLED
CATHETER MANOHETER SYSTEMS
By
J.L.C. Plasman
and
C.M.M. Timmers
EUT Report 81-E-121
ISBN 90-6144-121-8
Eindhoven
July 1981
2
Summary.
The use of liquid filled catheter-manometer systems is commonly accepted as a method to measure blood pressures. The reproduction of the blood pressure waveform is however strongly related to the quality of this measuring system.
This study will show that a hydraulic system should be used with short, stiff and wide bore (¢ about 1.8 mm) lines which contain no or hardly any air bubbles and have a minimum of connections.
It is also shown that the amplitude versus frequency characteristic and the phase versus frequency characteristic of hydraulic systems with relatively low undamped resonance frequency fn(about 40 Hz) and low damping ratio p (about 0.15) can be markedly improved by using electrical filtering techniques.
Plasman, J.L.C. and C.M.M. Timmers DIRECT MEASUREMENT OF BLOOD PRESSURE BY LIQUID-FILLED CATHETER MANOMETER SYSTEMS. Department of Electrical Engineering, Eindhoven University of Technology, 1981. EUT Report 81-E-121
This work was done as part of the study of the authors in the Group Medical Electrical Engineering, Department of Electrical Engineering, Eindhoven University of Technology, under supervision of Prof.dr.ir. J.E.W. Beneken and ir. J.A. Blom.

Contents.
1. Introduction.
2. How spo~ld a pressure 2.1. Static pressure
2.2. Dynamic pressure
3. The hydraulic catheter
3
monitoring system requirements. requirements.
manometer system.
page
perform?
4
6 6 6
10
4. Determination of fn and p by transient stepresponse. 16
5. Experiments.
6. Results. 6.1. Pressure-lines.
23
26 26
6.2. Length. 27 6.3. Pressure-line conficuration. 28 6.4. Canulas. 29 6.5. Pressure-line configuration with a canula. 30 6.6. Remarks. 33
7. Compensating techniques. 7.1. Serial damping. 7.2. Parallel damping. 7.3. Electrical filtering.
8. Conclusions and recommendations. 8.1. Recommendations.
References.
Appendices:
A. Mathematical analysis of a sine;le degree of frc(~dom system.
B. lJctcrmination of 1.3 and fn from a st ep response.
C. TrauGferfunctions of a catheter rnanometersystem with end without compensation.
35 35 36 38
41
41
42
44
44 46
48
4
1. Introduction
The basis of this study is the need of the authors to get more detailed information ab6ut the pressure monitoring system present at the thorax O.R. in the Leiden University Hospital. For their thesis studies the authors use several clinically measured blood pressures, which preferably should be highly reliable. As clinical measurements tend to be less accurate than laboratory measurements, the questions to be answered are:
- How good or bad are these blood pressure signals? - What are the influences of disturbances such as air
bubbles? - What can be done within the clinical environment to
improve the quality of the blood pressure signals?
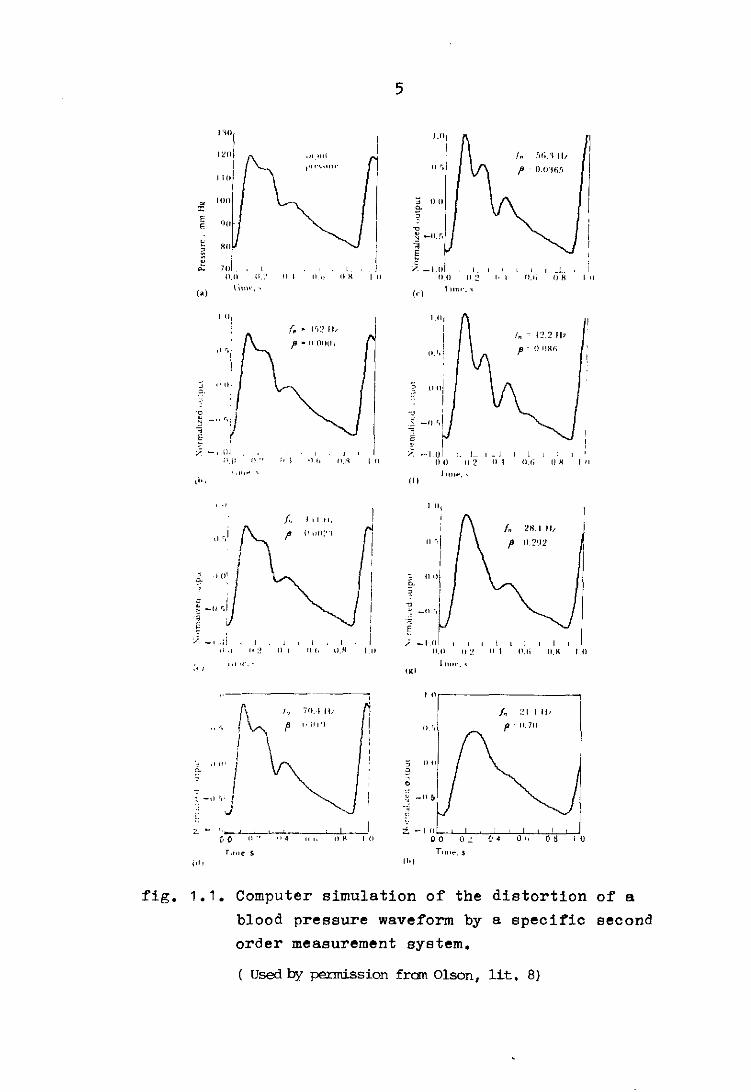
The reasonableness of these questions is not totally imaginary as may be illustrated by fig. 1.1., which is a computer simulation of the distortion of a blood pressure waveform by a specific second order measurement system.
This study can be divided into three parts. Chapters 2,3 and 4 deal with the theoretical analysis of catheter manometer systems. Chapters 5,6 and 7 treat the analysis of the measurements from the catheter manometer systems, whereas chapter 8 contains the conclusions and the recommendations for the user of catheter manometer systems.
5
J."W( I.tl{
1~()1 ! _".,u! .rd;. '\ III
I I" "~,,,,,. 0', O.O·Ui.'i 110
i! Ion l- " lUI
~
E .,
E \)0 ~
~ _n.!i E XI' .. ~ E E
70 5. _I.oi ~ ! ! I. I _L n.n o-! "
, II " II "
, " lUI 0:.'
"
, 0.1; II R ,,, (;Ii) lin" (q IUT;I", ,
, (I: In: '(l::'; I
I 01 c'f (I,e,!
i
" 1101
"' (l01 ,S' :~ , .~
-""V '"
,
, ".j -II ',I l' ~ I
" -, (11 , , ,., -Lui '- _ J ;) p no' J, I .Ifo lUi ; II 11.1) II 2 II , Il.!i
II " ,,,
'.11," lu" ... , \10, 'Ii
, ", f" , " II,
d "I (1010:"\ 21'1.1 II,
11".1 O.?lI2 , i ,
"J , Oll\ ~. . ~
" ! -0 !
, I
~ _(I r,1 1: _0 '. . '
'" ~ f /, -I ,Ii ! I ! / -I () !
,;,J II:! II , 11 I. '1,1-1 , II 11,0 II:' II , lUi lUI "' ;./ "I ""," ill"", \"
f\ I" 70.1 III r Of
/" :~ I , II. .. r, ~ ',('1 'I (I e.l p 11,70
J , .I Ii' i " 00 g- o
I ,; , -" '" I ~
,J -;; c
" - I i. -10 !
C· 0 II" "4 H,. II " '" 00 '" O' 0\, '" '0
T""c: , T'll'''' $
~ " , l10f
fig. 1.1. Computer simulation of the distortion of a blood pressure waveform by a specific second
order measurement system.
( used by pe.nnission fran Olson, lit, 8)
6
2. How should a pressure monitoring system perform?
The object of physiological pressure measurement is to record pressure variations faithfully, usually in analog form. This involves a transducer capable of changing pressure signals into, in general, electrical signals. The transducer will need an amplifier and some type of recording and/or displaying instrument. The total system should behave such that distortion of pressure information is within acceptable limits. The distortion may be divided into that related to:
- static or very slowly changing pressures. - fast changing pressures (dynamic pressures).
2.1. Static pressure requirements.
In general the transducer system shoUld fulfil the following requirements, when static pressures are applied:
- the amount of drift - mostly caused by temperature changes - should be small in terms of pressure and in relation to the final monitoring requirements. the system should be linear with a constant gain.
- the system must show minimal hysteresis.
2.2. Dynamic pressure requirements.
For the purpose of discussion it will be convenient to have in mind a particular pressure signal, e.g. the arterial pressure waveform. The general principles of monitoring as they will be formulated for the arterial pressure wave may be readily applied to other waveforms.
Suppose that we have an arterial pressure that repeats itself exactly with each heart beat at a regular heart rate. Fourier theory shows that the waveform can be considered as a mean level together with the sum of a series of sine waves of appropriate amplitude and phase. The lowest frequency sine wave will be that of the heart rate and the other frequencies will be integral multiples of this frequency.
7
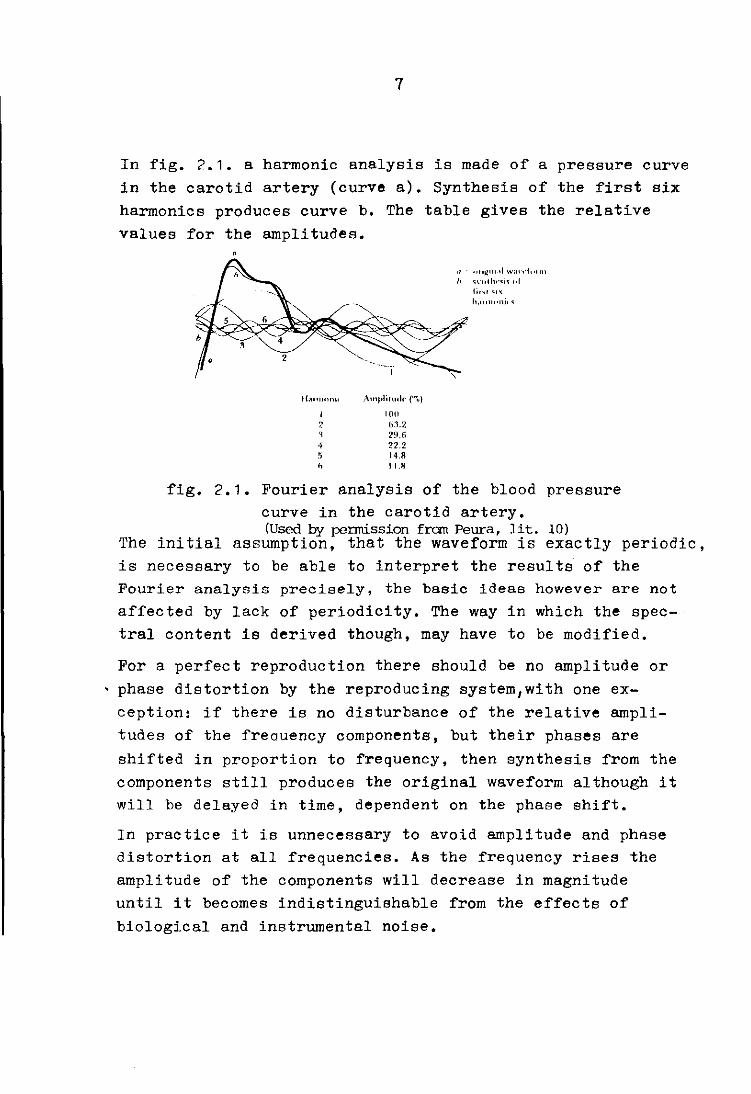
In fig. 2.1. a harmonic analysis is made of a pressure curve in the carotid artery (curve a). Synthesis of the first six harmonics produces curve b. The table gives the relative values for the amplitudes.
11."."""" A1UplilUlk (",!,)
100
2 h:l.2 'I 29.6 4 22.2 5 14.8 o I I,R
" ''''~II,.,I w,,,·,-t"'1ll " .\'ulh ... j. "I
fig. 2.1. Fourier analysis of the blood pressure curve in the carotid artery. (Used by permission from Peura, lit. 10)
The initial assumption, that the waveform is exactly periodic, is necessary to be able to interpret the results of the Fourier analysis precisely, the basic ideas however are not affected by lack of periodicity. The way in which the spectral content is derived though, may have to be modified.
For a perfect reproduction there should be no amplitude or phase distortion by the reproducing system/with one exception: if there is no disturbance of the relative amplitudes of the freouency components, but their phases are
shifted in proportion to frequency, then synthesis from the components still produces the original waveform although it will be delayed in time, dependent on the phase shift.
In practice it is unnecessary to avoid amplitude and phase distortion at all frequencies. As the frequency rises the amplitude of the components will decrease in magnitude until it becomes indistinguishable from the effects of biological and instrumental noise.
8
There are two problems in this approach. 1. There is no definite boundary above which biological
pressure variations may be ignored. In the literature the following recommendations are made.
A.T. Hansen (Lit. 6)
D.L. Fry et al.
D.A. McDonald
(Lit. 18)
(1949) : The system should have a flat amplitude versus frequency characteristic (a.v.f.) till above the 10th harmonic of the pulse rate.
(1957) Same as Hansen. (Lit. 17) (1960) : For very precise measurements
a flat a.v.f. till the 15th
harmonic of the pulse rate is required.
R.R. Vierhout (1961) A flat a.v.f. with an error and A.J.H. Vendrik of 10% at the upper freq.
which is generally five times (Lit. 19)
L.A. Geddes (Lit. 4)
loT Gabe
Conclusion:
(1970) the pulse rate- is required. Same as Hansen. But for highly reliable response a flat a.v.f. till beyond the 15 th harmonic of the pulse rate is required.
(1972) : Same as Hansen. (Lit.3)
For a good response a monitoring system is required with a flat a.v.f. till above the 10th harmonic of the pulse rate and for precise measurements the a.v.f. should be
flat till beyond the 15th harmonic.
2. The monitoring system in our case consists out of an electrical and a hydraulic system. The electrical system can easily be developed with a flat a.v.f. till 100 or 200 Hz. The hydraulic system however is restrained to a far lower frequency. Bruner (lit. 1. pg. 129) for example states that a hydraulic pressure line is
9
restrained to 10 to 20 Hz.
For clinicians phase shift in the frequency components might be of little concern, especially when they consider measurements in the periphery. Phase shift however can disturb the waveform in such a way that derived values such as dP/dt, systolic and diastolic pressures become unreliable. So phase distortion should preferably be avoided (with the exception as mentioned on page 7 ).
Measurement of the derivative of the pressure signal increases the bandwidth requirements, because differentiation of a sinusoIdal harmonic increases the amplitude of that component by a factor proportional to its frequency. Noise at higher frequencies can become very large on differentiation. The original signal should be as free of noise as possible, e.g. by the use of a low-pass filter with a cut-off frequency such that the derivative of the signal is not
significantly affected. The bandwidth required may be estimated by Fourier analysis of the time derivative signal. As Gersh et al. (lit. 5. pg. 38) have shown the a.v.f. characteristics of the monitoring system used must remain flat to within 5% up to the 20 th harmonic.
10
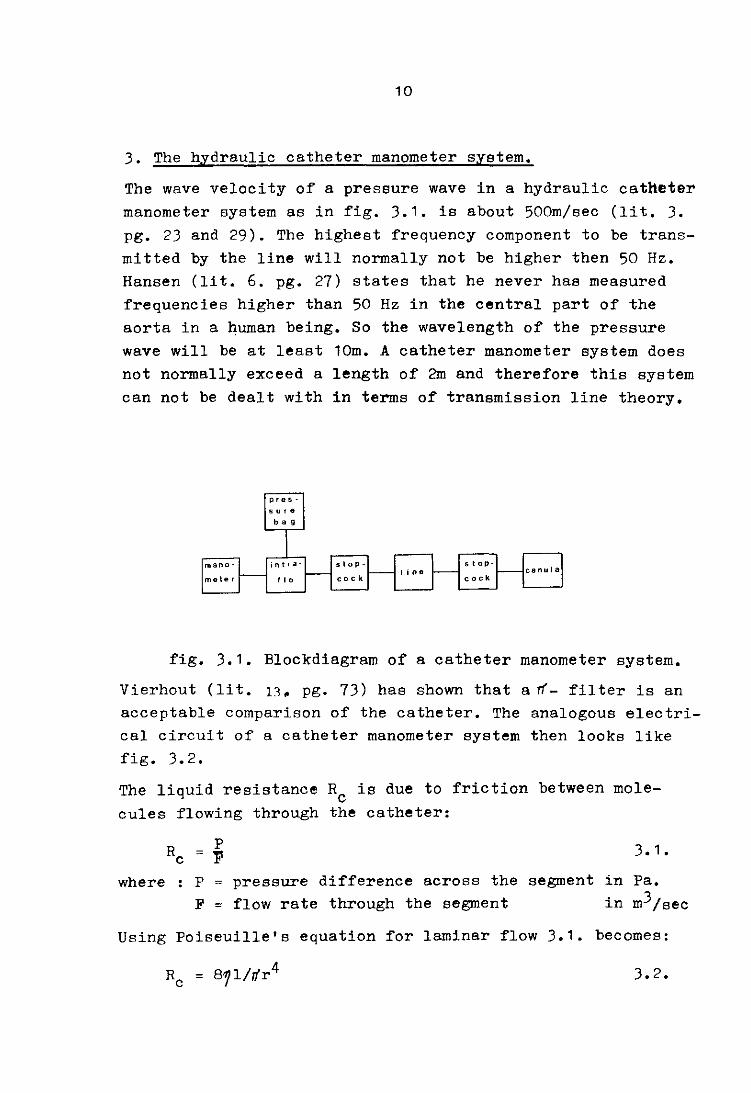
3. The hydraulic catheter manometer system.
The wave velocity of a pressure wave in a hydraulic catheter manometer system as in fig. 3.1. is about 500m/sec (lit. 3. pg. 23 and 29). The highest frequency component to be transmitted by the line will normally not be higher then 50 Hz. Hansen (lit. 6. pg. 27) states that he never has measured frequencies higher than 50 Hz in the central part of the aorta in a human being. So the wavelength of the pressure wave will be at least 10m. A catheter manometer system does not normally exceed a length of 2m and therefore this system can not be dealt with in terms of transmission line theory.
fig. 3.1. Blockdiagram of a catheter manometer system.
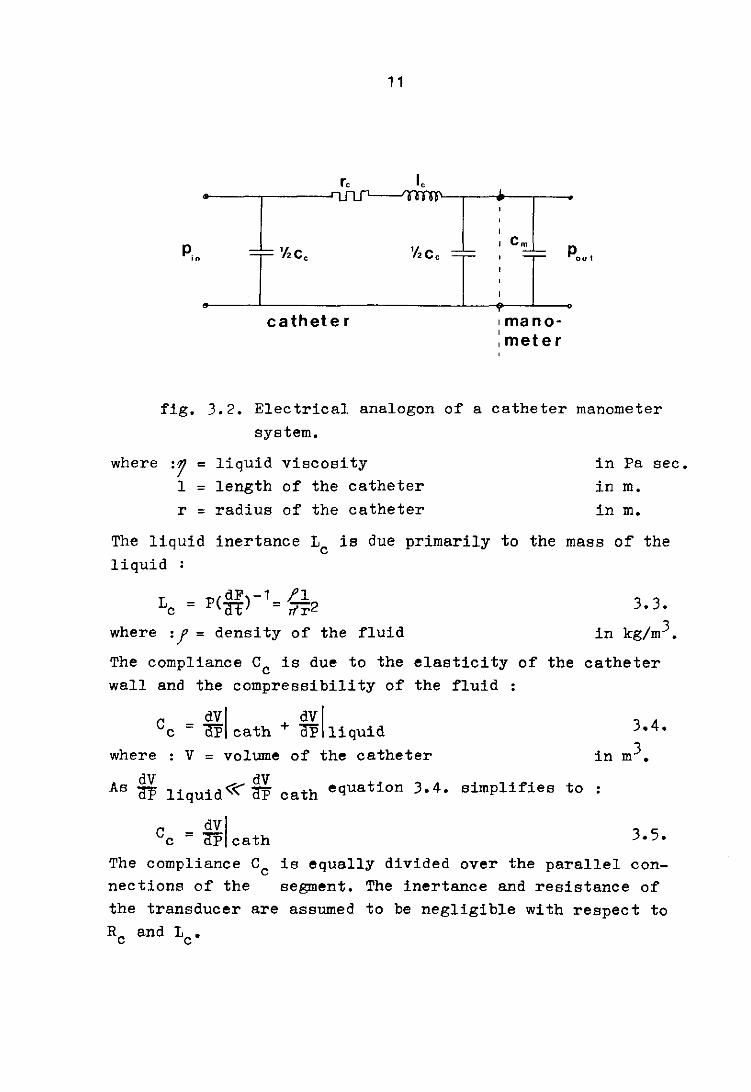
Vierhout (lit. 11. pg. 73) has shown that a rr- filter is an acceptable comparison of the catheter. The analogous electrical circuit of a catheter manometer system then looks like fig. 3.2.
The liquid resistance Hc is due to friction between molecules flowing through the catheter:
Hc P 3.1 • ~ 11
where : P pressure difference across the segment in Pa.
F ~ flow rate through the segment in m3/sec
Using Poiseuille's equation for laminar flow 3.1. becomes:
3.2.
1 1
r, I, •
L ~
I : cI •
p 'I,c, Pout 0" T 'c, T 0
T • f cathete r I mano-
I
I meter
fig. 3.2. Electrical analogon of a catheter manometer system.
where :1 c liquid viscosity 1 = length of the catheter r = radius of the catheter
in Pa sec. in m. in m.
The liquid inertance Lc is due primarily to the mass of the liquid :
L = p( dF)-1 /1 c CIT = rlr2
where :f = density of the fluid
The compliance Cc is due to the wall and the compressibility of
C = ~I + ~I c uP cath uP liquid
3.3.
in kg/m3•
elasticity of the catheter the fluid :
where v = volume of the catheter
3.4.
in m3• dV dV
As OF liquid«OF cath equation 3.4. simplifies to
C _ dvi c - OF cath 3.5.
The compliance Cc is equally divided over the parallel connections of the segment. The inertance and resistance of the transducer are assumed to be negligible with respect to
Rc and Lc'
12
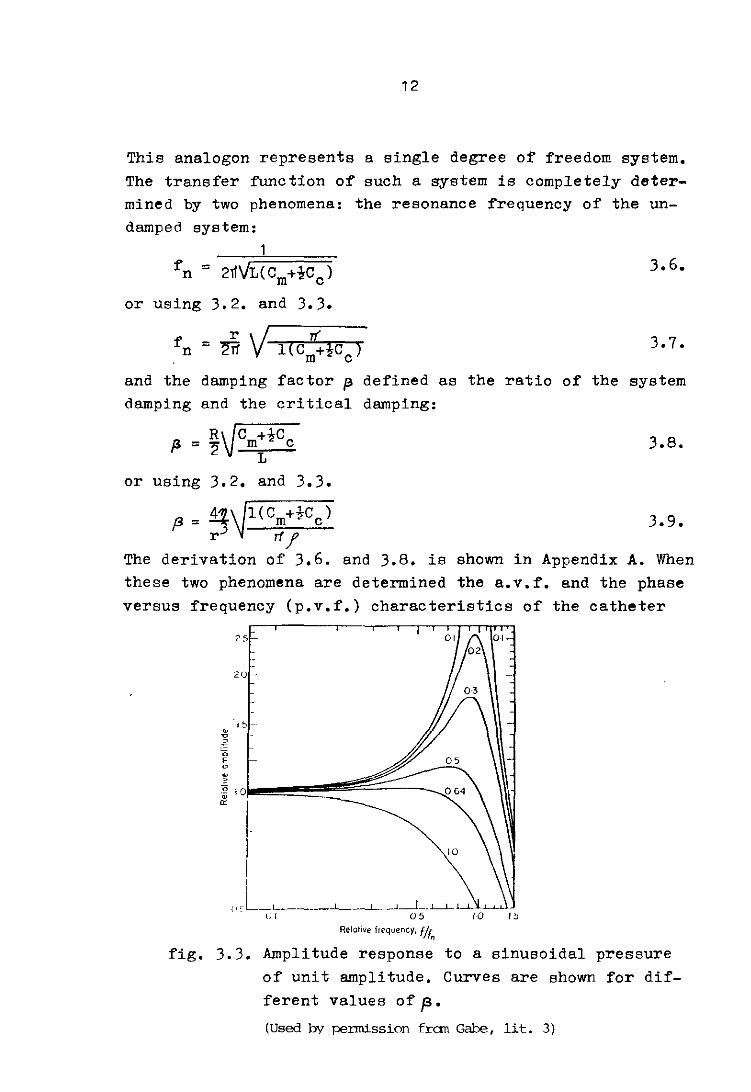
This analogon represents a single degree of freedom system. The transfer function of such a system is completely deter-mined by two phenomena: damped system:
the resonance frequency of the un-
1
fn = 2~VL(Cm+tCc)
or using 3.2. and 3.3.
r V if fn = ~ l(Cm+!Cc )
3.6.
and the damping factor ~ defined as the ratio of the system damping and the critical damping:
f3 = ~VCm+~Cc L
or using 3.2. and 3.3.
3.8.
f3 = ~~l(Cm+~Cc) 3.9. r rtf
The derivation of 3.6. and 3.8. is shown in Appendix A. When these two phenomena are determined the a.v.f. and the phase versus frequency (p.v.f.) characteristics of the catheter
2(j -
.... "ItJ-~
" n E o
~
] '0,
I I
(., L_'--__ -"---_-"----'--' UI '" Relatille frequency, flrf!
fig. 3.3. Amplitude response to a sinusoidal pressure of unit amplitude. Curves are shown for different values of f3. (Used by permission fran Gabe, lit. 3)
13
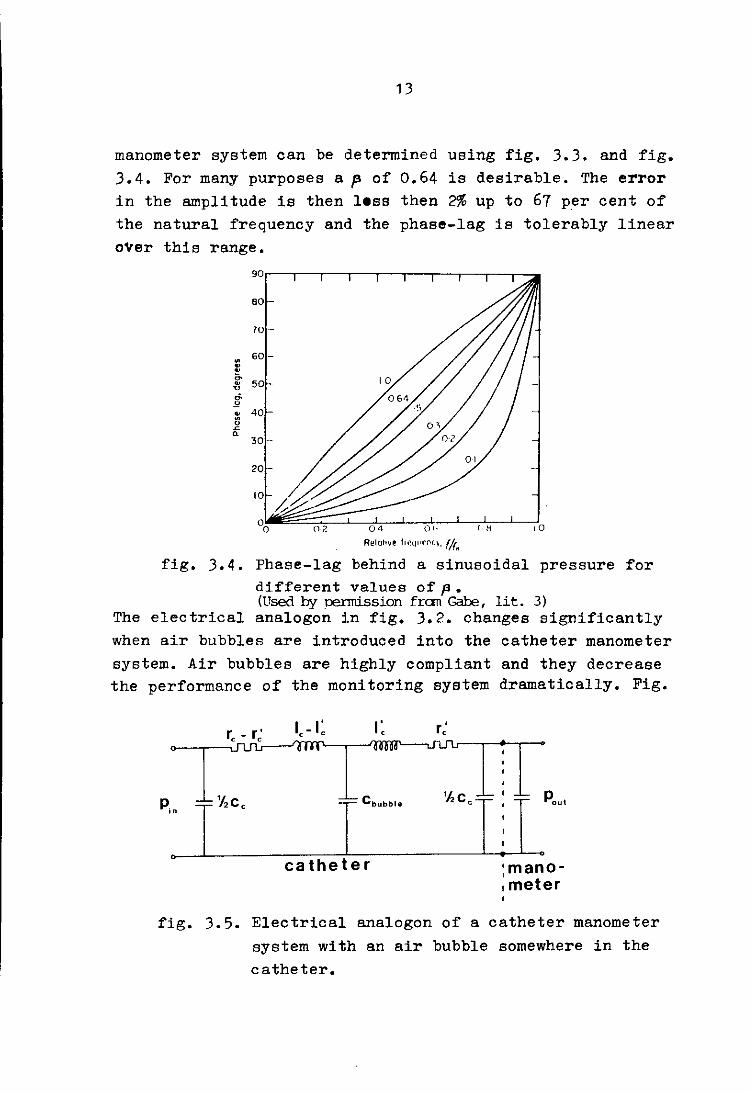
manometer system can be determined using fig. 3.3. and fig. 3.4. For many purposes a p of 0.64 is desirable. The error in the amplitude is then less then 2% up to 67 per cent of the natural frequency and the phase-lag is tolerably linear o~er this range.
70 --
• 60 -~ ~
<;. ~ 50 u
0.
" ~ 40 0 ~
" 30-
20
10 / ~
°0 02 04 o!- (, H ,0
fig. 3.4. Phase-lag behind a sinusoidal pressure for different values of f3 • (Used by oennission fran Gabe, lit. 3)
The electrical analogon in fig. 3.2. changes significantly when air bubbles are introduced into the catheter manometer system. Air bubbles are highly compliant and they decrease the performance of the monitoring system dramatically. Fig.
I Cb"bbl •
• catheter :manoI meter
fig. 3.5. Electrical analogon of a catheter manometer system with an air bubble somewhere in the catheter.
14
3.5. shows the electrical analogon of the catheter with a bubble somewhere in the catheter. When the bubble is situated at the transducer (L~= 0 and R~ = 0) the resonance frequency of the undamped system fn and the damping ratio ~ of the system are:
3.10.
and
f3 = ~\Jl(Cm+~Cc+Cb) 3.11. r V 11/
Comparison of eq. 3.7. and 3.9. with 3.10. and 3.11. learns that fn decreases and p increases when an air bubble is introduced.
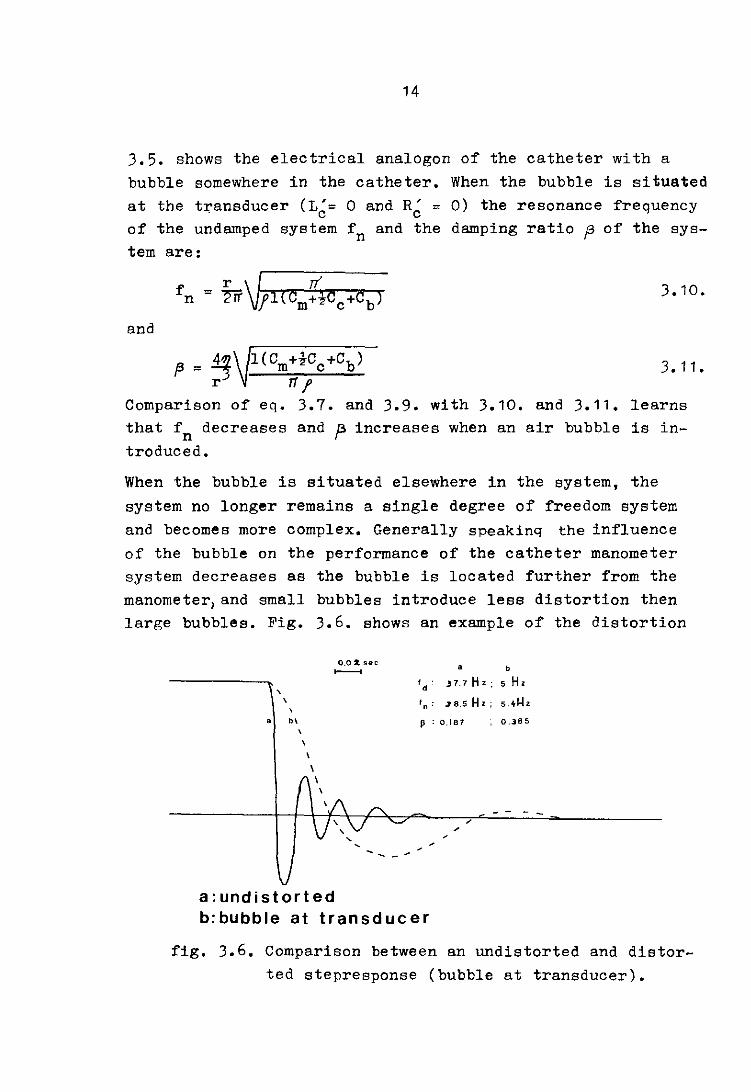
When the bubble is situated elsewhere in the system, the system no longer remains a single degree of freedom system and becomes more complex. Generally speakinq the influence of the bubble on the performance of the catheter manometer system decreases as the bubble is located further from the manometer1and small bubbles introduce less distortion then large bubbles. Fig. 3.6. shows an example of the distortion
, , , • b\
0.02. sec >---<
-- - -a: undistorted
• b
fd
· ,37.7 Hz; 5 Hz 'n; 38.5 Hz; 5.+l-Iz
JJ : 0.187 0.385
b:bubble at transducer
fig. 3.6. Comparison between an undistorted and distorted stepresponse (bubble at transducer).

15
of the stepresponse measured with an Ailtech transducer connected to a 4 ft poly-ethylene pressure line and a 20g canula. The bubble is situated at the transducer.
16
4. Determination of fn and ~ by transient stepresponse.
The response characteristics of a catheter manometer system can be determined in two ways. The more accurate method, but also more complicated, because it requires special equipment, is to measure the frequency response of the system. A simpler and for our purposes more practical technique involves measuring the transient etepreeponse.
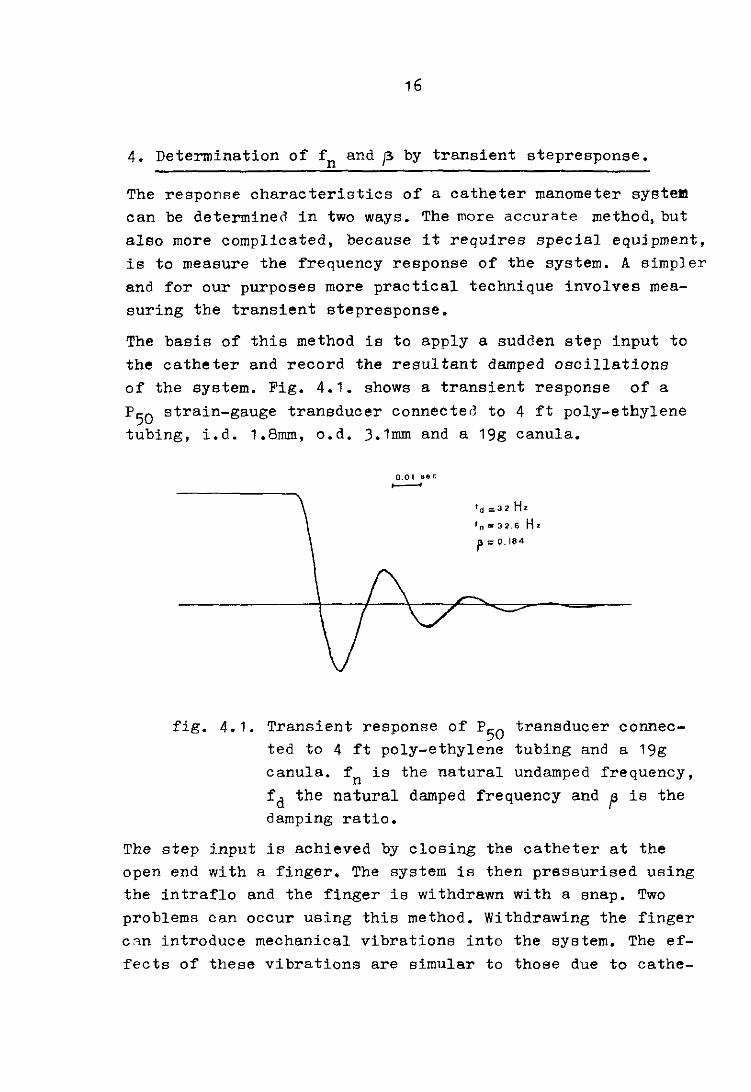
The basis of this method is to apply a sudden step input to the catheter and record the resultant damped oscillations of the system. Fig. 4.1. shows a transient response of a
P50 strain-gauge transducer connected to 4 ft poly-ethylene tubing, i.d. 1.8rnm, o.d. 3.1rnm and a 199 canula.
0.01 S8C
0----'
fd: 32 Hz '0=32.6 Hz p;O.16'
fig. 4.1. Transient response of P50 transducer connected to 4 ft poly-ethylene tubing and a 199 canula. fn is the natural undamped frequency,
fd the natural damped frequency and p is the damping ratio.
The step input is achieved by closing the catheter at the open end with a finger. The system is then pressurised using the intraflo and the finger is withdrawn with a snap. Two problems can occur using this method. Withdrawing the finger c~n introduce mechanical vibrations into the system. The effects of these vibrations are simular to those due to cathe-
17
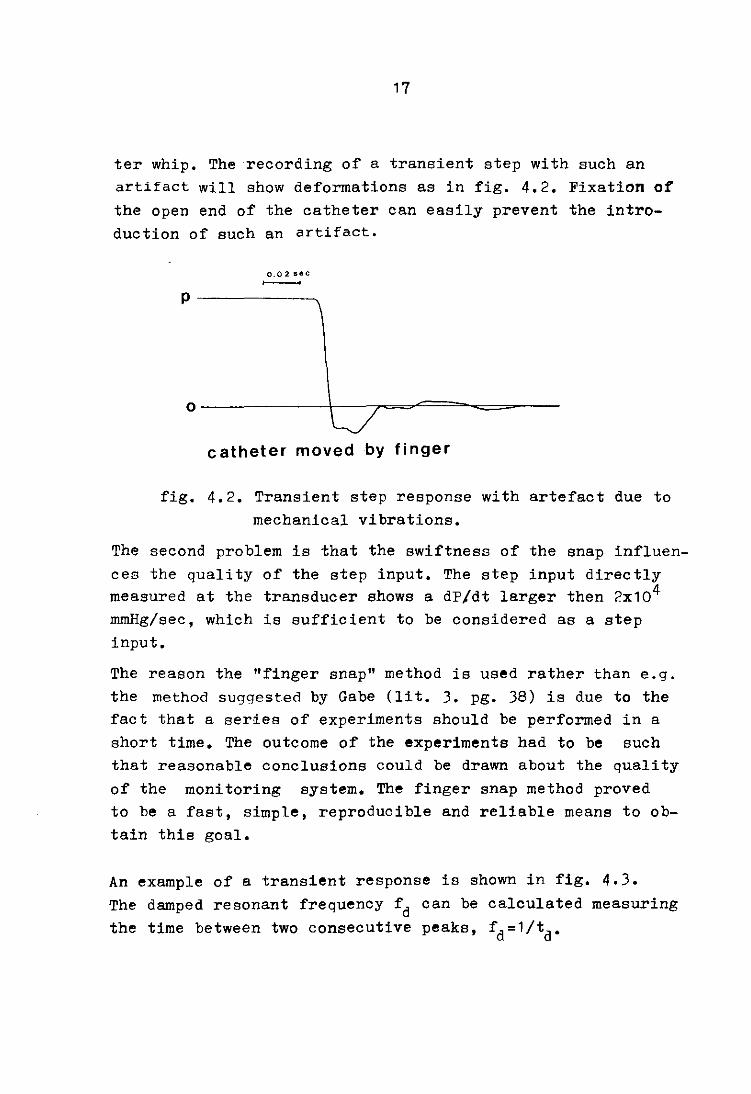
ter whip. The recording of a transient step with such an artifact will show deformations as in fig. 4.2. Fixation of the open end of the catheter can easily prevent the introduction of such an artifact.
0.02 sec >----<
p--------..
o----------~--~==~==-===----
catheter moved by finger
fig. 4.2. Transient step response with artefact due to mechanical vibrations.
The second problem is that the swiftness of the snap influences the quality of the step input. The step input directly measured at the transducer shows a dP/dt larger then 2x10⁴
rnrnHg/sec, which is sufficient to be considered as a step input.
The reason the "finger snap" method is used rather than e.g. the method suggested by Gabe (lit. 3. pg. 38) is due to the fact that a series of experiments should be performed in a short time. The outcome of the experiments had to be such that reasonable conclusions could be drawn about the quality of the monitoring system. The finger snap method proved to be a fast, simple, reproducible and reliable means to obtain this goal.
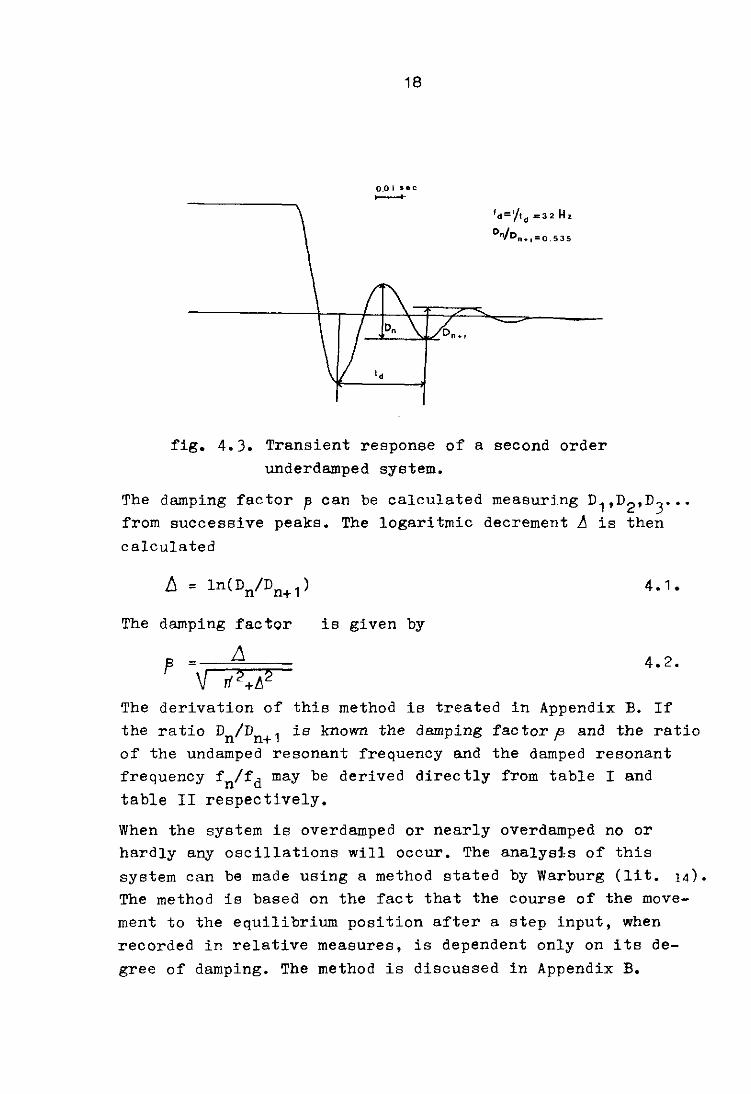
An example of a transient response is shown in fig. 4.3.
The damped resonant frequency fd can be calculated measuring
the time between two consecutive peaks, fd=1/td'
18
QOI sec .......-fd=,/t d ==32 Hz
°n/D"+1=0.535
fig. 4.3. Transient response of a second order underdamped system.
The damping factor ~ can be calculated measuring D1,D2 ,D3 .•.
from successive peaks. The logaritmic decrement ~ is then
calculated
The damping factor is given by
4.2.
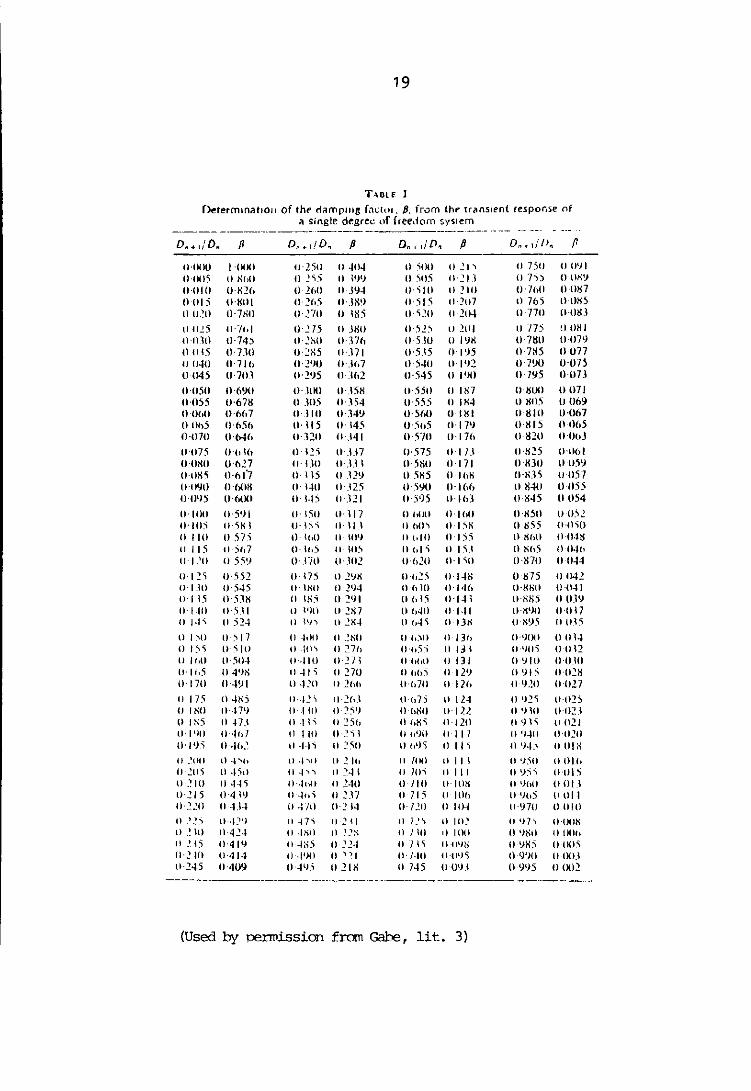
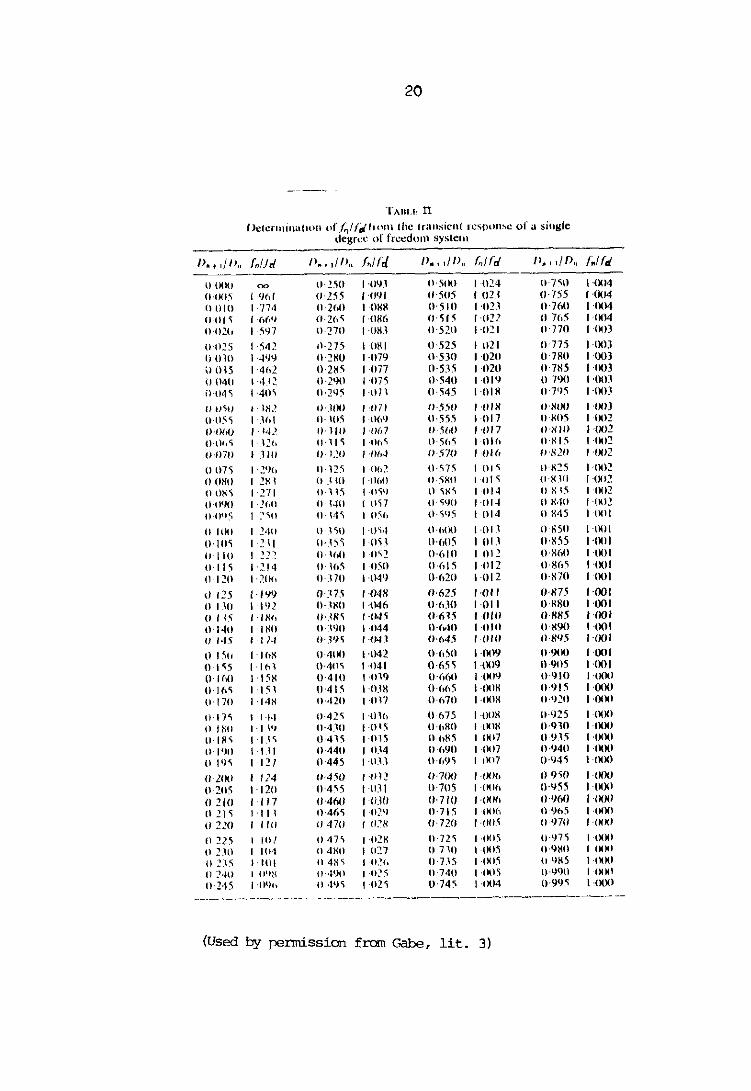
The derivation of this method is treated in Appendix B. If the ratio Dn/Dn+1 is known the damping factor f3 and the ratio of the undamped resonant frequency and the damped resonant frequency fn/fd may be derived directly from table I and table II respectively.
When the system is overdamped or nearly overdamped no or hardly any oscillations will occur. The analysis of this system can be made using a method stated by Warburg (1i t. 14).
The method is based on the fact that the course of the movement to the equilibrium position after a step input, when recorded in relative measures, is dependent only on its degree of damping. The method is discussed in Appendix B.
19
T"Ol,f )
Oetetmlnaflon of the dtlmplIIg fnchll, /J, from thf" tranSient (esponse of a single dt:grec of freedom sy~lem
_._-- -.---------------- ---------_.- -- .. - --~
D". d D" P D" .. 110" P Dn'I/D" P D"~d",, P
IHHIO j·Ooo 0'25i1 IJ -10" I) )00 II ~ I 'I tJ 750 o tI') I IHIIIS (11'\('0 o 2 ... 5 1) .\I)t) o 511:'S j)'2 I 1 07') () OK\)
0·010 O'H2h 0-2l10 II\Y4 O·~IO t) ] 10 U-7hO 00~7
0015 tHHII (I- ~{li O'J1N (1,515 11·207 I) 765 tHn~5
tl tllO 0-7xO o·no IJ IH5 O·5.:!O 0·204 ono (I·mu IHI25 II· "/Id 0'275 I) JHO 0·52) 0101 o 17) o Uti I (HIJ!) 0-745 II' 2S0 O·17tl 0- 510 o IIJ/{ 07MO (1'07') o Ol5 0-7.10 tL~1'\5 ,,- _171 U-5J) o· P)5 0-7~5 0077 00-10 1)'71h 0'21)0 0-.167 0·540 0' 19:? O'7~O ()-075 () 045 0-701 o <!t)5 () . .1(12 0-545 () 11,0 (I-N) U07J
1)-(150 n'6~X) O-JIKI j)·J5H 0·5;11 II 1i'l7 tHsLH) IJ Ull tHI55 0-67K (1.\05 (). 154 0·555 tl I H~ I) ~Il.'i IJ (169 C)'OhO 0,667 (1 . .1 10 (I- .141) 0, ~tl() 01 K I IHun 0-067 o OhS tH15h 0-115 0-145 U':)h5 (I. I 7lJ O-KIS n 1)65
0-070 U·b46 U' 320 "-_141 IIS/U O'17h o B20 (H}ld
(H175 O'hlll 0- I.!'i U·.U7 0- 575 o IlJ O'X:!5 (H161 U'OXO u·tl27 ,,- 1.10 tH_11 n·5~() 0-171 O-KJII U ,(51)
(l-iH{'ii 11-01'7 0- 115 o .121) o 5KS (I. 1M; lJ-x_15 " 057 O'Ol)O f)-bilK II- \-to II· .12.5 O·.WO I)'IM) o K411 0055 0'()I)5 O-6IX' " \.1) 0'.121 0·595 t)'lh3 IIK45 Ii 054
o . IOu lI·jl)l 0- I ~tl 0·117 () hOIl O'lhO 0)150 0,0':\2 0·105 o·')K 1 ,,- IS'i 0- III 000') t)·1 :'ix n t)~5 1.1·1),0
o 110 t) 57 i 0 IhO " UIIJ I) toll) o· I)'l o XhO (HI4~
t) I 15 II· 5'1 7 o- lio.') 0 10) U hi 'i II I'U o Hh5 (1)411
0·120 0·551) u- no (I .102 0'620 0·1 'iO Ii-K70 (lU~4
u· I .! 'i 0·552 (I- 175 0· 2'JX 0'1,2.' t). I-IN OK7S 0,1)42 (I·UO 0·545 ,,- IxU o· 2'1)4 O'()lO O'I~h O·HHO 0·041 D· I ~5 0·511< " lSi 0·291 (HIlS 0·1-11 tH~Xj 00.11) o 1·111 0· 5.11 " 11)0 " 2X} o h4il o 1·11 t)·x90 11-(1 17 0)·1" 05::'.4 " \')"'1 (l2X-l 0'1I4'i 0·130 (I'x')) o Ol5
II 1 ..... 0 II ) 17 () -hit! II .~xo o (0.'10 II 1311 () .I)t)() OtH-t o I j'i (1.,\ 10 II ·In" II 27h 0'11) 'i II 13 \ 1I·IUl) o·oQ II I htl 0· 50-1 0,·110 0·271 O'h(oO II I J I o I) It) O·O.HI 0,11,5 " 4'JS II 41 'i () 270 II IIh) /I 129 (I I) I ~ O'O~H 0·170 n'4~1 I) -1.:'0 II lilt) 0'(170 I) 126 (J 'J20 (l·on II 175 O·4K5 0,·12 ~ n'~(d tI'h7) II 124 I) '12'i o·n:!) o l/'ill o··nl) I) .~ HI II 25 1) I) h/'iU 0'122 () ,) ~o Il·02.~ o ) S5 0 .. 1-' II ·1" II 25h o llX'i 0'120 ulH'! {I 021 II· 1'10 II ·1f,7 t1 ·1 III I) 2'i I (I 1,')11 /I 117 II ',...0 0·020 0'I'J5 o ..JfI.~ II ~4 'i I) 2:'\0 I) tli)) tl 1 I 'i 0')·1) U UIH o .'tlil II ..j .... /> II ·1 .... 0 (12111 II /410 I) I I I II ')41 O()Jh 0.2(1) II ·I:'til II ·1 ...... 1 II ::'4 \ II lO'i II III o '):'i"' 0·01') o .~ 10 II 44; O··lc>O (I 2·10 () 710 t1·IOH II ,),,0 OOIJ tV:! I 5 0·4 ~l) II 4" 'i tJ 2.17 II 715 {I Itlll (I t)(J) (I till 0·220 1\ ~.14 " ·1"71) 0·21-1 0·720 II IO~ 0'1)70 0010 n .'2) II··I~') II ·n'i I) 211 o 7.''' II 1 t1~ II tn .... II'OOH o .! 10 11·42·1 II ·V'ill II ~ 2x II J 10 11 100 (I ')XII II DOh II !. l:'i O·4IY II ·Hi5 II .:'24 I) "I \" 0'09H iI'I)H5 1)-(105 0·210 0·414 II .1 1)11 11.:'21 II· /"'0 IHI')'i I) t)')O 0·003 0·245 0-409 0'-11).'1 o 21x II 745 O'OIJJ (l.INS I) Oil.:!
----- ------_. __ ._- _._---_ ..
(Used by permission from Gabe, lit. 3)
20
ThilL!: n llelCnninafHHl of/~/ftl.ll<lm fhe fnillsicni n.:spon~c of a single
degree of frct:dolll SystCl1l
/)~ t 11O" [oUd 0,.. 11O" [,lid. 1' .. 111 nIl ("lid n,. I II n'l /;1 rtf () OtH.J ~ 0-2.50 ',09.1 0· )IH) '-024 0-750 -IXI4 (HJO:'i" I <)tJ f OI~5 '-IN' (j-505 f 023 (I- 755 -(kI4 0010 1·774 0· 2(10 '()HK ()-51O "02.1 ()-7611 -IXI4 (lOf"i '-6(,9 (f':!(l-Ci I -OR6 II- 5'5 I -(Ill (I 7h5 IKJ4 j)'O;!(, 15~7 O<!70 I-OR.1 (1-520 1-021 (l- no mJ
O-O:!5 '·i42 n'21) lOKI ()-525 1021 0-775 -(Ml3 0(11) 1'4'}Ij O-:!KO 1-1179 (l-530 '020 (l7K() -{)03
i.I 0\5 '·462 ()-2RI 1-077 ()-S15 I-mo ()-7RS -(KlJ () {I4U '-4.1:: O·29n 1-075 ()-540 '-019 0-790 -IXU 0-04<; 1·40'1 O'2LJ~ '-071 () -545 I-OIH 0-795 -(MIJ
I} ,,"it} · lH.~ .)·JOU , -Oil "-550 I -(IIX IUHH' -mJ (HI)5 -'hi j)- HI,1 I -1)(11) 0-555 1017 I)-MUS OU2 O·()(~V ·142 H·110 1,067 a'SM) , -Ill 7 fhlno '-(MIl (Hill) ·12<\ 11·11 '; ,-0/1<) t)'5h5 '-Olh tHUS l-nU2 0-070 ,1111 (J·I.!O '-1)64 1)-570 1'01(' f)-H2O 1-002
007') · 29() 1)-125 '-O/l:! 0· 57 .... 1·0, ... o-te5 "on:! o m<ll ~x I 0-.\ to I ·11/111 "-iHO l·ol"i (I.t-( 10 ,·OO! 001'1) 271 0·11) '-II'i') II "'1'1) III 14 o H (5 I 'O(ll
tHI<lO · !(,(j f)·qO ItI'i7 (j·"i90 "OI,t (I x40 1-(K)2
IH)I)) _''ill o· 14) (1-"(1 0·)115 1014 Il X·l1 I 'UIII
(1100 ~4() 0· _, "i\) '''''4 (I-fiOO -0 )1 ()o50 I-IMII 0-105 ..:! \I O-J5~ 0\1 O'hOS 01.1 (l-K55 "'." 0-110 .!!2 I)- '()("I ·11'; :! 0-6!0 012 O'\{60 I -IKII
" 115 '::'.14 0'-'(15 050 () ·615 012 tH~(,5 I-(XII O-!~O ·20(, () -J7() ·tW) 0·620 -Il 12 "-KlO I (XII
\1·,25 -ltll.) 0-.17.1 -04H 0-625 -Oil 11-875 1-001 o I.~O ·11J1 f)'_~HO -046 Il-b.1(l 011 (HHO I -001
01 {5 ·IN(, 0- .lHI ·045 (l-615 -(l III O-HH5 /-flO' 1)'140 )RO ()<\\}O -('44 "-Mil ·010 IlH90 1-001 IJ 145 - f '" H·.W'i {J·n 0'645 .(1/0 O'fN5 1-110'
o ISU -lflX 04(KI -()4l 0-650 -009 0-91lU 1-001
0·' '"is ·lb1 0·40'" 041 (H51 -(X)9 09n5 I-(XII 0-)'" ·15K ()41() ·,n9 0-(,60 ·(M)\.} 0·910 '-(MM)
0·16:,\ ·15 , 041\ I -0.18 ().(Il!) I-IMIS 0·915 I -()(Xl 0·170 -14H I)·,no l·on 0·670 ,,1)(11{ 0·920 I-(XXI
1i·17; '1+1 0·42<; "Olh n-ll7) !'Oo\{ (1,925 I (XXI \l I !'III · J \11 0·4.10 I ·In 5 (J'hIW I·IMIX 0-910 IOIXI O·!fI'i IY' 0·4 \5 '-015 O-hKS , 007 0-91:'i ( -(MXI 1I'I(m ., 11 0-440 I 014 0·690 1-007 0-940 I-(XXI () 11),\ 121 0445 I ,o.n 0'i195 I (107 ()'945 I (MMI
(12m 'J4 0·450 1·~n2 fl- 71~1 '·006 () 9,0 '-llIlU (1·205 -120 0-4,5 III) , 0-705 !·(MllI O-~\S 1-(MXI
0210 -117 (/-460 1030 (I- 7111 HHlfJ (j-960 '-I~XI
o 21 ~ -)/1 t)·411'i I ·II) II 0-715 '·006 O-l.)tlS , -(.)(1
(1210 110 " ,17(1 I 0."'1< (J·720 "(10,\ (1970 I-IN.I
o ::!2S 10 ! II 47'; I -(12K 0-]2, I 'Ittl) 0-071 I -l)OO
o ~~o IO~ o 4Htl I o:~7 I) 710 l-(H':"; t)·9HO I OOtl
\I :'J5 . !til 11 4H" I -tl.~( I II-ns 1'(105 II IlXS I(WKI II ]40 I jll)H 0·490 , '0.') 0·740 l'IKl~ 1)·1)90 I INNI
I)·HS I ·INh o of'}" 1·02') (l-74~ I-IX14 0·99.5 I ·()o" -.------ -- ----_. - ._---. _ .. _-_.- -- ----------------------.---
(Used by permission from Gabe, lit. 3)
21
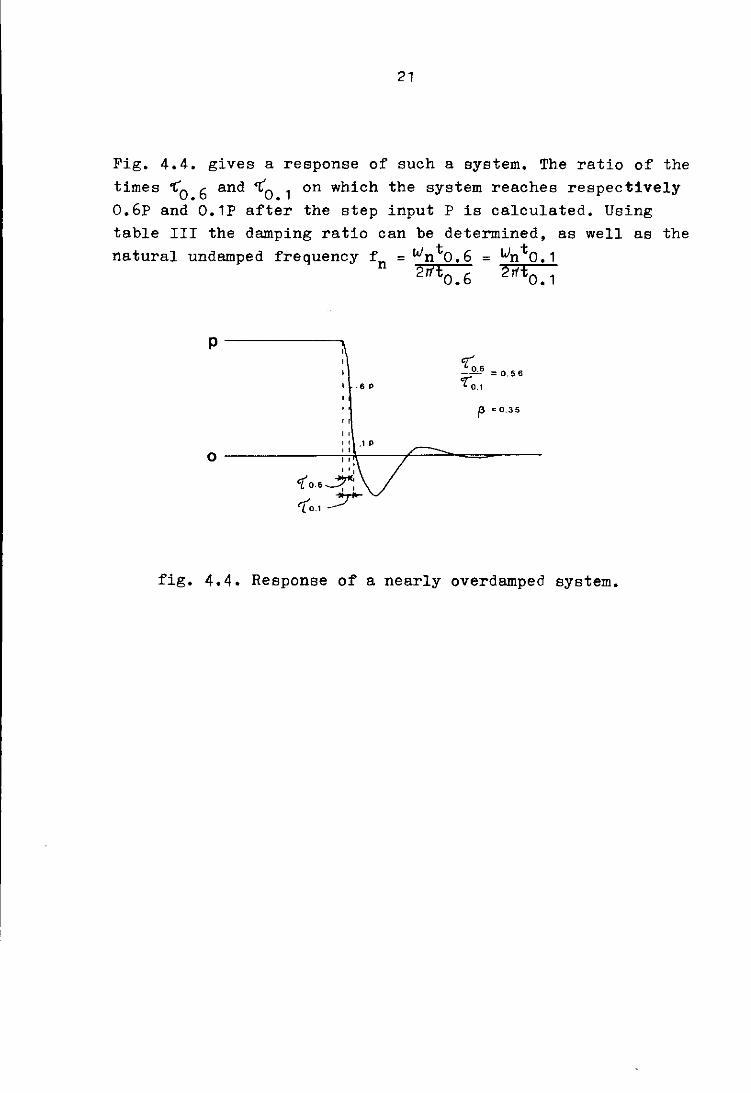
Fig. 4.4. gives a response of such a system. The ratio of the
times ~0.6 and <0.1 on which the system reaches respectively 0.6p and 0.1P after the step input P is calculated. Using table III the damping ratio can be determined, as well as the natural undamped frequency fn = wn t O• 6 = Wnt O.1
2ri'tO• 6 2n'tO• 1
p 0:( _Jl..6 = 0.56
I .6. '(0.1
f3 -0.35
" " , ,
0 ' I
"
fig. 4.4. Response of a nearly overdamped system.

22
lJ .. / o. b WAOfU.'1 To,,"
f3 l'"., 0.20 o.mJ 1.68 U.5~9
0.25 1.01 1.74 0.580
0.:10 t .{13 l.tlO o.;)n 0.35 l.u5 un O.fliH
0.40 1.07 l.H5 (l.a-W
tUri I.OH 2.H4 0.534
0.;)0 1.11 2.14 O.51~
0.55 1.14 2.~:; 0.507
0.60 1.lii 2.:17 OABO
(J.t»;) lotH 2.:,0 0.47'2
0.70 1.21 2.64 O . .fril)
O.7fl 1.2:~ 1.HO UA:IH
O.HO 1.2H 2.!18 O.42:l
IU~5 J.2!J :tl\l D.·tool
O.Uo 1.:12 :1..12 O.:JH6
0.05 1.:15 J.IiH O.3tH)
1.00 I.ax :1.\11 O.:lfl:1
1.05 1..11 oj.lli O.3;W
1.10 LH 4.42 O.;I~W
I. 1:1 1..11'1 1.1i7 0.:11 7
l.:W I.[d ./. !';' O.:WIi
1.25 I.;);) f). IS 1I.2!HJ
1.:W I.M' 5.44 (1.2\12
t.J5 1.0:1 5.6tI O.:UiIi
1.40 Ui7 ;1.!!4 0.281
l...Jf) I. 71 li.tV 0.271'
l.rW 1.7!") tL-l.J 0.:02
1.55 I. 7!! H.W O.2tiH
1.60 I.S:! tU)4 O.2ti-l
1.65 un 7.1\1 O.2(-iO
1.70 I.HI 7.-1:( 0.257
1. 7 5 I.Uti 7.li? O.2i"llt
U~O 2.(10 7.ti:! O.2[):~
1.85 2.04- x.17 0.2!":·1)
I.HO :um X.42 H.2·Hi
t.!15 2.14 tUI7 lI.:!47
:LOO :!.IU lUIJ U.24:1
Table III Determination of the damping factor p from the relative time ratio '1.0 • 6/1'0.1'
(Reproduced from Hansen, lit.. o)

23
r::; ".xrerimcnts.
_ehe frequency response of 8. cc~thetl·'r manometer systc;m ~. as studied hy Gensre.ting a step, at the catheter-tip. The CiCllula -;IOS closed w; th a fj_nr:er, till the pressure in the cyetcm reached a certain 1 evel. 't'hen the canula was opened by vlithdrawiDR; the finver -."i th a snap.
~P~·e c,-:tbctcr manometer system existed out of 3 can:1l;::}, tVlO
or three nressure-lines connected to each otter with a stoncock,' an intraflo ar'c1 a Illanometer(~ transducer). l'be blockd iap:ra:n of thie experimental composj.tioT' C8D be pet l~p as fo1 Lows:
P.B
r ::;; ';'r:1nnrJuc0r ~ -''1i;rnflu
~, ~ C;topcock L - }Jrossurc-Line C - Canula }' .B.~ PresBure-Ila8( 200-.,00 mm JIg)
~;['J.1ulp.f; of' d i f'i_·ere~--.t, intprnaJ cliD!TI8tcr and JJ·nrt'lJ ',-Jere tcrr -
ted ( SCle table V 1.), 8fl 'i'ell DG pr,~ssure-lincc of differclt ~tiffne~B a~~ len~tl] ( soc t3ble V.>. :~~rinG tbe cxperi~~ntG ttreB ~lfferent transducers hnve heen used ( see tahlc l~.).
'el:c: reRponEeC' of t~le cnth::-\tor 'TIo_Ylo?:1etcr c;ystr.mf' '::ere reCD:'C-()E'eJ .. it!! Ct :',-it1.IT o::".r8f H.?, of Sicmcnc-:'le::1a. ijll1 e pnnersY)('c'rt 1.':'fl·'" v(~rjClol,:~ from ~'r:/) min/soc. up to 1C1()O !run/sec.
24
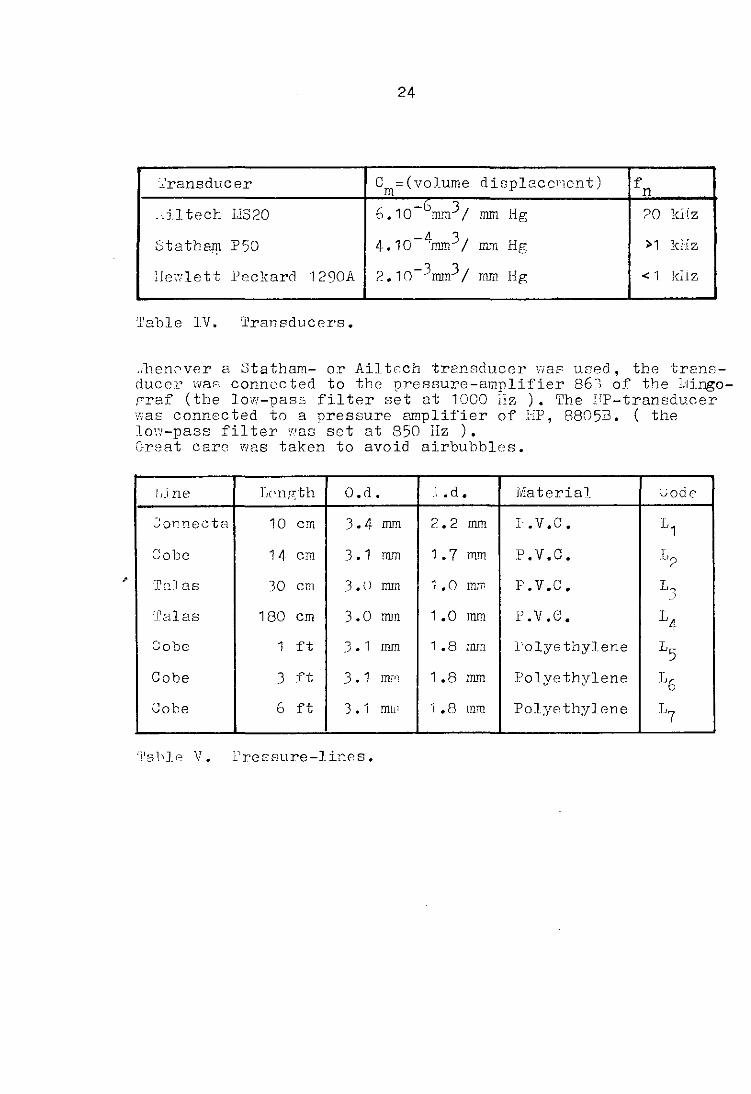
'c'ransduc er Cm=(volume disp12ce1'lent) fn
_,il tech i,iS20 6 -b, 3 .10 mm / mm Hg ?O kilz
Statham P50 4.1O- 4mm3 / 1ll'11 Hg >1 kHz
iJe',',llett 1)2ckard 1290A ?10-3mm3 / mm Hg <1 khz
Table IV. Transducers •
. J1enC'ver a Statham- or Ailtrch transducer I-ias used, the transducer was connected to the pressure-amplifier 86': of the l:!ingor-raf (the low-pass filter set at 1000 j!Z ). The IIp-transducer was connec ted to a pressure amplifier of !-IF, 88053. ( the lo~-pass filter was set at 850 Hz ). Great care WBS taken to avoid airbubblcs •
llj ne Lc'ngth O.d. .I • d. j"IIaterial ';00(,
:':onnecta 10 cm 3.4 mm 2.2 mm I. V.C. L 1
Cobe 14 em 3.1 mm 1 .7 mm P.V.C. [,2
IrQ] 38 ,0 cm 3.() mm 1.0 mm P. V.c. J'3
IJ'alas 180 cm 3.0 !lUll 1.0 mm P.V.C. L4
Cobe 1 ft ') • 1 mm 1.8 mm l'olyethyJene L5
Cobe .3 ft .3 • 1 11l!i] 1 .8 mm Polyethylene L6
Cobe 6 ft 3.1 mll1 1 .8 111m Polyethylene J'7
Ta111p V. PrcEsure-lines.
25
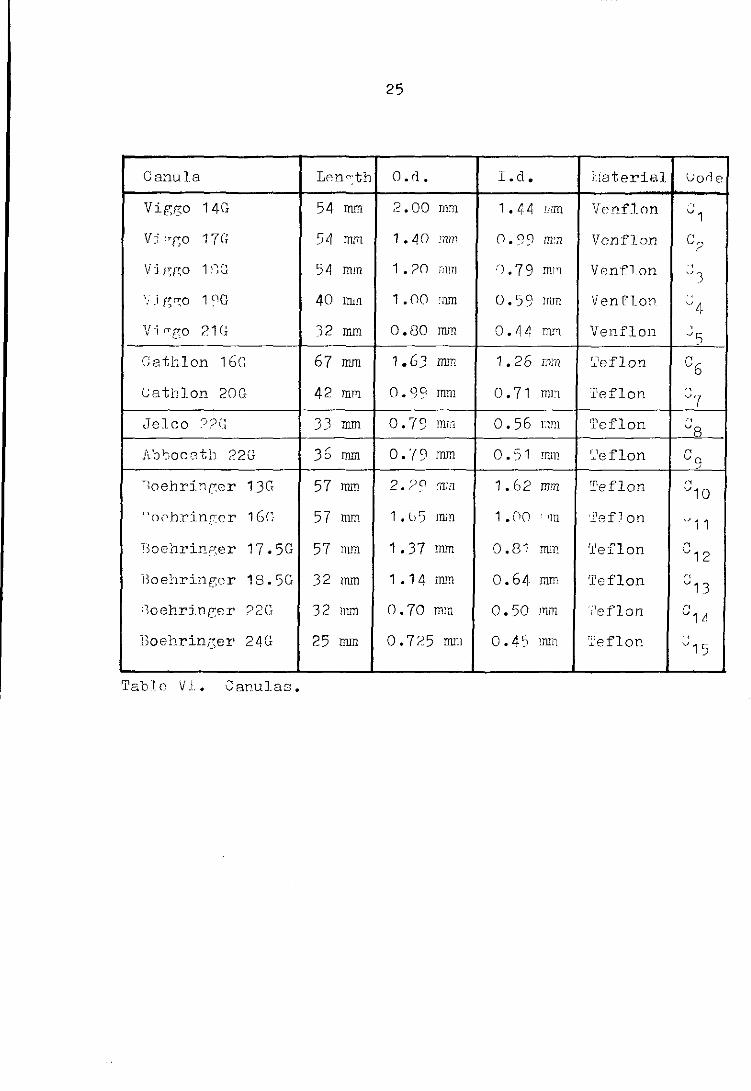
Canula Lf>TIc:th o. (1. Ld. Haterial Goele
Viggo 14G 54 mm 2.00 mm 1. 44 ll,ffi Venflon "
'"'1 Vj rrp,o 17(; 54 mm 1.40 !TIm 0.99 m'n Venflon C,..,
~
V j /;(',0 1 ciG 54 mm 1 .?O 111m ().79 ml~ Vcmflon ,
'-~ J , .':1 ~n:.o 1"G 40 ffim 1.00 ~mn 0.59 rnm Venflon "
"if V·j crf!O ?1G 32 rom 0.80 mm 0.4P. 111."1 Venflon
, ~5
r::etblon 16c: 67 rom 1.63 mm 1.26 T,l:n 'feflon C6 catblon 20G 42 mm 0.99 mm 0.71 mn 'l'eflon ~
"7 ,Telco ??(; 33 rom 0.79 lTIn} 0.56 r:1111 Teflon ,"
'"'8
Ab1:',oc8th 22G 35 mm o. '(9 rom 0.51 mm 'l'eflan ~
'"'0 ~
'ioehrin.c:cr 13G 57 mm 2.?C) (nm 1.62 Tn'll Teflon " "10 \~o0hrinr:cr 1 Gri 57 mm 1 • l),) JUm 1 • (10 "m 'llefJ on " 11
'loehrinp:er 17.5G 57 mm 1.37 Illln 0.81 111.111 11leflon n '"'12
l~oehrinr,or 18.5G 32 mm 1.14 IlllTI 0.64 nun 'I'eflon r<
"13 ')0 ebrine;8 r ?2G 32 1nm 0.70 mm 0.50 rnm i'eflon r<
'"'1J }3oehringer 24G 25 Illln 0.725 mm 0.45 mm '~'eflor. "
"15
Tablo Vl. Ca~ula3.
26
6. l{esults.
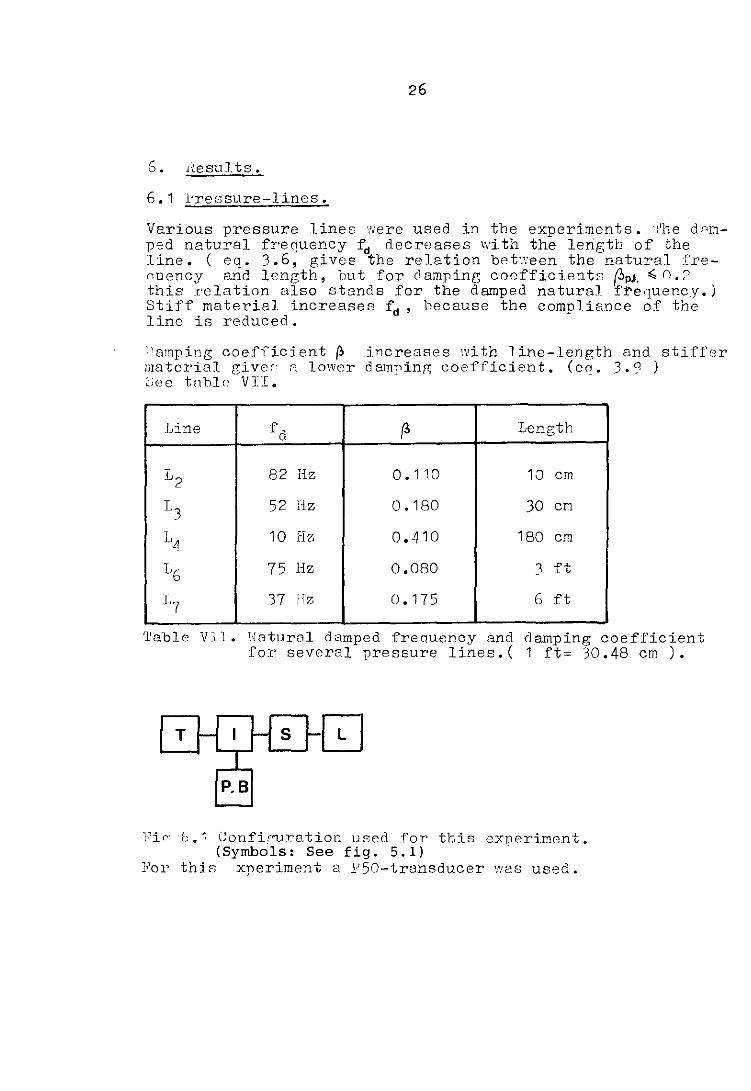
6.1 ~ressure-lines.
Various pressure lines '.'iere used in the experiments. 'J'he dnmpsd natural frequency fd decreases with the length of the line. ( eq. 3.6, gives the relation bet~een the natural frenuency and lenr-th, but for clamping coefficientc ~pJ. ,;;, n.:' this relation also stands for the damped natural fi"e'luency.) Stiff material increases f d , because the compliance of the line is reduced.
"omping coeffic ient {!> incre8ses with line-length and stiffer limterial Giver' R lower damping Goefficient. (eq. 3. Q )
,;ee tnbl" VII.
JJine f d (3 Length
]~2 82 Hz 0.110 10 em
L3 52 Hz 0.180 30 em
1~ 10 Hz 0.410 180 em
L6 75 Hz 0.080 3 ft
1~7 37 Hz 0.175 6 ft
'l'eble VI]. Natural damped frequency and clamping coefficient for several pressure lines.( 1 ft= 30.48 em ).
T
P.B
Fir' b. 1 Confir"uration used for tbis experiment. (Symbols: See fig. 5.1) ..
For this xperiment a ¥50-trsnsclucer ~as used.

27
c,.? Length.
'rhe natural damped frequency f was inversly related to the squar", root of the line lengthdfor both p.v.c.- and nolyet"ylene tubing. l<'ir:;ure 6.2 r~presents this relation for lenp;ths from 30 cm up to 180 cm for both types of tUbing. '.['he nolyethylene line (COEE) is built up by connectinp; 1 ft and ?ft -1in"s. 'I'he n.v.c.-1i.ne had a length of 180 cm, for each other experime'lt , it was each time shortened with 30 cm till a lenp;th of 30 cm remained.
80
60
40 talas
20
OL-____ ~~ __ --__ ----~-----1.180 1-30 -
1
W-(em
Fi& 6.2. Freausncy vs. length characteristic for both types of tubing.
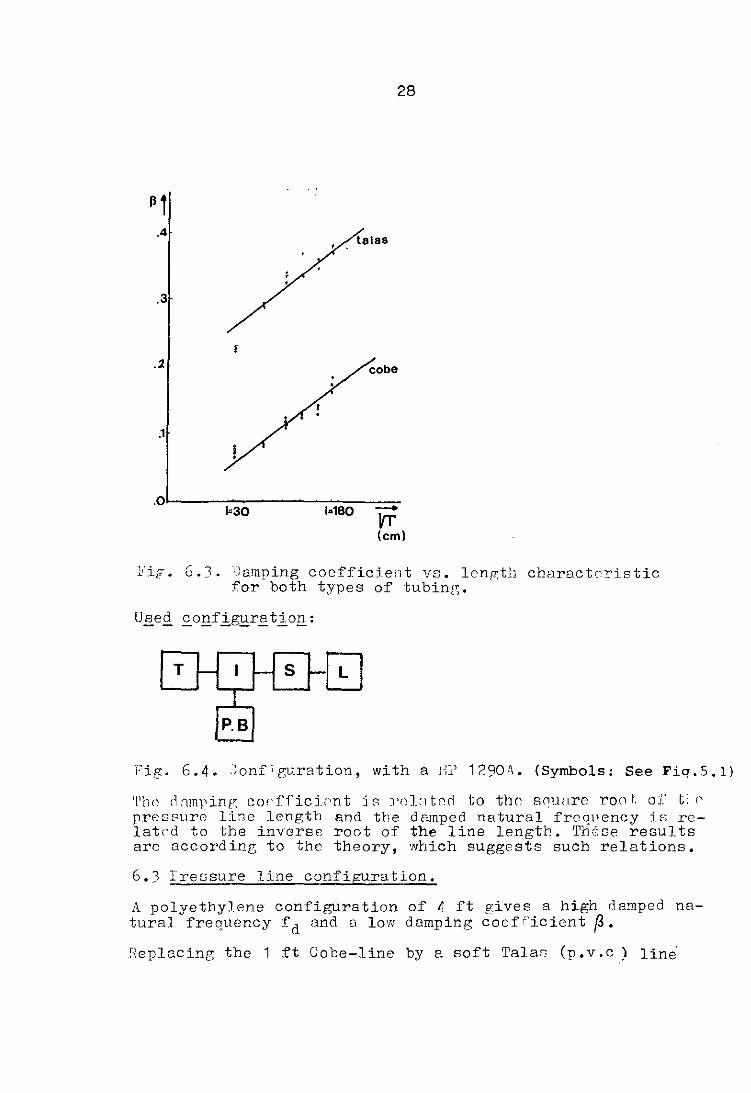
The damping coefficient is relatpd to the square root of the pressure line length. Sec fip;. 6.3.
28
Pi .4
1 • talas
.3
I .2 cobe
.1
}'ip. 6.3. lJamping coefficj_ellt vs. length charact0ristic for both types of tubing.
T s
Fie:. 6.4. ~onfie:uration, with a J]1' 1?90A. (Symbols: See Fiq.5.1)
'l'l1<) ,1 :1m]:'ing coefficient :i R J'nJ.:ltE~~ to tho sr!lwre ron r. of t: (' pressure l:Lne length and the damped natural frequency is relati'd to the inverse root of the line length. Thc'se results are accordinG to the theory, which suggests such relations.
6.3 Iressure line configuration.
A polyethylene configuration of 4 ft gives a high damped natural frequency fd and a loVi damping coeffiCient p. Replacing the 1 ft Cobe-line by a soft TalaR (p.v.c) lin~

29
of the same length gives an increase in ~ and a decrease in fd • Adding another 'i'alas-line gives a further decrease of fd and anincrease of (3 • Changing these two 'ralas-lines ( 1='0 cm, Ld.=1.0 mm ) by two Connecta-lines ( 1=10 em, Ld.= ?1 mm) gives almost the same damperi frenuency, between certain bounds, and cJ decrease in the damping coefficient (3 • Frolll. tt'e theory foll owe the relation fd -r and f ~ v+- 'lith this knowledge, it is possible to explain the ldltt~e· chE'm:;e in fd . l see table VIII. ). The clamping coefficient (l is related to tre lenr:th I ar' ~-vr and with the internal diameter r ar'· ~-1/r3. ( see en. 3.9 ) Both relations give a decrease in the damping coefficient. ( see table VlII. )
s
I------j
L -~EJ-Q: T L L _____ .J
P.B
Fiv,. 6.5. Configuration with 1'= P50.(Symbols: See Fig. 5.1}
Configuration fd . ~ L)L6 40 Hz o. ?10
[..,161'3 24 Hz 0.255
L1 16 r'1 25 Hz 0.145
L( 1Jc: 61 Hz 0.095 ) ='
Table VdI. i"ressure Ilne confir;uration.
6.4 Canulas.
'1'he intf'rnal diameter r of the canula is linearly related to the clamped natural frequency f d . 'l'llis relation can only be bold for the Boehringercanulas. ( see fig. 6.7 ). ' 'l'he Vip;go canulas, espeCially the 19G-camlla, easily contain airbubbles and have a built in deformation. Too few different Cathlon, Jelco and Cathlon canulas are available to draw any conclusions about these types.

30
c T
Fig. 6.6. Configuration with T= lIP 1290A. (Symbols; See Fig.S.l)
f) (Hz)
200 ''u
150 'i1
'11, '12 c! ,
c 9 1c7 100 j
"'5 • • c6 t
50 c2
0.5 to 1.5 ~ i.d. (mm)
}'ig.6.7. Frequency vs. internal diameter for different types of canulas.
6.5 J:'ressure lin" configuration with a canula.
'i'ho canulas used for these experiments have a natural dam1)ed fre(1uency bet"ieen 60 Hz and 200 Hz ( depending on internal diameter and material used. ). The natural damped frequency fot of the whole system decreases with decrease in the internal Uiameter of tte canula.
31
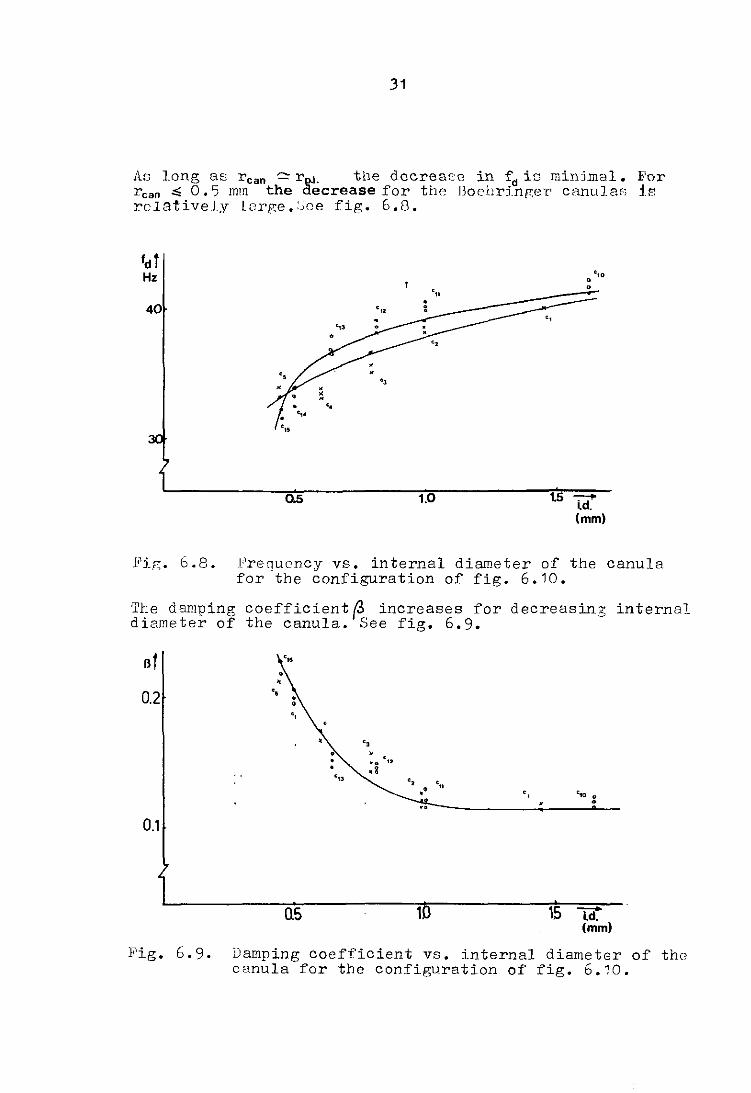
11.0 long as rcan <:::: r(?-1. tl1e decreaEe in fd is minjmal. For rcan '" O. '5 mm the decrease for the Jloehrj,nger canulas ir. relativeJy lorge.:,ce fig. 6.B.
40
o.s 1.0
'" • •
1.5 .,....... (d. (mm)
l"requency vs. internal diameter of the canula for 'the configuration of fig. 6.10.
'rhe damping coefficient ~ increases for decreasinZ internal diameter of the canula. See fig. 6.9.
sf
0.2
0.1
"
. • '"
• • "
o.s
" • • • C12 · :i '"
"
1 15 -i.d. (mm)
l<'ig. 6.9. Damping coefficient vs. lnternal diameter of the canula for the confi~lration of fig. 6.10.

32
T 5 5
P.B
6.10. Configuration used, for tbe experiments with Boehringer and Viggo canulas. See 2.lso fig. 6.8. and 6.9. (SyJrOOls: See Fig.5.l.)
Por the configuration of fig. 6.13., a 3 ft Cobe line and a 30 em 'l'alas line, the internal diameter reaD is of less influence to the damped frequency ~. See rig. 6.11.
20
Pig. 6.11.
-- ----~----~------------!=~-------~: .
: ----:-----. c .--;--- • c 3 ,
05 10 15 .,..I.d. (mm)
Fre~uency vs. internal diameter of the canula, for ·sev8ral Viggo canulas.
In systems with a damped natural frquency of 30 11Z or less the internal diameter rean is of less influence.
For this configuration, the damping coefficient p. also decreases for decreasing internal diameter of the canula. lif rean < 1.0 mm ) See fig. 6.12.
33
6f
0.3 's
0.2 'i "2
CO"" , ... Uh ..... ~-- • •
0.1
0.0 10 1.5 --0.5 i.d.
(mm)
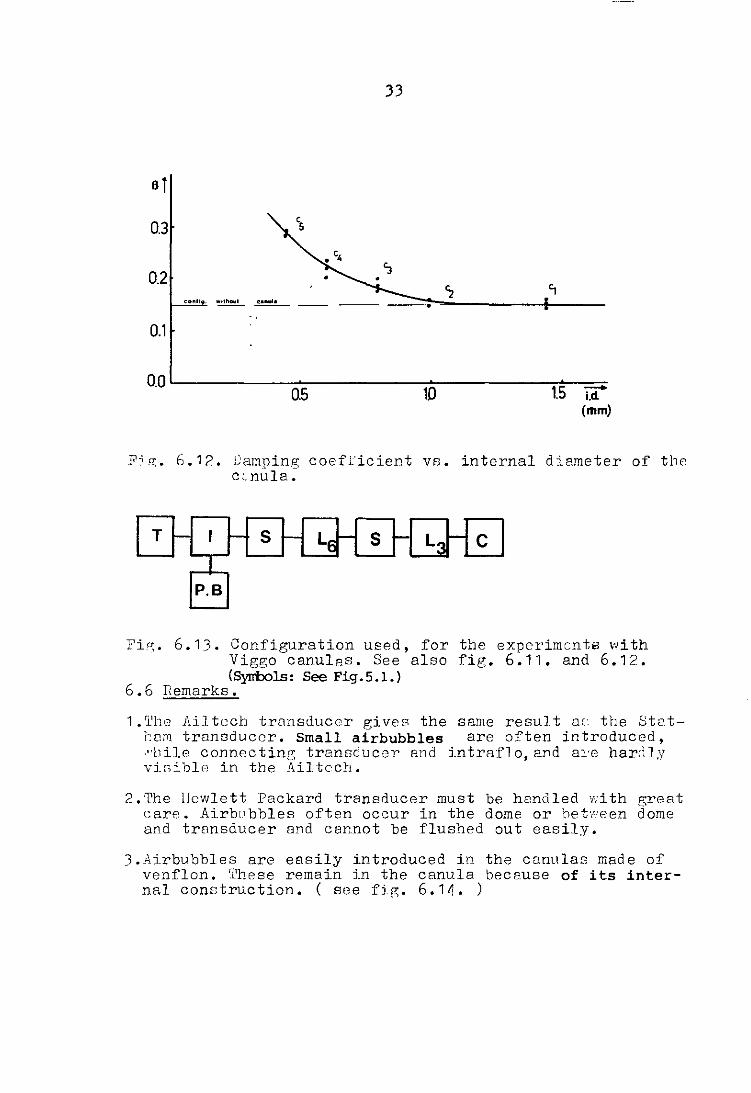
F;r:. 6.12. j)amping coefficient vs. internal diameter of tbo c:.nula.
s L s
P.B
Fic;. 6.13. Configuration used, for the experiments with Viggo canulas. See also fig. 6.11. and 6.12. (Symbols: See Fig.5.l.)
6.6 Hemarks.
1. 'l'lle JUI tech trrmsuuccr gives the same result nc: the Stat~c:q trcnoduccr. Small airbubbles are often introduced, ,·'llile connectin(,; tranooucer and intrafl 0, and Bl'e har:ny visiblA in tbe Ailtcch.
2. The Hewlett Packard transducer must be hEmdled v;i th great care. Ai.rbubbles often occur in the dome or bet'''''een dome and tr8nsducer and cannot be flushed out easily.
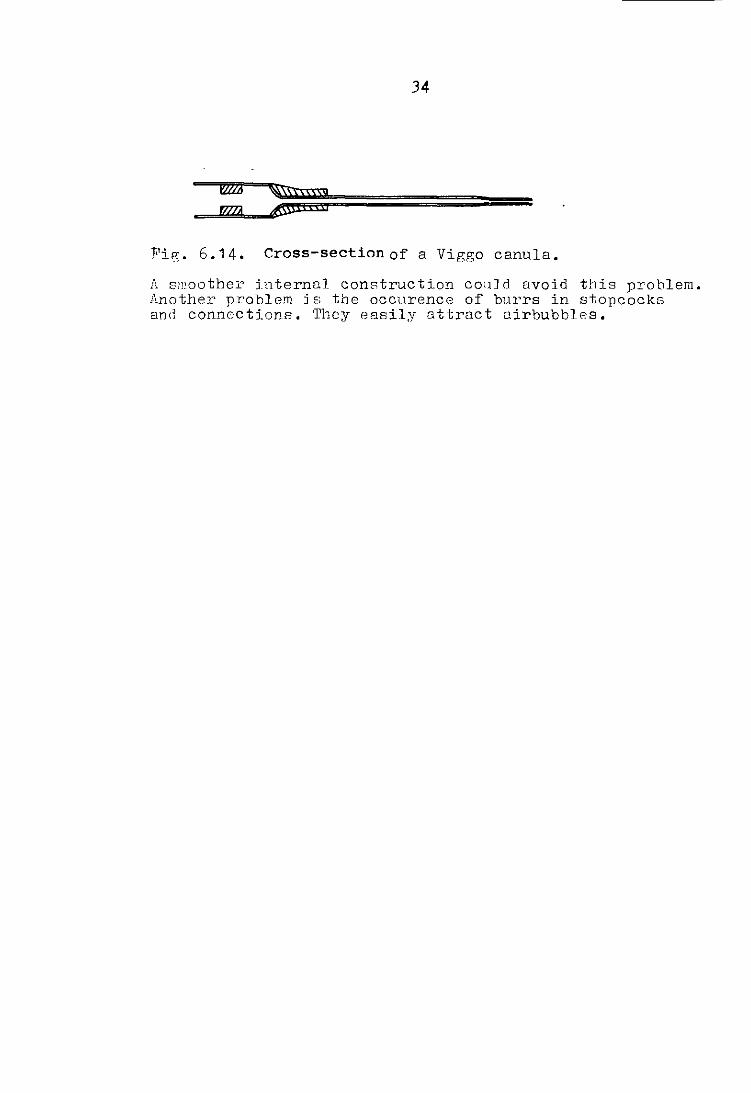
3.Airbubbles arc easily introduced in the canulas made of venflon. 'l'bese remain in the canula bece.use of its internal conotruction. ( see fir;. 6.14. )
34
Pi". 6.14. Cross-section of a Viggo canula.
A sll'oother jnternnl construc tion call] d avoid this problem. Another problem js the occurence of burrs in stopcocks and connections. They easily attract airbubbles.
35
7. Compensatin~ techni~ues.
A flot freauency rangR till at least 30 Hz is required in order to get an accurate reproduction of the arterial wave, assuming that the phase-lag is proportional to the fro~uBncy.
~~thetRr manometer systems can usually be described as an l'nderdsmped second order dynamic s~'stem. For j'1stance, onp of the experiments dono ( UP 1?90A, 4 ft Cobe and a 18.5G !'o"hrinp;or ) shows a natural frequency fn = ~O Hz a:ld a c1D'11pinn: coefFicient of fb= 0.14 . '.chis would result, according to figure 3.3.,Jn a flat frequency ranp,e up to 10 ;'20. An. ideal system would have s damping coefficient 0i = 0.64, bich meens a flat frequency range up to 0.67· fn •
In the earlier mentioned experimant, this would be 27 lIz.
Vierhout sU8e:estec] to introduce damping in the hydraulic system. '['his could be done by t'lIO different methods (lit. 13): 1. Serial damping. 2. Parallel damping. A third method would be to introduce a low-pass fjlter in the electrical part of the measuring system.
7.1 Serial d ampinr;.
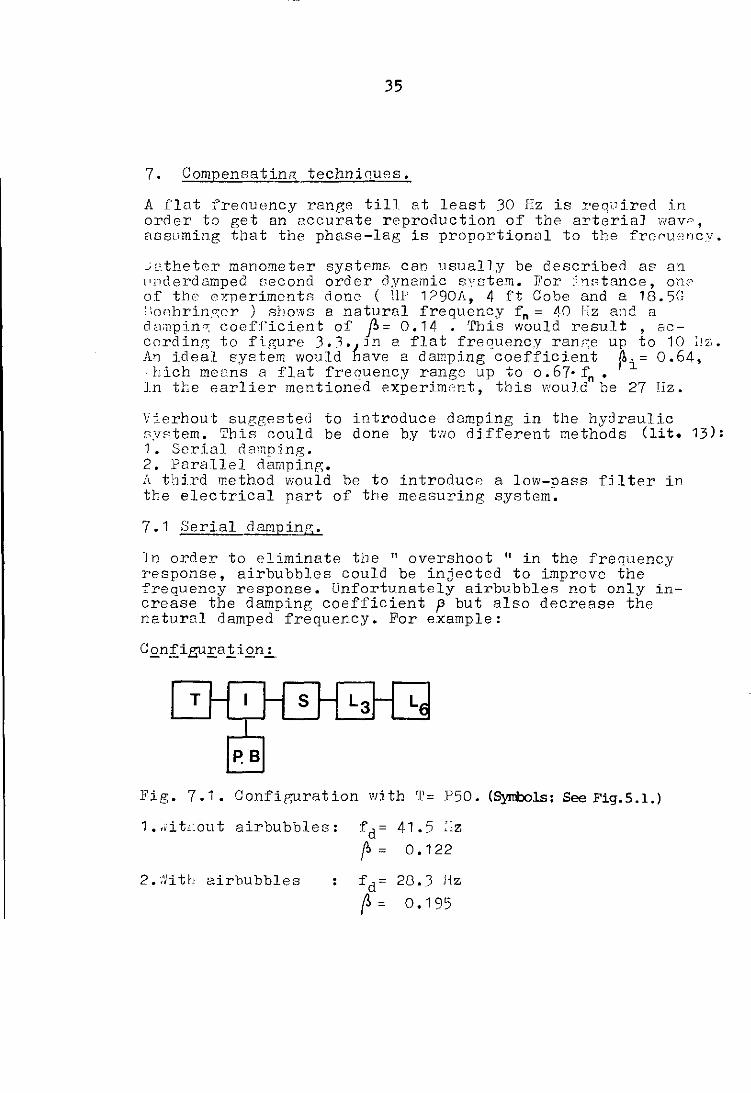
ln order to eliminate the II overshoot II in the freauency response, airbubbles could be injected to improve the freauency response. Unfortunately airbubbles not only increase the damping coefficient f3 but also decrease the natural damped frequency. For example:
T s L
Pig. 7.1. Configuration with 'l'= P50. (SyIrOO1s: See Fig.S.l.)
1.ditLout airbubbles: fd= 41.5 ~lz
~ = 0.122
2.~itb airhubbles fd= 28 • .3 Hz
~= 0.195
36
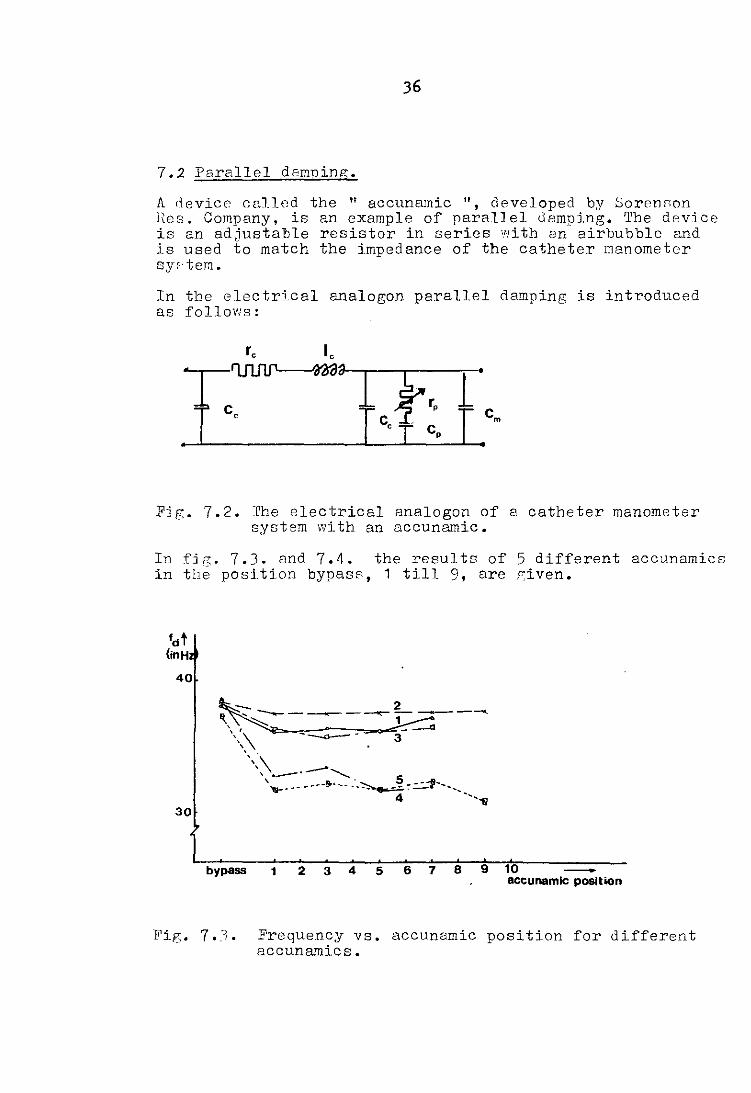
7.2 Parallel damping.
A device called the " accunamic ", developed by Soronc;on Hero. Company, is an example of parallel damping. 'l'be dpvjce is an ad,justalble resistor in series -"'litb an airbubble and is used to matcb the impedance of the catheter manometer syf'tem.
In the electrical analogon parallel damping is introduced as folloVJs:
Fif,. 7.2. The electrical analogon of a catheter manometer system w1th an accunamic.
In fiR. 7.3. and 7.4. the results of 5 different accunamics in th~ position bypass, 1 till 9, are piven.
__ 2
'\ ,.. -----~-1----~ , "'" --" '<\ -~- 3-
"'\ .. _" --- ............. \ '&- ____ ---&- -- - _ ~.. _!! -=1'-- __ _
4 ---~ 30
bypass 1 2 3 4 5 6 7 8 9 10 -aceunamlc positiOn
Fig. 7 •. '. Frequency vs. accunamic position for different accunamics.
37
.5
.4
.3
.2
.1
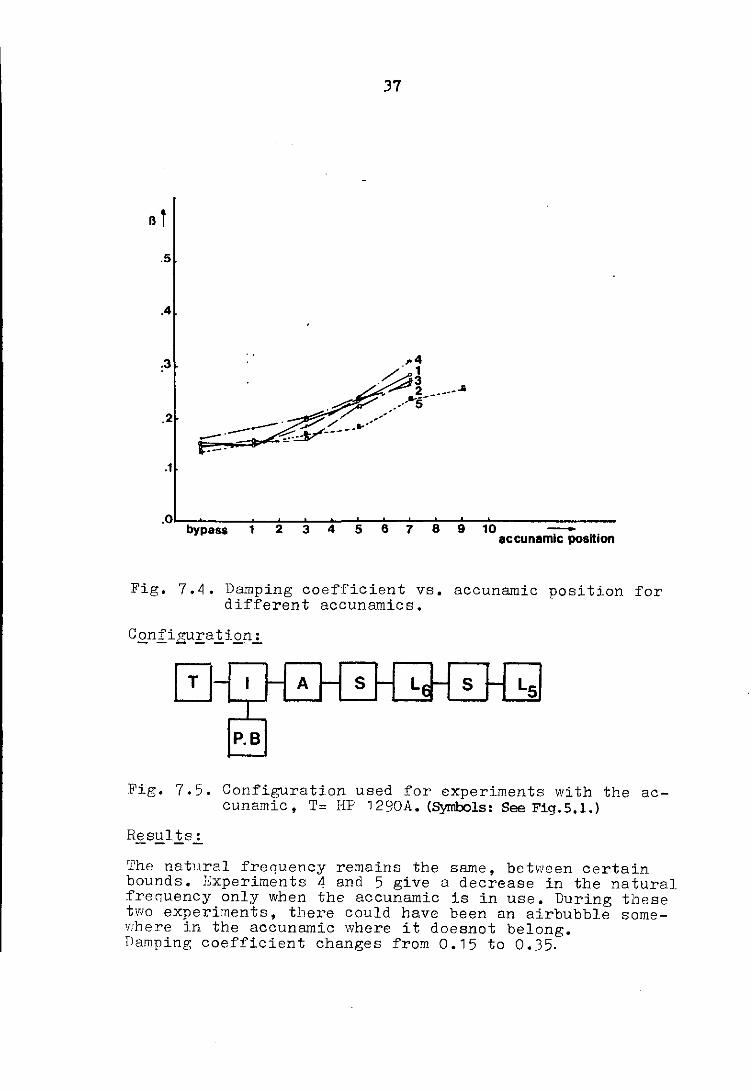
.OI~b~P----~1~~2~~3~~4--*5--~6~7~~8~~9~~10~----~~----y ass accunllmlc position
Fig. 7.~. Damping coefficient vs. accunamic position for different accunamics.
- I I- A l- S I- Le l- S I- LS -1
P.B
Fig. 7.5. Configuration used for experiments with the accunamic, T= lIP 1290A. (Symbols: See Fig.5.l.)
The natural frequency remains the same, between certain bounds. Experiments 4 and 5 give a decrease in the natural frequency only when the accunamic is in use. During these two experiments, tllere could have been an airbubble somev:here ln the accunamic where it doesnot belong. Damping coefficient changes from 0.15 to 0.35.
Hemark: - --
38
the dc>mping coefficient of tbe complete system could not be calculated with tbe accunamic set at position C!. ( resistance increases with accunamic position number. ) T'NO methods described in the literature (Gabe and Peura) are not suitable in this case. (Lit. 3 and 10).
7.3. Electrical filtering.
A method to improve the Rmplitude versus frequency characteristic (a. v. f.) of a hydraulic system is to compensate the transfer function with either a passive first order low-pass filter or an active two pole Butterworth low-pass filter, depending on tbe damping ratio ~ .
Calculations indicate ( see appendix C. ) that proper selection of the type of filter and optimum selection of its 3 dB frequency will flatten the a.v.f. of the total system ( hydraulic system and electrical filter) up to at least 75 % of tbe undamped resonance frequency. The calculations have been performed for damping coefficients from 0.05 until 0.50 and they show that the Butterworth filter is best used for ~ between 0.05 and 0.23. For ~ between 0.24 and 0.50 the low-pass filter can better be used.
It can be calculated that the use of an electrical filter markedly improves the bandwith over which the a.v.f. will be tolerc>bly ( within 6 % ) flat and that the filter redu-ces tbe overshoot at the damped resonance freouency for
systems with damping ratios higher than 0.10 to an acceptable limit of less than 50 %. Overshoot will not occur for damping ratios higher than 0.26.
Curve a in fig. 7.6. shows the a.v.f. of a single degree of freedom system with a damping ratio of 0.25. Curves b and c show the a.v.f. when the characteristic is compensated with a first order 10w-pasR filter or a two pole Butterworth filter respectively.
The use of an electrical filter increases the phase-lag of the total system. However, when this phase-lag is proportional to the frequency, then the waveform will be reproduced by tbe system with certain delay in time.
Calculations prove that phase-lap; is proportional to frequency up to Rt least 0.75 f for systems with dampinG ratios from 0.05 till 0.30. n
IHlt
2.0
0.2 0.4
39
06 0.8
•
b
1.0 1.2 -+ 'I, n
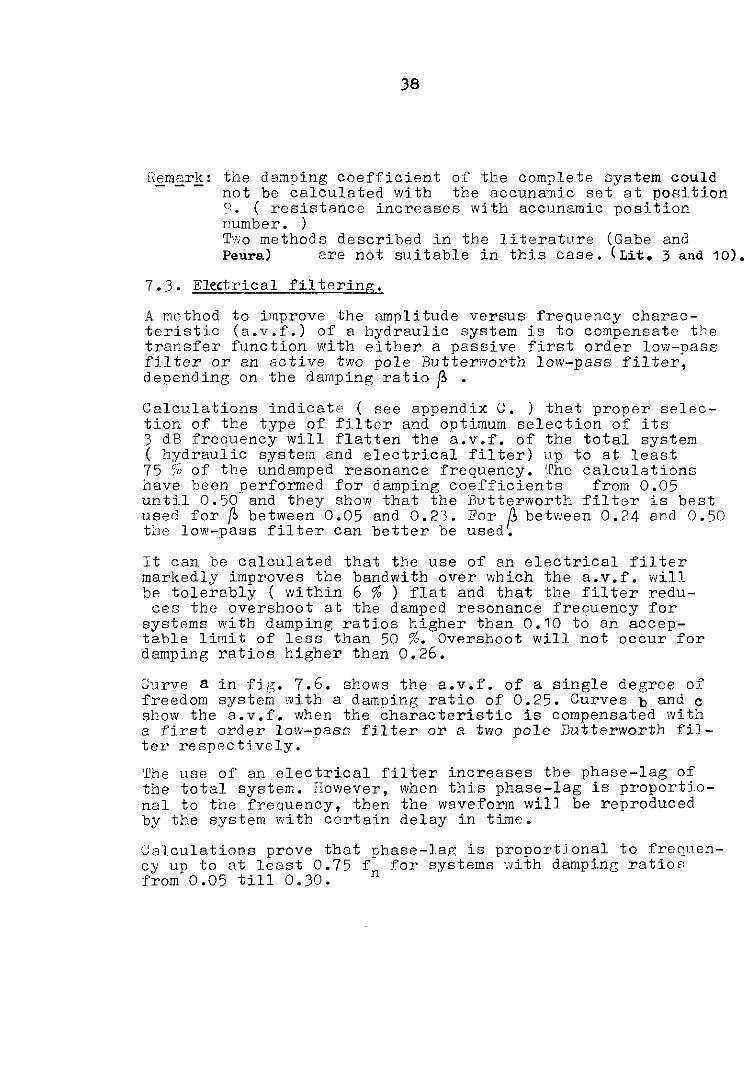
Fie. 7.6. Amplitude vs. relative frequency for a catheter manometer system with and without compensation.
o
-40
-80
o -120
-160
-200
-280
0.2 0.4 0.6 0.8 1.0 1.2 _ ~
........ - •
Fig 7.7. Phase-lag vs. relative frequency for a catheter manometer system with and without compensation.
(a) = no compensation (b.l = 1st order l=-pass canoensation . (c) = 2nd order Butterworth compensation
40
For higher values of f the phase-lag"is proportional to the frequency up to at least 0.5 f n • Fig. 1.1. shows the phaselag of the system used in fig. 1.6. Curve a is the phase-lag of the hydaulic system. Curve band c show the phase-lag of the total system after compensation by either a low-pass filter or a two pole Butterworth filter.
Distortion results, when the phase characteristic departs from a straight line. Filtering clearly reduces this type of (phase) distortion.
41
8. Conclusj 011S and recommendations.
Conclusions.
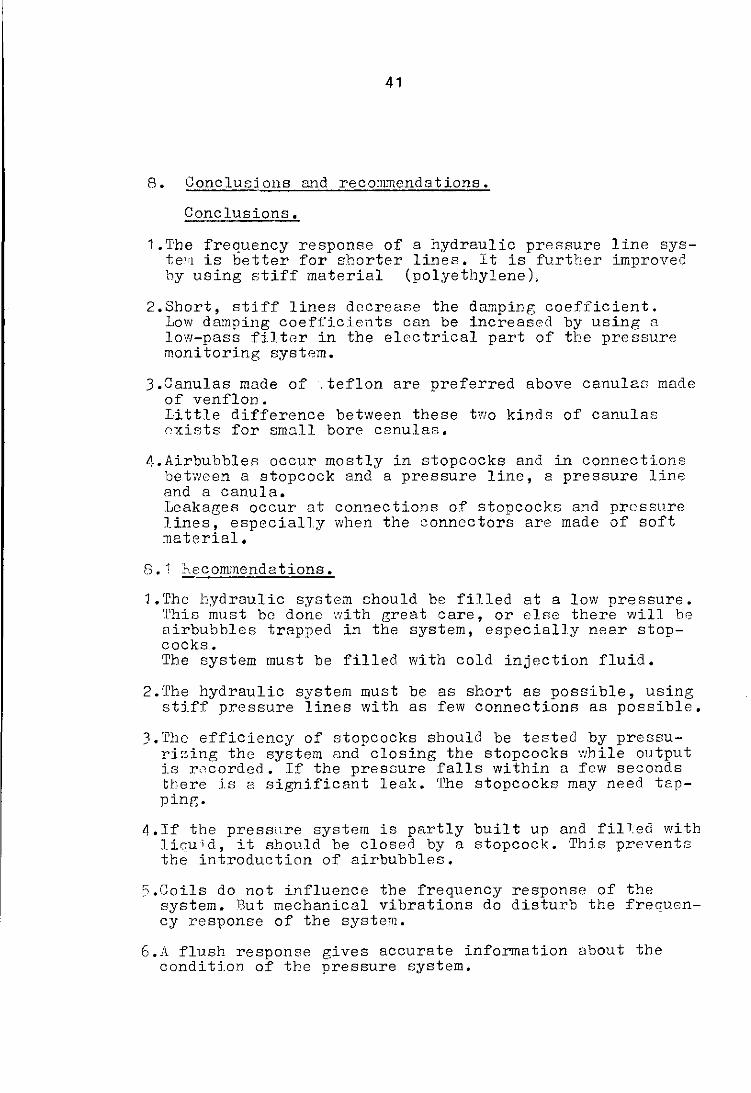
1.The frequency response of a hydraulic pressure line syste"l is better for shorter lines. It is further improved hy using stiff material (polyethylene),
2.Short, stiff lines decrease the damping coefficient. Low damping coefficients can be increased by using a low-pass filter in the electrical part of tbe pressure monitoring system.
3.Canulas made of .teflon are preferred above canulas made of venflon. Little difference between these two kinds of canulas exists for small bore csnulas.
4.Airbubbles occur mostly in stopcocks and in connections between a stopcock and a pressure line, a pressure line and a canula. Leakage8 occur at connections of stopcocks and pressure lines, especially when the connectors are made of soft material.
8.1 hecommendations.
1.The bydraulic system should be filled at a low pressure. This must be done with great care, or else there will b8 airbubbles trapped in the system, especially near stopcocks. The system must be filled with cold injection fluid.
2.The hydraulic system must be as short as possible, using stiff pressure lines with as few connections as possible.
3.Tho efficiency of stopcocks should be tested by pressuri:oing the system and closing the stopcocks I"lhile output is rncorded. If the pressure falls within a few seconds tbere is a significant leak. 'l'he stopcocks may need tapping.
4. If the pressure system is partly buil t up and filled wi tb liquid, it sbould be closed by a stopcock. This prevents the introduction of airbubbles.
5.Coils do not influence the frequency response of the system. But mechanical vibrations do disturb the frequency response of the system.
6.A flush response gives accurate information about tbe conditj.on of the pressure system.
42
References
(1) Bruner, J.M.R. HANDBOOK OF BLOOD PRESSURE MONITORING. Littleton, Mass.: P.S.G. Publishing Co., 1978.
(2) Dockiilek, A. AMPLITUDE CHARACTERISTICS CORRECTION IN A HYDRAULIC SENSOR SYSTEM USING A CATHETER. In Czech. Slaboproudy obzor, Vol. 41(1980), p. 163-168.
(3) Gabe. LT. PRESSURE MEASUREMENT IN EXPERIMENTAL PHYSIOLOGY. In: CARDIOVASCULAR FLUID DYNAMICS. Vol. 1. Ed. by D.H. Bergel. London: Academic Press, 1972. P. 11-50.
(4) Geddes, L.A. THE DIRECT AND INDIRECT MEASUREMENT OF BLOOD PRESSURE. Chicago: Year Book, 1970.
(5) Gersh, B.J., C.E.W. Hahn and C.P. Roberts PHYSICAL CRITERIA FO~ASUREMENT OF THE LEFT VENTRICULAR PRESSURE AND ITS FIRST DERIVATIVE. Cardiovasc. Res., Vol. 5(1971), p. 32-40.
(6) Hansen, A.T. PRESSURE MEASUREMENT IN THE HUMAN ORGANISM. Acta Physiol. Scand., Vol. 19(1949, supplement 68), p. 1-227.
(7) Kuo, F.F. NETWORK ANALYSIS AND SYNTHESIS. 2nd ed. New York: Wiley, 1966.
(8) Olson, W.H. BASIC CONCEPTS OF INSTRUMENTATION. In: MEDICAL INSTRUMENTATION. Ed. by J.G. Webster. Boston: Houghton Mifflin, 1978. P. 1-48.
(9) O'Rourke, P.L. THE ARTERIAL PULSE IN HEALTH AND DISEASE. Am. Heart J., Vol. 82(1971), p. 687-702.
(10) Peura, R.A. BLOOD PRESSURE AND SOUND. In: MEDICAL INSTRUMENTATION. Ed. by J.G. Webster. Boston: Houghton Mifflin, 1978. P. 336-384.
(11) Shapiro, G.G. and L.J. Kravetz DAMPED AND UNDAMPED FREQUENCY RESPONSES OF UNDERDAMPED CATHETER MANOMETER SYSTEMS. Am. Heart J., Vol. 80(1970), p. 226-236.
(12) Shinozaki, T., R.S. Deane and J.E. Mazuran THE DYNAMIC RESPONSES'ii'F"UQUlD-FILLED CATHETER SYSTEMS FOR DIRECT MEASUREMENT OF BLOOD PRESSURE. Anesthesiology, Vol. 53(1980), p. 498-504.
43
(13) Vierhout, R.R. THE RESPONSE OF CATHETER MANOMETER SYSTEMS USED FOR DIRECT BLOOD PRESSURE MEASUREMENTS. Ph.D. Thesis, Catholic University, Nijmegen, 1966.
(14) Warburg, E. A METHOD OF DETERMINING THE UNDAMPED NATURAL FREQUENCY AND THE DAMPING IN UNDERDAMPED AND SLIGHTLY UNDERDAMPED SYSTEMS OF ONE DEGREE OF FREEDOM BY MEANS OF A SQUARE WAVE IMPACT. Acta Physiol. Scand., Vol. 19(1949), p. 344-349.
(15) Wesseling, K.H. and E. van Vollenhoven CATHETER MANOMETER SYSTEMS: A review of some measurement results. TNO-nieuws, Vol. 24(1969), p. 603-616.
(16) Wood, E.H. PHYSICAL RESPONSE REQUlREMENTS.OF PRESSURE TRANSDUCERS FOR THE REPRODUCTION OF PHYSIOLOGICAL PHENOMENA. Commun. & Electron. (Part I of the Trans. AlEE), Vol. 75(1956), p. 32-40.
(17) Fry, D.L., F.W. Noble and A.J. Mallos AN EVALUATION OF MODERN PRESSURE RECORDING SYSTEMS. Circ. Res., Vol. 5(1957), p. 40-46.
(18) McDonald, D.A. BLOOD FLOW IN ARTERIES. London: Edward Arnold, 1960.
(19) Vierhout, R.R. and A.J.H. Vendrik ON PRESSURE GENERATORS FOR TESTING THE DYNAMIC CHARACTERISTICS OF CATHETERS AND MANOMETERS. J. Lab. Clin. Med., Vol. 58(1961), p. 330-333.
44
Appendix A.
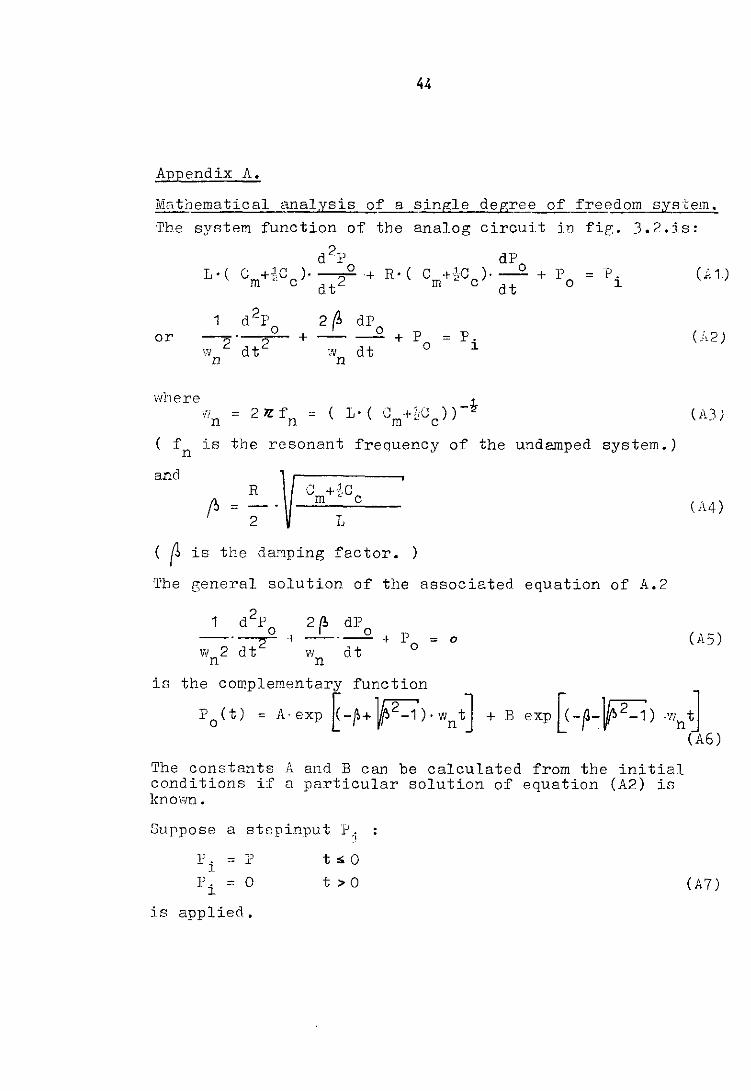
liI;;tnematical analysis of a single degree of freedom system. The system function of the analog circuH in fie:. 3.2.is:
d 2P dP L· ( C +~,C ). __ 0 + R· ( C +',C ). __ 0 + p = P. m ., c 2 m . C dt 0 1 dt
1 d 2r 2~ dpo 0 l' or -2'
dt 2 + -- + = Pi VI 'N dt 0
n n
w)'Jere Vi = 2 1l f
n n
( fn j.s the resonant frequency of the undamped system.)
and R
fo = 2
C +,,1,C m • c
( ~ is the da~ping factor. )
The general solution of the associated equation of A.2
1 d 21' 2 (I, dl' o ,- 0 --.~ + --'--wn 2 dt \'In dt
+ l' o = 0
is the complementary function
po(t) = A·exp ~_~+V~2-1°)'WntJ
The constants A and B can be calculated from the initial conditions if a particular solution of equation (A2) is known.
Suppose a stopinput P5 p. = P t .. o
1 P. = 1 ° t > °
is applied.
(.1;1.)
(A)!
(1\4)
(AS)
(A7)

The initial conditions are
P = 0 o
dl' o· -= 0 dt
t~ 0
tc;;o
45
(A8)
'.rhe solutton of equation (A2) can have three forms. dependinr: on the dampine; ratio. 'rhese forms are:
Qv.§.rQ.a!!!Jl.§.d_ ~>.1. 1.
~+~ [ F' poet) = ._. P'exp (-~+ ~ -1) 2Vfo 2- 1 ' -
-~ -~ ~ lJ;;T:;' -+- 2W'-1' .p.exPL(-p-V~-1)
2riticQl!y_dQm~e£ R=_1_:_ P (t) = (1+ w t)'P'exp(-w t) o n n
'" tl "n J (AS)
(A 10)
(A 11)
Appendix B.
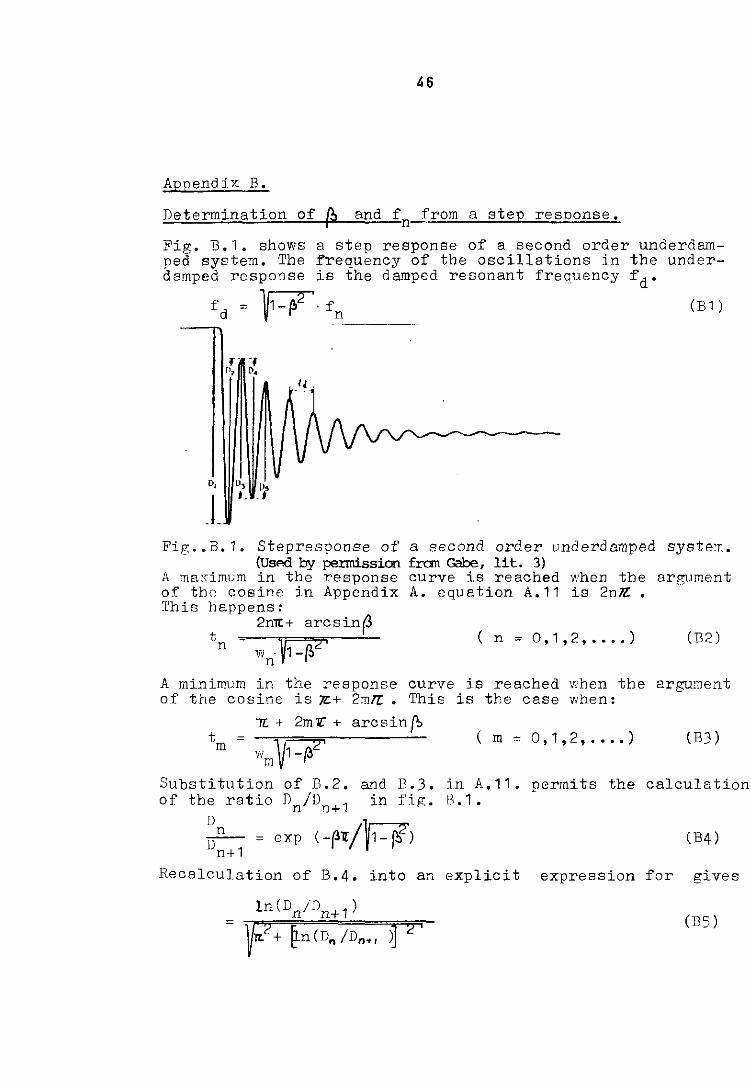
Determination of ~ and fn from a step response.
Fig. B.1. shows a step response of a second order underdamped system. The frequency of the oscillations in the underdamped respor]se i_s the damped resonant frequency f d •
fd = f7. fn (B1) ---n
D,
J Fig •• B. 1. Step response of a second order underd amped systelt.
(UsP.<'! by permission fran Gabe, lit. 3) A maximum in the response curve is reached when the argument of the cosine in Appendix A. equation A.11 is 2nE • I'his happens:
t n
2TIlt:+ arcsin~
wn·V1-~2' (n = 0,1,2, ..•. ) (I32)
A minimum in the response curve is reached when the argument of the cosine is]l:+ 2mTl • This is the case when:
1[. + 2m1C + arcsin f.>
Wm V1-(62'
Substitution of B.2. and B.3. of the ratio Dn/Dn+1 in fig.
Ll /1r:-;;2' If-- = exp (-~1/: 11- r-> ) n+1
(m = 0,1,2, •••• ) (B3)
i.n A.11. permits the calculation [) • 1 •
(B4)
Hecalculation of B.4. into an explicit expression for gives
(BS)
47
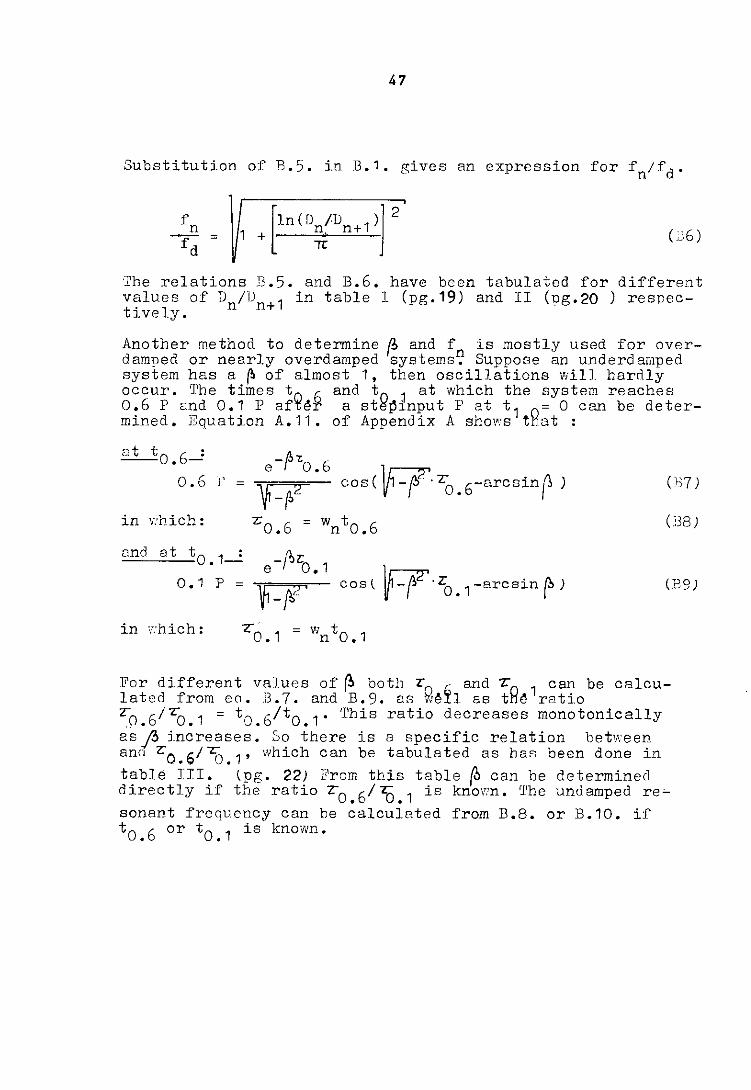
Substitution of B.5. in B.1. gives an expression for fn/fd.
(;36 )
-The relations B.5. and B.6. have been tabulated for different v~lues of Dn/Dn+1 in table I (pg.19) and II (pg.20 ) rescectlvely.
Another method to determine ~ and fn is mostly used for overdamped or nearly overdamped systems. Suppose an underd aLlped system has a ~ of almost 1, then oscillations will. hardly occur. 'l'he times to h and to j at which the system reaches 0.6 P and 0.1 P aft~~ a st~~input P at t1 0= 0 can be determined. Equation A.11. of Appendix A shows tllat
at t o. 6-'
0.6 l'
in v!hich:
and at to .1~
0.1 P =
in -,:hich:
(B7)
(:38 )
(89 )
l"or different values of ~ bot!] LO b and 7:"0 1 can be calculated from eQ. B.7. and B.9. as W~Il as tn~ ratio '0.6/ '0.1 = to. 6/t O. 1· 'I'his ratio decreases monotonically e.s ft increases. ~)o there is a specific relation bet1,yeen ano Z:O.G/lJ.1' which can be tabulated as haA been done in
table lIL (pg. 22) From this table (b can be determine(l directly if the ratio '0.6/-zei.1 is knovm. 'l'he undamped re~
sonant frequency can be calculated from B.B. or B.10. if t o • 6 or t o • 1 is known.
48
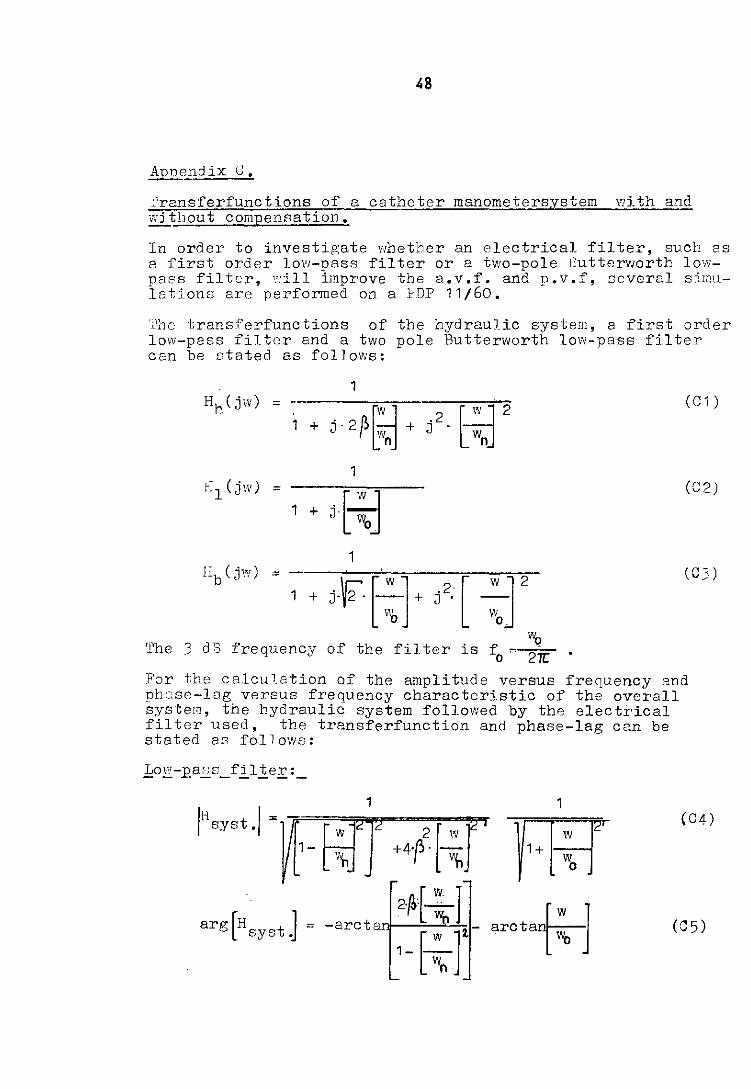
Apnendix C.
~'ransferfunctions of a catheter manometersystem with and ~ithout compensation.
In order to investigate whether an electrical filter, such es a first order lovi-pass filter or a two-pole IJutterworth lowpaC's filter, '.':ill improve the a.v.f. and p.v.f, several sirnuletiol1l1 are performed on a ."DF 11/60.
1';le transferfunctions of the hydraulic system, a first order low-pass filter and a two pole Butterworth low-pass filter can be stated as follows:
1 Hh (jw) -
j'2~~ ~2 1 + + j2 . (C 1 )
1 Hl(jw) =
j~ 1 +
(C2 )
1 lIb ( jw) =
j·r· f-] + /. [ -12 1 + '0 w o.
(CJ)
w. The 3 dE frequency of the filter is fo= 2~
For the calculation of the amplitude versus frequency and ph~se-lag versus frequency characteristic of the overall system, the hydraulic system followed by the electrical filter used, the transferfunction and phase-lag C2.n be stated as follows:
Iii I: syst. 1 1
~ 1-'''n
(C4)
arg[H tJ sys . (C 5)
<19
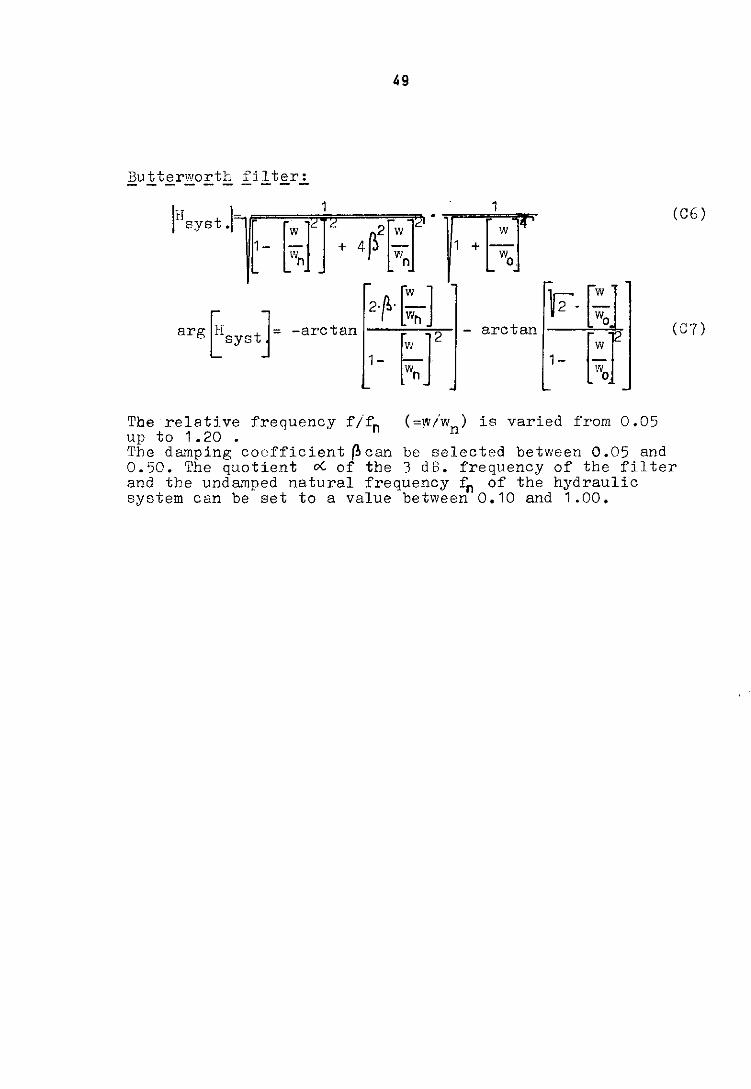
Butterworth filter: --------
(06 )
(C7 )
(=W/Wn ) is varied from 0.05 The relative frequency f Ifn up to 1.20 . Tbe damping coefficient (!J can be selected between 0.05 and 0.50. The quotient oG of the 3 dB. frequency of tbe filter and the unda~ped natural frequency fn of the hydraulic system can be set to a value between 0.10 and 1.00.
EINDHOVEN UNIVERSITY OF TECHNOLOGY THE NETHERLANDS DEPARTMENT OF ELECTRICAL ENGINEERING
Reports:
105) Videc, M.F. STRALINGSVERSCHIJNSELEN IN PLASMA'S EN BEWEGENDE MEDIA: Een geometrischoptische en een golfzonebenadering. TH-Report 80-E-105. 1980. ISBN 90-6144-105-6
106) Hajdasifiski, A.K. LINEAR MULTIVARIABLE SYSTEMS: Preliminary problems in mathematical description, modelling and identification. TH-Report 80-E-106. 1980. ISBN 90-6144-106-4
107) Heuvel, W.M.C. van den CURRENT CHOPPING IN SF6' TH-Report 80-E-l07. 1980. ISBN 90-6144-107-2
108) ~, W.C. van and T.M. Lammers TRANSMISSION OF FM-MODULATED AUDIOSIGNALS IN THE 87.5 - 108 MHz BROADCAST BAND OVER A FIBER OPTIC SYSTEM. TH-Report 80-E-l08. 1980. ISBN 90-6144-108-0
109) Krause, J.C. SHORT-CURRENT LIMITERS: Literature survey 1973-1979. TH-Report 80-E-l09. 1980. ISBN 90-6144-109-9
110) Matacz, J.S. UNTERSUCHUNGEN AN GYRATORFILTERSCHALTUNGEN. TH-Report 80-E-110. 1980. ISBN 90-6144-110-2
111) Otten, H.H.J.M. STRUCTURED LAYOUT DESIGN. TH-Report 80-E-111. 1980. lSBN 90-6144-111-0 (in preparation)
112) Worm, S.C.J. OPTIMIZATION OF SOME APERTURE ANTENNA PERFORMANCE INDICES WITH AND WITHOUT PATTERN CONSTRAINTS. TH-Report 80-E-112. 1980. ISBN 90-6144-112-9
i13} Theeuwen, J.F.M. en J.A.G. Jess EEN INTERACTIEF FUNCTIONEEL~RPSYSTEEM VOOR ELEKTRONISCHE SCHAKELINGEN. TH-Report 80-E-113. 1980. ISBN 90-6144-113-7
114) Lammers, T.M. en J.L. Manders EEN DIGITAAL AUDIO-DISTRlBUTIESYSTEEM VOOR 31 STEREOKANALEN VIA GLASVEZEL. TH-Report 80-E-114. 1980. ISBN 90-6144-114-5
115) Vinck, A.J., A.C.M. Oerlemans and T.G.J.A. Martens rwo-APPLICATIONS OF A CLASS OF CONVOLUTIONAL CODES WITH REDUCED DECODER COMPLEXITY. TH-Report 80-E-115. 1980. ISBN 90-6144-115-3
EINDHOVEN UNIVERSITY OF TECHNOLOGY THE NETHERLANDS DEPARTMENT OF ELECTRICAL ENGINEERING
Reports: EUT Reports are a continuation of TH-Reports.
116) Versnel, W.
THE CIRCULAR HALL PLATE: Approximation of the geometrical correction factor for small contacts. TH-Report 81-E-116. 1981. ISBN 90-6144-116-1
117) Fabian, K. DESIGN AND IMPLEMENTATION OF A CENTRAL INSTRUCTION PROCESSOR WITH A MULTIMASTER BUS INTERFACE. TH-Report 81-E-117. 1981. ISBN 90-6144-117-X
118) Wans Yen Ping ENCODING MOVING PICTURE BY USING ADAPTIVE STRAIGHT LINE APPROXIMATION. EUT ·Report 81-E-118. 1981. ISBN 90-6144-118-8
119) Heijnen, C.J.H., H.A. Jansen, J.F.G.J. Olijslagers and W. Versnel FABRICATION OF PLANAR SEMICONDUCTOR DIODES, AN EDUCATIONAL LABORATORY EXPERIMENT. EUT Report 81-E-119. 1981. ISBN 90-6144-119-6.
120) Piecha, J. DESCRIPTION AND IMPLEMENTATION OF A SINGLE BOARD COMPUTER FOR INDUSTRIAL CONTROL. EUT Report 81-E-120. 1981. ISBN 90-6144-120-X
121) Plasman, J.L.C. and C.M.M. Timmers DIRECT MEASUREMENT OF BLOOD PRESSURE BY LIQUID-FILLED CATHETER MANOMETER SYSTEMS. EUT Report 81-E-121. 1981. ISBN 90-6144-121-8