DIMS-ECG Revision 2008-11-25 EH
25
___________________________________________ LUP Lund University Publications Institutional Repository of Lund University __________________________________________________ This is an author produced version of a paper published in Journal of electrocardiology. This paper has been peer- reviewed but does not include the final publisher proof- corrections or journal pagination. Citation for the published paper: Loriano Galeotti, David G Strauss, Joey Ubachs, Olle Pahlm, Einar Heiberg Development of an automated method for display of ischemic myocardium from simulated electrocardiograms. Journal of electrocardiology, 2009 Jan 19. [Epub ahead of print] http://dx.doi.org/10.1016/j.jelectrocard.2008.12.007 Access to the published version may require journal subscription. Published with permission from: Elsevier Science B.V., Amsterdam
Transcript of DIMS-ECG Revision 2008-11-25 EH
___________________________________________
LUP Lund University Publications
Institutional Repository of Lund University __________________________________________________
This is an author produced version of a paper published in Journal of electrocardiology. This paper has been peer-reviewed but does not include the final publisher proof-
corrections or journal pagination.
Citation for the published paper:
Loriano Galeotti, David G Strauss, Joey Ubachs, Olle Pahlm, Einar Heiberg
Development of an automated method for display of ischemic myocardium from simulated electrocardiograms.
Journal of electrocardiology,
2009 Jan 19. [Epub ahead of print]
http://dx.doi.org/10.1016/j.jelectrocard.2008.12.007 Access to the published version may
require journal subscription. Published with permission from: Elsevier Science B.V., Amsterdam

Development of an Automated Method for Display of Ischemic Myocardium from
Simulated Electrocardiograms (DIMS-ECG)
Short title: Display of Ischemic Myocardium from Simulated ECGs
Loriano Galeotti1,2 PhD, David G. Strauss1,3,4 BA, Joey F.A. Ubachs1 MD, Olle Pahlm1 MD PhD, Einar Heiberg1 PhD
1Department of Clinical Physiology, Lund University Hospital, Lund, Sweden
2BIM Lab, Department of Systems and Computer Science, University of Florence, Firenze, Italy
3Division of Cardiology, Johns Hopkins University, Baltimore, MD, USA
4School of Medicine, Duke University, Durham, NC, USA
Address Reprint Requests and Correspondence:
Einar Heiberg, PhD
Department of Clinical Physiology
Lund University Hospital, S-221 85
Lund, Sweden
Telephone: +46-46-173137, Fax: +46-46-151769
E-mail: [email protected]
Word count: 4,287
Financial Support: DGS is supported by the Sarnoff Cardiovascular Research Foundation, EH
and JFAU are supported by Swedish Research Council, Swedish Heart and Lung Foundation,
and Region of Scania.

2
Abstract
Background: Knowledge of the size and location of ischemic myocardium during acute coronary
occlusion could provide decision support prior to reperfusion therapy. ECG scores based on the
number of leads and the sum of ST-segment elevation have been unreliable in quantifying
ischemia. We aimed to develop a new method to graphically Display Ischemic Myocardium
from Simulated Electrocardiograms (DIMS-ECG) associated with known ischemic regions.
Methods: Twenty-one patterns of ischemia based on normal coronary anatomy were
programmed into the freely available program ECGSIM (www.ecgsim.org). Minor variations of
these patterns and five levels of ischemia severity produced 45,455 ECGs; 1,000 normal ECGs
were also added. Given a de novo ECG (an ECG from a patient), ST-segment and T-wave
measurements are compared to ECG measurements in the database. The closest 200 matches are
selected and the corresponding ischemic areas are “averaged” to create a graphical display of the
ischemic myocardium.
Results: Three patients are presented who underwent elective coronary angioplasty with
continuous ECG recording and scintigraphically defined ischemic myocardium. Based on ECG
analysis, the program graphically displays the ischemic myocardium with close agreement to the
scintigraphic images. The program’s source code and the ECG database will be made freely
available.
Conclusions: The DIMS-ECG method graphically displays ischemic myocardium from
information contained in the 12-lead ECG based on a novel approach to use a large simulated
database instead of rule or score based method. Following further development and testing, the
DIMS-ECG method could be used to risk-stratify patients with acute myocardial infarction.
3
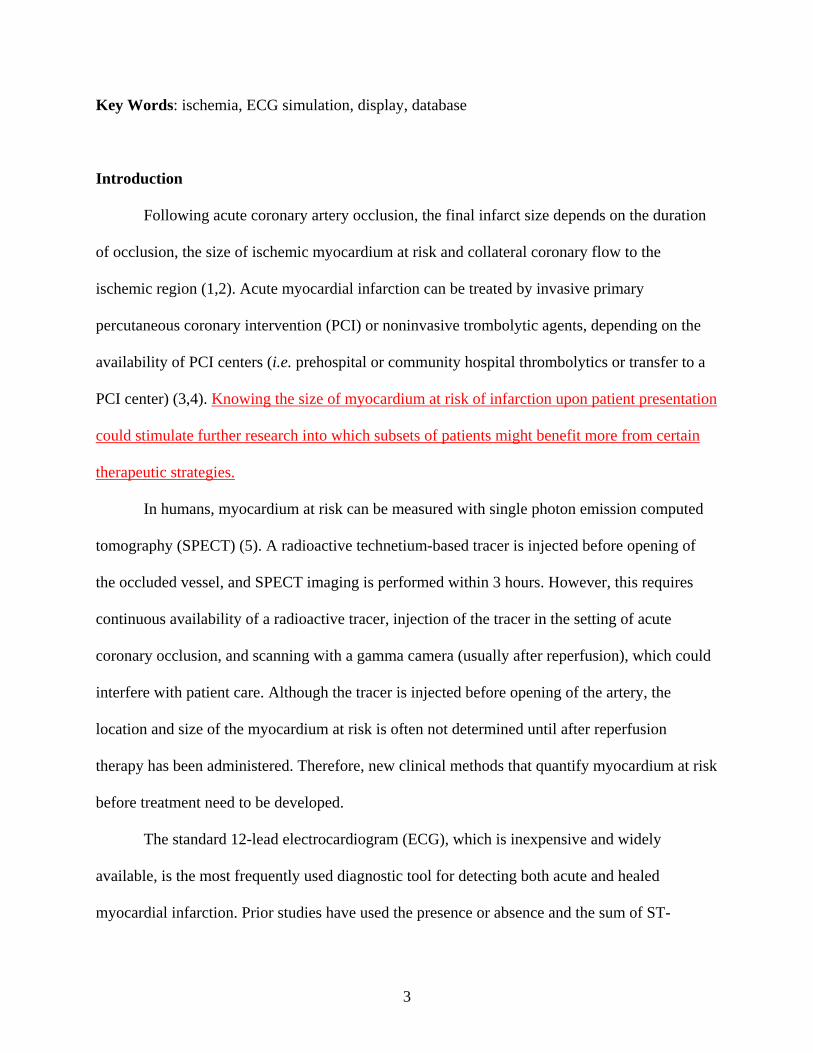
Key Words: ischemia, ECG simulation, display, database
Introduction
Following acute coronary artery occlusion, the final infarct size depends on the duration
of occlusion, the size of ischemic myocardium at risk and collateral coronary flow to the
ischemic region (1,2). Acute myocardial infarction can be treated by invasive primary
percutaneous coronary intervention (PCI) or noninvasive trombolytic agents, depending on the
availability of PCI centers (i.e. prehospital or community hospital thrombolytics or transfer to a
PCI center) (3,4). Knowing the size of myocardium at risk of infarction upon patient presentation
could stimulate further research into which subsets of patients might benefit more from certain
therapeutic strategies.
In humans, myocardium at risk can be measured with single photon emission computed
tomography (SPECT) (5). A radioactive technetium-based tracer is injected before opening of
the occluded vessel, and SPECT imaging is performed within 3 hours. However, this requires
continuous availability of a radioactive tracer, injection of the tracer in the setting of acute
coronary occlusion, and scanning with a gamma camera (usually after reperfusion), which could
interfere with patient care. Although the tracer is injected before opening of the artery, the
location and size of the myocardium at risk is often not determined until after reperfusion
therapy has been administered. Therefore, new clinical methods that quantify myocardium at risk
before treatment need to be developed.
The standard 12-lead electrocardiogram (ECG), which is inexpensive and widely
available, is the most frequently used diagnostic tool for detecting both acute and healed
myocardial infarction. Prior studies have used the presence or absence and the sum of ST-
4
segment deviation in the 12-lead ECG to quantify myocardium at risk (6), however, the results
have been unreliable when compared with SPECT (7). These approaches do not take into
account the complex interactions that affect the body-surface electrocardiogram, which include
that certain ventricular walls have greater effects on the ECG than others, that individual leads
are at different distances from the heart and that electrical cancellation can occur (8).
In order to make sense of these complex interactions to quantify chronic infarcts,
Selvester and colleagues used computer simulation of the electrical activity of the heart to
develop a 12-lead ECG QRS-scoring system to quantify different size infarcts throughout the left
ventricle (9). A new, freely-available simulation program, ECGSim (www.ecgsim.org) uses a
heart and thorax model measured by magnetic resonance images and takes into account the
complex geometry and differences in conductivity between the myocardium, blood pool and
lungs (10). We hypothesized that simulations using ECGSim could be used to study acute
ischemia and develop methods to quantify myocardium at risk of infarction. The aim of the paper
was to develop an automated method that Graphically Displays Ischemic Myocardium associated
with a patient ECG, from here on denoted as de novo ECG by comparing the electrocardiogram
to a database of Simulated Electrocardiograms (DIMS-ECG method).
Methods
In this study, we generated a database of simulated 12-lead ECGs associated with known
areas of ischemia. Then, given a de novo ECG, measurements of ST-segment elevation and T-
wave amplitude from each lead are extracted and compared to the same measurements from all
ECGs in the database. The closest matches are combined and presented graphically on a polar
plot, which is a method of displaying the LV. Figure 1 shows the relationship between displaying
5
ischemic myocardium (shaded area) from a left anterior descending (LAD) artery occlusion on a
“Mercator projection” (Figure 1A) and a polar plot (Figure 1B). Each image shows the typical
distribution of the coronary arteries and the division of the left ventricle into four walls. The
same region of ischemia is shown on a three-dimensional depiction of the left and right
ventricles in Figure 2 (right).
Development of the DIMS-ECG database
We used the freely available simulation program ECGSIM (www.ecgsim.org) (10) to
simulate ischemia and produce a database of the corresponding ECGs. ECGSIM allows the user
to alter the transmembrane (action) potentials on the endocardium and epicardium in 257 nodes
on the left and right ventricles (Figure 2). ECGSIM does take into account the position of the
heart in the chest and that electrical cancellation can occur. Parameters for each node can be set
manually or can be retrieved from a file. The resulting electrical changes can be viewed on body
surface maps and 12-lead ECGs that can be saved to files. Ischemia was simulated by changing
the action potentials to yield a delayed initiation of action potential upstroke (delayed
depolarization), a depolarized resting potential (resulting in reduced action potential amplitude)
and earlier repolarization (reduced action potential duration). Of note, two additional changes do
occur during acute ischemia. There is a decrease in the action potential upstroke velocity (which
is separate from the delay in the initiation of the upstroke) and a decrease in the maximum
potential to which the cell depolarizes (further reducing action potential amplitude in addition to
the depolarized resting potential) (11-13). The process of creating the DIMS-ECG database is
shown in Figure 3 and can be summarized as follows:

6
1. Defining different levels of ischemia
Five different levels of ischemia severity were simulated; the different levels included both
delaying depolarization time by 15, 15, 10, 10 and 8 milliseconds, reducing action potential
duration, and reducing action potential amplitude to 50%, 80%, 85%, 90% and 93% of
normal.
2. Establishing basic ischemic regions
Simulating all possible ischemic patterns with 257 nodes would result in 6257 potential
combinations (one normal level and 5 different levels of ischemia). This amount of
simulation is not possible to handle and therefore limitations were set. As a first step, we
decided which physiologically ischemic regions should be included in the database. The
location and size of the simulated ischemic regions were selected based on coronary artery
distributions as previously defined by Selvester (Figure 1) (9). We divided the coronary
artery distributions into 10 basic regions. These were combined to produce small, medium
and large regions of ischemia to obtain a total of 23 regions (Table 1).
3. Expanding ischemic regions
Variations of the regions were developed by slightly expanding the size of the ischemic area
outside of the basic regions. The region was allowed to include one of the neighbour nodes to
the nodes within the basic region. This resulted in 9091 unique patterns and in each of these
patterns five different levels of ischemia were simulated, resulting in a total of 45,455 ECGs.
In addition, 1,000 “normal” ECGs were added to the database by introducing small random
modifications of the normal action potentials. Given a normal de novo ECG, the program has
to be able to find enough normal samples in the database to correctly classify the ECG.
7
Using the DIMS-ECG database
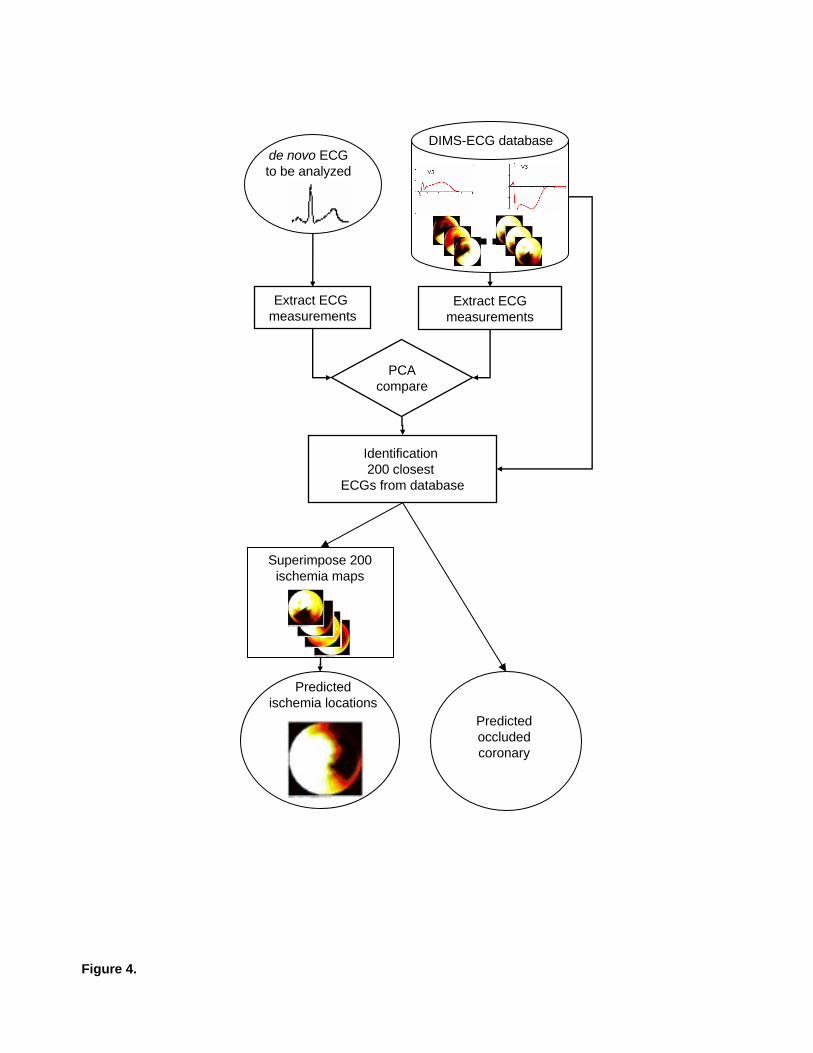
The steps involved in using the DIMS-ECG database are shown in Figure 4 and can be
summarized as follows:
1. Given a de novo ECG, maximum and minimum T-wave amplitude and ST-segment
amplitude at the J-point, J + 40 ms and J + 80 ms were extracted for each lead, which
resulted in a total of 60 measurements (5 parameters in 12 leads) for that particular ECG.
In the current implementation, additional parameters can be chosen from a set of 27
possible parameters. The same measurements were extracted from each ECG in the
database. The parameter-extraction routine was based on the SignalAnalysis software
developed by the Signal Processing Group (Department of Applied Electronics, Lund
University, Lund, Sweden) (14).
2. A simple approach would be to compare the 60 de novo ECG measurements with the
corresponding measurements for each ECG in the database. However, many of these 60
measurements are highly correlated and, therefore, this approach would not result in an
accurate method of matching two ECGs. Instead, the database was compressed by the use
of Principal Component Analysis (PCA) (15). PCA finds orthogonal modes of variation
in the database so that the 60 measurements from one ECG can accurately be described
using only 3-5 parameters (principal components). In the current implementation of the
algorithm the user can select the number of principal components to use.
3. The de novo ECG is compared to each ECG in the database by calculating the Euclidean
distance between their principal coordinates. The closest 200 matches are selected and
the regions of ischemia associated with the retrieved 200 matches are “averaged” to
8
obtain one image representing the myocardium at risk of infarction. This number of
matches in the algorithm was selected to be approximately 5‰ of the number of ECGs in
the database so that the matches would not exceed the number of combinations in one
basic region. In addition, a percentage representing how many of the matched ECGs
belonged to each basic region is calculated. This can be interpreted as the likelihood that
the de novo ECG belongs to each basic region.
Testing the simulated ECG database
In order to test the applicability of the DIMS-ECG database, three patients were selected
from the STAFF studies investigations (14,16). These individuals had stable coronary disease
and were referred for prolonged percutaneous transluminal coronary angioplasty with
nonperfusion balloons at the Charleston Area Medical Center (Charleston, West Virginia). The 3
patients were selected to have one example from each of the main coronary arteries that meets
American College of Cardiology/American Heart Association ECG criteria for acute ST-
elevation myocardial ischemia. Patient #1 had a left circumflex (LCX) occlusion, patient #2 had
a right coronary artery (RCA) occlusion and patient #3 had a left anterior descending (LAD)
occlusion. They underwent two SPECT studies, one with sestamibi injection during prolonged
balloon occlusion and one control study on the following day (16). The method for SPECT
imaging acquisition and analysis was described previously (16). Twelve-lead ECGs were
recorded continuously before, during and after angioplasty (14). For this study, we used ECGs
recorded just before balloon deflation. The STAFF studies were approved by the investigational
review board and informed consent was obtained from each subject.
9
Results
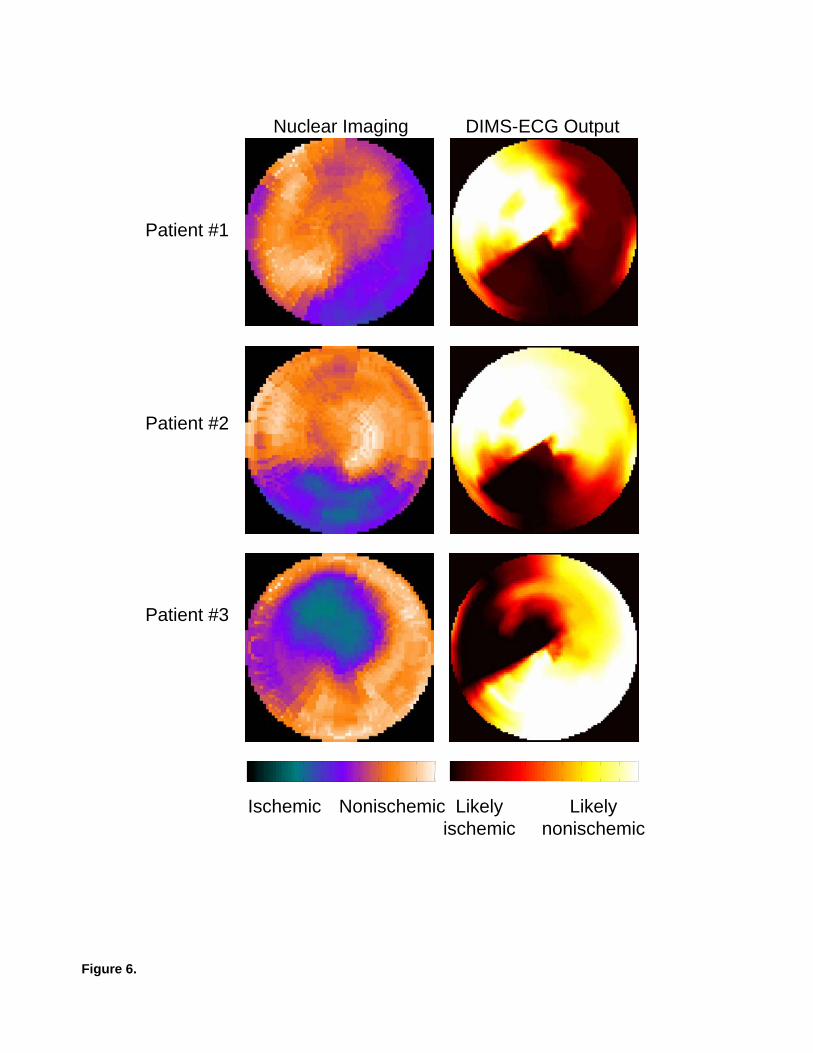
Figure 5 shows the ECGs and Figure 6 shows the SPECT and DIMS-ECG polar plots for
three patients who underwent prolonged coronary angioplasty. Patients #1 and #2 both have
ECGs with ST-elevation in the inferior leads (II, III and aVF) and ST-depression in the anterior
precordial leads (primarily V2 and V3). The DIMS-ECG algorithm correctly predicted that
Patient #1 had an LCX occlusion and Patient #2 had an RCA occlusion. The DIMS-ECG polar
plot output of Patient #1 predicted ischemia in the posterolateral and inferior walls, which is
concordant with the SPECT ischemic region. The 200 ECGs in the DIMS-ECG database that
were most similar to the ECG of Patient #1 consisted of 78% dominant LCX, 11% nondominant
LCX and 11% RCA. The DIMS-ECG polar plot output of Patient #2 predicted ischemia limited
to the inferior wall, which is in agreement with SPECT. The DIMS-ECG distribution of most-
similar ECGs were 84% RCA and 16% dominant LCX. The LAD occlusion of Patient #3
produced ST-elevation in leads V2, V3, V4, I and aVL and ST-depression in leads III and aVF.
The DIMS-ECG polar plot predicted ischemia in the anterosuperior and anteroseptal left
ventricular wall, which is in agreement with SPECT. The 200 most similar ECGs (100%) were
from LAD occlusion.
The entire algorithm is written in Matlab (http://www.mathworks.com) and will be made
freely available in open source form upon the time of publication at
http://www.heiberg.se/dims-ecg. This will also include the database with the 46,455 ECGs
together with their classification and perfusion defect territories. The user can easily define a
wide range of ECG parameters to include in the analysis and it is easy to recompute the PCA.
The parameters can then be explored quantitatively. It is also possible to load ECGs and
visualize their parametric time series.
10
Discussion
We have developed an automated algorithm to quantify and graphically display ischemic
myocardium at risk of infarction. The novel DIMS-ECG method uses the freely available ECG
simulation program ECGSIM to create a database of approximately 45,000 ECGs paired with
graphical displays of ischemia. Given a de novo ECG, ST-segment and T-wave amplitude
measurements are compared with those of the ECGs in the database. Similar ECGs are identified
and their graphical displays of ischemia are averaged to show the estimated ischemic area for the
de novo ECG. Following further development and testing, this DIMS-ECG method could be
implemented in commercial ECG machines and used to risk-stratify patients with acute
myocardial infarction in the prehospital or emergency department setting.
Physicians and researchers have been using the ECG to diagnose myocardial ischemia
and infarction for almost 100 years. However, it is difficult to unscramble the complex
interactions that affect the body-surface ECG. In the 1950s-1960s there were conflicting studies
in the literature regarding the ability of the ECG to diagnose chronic infarcts (17). However,
computer simulation of electrical depolarization by Selvester and colleagues showed that infarcts
in all parts of the heart produced quantifiable changes in the body-surface ECG (17,18). This led
to the development of the 53-criteria, 32-point Selvester QRS-score to quantify and localize
infarcts (9). While the ECG is routinely used to diagnose acute myocardial ischemia, there have
been conflicting reports regarding its ability to quantify the size of ischemic myocardium (6,7).
Prior approaches have not been based on systematic simulation of ischemia and have used
simplistic approaches where ST-segment deviation in each lead is given equal weight. This does
not take into account that individual ECG leads are at different distances from the heart and that
11
certain ventricular walls have greater effects on the ECG. Thus, we sought to develop a more
sophisticated algorithm by simulating different sizes and severities of ischemia throughout the
LV. However, unlike the rule-based approach developed by Selvester (18), we have created a
database of approximately 45,000 simulated ECGs connected to maps of the associated ischemic
region. The automated computer algorithm (DIMS-ECG) uses PCA to compare a de novo ECG
to all ECGs in the database and identifies the 200 closest ECGs. DIMS-ECG then superimposes
the 200 ischemia maps to display the predicted ischemia location and the predicted coronary
artery that is occluded.
The freely available DIMS-ECG algorithm together with the ECG database may be
useful for a large number of studies. The software will allow other researchers to continue the
approach of simulating ECGs to test various analysis schemes and to explore different
parameters for quantifying and graphically displaying ischemic myocardium. For example, as
ischemia continues and necrosis develops, ST-segment and T-wave changes may decrease in
magnitude, and QRS changes such as pathological Q waves will likely develop. This would
result in underestimation of the ischemia region by the current DIMS-ECG algorithm. Future
work should include simulation of electrically inactive cells and analysis of QRS complex
measurements to simulate effects of confounding prior infarcts. Such an approach may allow
prediction and graphical display of myocardium that is already dead and myocardium that is
ischemic, but potentially salvageable following reperfusion. Prior studies have indicated that
information regarding the potential for myocardial salvage is contained in the 12-lead ECG (19).
Limitations of the current version of the DIMS-ECG database are that it was based on
simulations from a single heart’s and thorax’s geometry. Simulating ECGs using different heart
positions, angles and geometries may improve the ability of the DIMS-ECG algorithm to

12
quantify and localize ischemic myocardium. In addition, the normal values for 12-lead ECGs are
known to differ by age, gender and race (20). Inputting normal ECGs into the database classified
by these variables, and then adding these as input variables when analyzing a de novo ECG, may
improve the algorithm’s performance. Finally, further study is required to validate the DIMS-
ECG method against other measures of ischemic myocardium (e.g. SPECT) in patients.
Unfortunately, SPECT imaging has its own limitations and, thus, any method to quantify and
display ischemic myocardium should be prospectively studied to determine if it provides
additional value in risk-stratifying patients with acute myocardial infarction.
In conclusion, we have presented a method where an ECG from a patient with potential
ischemia can be compared to a database of simulated ECGs associated with known areas of
ischemia. This DIMS-ECG program identifies similar ECGs in the database and outputs a
graphical display of the predicted ischemic myocardium for the de novo ECG. The program and
associated database will be made freely available for further development and testing.
Acknowledgements
The authors wish to acknowledge valuable help from Dr. Thom Oostendorp, University
of Nijmegen, the Netherlands regarding ECGSSIM and from Professor Leif Sörmo, Lund
University, for comments on the DIMS-ECG algorithm development.
13
References
1. Reimer KA, Jennings RB, Cobb FR, Murdock RH, Greenfield JC, Jr., Becker LC,
Bulkley BH, Hutchins GM, Schwartz RP, Jr., Bailey KR, et al. Animal models for
protecting ischemic myocardium: results of the NHLBI Cooperative Study. Comparison
of unconscious and conscious dog models. Circ Res. 1985; 56:651-665.
2. Christian TF, Schwartz RS, Gibbons RJ. Determinants of infarct size in reperfusion
therapy for acute myocardial infarction. Circulation. 1992; 86:81-90.
3. Antman EM, Hand M, Armstrong PW, Bates ER, Green LA, Halasyamani LK, Hochman
JS, Krumholz HM, Lamas GA, Mullany CJ, Pearle DL, Sloan MA, Smith SC, Jr., Anbe
DT, Kushner FG, Ornato JP, Jacobs AK, Adams CD, Anderson JL, Buller CE, Creager
MA, Ettinger SM, Halperin JL, Hunt SA, Lytle BW, Nishimura R, Page RL, Riegel B,
Tarkington LG, Yancy CW. 2007 focused update of the ACC/AHA 2004 guidelines for
the management of patients with ST-elevation myocardial infarction: a report of the
American College of Cardiology/American Heart Association task force on practice
guidelines: developed in collaboration with the Canadian Cardiovascular Society
endorsed by the American Academy of Family Physicians: 2007 writing group to review
new evidence and update the ACC/AHA 2004 guidelines for the management of patients
with ST-elevation myocardial infarction, writing on behalf of the 2004 writing
Committee. Circulation. 2008; 117:296-329.
4. Ting HH, Krumholz HM, Bradley EH, Cone DC, Curtis JP, Drew BJ, Field JM, French
WJ, Gibler WB, Goff DC, Jacobs AK, Nallamothu BK, O'Connor RE, Schuur JD.
Implementation and integration of prehospital ecgs into systems of care for acute

14
coronary syndrome. A scientific statement from the American Heart Association
interdisciplinary council on quality of care and outcomes research, emergency
cardiovascular care committee, council on cardiovascular nursing, and council on clinical
cardiology. Circulation. 2008; 118:1066-1079.
5. Sinusas AJ, Trautman KA, Bergin JD, Watson DD, Ruiz M, Smith WH, Beller GA.
Quantification of area at risk during coronary occlusion and degree of myocardial salvage
after reperfusion with technetium-99m methoxyisobutyl isonitrile. Circulation. 1990;
82:1424-1437.
6. Aldrich HR, Wagner NB, Boswick J, Corsa AT, Jones MG, Grande P, Lee KL, Wagner
GS. Use of initial ST-segment deviation for prediction of final electrocardiographic size
of acute myocardial infarcts. Am J Cardiol. 1988; 61:749-753.
7. Christian TF, Gibbons RJ, Clements IP, Berger PB, Selvester RH, Wagner GS. Estimates
of myocardium at risk and collateral flow in acute myocardial infarction using
electrocardiographic indexes with comparison to radionuclide and angiographic
measures. J Am Coll Cardiol. 1995; 26:388-393.
8. Holland RP, Brooks H, Lidl B. Spatial and nonspatial influences on the TG-ST segment
deflection of ischemia. Theoretical and experimental analysis in the pig. J Clin Invest.
1977; 60:197-214.
9. Selvester RH, Wagner GS, Ideker RE. Myocardial Infarction. In: Macfarlane PW, Lawrie
TDV, eds. Comprehensive electrocardiology: theory and practice in health and disease.
Vol 1. New York: Pergamon Press; 1989:565-629.

15
10. van Oosterom A, Oostendorp TF. ECGSIM: an interactive tool for studying the genesis
of QRST waveforms. Heart. 2004; 90:165-168.
11. Kleber AG, Janse MJ, van Capelle FJ, Durrer D. Mechanism and time course of S-T and
T-Q segment changes during acute regional myocardial ischemia in the pig heart
determined by extracellular and intracellular recordings. Circ Res. 1978; 42:603-613.
12. Shaw RM, Rudy Y. Electrophysiologic effects of acute myocardial ischemia: a
theoretical study of altered cell excitability and action potential duration. Cardiovasc Res.
1997; 35:256-272.
13. Miller WT, 3rd, Geselowitz DB. Simulation studies of the electrocardiogram. II.
Ischemia and infarction. Circ Res. 1978; 43:315-323.
14. Persson E, Pettersson J, Ringborn M, Sornmo L, Warren SG, Wagner GS, Maynard C,
Pahlm O. Comparison of ST-segment deviation to scintigraphically quantified
myocardial ischemia during acute coronary occlusion induced by percutaneous
transluminal coronary angioplasty. Am J Cardiol. 2006; 97:295-300.
15 Jolliffe I.T. Principal Component Analysis, Series: Springer Series in Statistics, 2nd ed.,
Springer, NY, ISBN 978-0-387-95442-4, 2002,
16. Persson E, Palmer J, Pettersson J, Warren SG, Borges-Neto S, Wagner GS, Pahlm O.
Quantification of myocardial hypoperfusion with 99m Tc-sestamibi in patients
undergoing prolonged coronary artery balloon occlusion. Nucl Med Commun. 2002;
23:219-228.
17. Strauss DG, Selvester RH. The QRS complex -- a biomarker that "images" the heart:
QRS scores to quantify myocardial scar in the presence of normal and abnormal
ventricular conduction. J Electrocardiol. 2009; 42:(in press).

16
18. Selvester RH, Kalaba R, Collier CR, Bellman R, Kagiwada H. A digital computer model
of the vectorcardiogram with distance and boundary effects: simulated myocardial
infarction. Am Heart J. 1967; 74:792-808.
19. Sejersten M, Ripa RS, Maynard C, Grande P, Andersen HR, Wagner GS, Clemmensen P.
Timing of ischemic onset estimated from the electrocardiogram is better than historical
timing for predicting outcome after reperfusion therapy for acute anterior myocardial
infarction: a DANish trial in Acute Myocardial Infarction 2 (DANAMI-2) substudy. Am
Heart J. 2007; 154:61 e61-68.
20. Engblom H, Hedstrom E, Palmer J, Wagner GS, Arheden H. Determination of the left
ventricular long-axis orientation from a single short-axis MR image: relation to BMI and
age. Clin Physiol Funct Imaging. 2004; 24:310-315.
17
Figure Legends
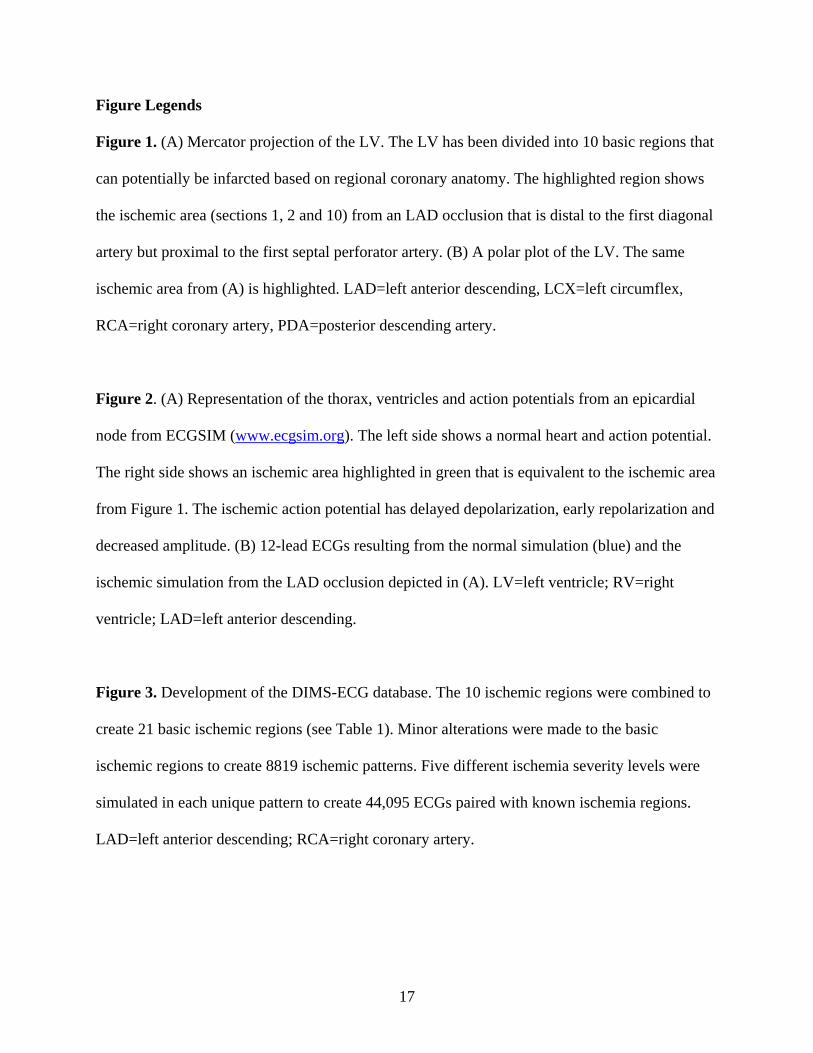
Figure 1. (A) Mercator projection of the LV. The LV has been divided into 10 basic regions that
can potentially be infarcted based on regional coronary anatomy. The highlighted region shows
the ischemic area (sections 1, 2 and 10) from an LAD occlusion that is distal to the first diagonal
artery but proximal to the first septal perforator artery. (B) A polar plot of the LV. The same
ischemic area from (A) is highlighted. LAD=left anterior descending, LCX=left circumflex,
RCA=right coronary artery, PDA=posterior descending artery.
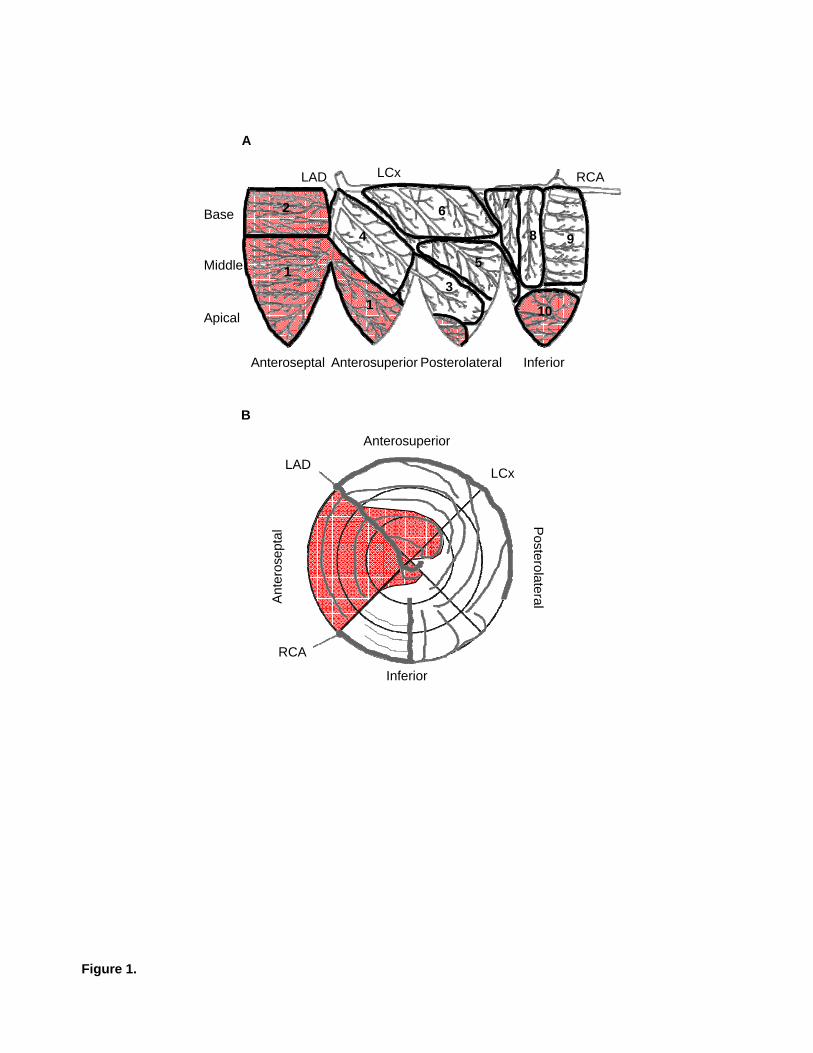
Figure 2. (A) Representation of the thorax, ventricles and action potentials from an epicardial
node from ECGSIM (www.ecgsim.org). The left side shows a normal heart and action potential.
The right side shows an ischemic area highlighted in green that is equivalent to the ischemic area
from Figure 1. The ischemic action potential has delayed depolarization, early repolarization and
decreased amplitude. (B) 12-lead ECGs resulting from the normal simulation (blue) and the
ischemic simulation from the LAD occlusion depicted in (A). LV=left ventricle; RV=right
ventricle; LAD=left anterior descending.
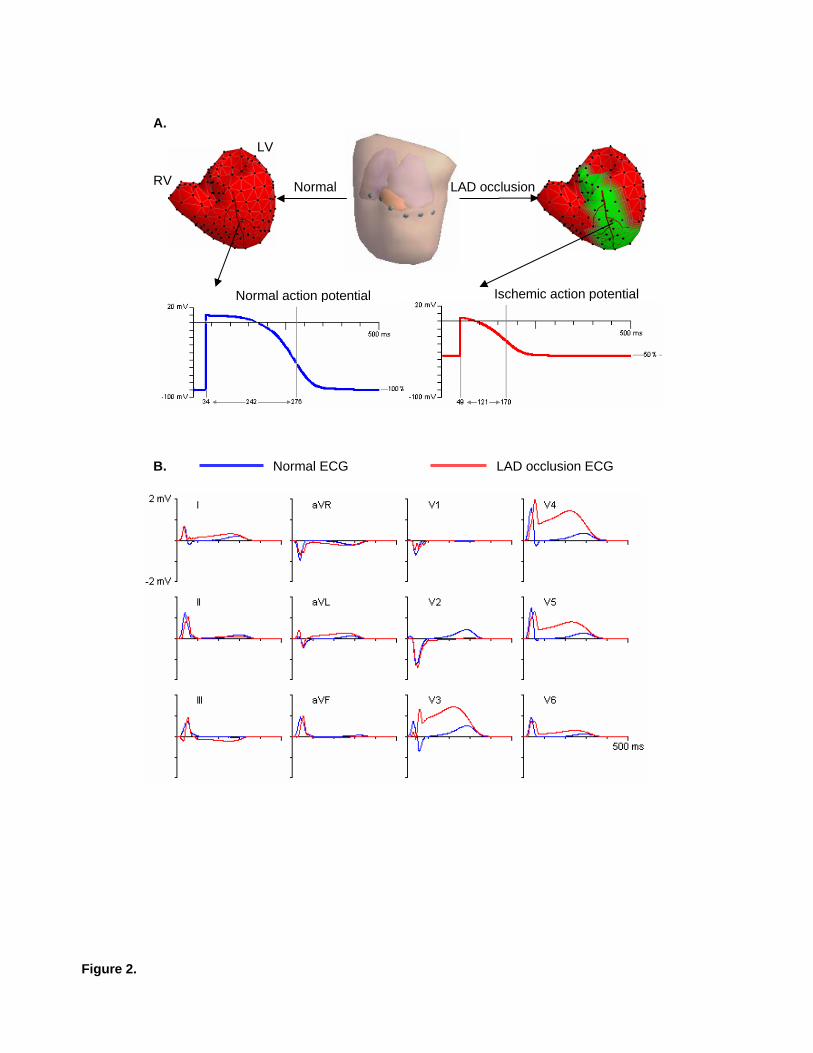
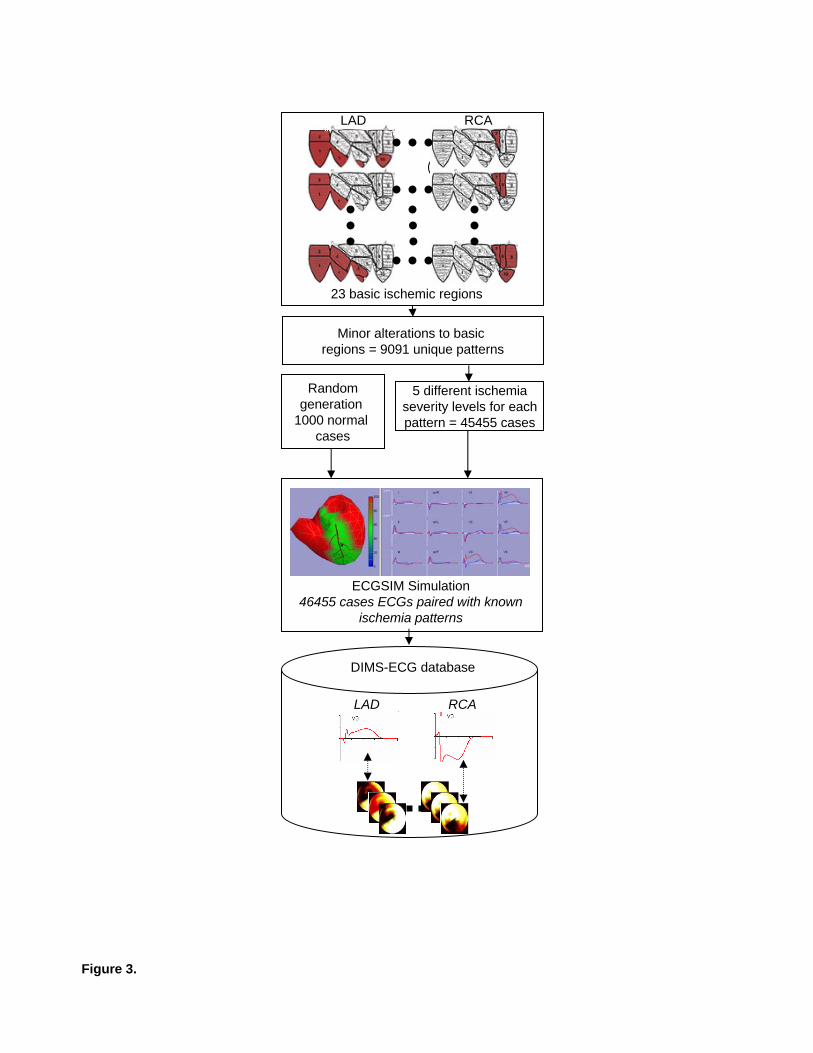
Figure 3. Development of the DIMS-ECG database. The 10 ischemic regions were combined to
create 21 basic ischemic regions (see Table 1). Minor alterations were made to the basic
ischemic regions to create 8819 ischemic patterns. Five different ischemia severity levels were
simulated in each unique pattern to create 44,095 ECGs paired with known ischemia regions.
LAD=left anterior descending; RCA=right coronary artery.

18
Figure 4. Using the DIMS-ECG database. ST-segment and T-wave amplitude measurements are
extracted from the de novo ECG and compared to the same measurements from each ECG in the
database using principal component analysis (PCA). The 200 closest ECG matches are identified
and the corresponding ischemia maps are superimposed to create a map showing the predicted
ischemia location. The percentage of the 200 matches from each coronary artery territory is also
presented that can be used to predict the location of the occlusion.
Figure 5. 12 lead ECGs for 3 patients who underwent prolonged coronary angioplasty. ECGs
were recorded prior to balloon deflation. Patient #1 had an left circumflex occlusion, Patient #2
had an right coronary artery occlusion and Patient #3 had an left anterior descending occlusion.
Figure 6. SPECT (left column) and DIMS-ECG (right column) polar plots for the same 3
patients as in Figure 5. Color scales show the distribution of ischemic to nonischemic
myocardium for SPECT and the predicted ischemic to nonischemic scale for DIMS-ECG.
2 7
5
6
3
4
1
1
8 9
10
Anteroseptal
Base
Middle
Apical
Anterosuperior Posterolateral Inferior
LAD LCx
Inferior
Anterosuperior
Ante
rose
ptal
Posterolateral
RCA
LAD LCx
A
B
Figure 1.
RCA
Normal LAD occlusion
Normal action potential Ischemic action potential
Normal ECG LAD occlusion ECG
LV
RV
A.
B.
Figure 2.
5 different ischemia severity levels for each pattern = 45455 cases
Minor alterations to basic regions = 9091 unique patterns
Randomgeneration
1000 normal cases
1
LAD RCA
23 basic ischemic regions
ECGSIM Simulation46455 cases ECGs paired with known
ischemia patterns
DIMS-ECG database
LAD RCA
Figure 3.
Extract ECGmeasurements
de novo ECG to be analyzed
Identification 200 closest
ECGs from database
Extract ECG measurements
PCAcompare
Predictedoccludedcoronary
DIMS-ECG database
Predictedischemia locations
Superimpose 200 ischemia maps
Figure 4.
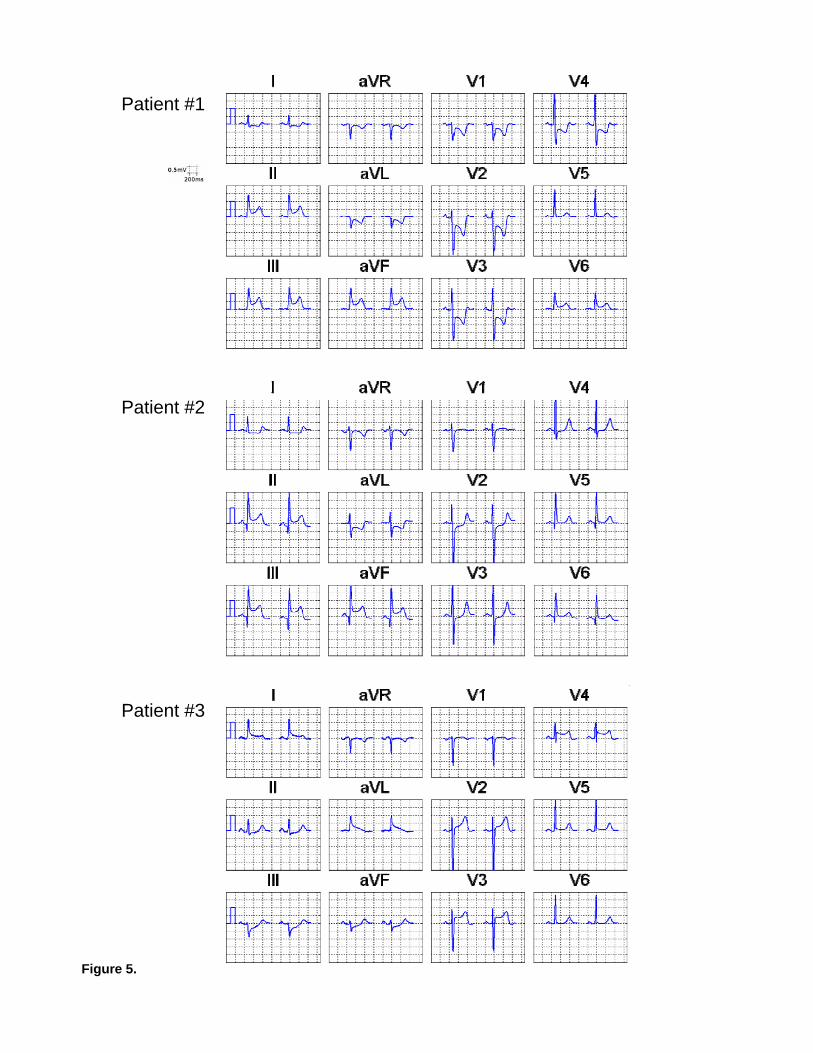
Figure 5.
Patient #1
Patient #2
Patient #3
Ischemic Nonischemic
Nuclear Imaging DIMS-ECG Output
Likely ischemic
Likely nonischemic
Patient #1
Patient #2
Patient #3
Figure 6.