DIMM-SC: A Dirichlet mixture model for clustering …DIMM-SC: A Dirichlet mixture model for...
18
DIMM-SC: A Dirichlet mixture model for clustering droplet-based single cell transcriptomic data Zhe Sun 1 , Ting Wang 2 , Ke Deng 3 , Xiao-Feng Wang 4 , Robert Lafyatis 5 , Ying Ding 1 , Ming Hu 4,* , Wei Chen 1,2,* 1 Department of Biostatistics, University of Pittsburgh Graduate School of Public Health, Pittsburgh, Pennsylvania, USA, 2 Division of Pulmonary Medi- cine, Allergy and Immunology; Department of Pediatrics, Children’s Hospital of Pittsburgh of UPMC, University of Pittsburgh, Pittsburgh, Pennsylva- nia, USA, 3 Center for Statistical Science, Tsinghua University, Beijing, China, 4 Department of Quantitative Health Sciences, Lerner Research Institute, Cleveland Clinic Foundation, Cleveland, Ohio, USA, 5 Department of Medicine, Division of Rheumatology and Clinical Immunology, University of Pittsburgh School of Medicine, Pittsburgh, Pennsylvania, USA Abstract Motivation: Single cell transcriptome sequencing (scRNA-Seq) has become a revolutionary tool to study cellular and molecular processes at single cell resolution. Among existing technologies, the recently developed droplet-based platform enables efficient parallel processing of thousands of single cells with direct counting of transcript copies using Unique Molecular Identifier (UMI). Despite the technology advances, statistical methods and computa- tional tools are still lacking for analyzing droplet-based scRNA-Seq data. Particularly, model-based approaches for clustering large-scale single cell transcriptomic data are still under-explored. Methods: We developed DIMM-SC, a Dirichlet Mixture Model for clustering droplet-based Single Cell transcriptomic data. This approach explicitly models UMI count data from scRNA-Seq experiments and characterizes variations across different cell clusters via a Dirichlet mixture prior. An expec- tation-maximization algorithm is used for parameter inference. Results: We performed comprehensive simulations to evaluate DIMM-SC and compared it with existing clustering methods such as K-means, CellTree and Seurat. In addition, we analyzed public scRNA-Seq datasets with known cluster labels and in-house scRNA-Seq datasets from a study of systemic sclerosis with prior biological knowledge to benchmark and validate DIMM-SC. Both simulation studies and real data applications demonstrated that overall, DIMM-SC achieves substantially improved clustering accuracy and much lower clustering variability compared to other existing clustering methods. More importantly, as a model-based approach, DIMM-SC is able to quantify the clustering uncertainty for each single cell, facilitating rigor- ous statistical inference and biological interpretations, which are typically unavailable from existing clustering methods. Availability: DIMM-SC has been implemented in a user-friendly R package with a detailed tutorial available on www.pitt.edu/~wec47/singlecell.html. Contact: [email protected] or [email protected]. 1 Introduction Single cell RNA sequencing (scRNA-Seq) technologies have advanced rapidly in recent years (Gawad, et al., 2016). Among them, the newly developed droplet-based technologies have generated great interests (Macosko, et al., 2015; Zheng, et al., 2017). They are able to measure the transcriptome of thousands of single cells simultaneously in a short time period and at a relatively low cost (Macosko, et al., 2015; Zheng, et al., 2016). More attractive- ly, droplet-based technologies utilize Unique Molecular Identifier (UMI) to annotate the 3’ end of each transcript in order to reduced PCR amplification bias, increase transcript capture efficiency, and substantially minimize batch effect (Islam, et al., 2014; Kivioja, et al., 2012). More recently, 10X Ge- nomics has released a commercialized droplet-based Chromium system, which is efficient and cost-effective in isolating thousands of single cells with average running time of ten minutes based on the Gel bead in Emulsion (GEM) technology. They used this platform to comprehensively characterize and profile peripheral blood mononuclear cells (PBMC) (Zheng, et al., 2017). Harnessing the power of these exciting new technologies, droplet-based scRNA-Seq has brought revolutionary insights to understand cellular and molecular processes at single cell resolution. One important question in the analysis of scRNA-Seq data is to identify and characterize cell subtypes from heterogeneous tissues, which is essential to fully understand cell identity and cell function. Clustering methods have been extensively studied for many areas in the past decades. For example, unsupervised clustering methods such as K-means clustering, hierarchical clustering, and Adaptive Density Peak (ADP) clustering (Rodriguez and Laio, 2014; Wang and Xu, 2015), can be applied to droplet-based scRNA-Seq data after certain data transformation. In addition, tailored methods such CellTree and Seurat have been proposed to analyze scRNA-Seq data with the motivation from early generation platforms (duVerle, et al., 2016; Jaitin, et al., 2014). However, clustering methods tailored to droplet-based scRNA-Seq data are largely lagging behind. Although existing clustering methods can be adapted, there are at least three key limitations of using those methods to cluster droplet-based scRNA-Seq data. First of all, most existing meth- ods are developed for continuous data (e.g. Fragments Per Kilobase of transcript per Million (FPKM) or log-transformed count data) while droplet- based scRNA-Seq data consist of the discrete count of the unique UMIs, which are direct measurements of transcript copies from each gene. Converting UMI counts into continuous measure will alter the straightforward interpretation of UMI, thus it is more appealing and reasonable to directly model the count data. Second, most existing methods are designed for the early generation of scRNA-Seq technologies that measure transcriptome across a rela- tively small number of single cells. It is unclear how these methods can be scaled up to cluster droplet-based scRNA-Seq data, which usually contain thousands of single cells. Last but not the least, most existing methods only provide a “hard” cluster membership for each cell without statistical uncer- tainty quantification. In order to conduct rigorous statistical inference and achieve reliable data interpretation, different sources of uncertainties in drop- let-based scRNA-Seq data need to be explicitly taken into consideration in the clustering analysis. To fill in these gaps, we proposed DIMM-SC, a Dirichlet mixture model for clustering droplet-based scRNA-Seq data. DIMM-SC explicitly models both the within-cluster and between-cluster variability of the UMI count data, leading to rigorous quantification of clustering uncertainty for each single
Transcript of DIMM-SC: A Dirichlet mixture model for clustering …DIMM-SC: A Dirichlet mixture model for...
DIMM-SC: A Dirichlet mixture model for clustering droplet-based single cell transcriptomic data
Zhe Sun1, Ting Wang2, Ke Deng3, Xiao-Feng Wang4, Robert Lafyatis5, Ying Ding1, Ming Hu4,*, Wei Chen1,2,* 1Department of Biostatistics, University of Pittsburgh Graduate School of Public Health, Pittsburgh, Pennsylvania, USA, 2Division of Pulmonary Medi-cine, Allergy and Immunology; Department of Pediatrics, Children’s Hospital of Pittsburgh of UPMC, University of Pittsburgh, Pittsburgh, Pennsylva-nia, USA, 3Center for Statistical Science, Tsinghua University, Beijing, China, 4Department of Quantitative Health Sciences, Lerner Research Institute, Cleveland Clinic Foundation, Cleveland, Ohio, USA, 5Department of Medicine, Division of Rheumatology and Clinical Immunology, University of Pittsburgh School of Medicine, Pittsburgh, Pennsylvania, USA
Abstract Motivation: Single cell transcriptome sequencing (scRNA-Seq) has become a revolutionary tool to study cellular and molecular processes at single cell resolution. Among existing technologies, the recently developed droplet-based platform enables efficient parallel processing of thousands of single cells with direct counting of transcript copies using Unique Molecular Identifier (UMI). Despite the technology advances, statistical methods and computa-tional tools are still lacking for analyzing droplet-based scRNA-Seq data. Particularly, model-based approaches for clustering large-scale single cell transcriptomic data are still under-explored. Methods: We developed DIMM-SC, a Dirichlet Mixture Model for clustering droplet-based Single Cell transcriptomic data. This approach explicitly models UMI count data from scRNA-Seq experiments and characterizes variations across different cell clusters via a Dirichlet mixture prior. An expec-tation-maximization algorithm is used for parameter inference. Results: We performed comprehensive simulations to evaluate DIMM-SC and compared it with existing clustering methods such as K-means, CellTree and Seurat. In addition, we analyzed public scRNA-Seq datasets with known cluster labels and in-house scRNA-Seq datasets from a study of systemic sclerosis with prior biological knowledge to benchmark and validate DIMM-SC. Both simulation studies and real data applications demonstrated that overall, DIMM-SC achieves substantially improved clustering accuracy and much lower clustering variability compared to other existing clustering methods. More importantly, as a model-based approach, DIMM-SC is able to quantify the clustering uncertainty for each single cell, facilitating rigor-ous statistical inference and biological interpretations, which are typically unavailable from existing clustering methods. Availability: DIMM-SC has been implemented in a user-friendly R package with a detailed tutorial available on www.pitt.edu/~wec47/singlecell.html. Contact: [email protected] or [email protected].
1 Introduction Single cell RNA sequencing (scRNA-Seq) technologies have advanced rapidly in recent years (Gawad, et al., 2016). Among them, the newly developed droplet-based technologies have generated great interests (Macosko, et al., 2015; Zheng, et al., 2017). They are able to measure the transcriptome of thousands of single cells simultaneously in a short time period and at a relatively low cost (Macosko, et al., 2015; Zheng, et al., 2016). More attractive-ly, droplet-based technologies utilize Unique Molecular Identifier (UMI) to annotate the 3’ end of each transcript in order to reduced PCR amplification bias, increase transcript capture efficiency, and substantially minimize batch effect (Islam, et al., 2014; Kivioja, et al., 2012). More recently, 10X Ge-nomics has released a commercialized droplet-based Chromium system, which is efficient and cost-effective in isolating thousands of single cells with average running time of ten minutes based on the Gel bead in Emulsion (GEM) technology. They used this platform to comprehensively characterize and profile peripheral blood mononuclear cells (PBMC) (Zheng, et al., 2017). Harnessing the power of these exciting new technologies, droplet-based scRNA-Seq has brought revolutionary insights to understand cellular and molecular processes at single cell resolution.
One important question in the analysis of scRNA-Seq data is to identify and characterize cell subtypes from heterogeneous tissues, which is essential to fully understand cell identity and cell function. Clustering methods have been extensively studied for many areas in the past decades. For example, unsupervised clustering methods such as K-means clustering, hierarchical clustering, and Adaptive Density Peak (ADP) clustering (Rodriguez and Laio, 2014; Wang and Xu, 2015), can be applied to droplet-based scRNA-Seq data after certain data transformation. In addition, tailored methods such CellTree and Seurat have been proposed to analyze scRNA-Seq data with the motivation from early generation platforms (duVerle, et al., 2016; Jaitin, et al., 2014). However, clustering methods tailored to droplet-based scRNA-Seq data are largely lagging behind. Although existing clustering methods can be adapted, there are at least three key limitations of using those methods to cluster droplet-based scRNA-Seq data. First of all, most existing meth-ods are developed for continuous data (e.g. Fragments Per Kilobase of transcript per Million (FPKM) or log-transformed count data) while droplet-based scRNA-Seq data consist of the discrete count of the unique UMIs, which are direct measurements of transcript copies from each gene. Converting UMI counts into continuous measure will alter the straightforward interpretation of UMI, thus it is more appealing and reasonable to directly model the count data. Second, most existing methods are designed for the early generation of scRNA-Seq technologies that measure transcriptome across a rela-tively small number of single cells. It is unclear how these methods can be scaled up to cluster droplet-based scRNA-Seq data, which usually contain thousands of single cells. Last but not the least, most existing methods only provide a “hard” cluster membership for each cell without statistical uncer-tainty quantification. In order to conduct rigorous statistical inference and achieve reliable data interpretation, different sources of uncertainties in drop-let-based scRNA-Seq data need to be explicitly taken into consideration in the clustering analysis.
To fill in these gaps, we proposed DIMM-SC, a Dirichlet mixture model for clustering droplet-based scRNA-Seq data. DIMM-SC explicitly models both the within-cluster and between-cluster variability of the UMI count data, leading to rigorous quantification of clustering uncertainty for each single
Z.Sun et al.
cell. We also implemented an efficient expectation-maximization (E-M) algorithm (Dempster, et al., 1977) for fast convergence. Furthermore, we pro-posed different strategies for initial value selection to ensure algorithm robustness. In the following sections, we first introduce the unique features of droplet-based scRNA-Seq data, as well as the details of the DIMM-SC method. Next, we compare the performance of DIMM-SC with three popular clustering methods, including K-means clustering, CellTree and Seurat, in both simulation studies and real data applications. K-means is one of the most popular clustering methods and has been used in the first 10X genomics publication (Zheng, et al., 2017). CellTree has been recently developed to cluster scRNA-Seq data based on Latent Dirichlet Allocation (LDA) (duVerle, et al., 2016). Seurat is a deterministic approach which relies on a graph-based clustering approach (Satija, et al., 2015).
2 Methods
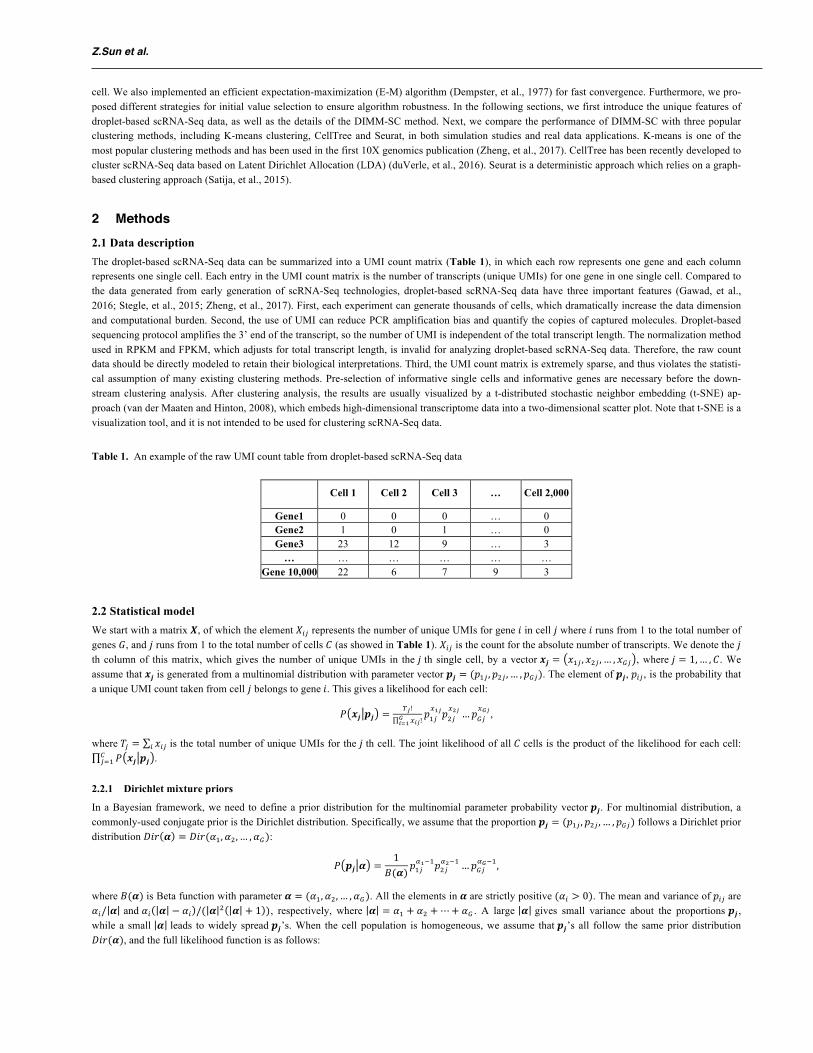
2.1 Data description The droplet-based scRNA-Seq data can be summarized into a UMI count matrix (Table 1), in which each row represents one gene and each column represents one single cell. Each entry in the UMI count matrix is the number of transcripts (unique UMIs) for one gene in one single cell. Compared to the data generated from early generation of scRNA-Seq technologies, droplet-based scRNA-Seq data have three important features (Gawad, et al., 2016; Stegle, et al., 2015; Zheng, et al., 2017). First, each experiment can generate thousands of cells, which dramatically increase the data dimension and computational burden. Second, the use of UMI can reduce PCR amplification bias and quantify the copies of captured molecules. Droplet-based sequencing protocol amplifies the 3’ end of the transcript, so the number of UMI is independent of the total transcript length. The normalization method used in RPKM and FPKM, which adjusts for total transcript length, is invalid for analyzing droplet-based scRNA-Seq data. Therefore, the raw count data should be directly modeled to retain their biological interpretations. Third, the UMI count matrix is extremely sparse, and thus violates the statisti-cal assumption of many existing clustering methods. Pre-selection of informative single cells and informative genes are necessary before the down-stream clustering analysis. After clustering analysis, the results are usually visualized by a t-distributed stochastic neighbor embedding (t-SNE) ap-proach (van der Maaten and Hinton, 2008), which embeds high-dimensional transcriptome data into a two-dimensional scatter plot. Note that t-SNE is a visualization tool, and it is not intended to be used for clustering scRNA-Seq data.
Table 1. An example of the raw UMI count table from droplet-based scRNA-Seq data
Cell 1 Cell 2 Cell 3 … Cell 2,000
Gene1 0 0 0 … 0 Gene2 1 0 1 … 0 Gene3 23 12 9 … 3
… … … … … … Gene 10,000 22 6 7 9 3
2.2 Statistical model We start with a matrix 𝑿, of which the element 𝑋#$ represents the number of unique UMIs for gene 𝑖 in cell 𝑗 where 𝑖 runs from 1 to the total number of genes 𝐺, and 𝑗 runs from 1 to the total number of cells 𝐶 (as showed in Table 1). 𝑋#$ is the count for the absolute number of transcripts. We denote the 𝑗 th column of this matrix, which gives the number of unique UMIs in the 𝑗 th single cell, by a vector 𝒙𝒋 = 𝑥-$, 𝑥/$, … , 𝑥1$ , where 𝑗 = 1, … , 𝐶. We assume that 𝒙𝒋 is generated from a multinomial distribution with parameter vector 𝒑𝒋 = (𝑝-$, 𝑝/$, … , 𝑝1$). The element of 𝒑𝒋, 𝑝#$ , is the probability that a unique UMI count taken from cell 𝑗 belongs to gene𝑖. This gives a likelihood for each cell:
𝑃 𝒙𝒋 𝒑𝒋 = 9:!
<=:!>=?@
𝑝-$<@:𝑝/$
<A: … 𝑝1$<>: ,
where 𝑇$ = 𝑥#$# is the total number of unique UMIs for the 𝑗 th cell. The joint likelihood of all 𝐶 cells is the product of the likelihood for each cell: 𝑃 𝒙𝒋 𝒑𝒋C
$D- .
2.2.1 Dirichlet mixture priors
In a Bayesian framework, we need to define a prior distribution for the multinomial parameter probability vector 𝒑𝒋. For multinomial distribution, a commonly-used conjugate prior is the Dirichlet distribution. Specifically, we assume that the proportion 𝒑𝒋 = (𝑝-$, 𝑝/$, … , 𝑝1$) follows a Dirichlet prior distribution 𝐷𝑖𝑟 𝜶 = 𝐷𝑖𝑟(𝛼-, 𝛼/, … , 𝛼1):
𝑃 𝒑𝒋 𝜶 =1
𝐵(𝜶)𝑝-$J@K-𝑝/$
JAK- … 𝑝1$J>K-,
where 𝐵(𝜶) is Beta function with parameter 𝜶 = (𝛼-, 𝛼/, … , 𝛼1). All the elements in 𝜶 are strictly positive (𝛼# > 0). The mean and variance of 𝑝#$ are 𝛼#/ 𝜶 and𝛼# 𝜶 − 𝛼# /( 𝜶 / 𝜶 + 1 ), respectively, where 𝜶 = 𝛼- + 𝛼/ + ⋯+ 𝛼1 . A large 𝜶 gives small variance about the proportions 𝒑𝒋 , while a small 𝜶 leads to widely spread 𝒑𝒋’s. When the cell population is homogeneous, we assume that 𝒑𝒋’s all follow the same prior distribution 𝐷𝑖𝑟(𝜶), and the full likelihood function is as follows:
Clustering droplet-based single cell transcriptomic data
𝑃 𝒙𝒋 𝜶) = 𝑃 𝒙𝒋 𝒑𝒋 𝑃 𝒑𝒋 𝜶 𝑑𝒑𝒋 =9:!<=:!>
=?@
S <=:TJ=S J=
1#D-
S 𝜶S 9:T 𝜶
.
We then assume that the cell population consists of 𝐾 distinct cell types, where 𝐾 can be pre-defined according to prior biological knowledge or can be estimated through model fitting. To provide a more flexible modeling framework and allow for unsupervised clustering, we extend the aforementioned single Dirichlet prior to a mixture of 𝐾 Dirichlet distributions, indexed with𝑘 = 1, … , 𝐾, each with parameter 𝜶(W). If cell 𝑗 belongs to the 𝑘 th cell type, its gene expression profile 𝒑𝒋 follows a cell-type-specific prior distribution 𝐷𝑖𝑟(𝜶(W)). The full likelihood function is then obtained by multiplying the Dirichlet mixture prior by the multinomial likelihood.
2.2.2 E-M algorithm for fitting the mixture of Dirichlet prior
We now use a latent variable vector 𝒁 with elements 𝑧$ to represent the cell type label for the cell 𝑗. This allows us to maximize the log posterior distri-bution using the E-M algorithm (Dempster, 1977). We have
𝑃 𝒙𝒋 𝑧$ = 𝑘, 𝜶(W)) ∝Γ 𝑥#$ + 𝛼#WΓ 𝛼#W
1
#D-
Γ 𝜶 W
Γ 𝑇$ + 𝜶 W,
and 𝑃 𝑧$ = 𝑘 = 𝜋W , where 𝜋W is the proportion of the 𝑘 th cell type among all cells. We can treat 𝑧$ as missing data, and use the E-M algorithm to estimate 𝛼-W, 𝛼/W, … , 𝛼1W and 𝜋W . The complete log likelihood is
log 𝑃(𝒙𝒋, 𝑧$ = 𝑘)C$D- = 𝐼(𝑧$ = 𝑘)C
$D- log S <=:TJ=aS J=a
1#D-
S(|𝜶(a)|)
S(9:T|𝜶(a)|).
The formula for updating 𝛼-W, 𝛼/W, … , 𝛼1W is derived from the Minka’s fixed-point iteration for the leaving-one-out likelihood (Minka, 2000):
𝛼#W(cT-) = 𝛼#W
(c) d:a <=:/(<=:K-TJ=a(e))f
:?@
d:a 9:/(9:K-T|𝜶 a(e) |)f
:?@.
We repeat the above steps until the convergence of log likelihood or a maximum number of iterations is reached (see detailed algorithm in supplemental materials).
2.2.3 Selection of the number of clusters and initial values
To implement DIMM-SC, it is critical to select the total number of clusters and the initial values for the E-M algorithm. Specially, the number of clus-ters 𝐾 can be defined with prior knowledge or can be selected from model selection criteria such as AIC or BIC (Akaike, 1974; Schwarz, 1978). Mean-while, there are many methods to determine the initial values of 𝛼-, 𝛼/, … , 𝛼1 in the E-M algorithm for fitting the Dirichlet mixture model. For example, Ronning (1989) suggests to estimate 𝛼#1
#D- by
log 𝛼#1#D- = -
1K-𝑙𝑜𝑔 k l= -Kk l=
mno l=− 11K-
#D- ,
where 𝐸(𝑝#) can be approximated by ( 𝑥#$/𝑇$)/𝐶C$D- ) (Ronning, 1989). An alternative approach is to estimate the initial values using a method of
moment estimates proposed by Weir and Hill (Weir and Hill, 2002). In this work, we applied K-means or ADPclust to get a preliminary clustering result, and then used either the Ronning’s method or the Weir and Hill’s method to estimate initial values of 𝜶.
2.3 Simulation studies We performed comprehensive simulation studies to compare DIMM-SC with three existing clustering methods, including K-means clustering, Seurat and CellTree. The first two are deterministic approaches and the third one is a probabilistic approach.
In the simulation set-up, the UMI count matrix was sampled from the proposed Dirichlet mixture model. Specially, for a fixed total number of cell clusters 𝐾 , we first pre-defined the values of 𝜶(𝒌) = 𝛼-(W), 𝛼/(W), … , 𝛼1(W) for the 𝑘 th cell cluster, and then sampled the proportion 𝒑𝒋 =(𝑝-$, 𝑝/$, … , 𝑝1$) from a Dirichlet distribution 𝐷𝑖𝑟 𝜶(𝒌) . Next, we sampled the UMI count vector 𝒙𝒋 for the 𝑗 th cell from the multinomial distribution 𝑀𝑢𝑙𝑡𝑖𝑛𝑜𝑚𝑖𝑎𝑙(𝑇$, 𝒑𝒋). We fixed 𝑇$ as a constant across all cells.
In the simulation studies, we considered the following seven clustering methods. (1) DIMM-SC + K-means + Ronning (hereafter referred as DIMM-SC-KR), in which we used the K-means clustering to obtain the initial values of clustering labels and then used the Ronning’s method to estimate initial values of 𝜶; (2) DIMM-SC + K-means + Weir (hereafter referred as DIMM-SC-KW), in which we used the K-means clustering to obtain the initial values of clustering labels and used the Weir and Hill’s method to estimate initial values of 𝜶; (3) DIMM-SC + random + Ronning (hereafter referred as DIMM-SC-RR), in which we randomly selected the initial values of clustering labels and used the Ronning’s method to estimate initial values of 𝜶; (4) DIMM-SC + random + Weir (hereafter referred as DIMM-SC-RW), in which we randomly selected the initial values of clustering labels and used the Weir and Hill’s method to estimate initial values of 𝜶; (5) K-meaning clustering; (6) CellTree, a LDA-based approach to cluster scRNA-Seq data; and (7) Seurat. To perform the simulation analysis using Seurat, we followed the tutorial instructions from the Seurat website and used all genes as input to perform Principal Component Analysis (PCA). After that, we followed the “jackstraw” procedure implemented in Seurat, and identified first ten PCs for their downstream algorithm. We fixed the number of PCs in all the simulation runs under each scenario. Since Seurat requires users to self-specify a resolution parameter with increased values leading to a greater number of clusters, the clustering results are very sensitive to this resolution parameter.

Z.Sun et al.
Seurat suggests that setting this resolution parameter between 0.6-1.2 typically returns good results for datasets of around 3,000 cells, so we ran Seurat using resolution parameter with 0.6, 0.8, 1.0 and 1.2, and chose the one with the highest ARI value in each simulation setting.
We used the signal-to-noise ratio (SNR) to measure the magnitude of difference among different cell clusters. When 𝐾 = 2, SNR is defined as:
𝑆𝑁𝑅 =𝜶(@)K𝜶(A) @
1 |no 𝜶(@) Tmno(𝜶(A)),
where |.|1 is the L1 norm of a vector. We performed comprehensive simulations to investigate how different SNRs, different sequencing depths, different total numbers of cells/genes/clusters, and different proportions of noisy genes affect the clustering results. To evaluate the performance of DIMM-SC and other competing clustering methods, we used the following two metrics: (1) clustering accuracy measured by the adjusted rand index (ARI) (Rand, 1971), which is a metric of the similarity between the estimated clustering labels and the true clustering labels and (2) Stability (the standard deviation of ARI). We expect a good clustering method should achieve both high accuracy and high stability.
3 Results
3.1 Simulation studies Figure 1A shows the boxplots of ARI for seven clustering methods across 100 simulations at different SNRs. Four DIMM-SC based methods (KR, KW, RR, RW) achieved comparable performance, which produced higher accuracy and lower variability than K-means clustering, Seurat and CellTree. When SNR is high (i.e., substantial differences among cell clusters), all seven methods performed well. However, when SNR is low (i.e., different cell clusters are similar), K-means clustering, Seurat and CellTree produced less accurate and more variable clustering results, while four DIMM-SC based methods still performed well.
Figure 1B shows the boxplots of ARI for seven clustering methods across 100 simulations, when the total number of clusters is 2, 3 and 4, respec-tively. The four DIMM-SC based methods, especially the two methods with randomly selected initial cluster labels (RR and RW), achieved better clus-tering accuracy (i.e., higher ARI) with more number of clusters. K-means clustering has high variability for more clusters, since it is a deterministic procedure and is more likely to end at a local optimum when the total number of clusters increases. CellTree performed worse for more clusters, partial-ly due to the over-parameterized LDA model and lack of fit to highly heterogeneous data. Seurat was run under different default recommended parame-ters and the performance varies with different parameters.
Figure 1C~F list the boxplots of ARI for seven clustering methods across 100 simulations, for different number of genes (Figure 1C), different number of cells (Figure 1D), different sequencing depths (Figure 1E) and different number of informative genes (Figure 1F) (i.e., differentially ex-pressed genes among clusters), respectively. Consistent across all these four scenarios, more information (i.e., more genes, more cells, higher sequenc-ing depths and more informative genes) lead to higher clustering accuracy and lower clustering variability. Four DIMM-SC based clustering methods consistently outperformed K-means clustering, Seurat and CellTree in all these simulation settings, suggesting the advantage of DIMM-SC.
3.2 Real data analysis: the publicly available 10X scRNA-Seq data
3.2.1 In silicon studies based on purified cell types from published scRNA-Seq data
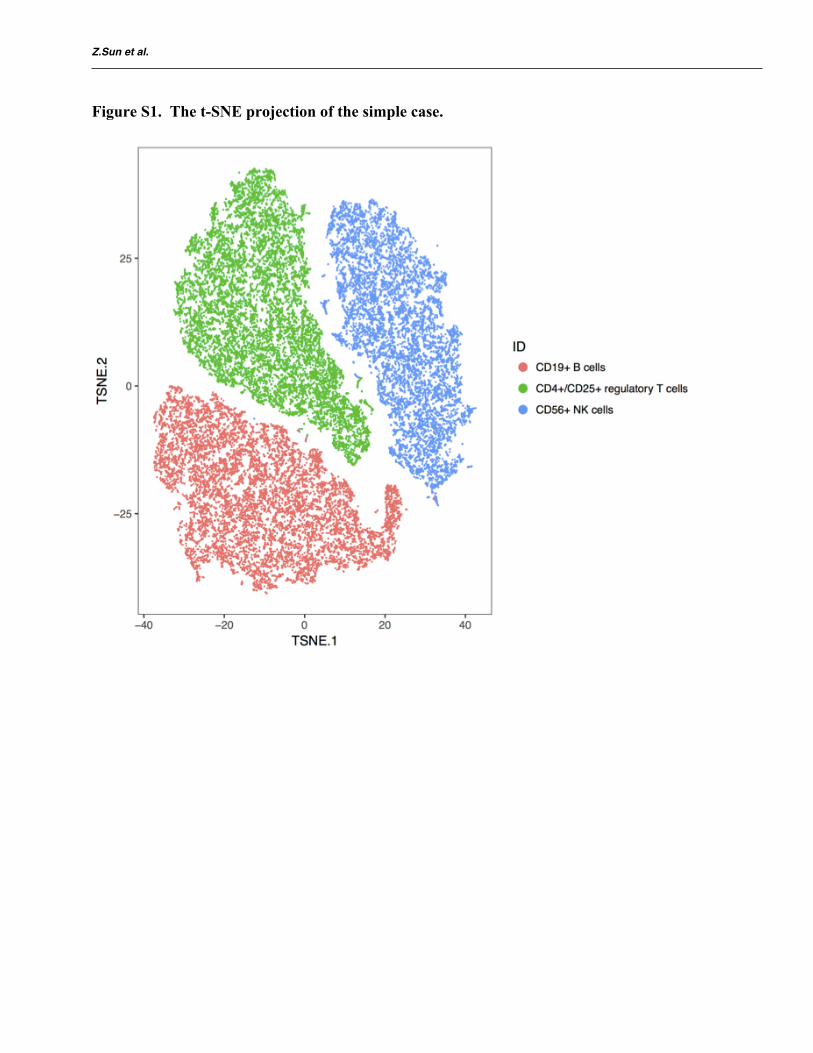
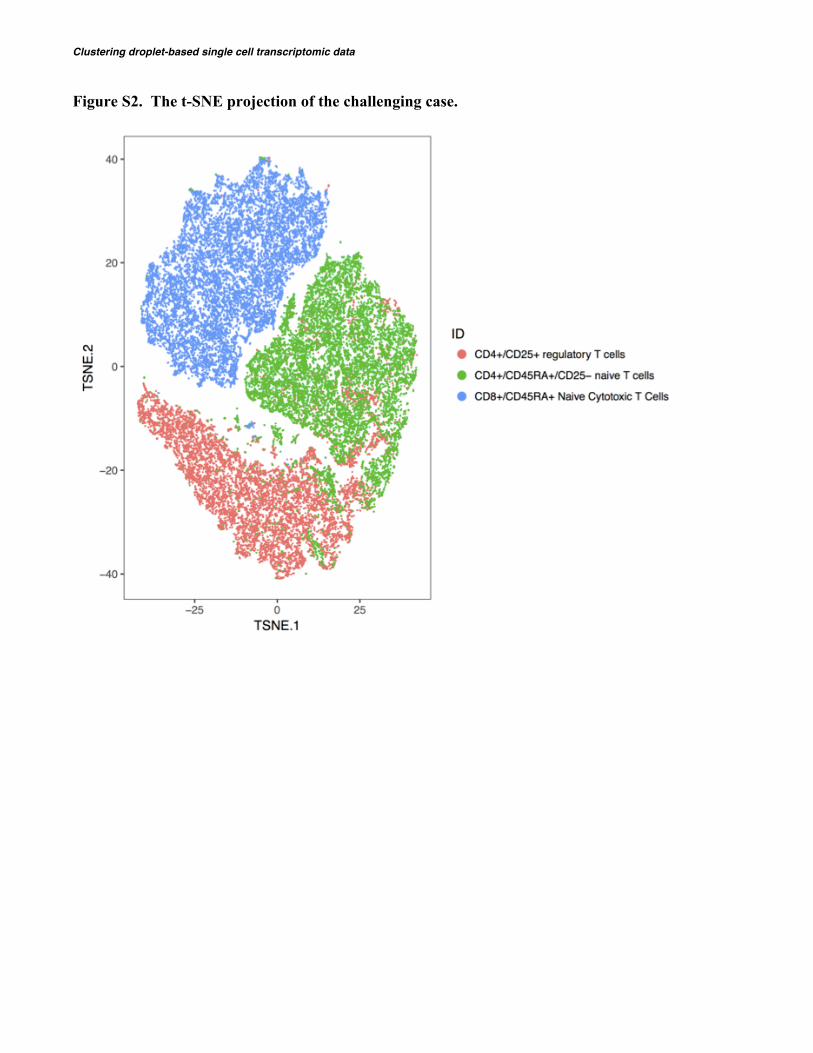
To illustrate the application of DIMM-SC to real datasets, we first benchmarked our method against pre-defined measures in capturing true cell-to-cell similarities on published single-cell datasets. 10X Genomics has made eleven datasets from purified cell types available to public (Zheng, et al., 2017). Among which, over 10,000 cells were detected in most experiments. Here we considered two scenarios: (1) a simple case with cells from three highly distinct cell types (CD56+ NK cells, CD19+ B cells, and CD4+/CD25+ regulatory T cells); (2) a challenging case with cells from three similar cell types (CD8+/CD45RA+ naive cytotoxic T cells, CD4+/CD25+ regulatory T cells, and CD4+/CD45RA+/CD25- naive T cells) (Table 2). For visualiza-tion, we used the t-SNE algorithm to project the data into a two-dimensional space so that certain hidden structures in the data can be depicted intuitive-ly (see the t-SNE visualization in Figure S1 and Figure S2).
We ran DIMM-SC, K-means clustering, CellTree and Seurat 50 times for both two scenarios. In the simple case, at each time, we randomly selected 1,000 CD56+ NK cells, 2,000 CD19+ B cells and 3,000 CD4+/CD25+ regulatory T cells from the 10X Genomics datasets, and combined them togeth-er. Thus the total number of cells for clustering is 6,000. Similarly, in the challenging case, 1,000 CD8+/CD45RA+ naive cytotoxic T cells, 2,000 CD4+/CD25+ regulatory T cells and 3,000 CD4+/CD45RA+/CD25- naive T cells were randomly selected at each time.
Cell types in each dataset were known as a priori and were further validated in the respective follow-up studies, providing a reliable gold standard to benchmark the clustering performance for each method. We compared the performance of four DIMM-SC methods with K-means clustering, CellTree and Seurat, in terms of clustering accuracy and stability.
In the simple case, we applied all these seven clustering methods on the top 100 variable genes ranked by their standard error among all cells. Table 3 shows that all methods provided good clustering results. Two DIMM-SC methods with randomly selected initial cluster labels (RR and RW) slightly outperformed K-means clustering in terms of accuracy and variability. For the challenging case, unlike what we did in the simple case, we chose differ-ent numbers of top variable genes. Table 3 and Figure S3 show that the ARIs of CellTree and Seurat were lower than other methods when the total number of genes used for clustering was greater than 200. DIMM-SC outperformed K-means clustering in terms of accuracy. K-means clustering made a great leap forward when the total number of genes increased to 300. However, there is no further improvement of ARI with K-means clustering when top 500 or more variable genes were used. Since in the challenging case, CD4+/CD25+ regulatory T cells and CD4+/CD45RA+/CD25- naive T cells were similar to each other, more and more noisy genes were included in the analysis when we increased the total number of genes, which undermined
Clustering droplet-based single cell transcriptomic data
the performance of K-means clustering. Note that K-means clustering and Seurat were only able to provide a deterministic clustering label, while DIMM-SC and CellTree can additionally provide the probability that each cell belongs to each cluster.
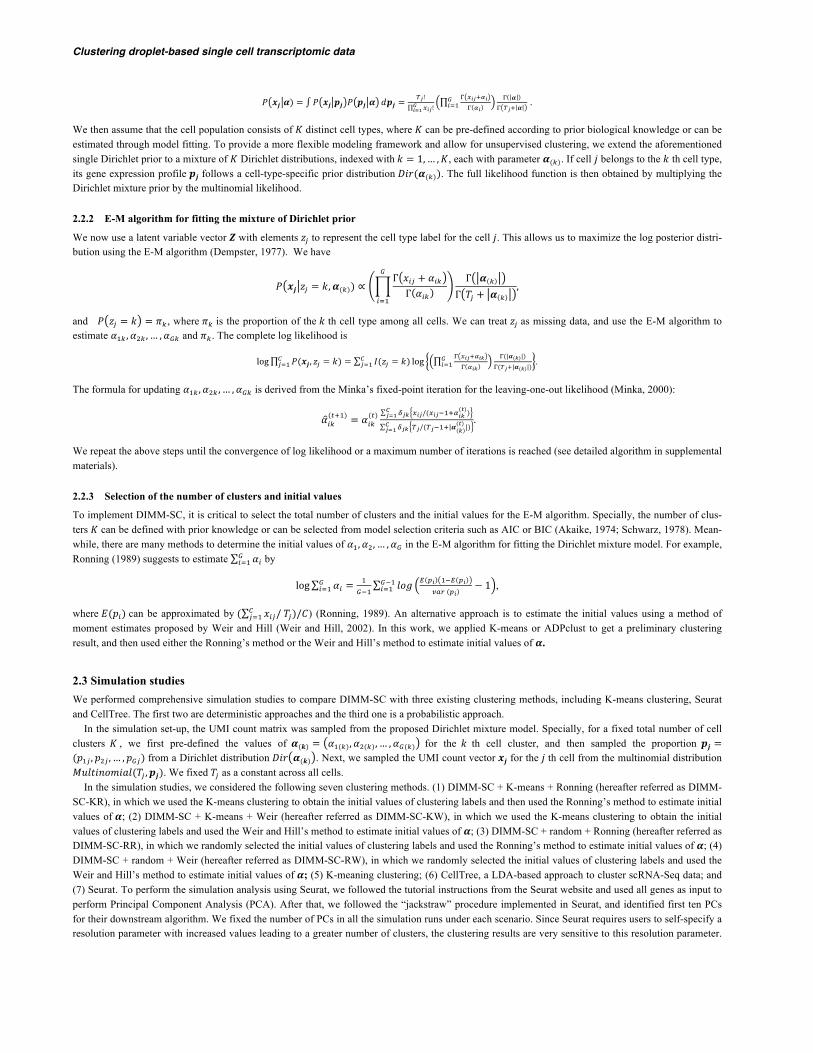
Table 2. Total number of cells, genes and validated populations for two scenarios, for in silicon studies based on purified cell types from 10X Ge-nomics.
Scenario #Genes #Cell Cell type
Simple
32,738
8,385 CD56+ NK cells 10,085 CD19+ B cells 10,283 CD4+/CD25+ regulatory T cells
Challenging
32,738
11,953 CD8+/CD45RA+ naive cytotoxic T cells 10,263 CD4+/CD25+ regulatory T cells 10,479 CD4+/CD45RA+/CD25- naive T cells
Table 3. Performance of clustering in the simple case and the challenging case
#Genes DIMM-SC-KR DIMM-SC-KW DIMM-SC-RR DIMM-SC-RW K-means clustering CellTree Seurat
The simple case 100 0.952 (0.114) 0.951 (0.118) 0.982 (0.052) 0.990 (0.002) 0.951 (0.129) 0.983 (0.002) 0.983 (0.003)
The challenging case 100 0.351 (0.140) 0.357 (0.140) 0.368 (0.140) 0.408 (0.128) 0.182 (0.012) 0.278 (0.018) 0.395 (0.027) 200 0.558 (0.014) 0.559 (0.014) 0.558 (0.014) 0.559 (0.013) 0.283 (0.050) 0.389 (0.022) 0.410 (0.017) 300 0.563 (0.013) 0.564 (0.013) 0.563 (0.013) 0.563 (0.013) 0.526 (0.063) 0.419 (0.023) 0.413 (0.022) 400 0.571 (0.014) 0.571 (0.014) 0.566 (0.040) 0.571 (0.014) 0.554 (0.014) 0.404 (0.050) 0.429 (0.012) 500 0.572 (0.015) 0.572 (0.015) 0.572 (0.015) 0.572 (0.015) 0.559 (0.014) 0.397 (0.067) 0.435 (0.011) 800 0.562 (0.041) 0.562 (0.041) 0.557 (0.057) 0.556 (0.056) 0.557 (0.041) 0.365 (0.078) 0.445 (0.011)
Fig. 1. Boxplots of ARI for seven clustering methods across 100 simulations, investigating how different SNRs (A), number of clusters (B), number of genes (C), number of cells (D), sequencing depth (E) and the number of informative genes (F) affect clustering results.
1E 1F
1A 1B 1C
1E 1D 1F

3.2.2 Real data analysis on the PMBC 68K dataset
To examine how DIMM-SC is applicable to large-scale dataset, we applied DIMM-SC-KR on the PBMC 68K dataset, which consists of >68,000 single cells. Among all 32,738 genes, we selected the top 1,000 genes with the highest variations. Figure 2A shows a clear separation of cell types as we expected. 11 purified sub-populations of PBMCs were used as the reference to identify the cell type of each single cell from the PBMC 68K dataset. We used the labels from cell classification analysis as the approximated truth. In this analysis, each cell was assigned to the purified population which has the highest correlation with its gene expression profile. We calculated ARIs between the true labels and inferred ones obtained from K-means cluster-ing, CellTree, Seurat and DIMM-SC. The ARIs of K-means clustering, CellTree and DIMM-SC are 0.32, 0.28 and 0.41, respectively. To perform the analysis using Seurat, we used the default setting of Seurat to select the top 1,657 variable genes, and picked the first 22 PCs for the clustering analysis. The ARI of Seurat is 0.31, suggesting that DIMM-SC performed the best in the PMBC 68K dataset. Additionally, we highlighted vague cells in the t-SNE projection (Figure 2B), where vague cells are defined as cells with the largest posterior cluster-specific probability < 0.95. As shown in Figure 2B, most of vague cells are located at the boundary of different clusters, which reassuring the validity of the clustering results.
3.2.3 Analysis of the in-house scRNA-Seq data from systemic sclerosis study
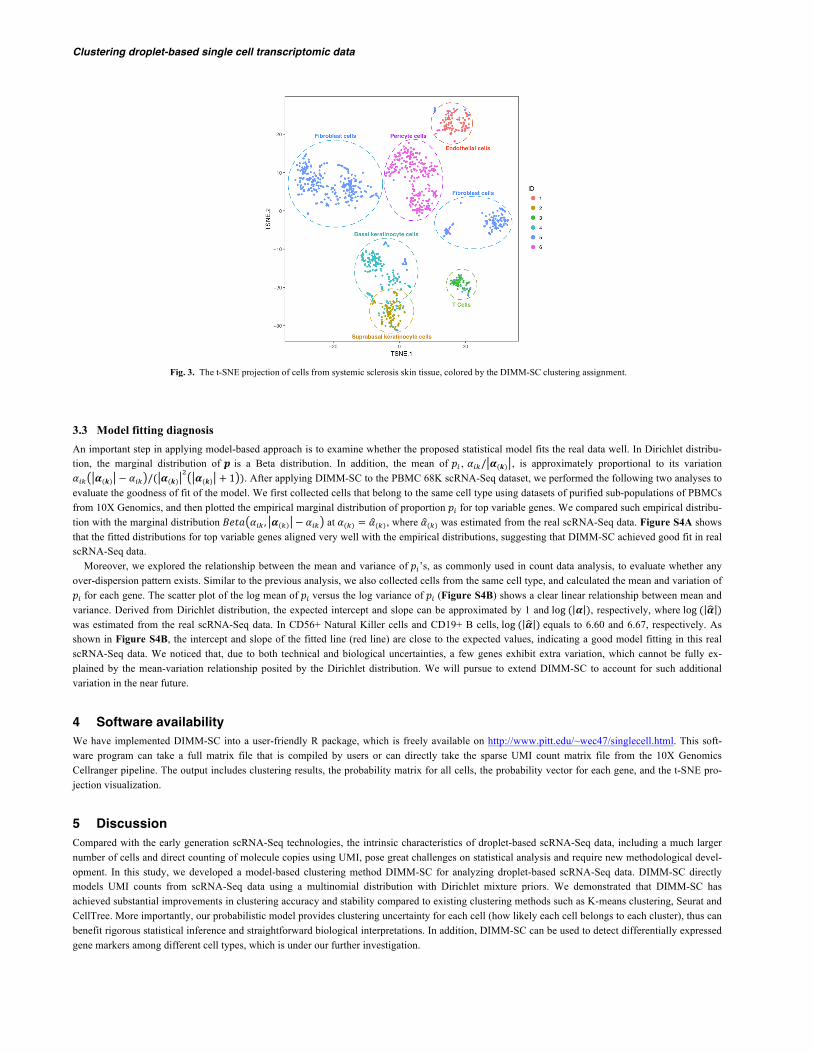
Collaborating with investigators at the University of Pittsburgh, we are in the first place to use the 10X Chromium system to generate scRNA-Seq data in order to study systemic sclerosis. We applied DIMM-SC to the scRNA-Seq data of skin tissue collected from a systemic sclerosis patient. Starting from a UMI count matrix for 1,180 cells generated by the 10X genomics Cellranger pipeline, we first removed cells that had less than 300 genes ex-pressed and filtered noisy genes that were expressed in less than five cells, then we extracted the top 1,000 highly variable genes based on their standard deviations. We set the total number of clusters to be six based on our prior knowledge and utilized the KR method to generate the initial cluster labels and the initial values for the parameter 𝜶. The six cell clusters from DIMM-SC included 92, 89, 45, 156, 469 and 271 cells, respectively. Figure 3 shows the t-SNE projection of the skin cells, colored by cluster labels inferred by DIMM-SC, and the dashed circles represent potential subtypes of skin cells according to the expressions of cell type specific markers. It is interesting that fibroblast cells exhibit two clusters, suggesting possible subtypes. For each cell cluster, we identified top marker genes that were differentially expressed between the specified cluster and all the other clusters. We rec-ognized some subtypes of skin cells for the identified clusters based on the biological knowledge of cell specific markers, such as pericyte cells specifi-cally expressed gene RGS5, T cells specifically expressed gene IL32, endothelial cells specifically expressed gene VWF, fibroblast cells specifically expressed gene COL1A1, basal keratinocyte cells specifically expressed gene KRT14 and gene KRT5, and suprabasal keratinocyte cells specifically expressed gene KRT1 and gene KRT10.
Fig. 2. The t-SNE projection of 68K PBMCs, colored by the DIMM-SC clustering assignment and the illustration of vague cells with the largest posterior probability < 0.95
2A 2B
Clustering droplet-based single cell transcriptomic data
3.3 Model fitting diagnosis An important step in applying model-based approach is to examine whether the proposed statistical model fits the real data well. In Dirichlet distribu-tion, the marginal distribution of 𝒑 is a Beta distribution. In addition, the mean of 𝑝# , 𝛼#W/ 𝜶(𝒌) , is approximately proportional to its variation 𝛼#W 𝜶(𝒌) − 𝛼#W /( 𝜶(𝒌)
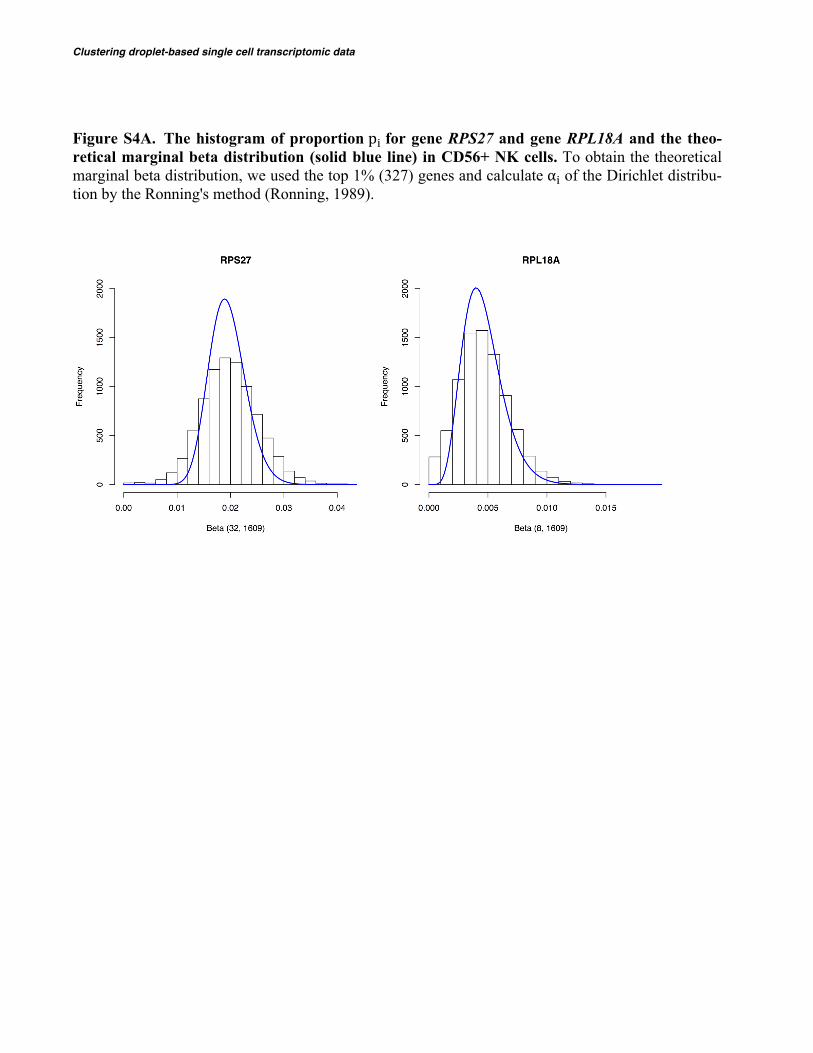
/ 𝜶(𝒌) + 1 ). After applying DIMM-SC to the PBMC 68K scRNA-Seq dataset, we performed the following two analyses to evaluate the goodness of fit of the model. We first collected cells that belong to the same cell type using datasets of purified sub-populations of PBMCs from 10X Genomics, and then plotted the empirical marginal distribution of proportion 𝑝# for top variable genes. We compared such empirical distribu-tion with the marginal distribution 𝐵𝑒𝑡𝑎 𝛼#W, 𝜶 W − 𝛼#W at 𝛼(W) = 𝛼(W), where 𝛼(W) was estimated from the real scRNA-Seq data. Figure S4A shows that the fitted distributions for top variable genes aligned very well with the empirical distributions, suggesting that DIMM-SC achieved good fit in real scRNA-Seq data.
Moreover, we explored the relationship between the mean and variance of 𝑝#’s, as commonly used in count data analysis, to evaluate whether any over-dispersion pattern exists. Similar to the previous analysis, we also collected cells from the same cell type, and calculated the mean and variation of 𝑝# for each gene. The scatter plot of the log mean of 𝑝# versus the log variance of 𝑝# (Figure S4B) shows a clear linear relationship between mean and variance. Derived from Dirichlet distribution, the expected intercept and slope can be approximated by 1 and log( 𝜶 ), respectively, where log( 𝜶 ) was estimated from the real scRNA-Seq data. In CD56+ Natural Killer cells and CD19+ B cells, log( 𝜶 ) equals to 6.60 and 6.67, respectively. As shown in Figure S4B, the intercept and slope of the fitted line (red line) are close to the expected values, indicating a good model fitting in this real scRNA-Seq data. We noticed that, due to both technical and biological uncertainties, a few genes exhibit extra variation, which cannot be fully ex-plained by the mean-variation relationship posited by the Dirichlet distribution. We will pursue to extend DIMM-SC to account for such additional variation in the near future.
4 Software availability We have implemented DIMM-SC into a user-friendly R package, which is freely available on http://www.pitt.edu/~wec47/singlecell.html. This soft-ware program can take a full matrix file that is compiled by users or can directly take the sparse UMI count matrix file from the 10X Genomics Cellranger pipeline. The output includes clustering results, the probability matrix for all cells, the probability vector for each gene, and the t-SNE pro-jection visualization.
5 Discussion Compared with the early generation scRNA-Seq technologies, the intrinsic characteristics of droplet-based scRNA-Seq data, including a much larger number of cells and direct counting of molecule copies using UMI, pose great challenges on statistical analysis and require new methodological devel-opment. In this study, we developed a model-based clustering method DIMM-SC for analyzing droplet-based scRNA-Seq data. DIMM-SC directly models UMI counts from scRNA-Seq data using a multinomial distribution with Dirichlet mixture priors. We demonstrated that DIMM-SC has achieved substantial improvements in clustering accuracy and stability compared to existing clustering methods such as K-means clustering, Seurat and CellTree. More importantly, our probabilistic model provides clustering uncertainty for each cell (how likely each cell belongs to each cluster), thus can benefit rigorous statistical inference and straightforward biological interpretations. In addition, DIMM-SC can be used to detect differentially expressed gene markers among different cell types, which is under our further investigation.
Fig. 3. The t-SNE projection of cells from systemic sclerosis skin tissue, colored by the DIMM-SC clustering assignment.
Z.Sun et al.
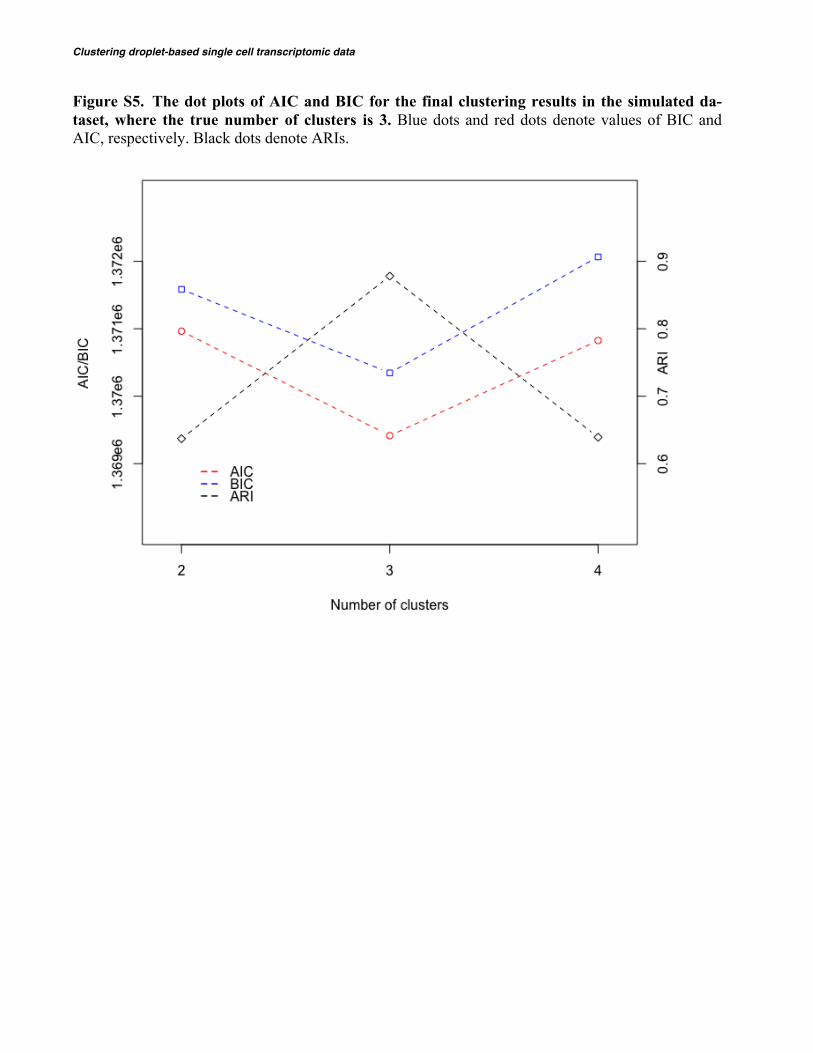
Our probabilistic model coupled with a computationally efficient EM algorithm is able to cluster large-scale droplet-based scRNA-Seq data. For ex-ample, it takes around 3 hours to cluster 68,000 cells using top 1,000 highly variable genes. In the analysis of scRNA-Seq data, both gene level filtering and cell level filtering are critical for clustering regardless of which clustering method to use. We recommend to rank genes by their variations among all cells and choose top 500-1,000 highly variable genes. In addition, we also recommend to run DIMM-SC 5~10 times, each with different random seeds, and choose the one with the largest likelihood as the final results. For the number of clusters, we can pre-define it based on prior knowledge on the tissue or determine it using some model checking criteria such as AIC or BIC (Akaike, 1974; Schwarz, 1978). As shown in Figure S5, AIC and BIC work well in the analysis of simulated datasets, the performance in real data needs further exploration. Alternatively, it can be determined using the procedure described in ADPcluster (Wang and Xu, 2015) or the Dirichlet process (Teh, 2011). DIMM-SC is currently implemented in R with satisfac-tory computing efficiency for most needs so far. We will further speed it up using a C++/Rcpp implementation to accommodate larger-scaled data.
There are several noticeable limitations of our method. First, DIMM-SC only models variations among different cells from one single individual. To jointly model scRNA-Seq data from multiple individuals, a hierarchical structure can be posed in the current method to account for the individual level heterogeneity, but a more sophisticated numerical algorithm will be needed to reduce the computational cost. Second, DIMM-SC is an unsupervised method that infers structures from all data. Prior knowledge on cell-type-specific biomarkers may further improve the clustering accuracy. To use such prior information, a semi-supervised approach is needed to guide cluster inference. Furthermore, existing scRNA-Seq data from purified cells (e.g. via flow cytometry) can serve as external reference panels or training datasets to reduce experimental biases, remove outliers, and improve clustering relia-bility. Last but not least, our DIMM-SC model ignores the measurement errors and uncertainties buried in the UMI count matrix. Multiple factors such as drop-out event, mapping percentage, sequencing depth, and PCR efficiency are not considered in the current model. These limitations can be largely overcome by extending our method. We will explore these directions in the near future.
We noticed that similar models have been proposed in the field of text-mining (Yamamoto and Sadamitsu, 2005) and microbiome (Holmes, et al., 2012), where word, article, and topic or taxa, individual, and meta-community are studied. However, in those applications, the clusters are not well defined and require a careful interpretation. On the contrary, scRNA-Seq data usually consist of a set of known cell types from prior knowledge and have a much larger signal-to-noise ratio for the clustering analysis. Although sharing the common types of data structure, these fields have different fundamental questions, so existing methods proposed from other fields need to be tailored or extended to incorporate intrinsic characteristics of scRNA-Seq data. For example, CellTree adapts the LDA approach from the text-mining field. Although LDA is more flexible and more widely used in text-mining field than the Dirichlet mixture model based methods, we have showed that DIMM-SC is more accurate, stable and efficient than CellTree in both simulation studies and real data applications in the context of scRNA-Seq clustering analysis.
In summary, we provide a novel statistical method and an efficient computational tool DIMM-SC for clustering droplet-based single cell tran-scriptomic data, which facilitates rigorous statistical inference of cell population heterogeneity. We are confident that DIMM-SC will be highly useful for the fast-growing community of large-scale single cell transcriptome analysis.
Acknowledgements The authors would like to thank Dr. Zhiguang Huo and Dr. Kong Chen for providing valuable insights during the initial stage of this project.
Funding This work is supported by National Institute of Health grants R01HG007358 (W.C.), Children’s Hospital of Pittsburgh (W.C. and Z.S.), U54DK107977 (M.H.), and the National Science Foundation of China Grant 11401338 (K.D.). Conflict of Interest: none declared.
References Akaike, H. (1974) New Look at Statistical-Model Identification, Ieee T Automat Contr, Ac19, 716-723. Dempster, A.P., Laird, N.M. and Rubin, D.B. (1977) Maximum likelihood from incomplete data via the EM algorithm, Journal of the royal statistical society. Series B
(methodological), 1-38. duVerle, D.A., et al. (2016) CellTree: an R/bioconductor package to infer the hierarchical structure of cell populations from single-cell RNA-seq data, BMC Bioinformatics,
17, 363. Gawad, C., Koh, W. and Quake, S.R. (2016) Single-cell genome sequencing: current state of the science, Nat Rev Genet, 17, 175-188. Holmes, I., Harris, K. and Quince, C. (2012) Dirichlet multinomial mixtures: generative models for microbial metagenomics, PLoS One, 7, e30126. Islam, S., et al. (2014) Quantitative single-cell RNA-seq with unique molecular identifiers, Nat Methods, 11, 163-166. Jaitin, D.A., et al. (2014) Massively parallel single-cell RNA-seq for marker-free decomposition of tissues into cell types, Science, 343, 776-779. Kivioja, T., et al. (2012) Counting absolute numbers of molecules using unique molecular identifiers, Nat Methods, 9, 72-74. Macosko, E.Z., et al. (2015) Highly Parallel Genome-wide Expression Profiling of Individual Cells Using Nanoliter Droplets, Cell, 161, 1202-1214. Minka, T. (2000) Estimating a Dirichlet distribution, https://tminka.github.io/papers /dirichlet/minka-dirichlet.pdf Rand, W.M. (1971) Objective criteria for the evaluation of clustering methods, Journal of the American Statistical Association, 66, 846-850. Rodriguez, A. and Laio, A. (2014) Machine learning. Clustering by fast search and find of density peaks, Science, 344, 1492-1496. Ronning, G. (1989) Maximum-likelihood estimation of dirichlet distributions, Journal of Statistical Computation and Simulation, 32, 215-221. Satija, R., Farrell, J.A. and Gennert, D. (2015) Spatial reconstruction of single-cell gene expression data, Nature biotechnology, 33, 495-502. Schwarz, G. (1978) Estimating the dimension of a model, The annals of statistics, 6, 461-464. Stegle, O., Teichmann, S.A. and Marioni, J.C. (2015) Computational and analytical challenges in single-cell transcriptomics, Nat Rev Genet, 16, 133-145. Teh, Y.W. (2011) Dirichlet process, Encyclopedia of machine learning, Springer US, 280-287. van der Maaten, L. and Hinton, G. (2008) Visualizing Data using t-SNE, J Mach Learn Res, 9, 2579-2605.

Clustering droplet-based single cell transcriptomic data
Wang, X.F. and Xu, Y. (2015) Fast clustering using adaptive density peak detection, Stat Methods Med Res. Weir, B.S. and Hill, W.G. (2002) Estimating F-statistics, Annual review of genetics, 36, 721-750. Yamamoto, M. and Sadamitsu, K. (2005) Dirichlet mixtures in text modeling, CS Technical report CS-TR-05-1, University of Tsukuba. Zheng, G., et al. (2016) Massively parallel digital transcriptional profiling of single cells, bioRxiv. Zheng, G.X., et al. (2017) Massively parallel digital transcriptional profiling of single cells, Nat Commun, 8, 14049.
Z.Sun et al.
Supplemental materials
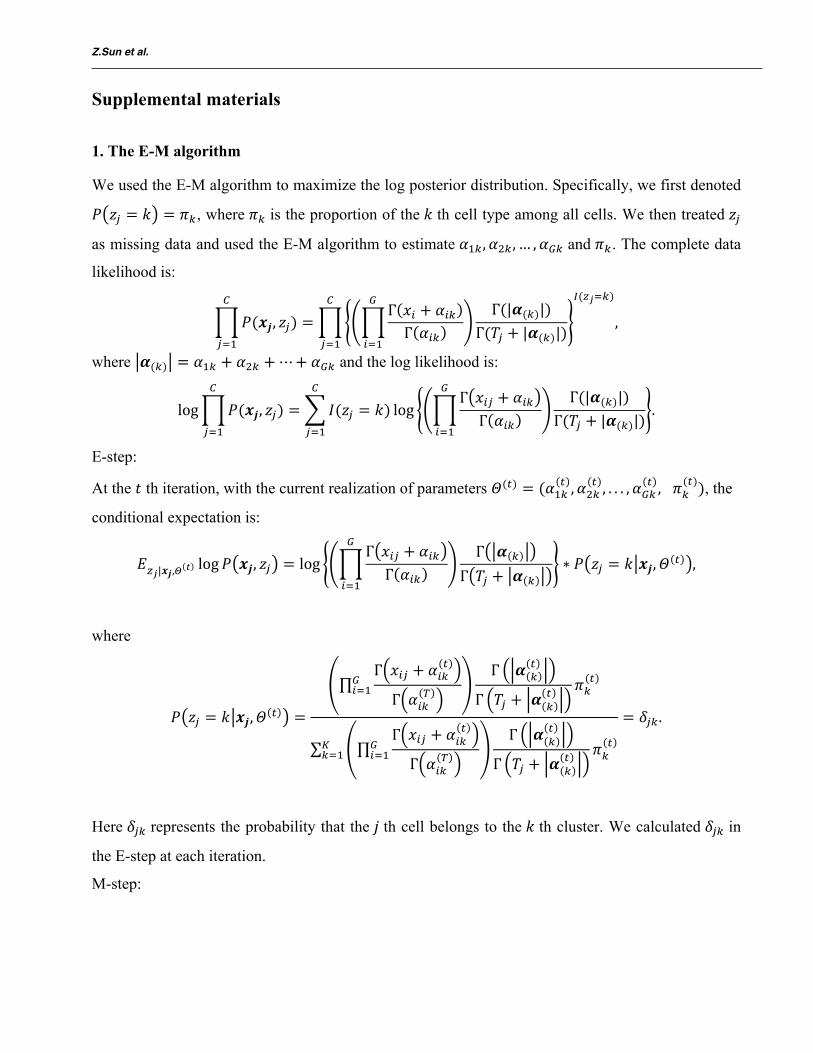
1. The E-M algorithm We used the E-M algorithm to maximize the log posterior distribution. Specifically, we first denoted
𝑃 𝑧$ = 𝑘 = 𝜋W, where 𝜋W is the proportion of the 𝑘 th cell type among all cells. We then treated 𝑧$
as missing data and used the E-M algorithm to estimate 𝛼-W, 𝛼/W, … , 𝛼1W and 𝜋W. The complete data
likelihood is:
𝑃(𝒙𝒋, 𝑧$)C
$D-
=Γ 𝑥# + 𝛼#WΓ 𝛼#W
1
#D-
Γ(|𝜶(W)|)Γ(𝑇$ + |𝜶(W)|)
C
$D-
~(�:DW)
,
where 𝜶(W) = 𝛼-W + 𝛼/W + ⋯+ 𝛼1W and the log likelihood is:
log 𝑃(𝒙𝒋, 𝑧$)C
$D-
= 𝐼(𝑧$ = 𝑘)C
$D-
logΓ 𝑥#$ + 𝛼#WΓ 𝛼#W
1
#D-
Γ(|𝜶(W)|)Γ(𝑇$ + |𝜶(W)|)
.
E-step:
At the 𝑡 th iteration, with the current realization of parameters 𝛩(c) = (𝛼-Wc , 𝛼/W
c , . . . , 𝛼1Wc , 𝜋W
(c)), the
conditional expectation is:
𝐸�:|𝒙𝒋,� e log 𝑃 𝒙𝒋, 𝑧$ = logΓ 𝑥#$ + 𝛼#WΓ 𝛼#W
1
#D-
Γ 𝜶 W
Γ 𝑇$ + 𝜶 W∗ 𝑃 𝑧$ = 𝑘 𝒙𝒋, 𝛩 c ,
where
𝑃 𝑧$ = 𝑘 𝒙𝒋, 𝛩 c =
Γ 𝑥#$ + 𝛼#Wc
Γ 𝛼#W9
1#D-
Γ 𝜶 Wc
Γ 𝑇$ + 𝜶 Wc 𝜋W
c
Γ 𝑥#$ + 𝛼#Wc
Γ 𝛼#W9
1#D-
Γ 𝜶 Wc
Γ 𝑇$ + 𝜶 Wc 𝜋W
c�WD-
= 𝛿$W.
Here 𝛿$W represents the probability that the 𝑗 th cell belongs to the 𝑘 th cluster. We calculated 𝛿$W in
the E-step at each iteration.
M-step:

Clustering droplet-based single cell transcriptomic data
At the 𝑡 th iteration, the estimation of the proportion of the 𝑘 thcell type is 𝜋W(cT-) = 𝛿$W
cC$D- /𝐶.
The update formula for 𝛼-W, 𝛼/W, … , 𝛼1W is derived from the Minka’s fixed-point iteration for the
leaving-one-out (LOO) likelihood (Minka , 2000):
𝛼#W(cT-) = 𝛼#W
(c) 𝛿$W 𝑥#$/(𝑥#$ − 1 + 𝛼#W(c))C
$D-
𝛿$W 𝑇$/(𝑇$ − 1 + |𝜶 W(c) |)C
$D-
.
After the M-step, we calculated (𝜋W(cT-) − 𝜋W
c )/�WD- and the relative difference of log likelihood
between two consecutive iterations. Convergence tolerances for difference between iterations are
pre-defined. We repeated the above steps until the convergence of log likelihood and 𝜋W(c), or a max-
imum number of iterations was reached. The default maximum number of iterations is 200.
Z.Sun et al.
Figure S1. The t-SNE projection of the simple case.
Clustering droplet-based single cell transcriptomic data
Figure S2. The t-SNE projection of the challenging case.

Z.Sun et al.
Figure S3. The boxplots of ARI for seven clustering methods across 50 simulations in the chal-lenging case.
Clustering droplet-based single cell transcriptomic data
Figure S4A. The histogram of proportion p� for gene RPS27 and gene RPL18A and the theo-retical marginal beta distribution (solid blue line) in CD56+ NK cells. To obtain the theoretical marginal beta distribution, we used the top 1% (327) genes and calculate α� of the Dirichlet distribu-tion by the Ronning's method (Ronning, 1989).

Z.Sun et al.
Figure S4B. The scatter plot of the log mean of p� versus the log variance of p� in the CD56+ NK cells. α and β are linear regression intercept and slope, respectively. Each dot represents one gene. This figure includes the top 1% (327) highly variable genes.
Clustering droplet-based single cell transcriptomic data
Figure S5. The dot plots of AIC and BIC for the final clustering results in the simulated da-taset, where the true number of clusters is 3. Blue dots and red dots denote values of BIC and AIC, respectively. Black dots denote ARIs.
Z.Sun et al.
References
Minka, T. (2000) Estimating a Dirichlet distribution, https://tminka.github.io/papers /dirichlet/minka-dirichlet.pdf
Ronning, G. (1989) Maximum-likelihood estimation of dirichlet distributions, Journal of Statistical Computation and Simulation, 32, 215-221.