Dimitri Bellini - Monitoring Large Multi-Site Data Environment
20
SAN Monitoring using Zabbix A perfect dress for a powerful engine 2015 August, 20 – Moncalieri (TO) Italy
-
Upload
zabbix -
Category
Technology
-
view
1.544 -
download
0
Transcript of Dimitri Bellini - Monitoring Large Multi-Site Data Environment
SAN Monitoring using ZabbixA perfect dress for a powerful engine
2015 August, 20 – Moncalieri (TO) Italy
1
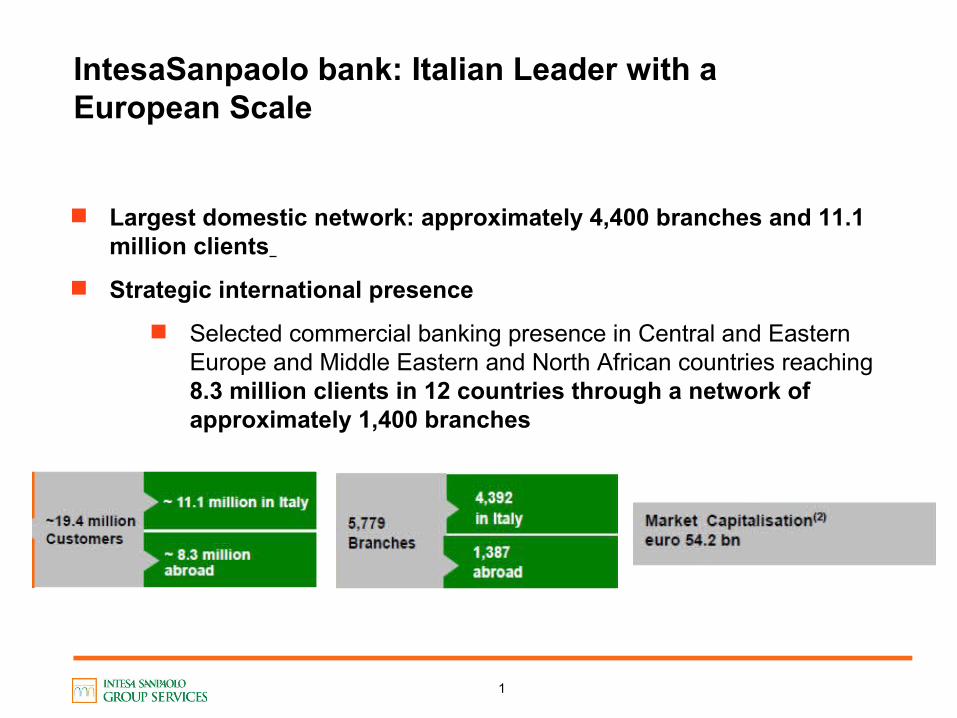
IntesaSanpaolo bank: Italian Leader with a European Scale
Largest domestic network: approximately 4,400 branches and 11.1 million clients
Strategic international presence
Selected commercial banking presence in Central and Eastern Europe and Middle Eastern and North African countries reaching 8.3 million clients in 12 countries through a network of approximately 1,400 branches

2
IntesaSanpaolo bank: European Scale

3
ISGS : ICT service for IntesaSanpaolo
90 mln of transactions per day supported by our ICT infrastructure.
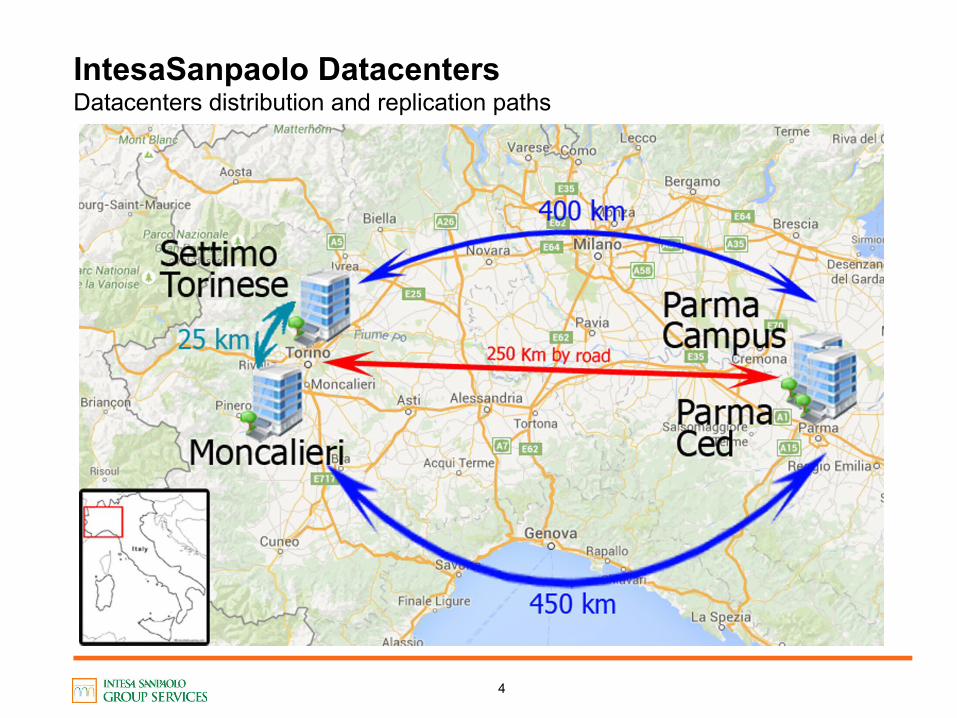
4 Datacenters to allow high reliability of data in case of disaster.
Avalaibility of 2 sites in each of the 3 production centers (Torino, Milano and Parma) in sincronous copy mode.
Disaster recovery assured by a third site avalaibility for each site in asincronous copy mode.
4
IntesaSanpaolo DatacentersDatacenters distribution and replication paths
5
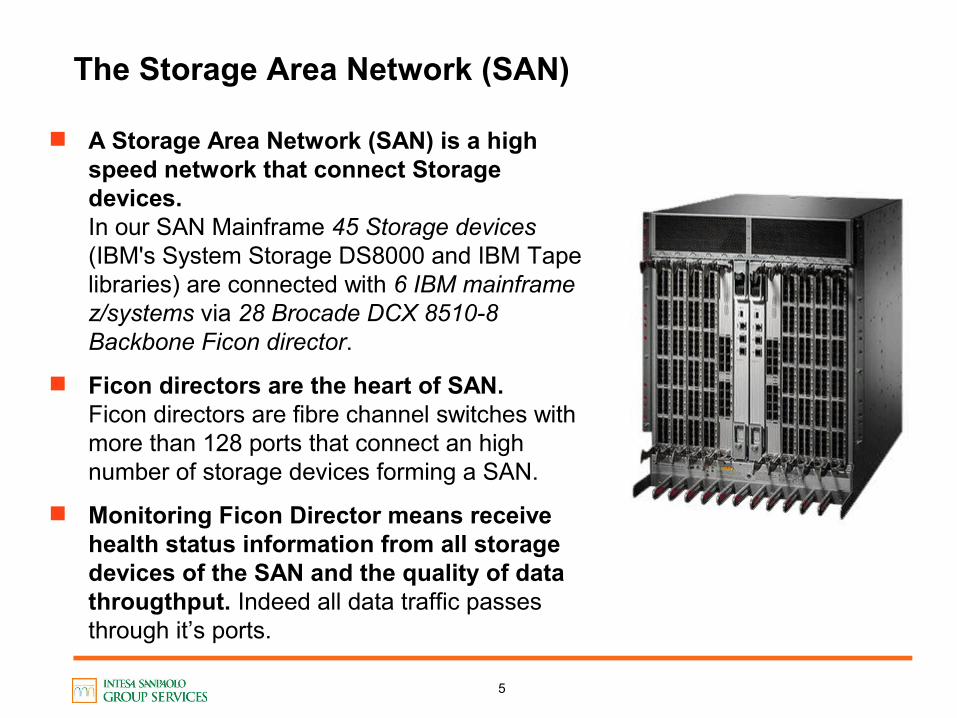
The Storage Area Network (SAN)
A Storage Area Network (SAN) is a high speed network that connect Storage devices.In our SAN Mainframe 45 Storage devices (IBM's System Storage DS8000 and IBM Tape libraries) are connected with 6 IBM mainframe z/systems via 28 Brocade DCX 8510-8 Backbone Ficon director.
Ficon directors are the heart of SAN. Ficon directors are fibre channel switches with more than 128 ports that connect an high number of storage devices forming a SAN.
Monitoring Ficon Director means receive health status information from all storage devices of the SAN and the quality of data througthput. Indeed all data traffic passes through it’s ports.
6
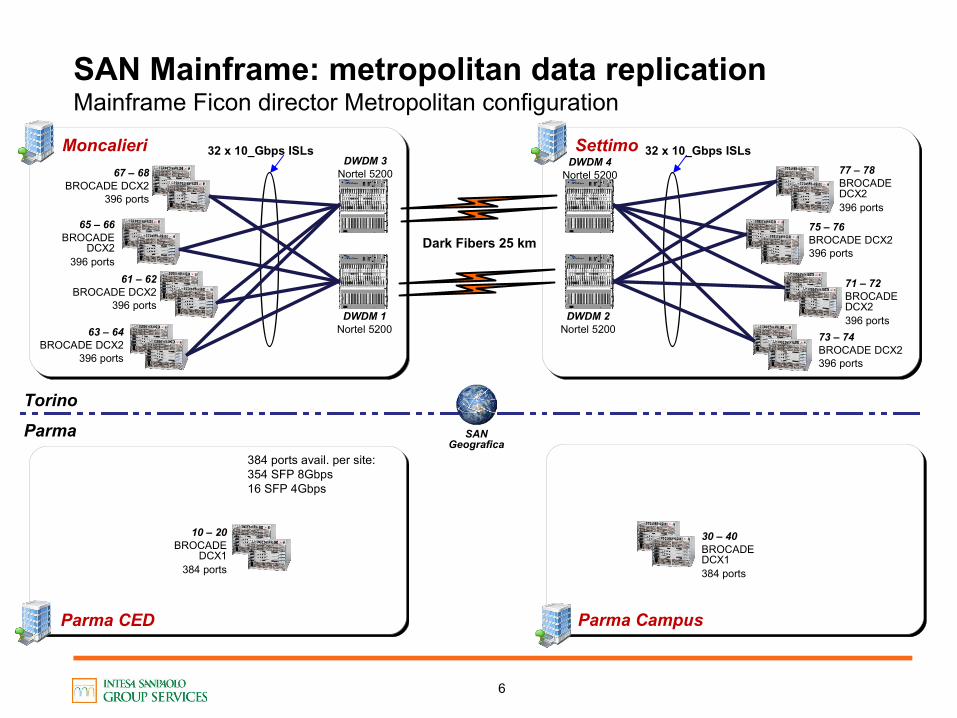
SAN Mainframe: metropolitan data replicationMainframe Ficon director Metropolitan configuration
SettimoSettimoMoncalieriMoncalieri
Parma CEDParma CED Parma CampusParma Campus
Torino
Parma
DWDM 1Nortel 5200
DWDM 2Nortel 5200
DWDM 3Nortel 5200
DWDM 4Nortel 5200
32 x 10_Gbps ISLs
67 – 68BROCADE DCX2
396 ports
61 – 62BROCADE DCX2
396 ports
77 – 78BROCADE DCX2396 ports
75 – 76BROCADE DCX2396 ports
71 – 72BROCADE DCX2396 ports
73 – 74BROCADE DCX2396 ports
32 x 10_Gbps ISLs
SAN Geografica
384 ports avail. per site:354 SFP 8Gbps16 SFP 4Gbps
Dark Fibers 25 km
10 – 20BROCADE
DCX1384 ports
30 – 40BROCADE DCX1384 ports
65 – 66BROCADE
DCX2396 ports
63 – 64BROCADE DCX2
396 ports
7
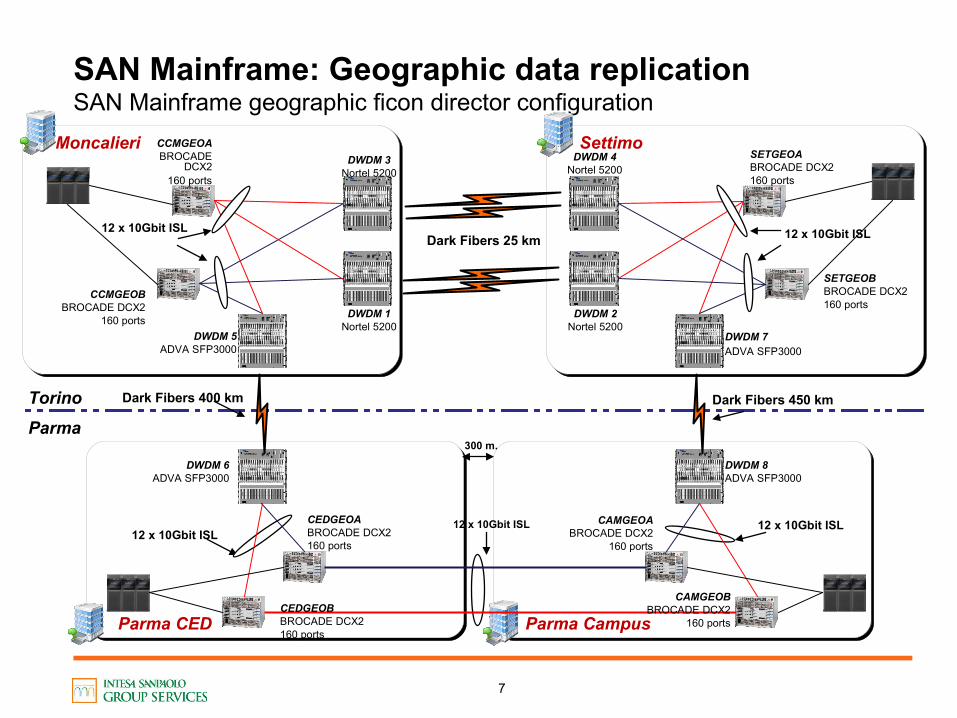
SAN Mainframe: Geographic data replicationSAN Mainframe geographic ficon director configuration
MoncalieriMoncalieri
Parma CEDParma CED Parma CampusParma Campus
SettimoSettimo
Torino
Parma
12 x 10Gbit ISL12 x 10Gbit ISL12 x 10Gbit ISL
Dark Fibers 400 km Dark Fibers 450 km
12 x 10Gbit ISLDark Fibers 25 km
DWDM 1Nortel 5200
DWDM 2Nortel 5200
DWDM 3Nortel 5200
DWDM 4Nortel 5200
DWDM 5ADVA SFP3000
DWDM 6ADVA SFP3000
DWDM 7ADVA SFP3000
DWDM 8ADVA SFP3000
300 m.
12 x 10Gbit ISL
CCMGEOABROCADE
DCX2160 ports
CCMGEOBBROCADE DCX2
160 ports
SETGEOABROCADE DCX2160 ports
SETGEOBBROCADE DCX2160 ports
CEDGEOABROCADE DCX2160 ports
CEDGEOBBROCADE DCX2160 ports
CAMGEOABROCADE DCX2
160 ports
CAMGEOBBROCADE DCX2
160 ports
8
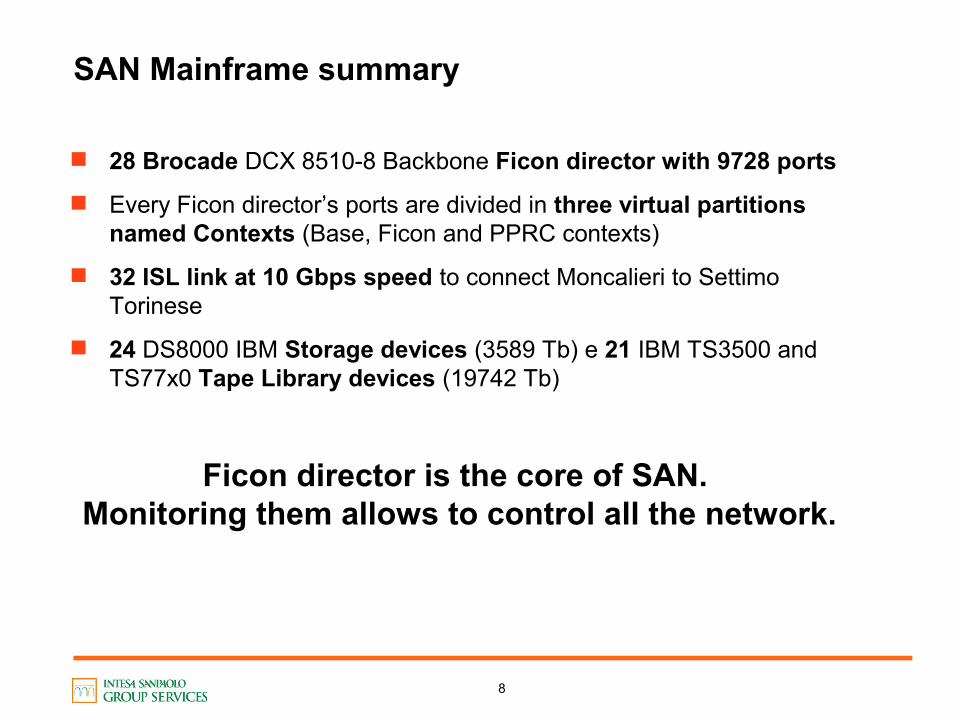
SAN Mainframe summary
28 Brocade DCX 8510-8 Backbone Ficon director with 9728 ports
Every Ficon director’s ports are divided in three virtual partitions named Contexts (Base, Ficon and PPRC contexts)
32 ISL link at 10 Gbps speed to connect Moncalieri to Settimo Torinese
24 DS8000 IBM Storage devices (3589 Tb) e 21 IBM TS3500 and TS77x0 Tape Library devices (19742 Tb)
Ficon director is the core of SAN. Monitoring them allows to control all the network.
9
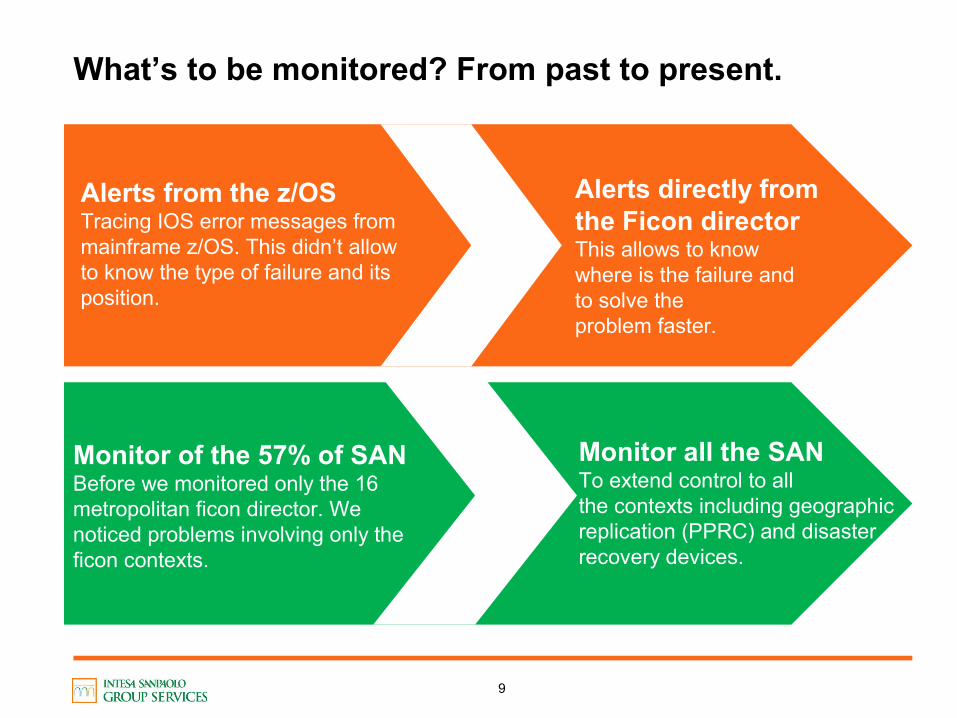
What’s to be monitored? From past to present.
Alerts directly from the Ficon directorThis allows to know where is the failure and to solve the problem faster.
Alerts from the z/OS Tracing IOS error messages from mainframe z/OS. This didn’t allow to know the type of failure and its position.
Monitor of the 57% of SAN Before we monitored only the 16 metropolitan ficon director. We noticed problems involving only the ficon contexts.
Monitor all the SANTo extend control to all the contexts including geographic replication (PPRC) and disaster recovery devices.
10
Why Zabbix?
Many ways to monitor the SAN Possibility to collect data using both SNMP protocol, Zabbix trapper and network simple checks.
Automatic build and update of monitored objects Using Zabbix low level discovery powerful features we have to set initial template rules to find all the ports and let the SAN to form itself.
Easily manage great volumes of objects In our SAN we have a large amount of items per host and 390 NVPS:
1774 items x 72 hosts = 127728 items to be monitored !!!
Tailored front end for NOC and Storage and Data Management With Zabbix API we can develop a tailored front end fitting different needs to monitor, manage and analyze problems of SAN.
Zabbix knowledge and support on site Working side by side with Zabbix expert and front end developers it’s fundamental to reach our targets.
SettimoSettimoMoncalieriMoncalieri
Parma CEDParma CED Parma CampusParma Campus
11
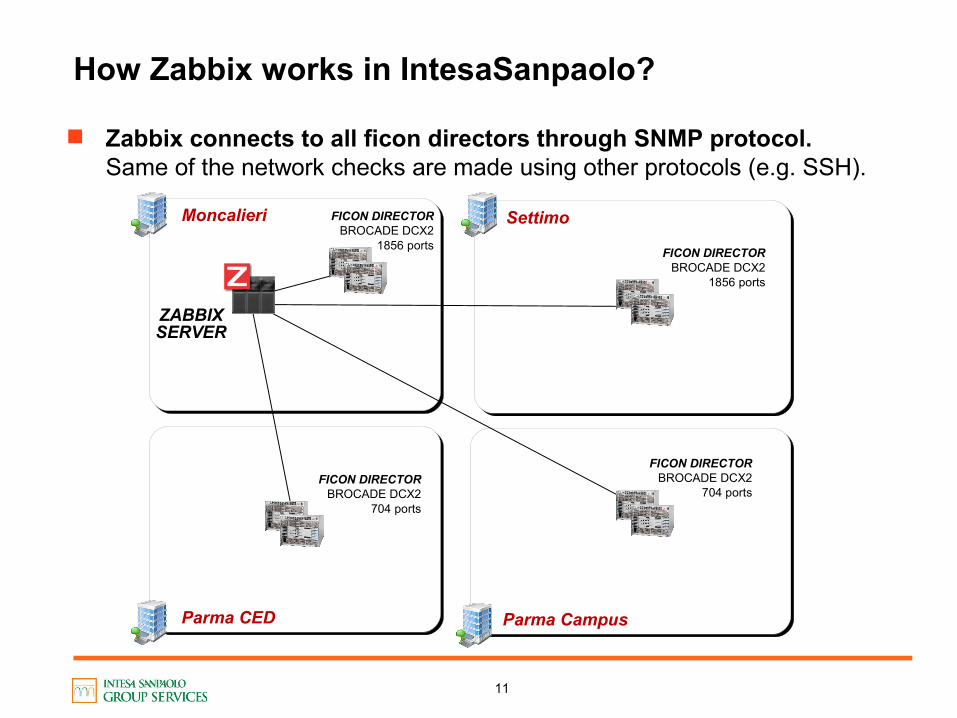
How Zabbix works in IntesaSanpaolo?
Zabbix connects to all ficon directors through SNMP protocol. Same of the network checks are made using other protocols (e.g. SSH).
ZABBIX SERVER
FICON DIRECTORBROCADE DCX2
1856 portsFICON DIRECTOR
BROCADE DCX21856 ports
FICON DIRECTORBROCADE DCX2
704 portsFICON DIRECTOR
BROCADE DCX2704 ports
12
How we structured Zabbix: Hosts and templates
2 Templates to manage context with different severity levels In our SAN the base context is the most critical because its ISL ports manage all the traffic that passes from a datacenter to another.
4 host groups: One for each data center We have created four host groups to fastly recognize the location of device in trouble and save time in technical resolution of the problem.
72 hosts: every host represent a switch context This hosts organization has been designed to reflect that each context transmits distinct kind of data with different severity.
27 Items per port and 14 items per switch context These are divided in 6 applications that represent different types of item:
2 apps for switch and port technical details and attached device
2 apps for traffic quality (Rx / Tx and port errors)
2 apps for port healthy status and switch hardware controls
13
A customized front end with Zabbix API
Improve data presentation We needed better performance and data organization. Zabbix maps and Latest data panel were inadequate for our targets.
WHY? HOW?
High interactive data analysis Zabbix graphs couldn’t offer anything else than time range selection and static information.
Custom extra features for NOC We needed an advanced system to track problem management.
Modern and flexible web technologies utilization Using javascript framework like EXTJS we built leaner interfaces with custom layouts.
Custom powerful graphs Using HIGHCHARTS advanced features we take advantage of items compare, zoom and customized graphical mode.
DB for events management Issues are recorded as they happen, and purged as they are solved.
14
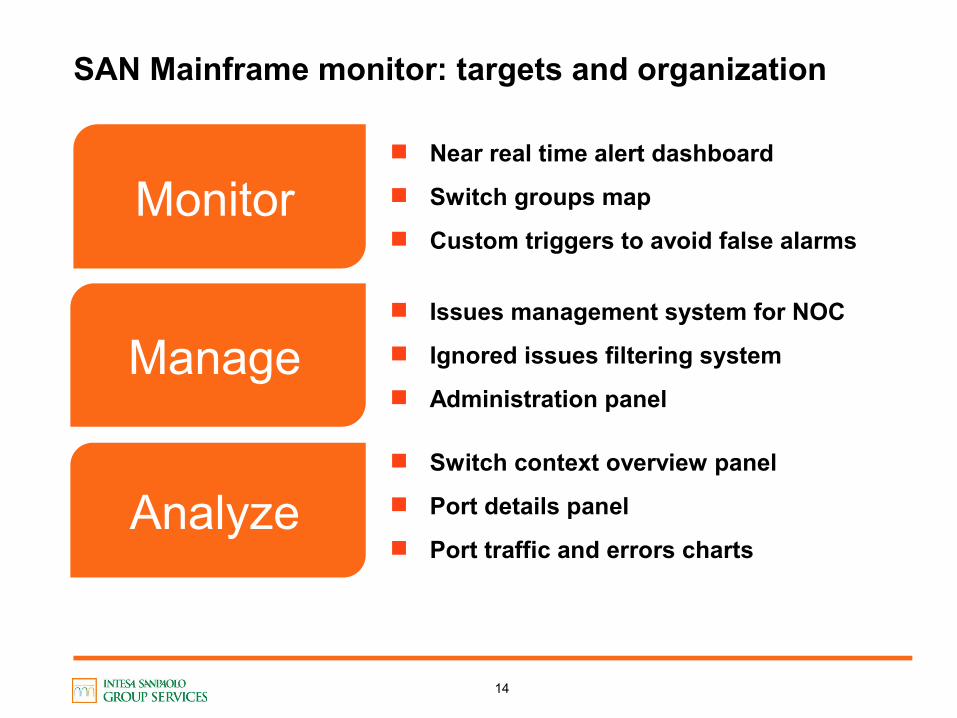
SAN Mainframe monitor: targets and organization
Monitor
Manage
Analyze
Near real time alert dashboard
Switch groups map
Custom triggers to avoid false alarms
Issues management system for NOC
Ignored issues filtering system
Administration panel
Switch context overview panel
Port details panel
Port traffic and errors charts
15
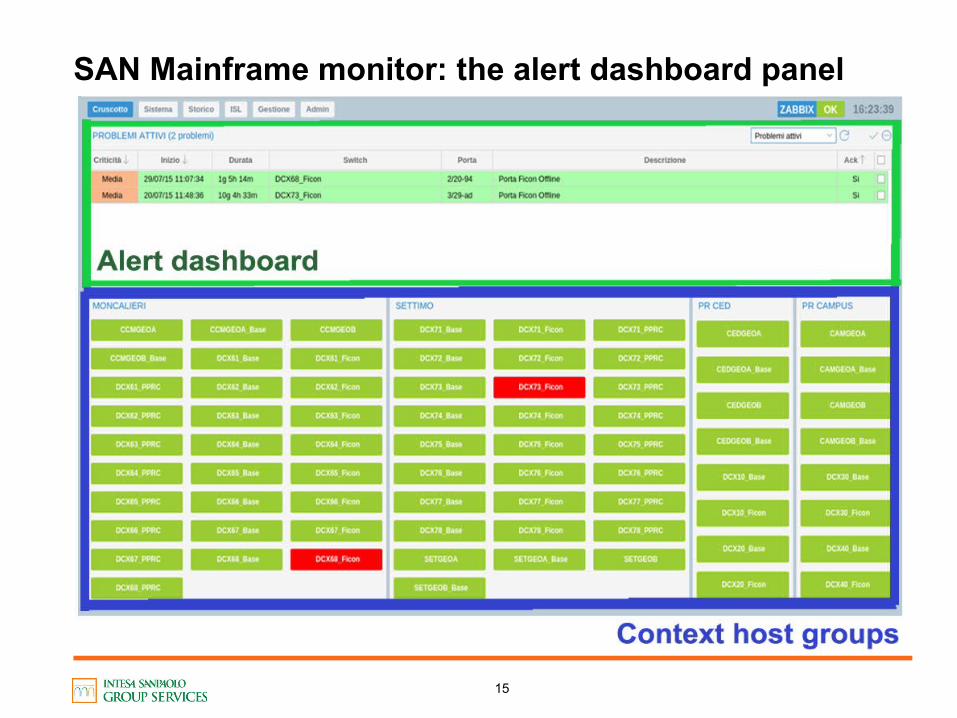
SAN Mainframe monitor: the alert dashboard panel
16
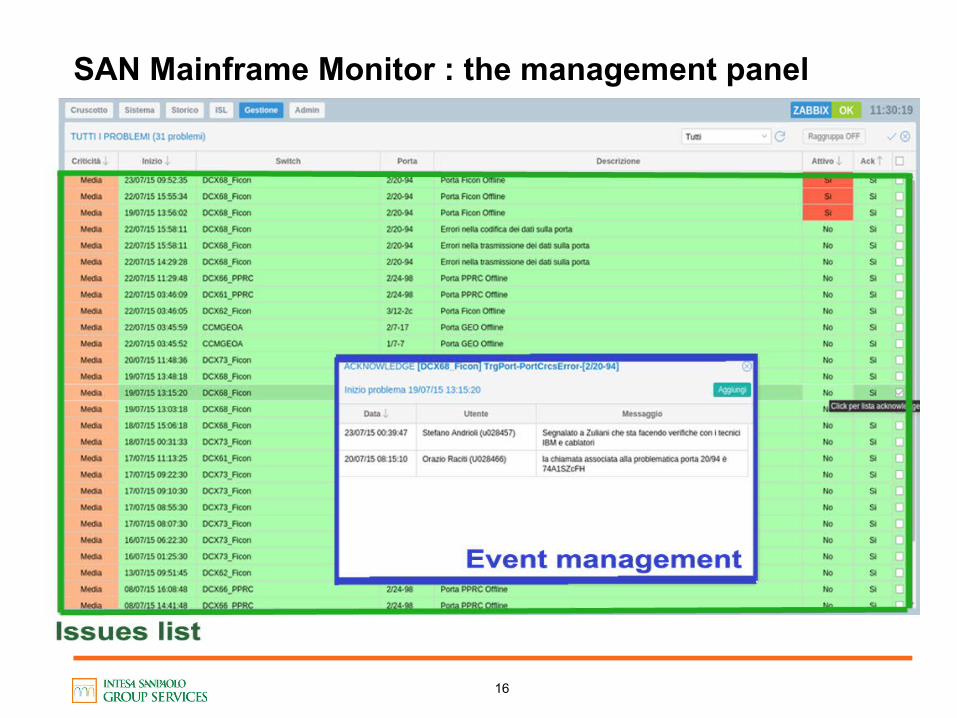
SAN Mainframe Monitor : the management panel
17
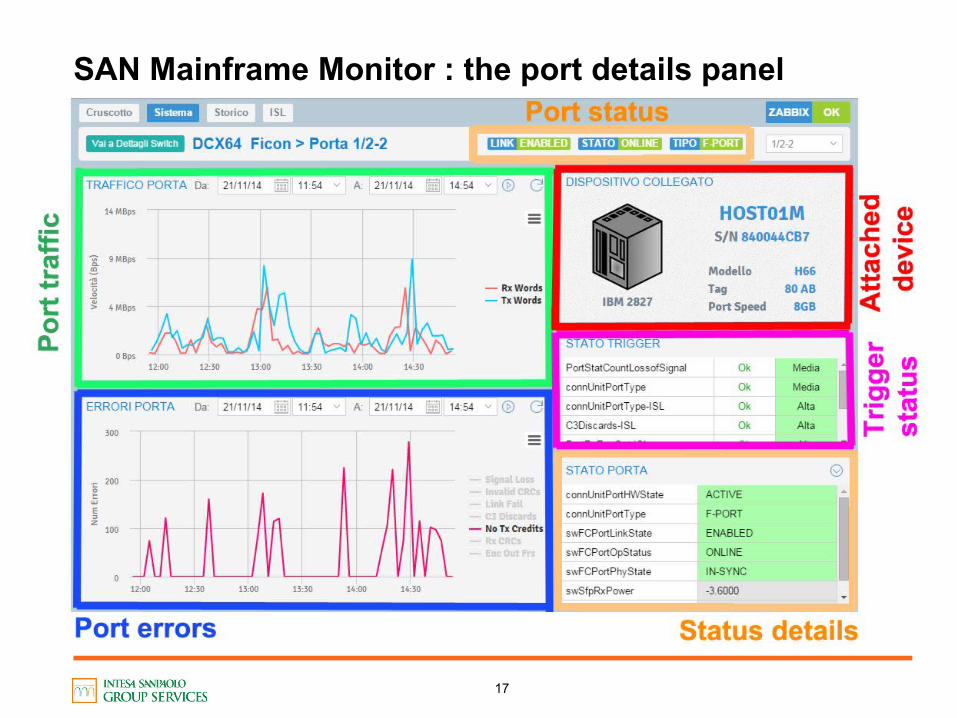
SAN Mainframe Monitor : the port details panel

18
Future purposes
IBM DS8000, TS3500 and TS77x0 monitoring
Z/os Mainframe data configuration integration
Service based items aggregations for SLA measurement
19
Thank you for your attention