Dimensions of Customer-Based Brand Equity in … · Dimensions of Customer-Based Brand Equity in...
12
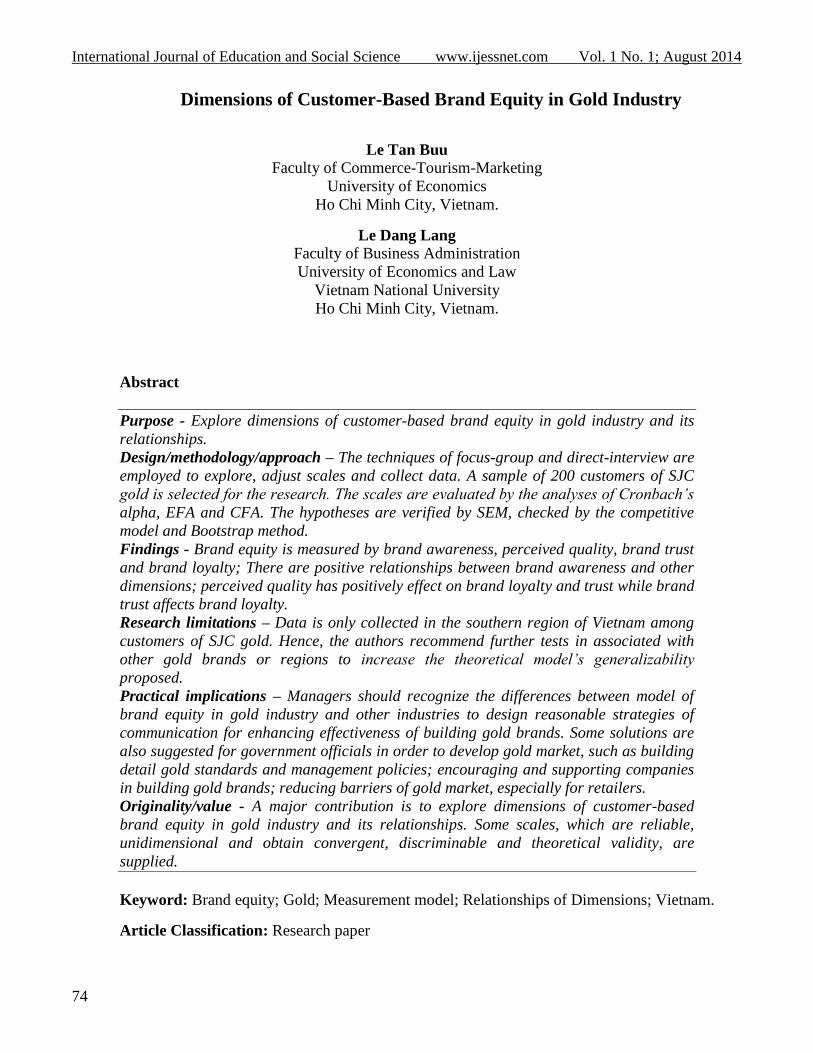
International Journal of Education and Social Science www.ijessnet.com Vol. 1 No. 1; August 2014 74 Dimensions of Customer-Based Brand Equity in Gold Industry Le Tan Buu Faculty of Commerce-Tourism-Marketing University of Economics Ho Chi Minh City, Vietnam. Le Dang Lang Faculty of Business Administration University of Economics and Law Vietnam National University Ho Chi Minh City, Vietnam. Abstract Purpose - Explore dimensions of customer-based brand equity in gold industry and its relationships. Design/methodology/approach – The techniques of focus-group and direct-interview are employed to explore, adjust scales and collect data. A sample of 200 customers of SJC gold is selected for the research. The scales are evaluated by the analyses of Cronbach’s alpha, EFA and CFA. The hypotheses are verified by SEM, checked by the competitive model and Bootstrap method. Findings - Brand equity is measured by brand awareness, perceived quality, brand trust and brand loyalty; There are positive relationships between brand awareness and other dimensions; perceived quality has positively effect on brand loyalty and trust while brand trust affects brand loyalty. Research limitations – Data is only collected in the southern region of Vietnam among customers of SJC gold. Hence, the authors recommend further tests in associated with other gold brands or regions to increase the theoretical model’s generalizability proposed. Practical implications – Managers should recognize the differences between model of brand equity in gold industry and other industries to design reasonable strategies of communication for enhancing effectiveness of building gold brands. Some solutions are also suggested for government officials in order to develop gold market, such as building detail gold standards and management policies; encouraging and supporting companies in building gold brands; reducing barriers of gold market, especially for retailers. Originality/value - A major contribution is to explore dimensions of customer-based brand equity in gold industry and its relationships. Some scales, which are reliable, unidimensional and obtain convergent, discriminable and theoretical validity, are supplied. Keyword: Brand equity; Gold; Measurement model; Relationships of Dimensions; Vietnam. Article Classification: Research paper
Transcript of Dimensions of Customer-Based Brand Equity in … · Dimensions of Customer-Based Brand Equity in...
International Journal of Education and Social Science www.ijessnet.com Vol. 1 No. 1; August 2014
74
Dimensions of Customer-Based Brand Equity in Gold Industry
Le Tan Buu
Faculty of Commerce-Tourism-Marketing
University of Economics
Ho Chi Minh City, Vietnam.
Le Dang Lang
Faculty of Business Administration
University of Economics and Law
Vietnam National University
Ho Chi Minh City, Vietnam.
Abstract
Purpose - Explore dimensions of customer-based brand equity in gold industry and its
relationships.
Design/methodology/approach – The techniques of focus-group and direct-interview are
employed to explore, adjust scales and collect data. A sample of 200 customers of SJC
gold is selected for the research. The scales are evaluated by the analyses of Cronbach’s
alpha, EFA and CFA. The hypotheses are verified by SEM, checked by the competitive
model and Bootstrap method.
Findings - Brand equity is measured by brand awareness, perceived quality, brand trust
and brand loyalty; There are positive relationships between brand awareness and other
dimensions; perceived quality has positively effect on brand loyalty and trust while brand
trust affects brand loyalty.
Research limitations – Data is only collected in the southern region of Vietnam among
customers of SJC gold. Hence, the authors recommend further tests in associated with
other gold brands or regions to increase the theoretical model’s generalizability
proposed.
Practical implications – Managers should recognize the differences between model of
brand equity in gold industry and other industries to design reasonable strategies of
communication for enhancing effectiveness of building gold brands. Some solutions are
also suggested for government officials in order to develop gold market, such as building
detail gold standards and management policies; encouraging and supporting companies
in building gold brands; reducing barriers of gold market, especially for retailers.
Originality/value - A major contribution is to explore dimensions of customer-based
brand equity in gold industry and its relationships. Some scales, which are reliable,
unidimensional and obtain convergent, discriminable and theoretical validity, are
supplied.
Keyword: Brand equity; Gold; Measurement model; Relationships of Dimensions; Vietnam.
Article Classification: Research paper
©Research Institute for Progression of Knowledge www.ripknet.org
75
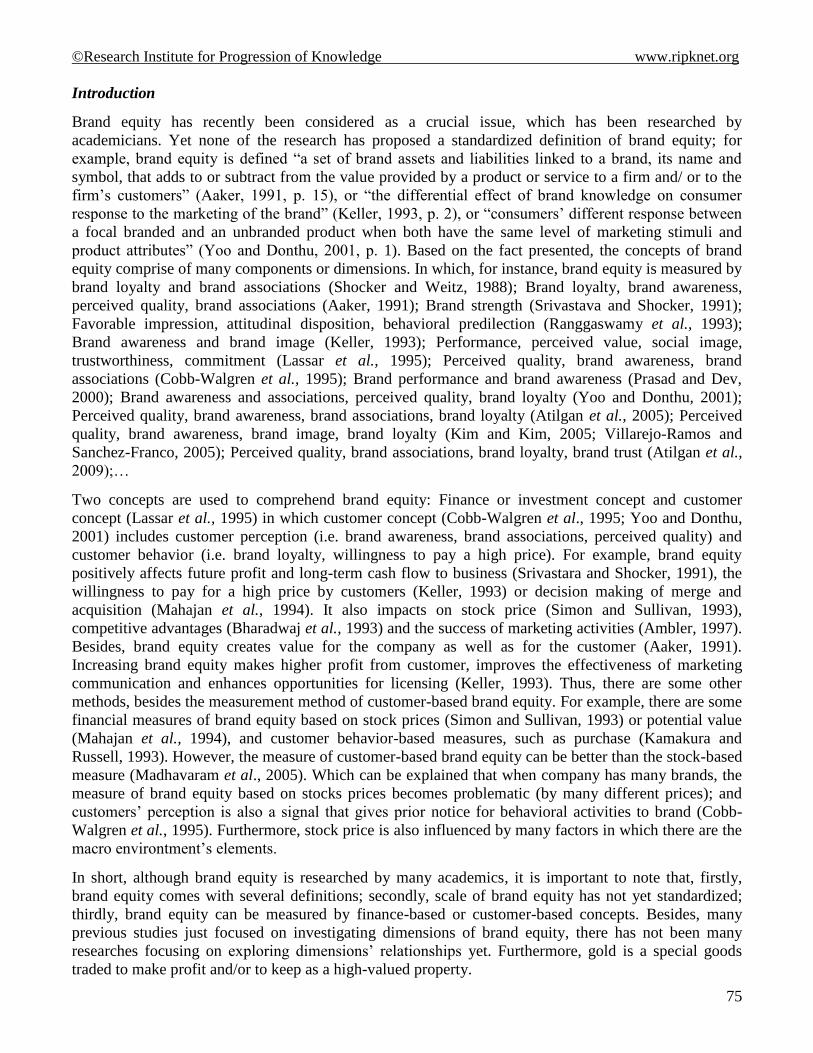
Introduction
Brand equity has recently been considered as a crucial issue, which has been researched by
academicians. Yet none of the research has proposed a standardized definition of brand equity; for
example, brand equity is defined “a set of brand assets and liabilities linked to a brand, its name and
symbol, that adds to or subtract from the value provided by a product or service to a firm and/ or to the
firm’s customers” (Aaker, 1991, p. 15), or “the differential effect of brand knowledge on consumer
response to the marketing of the brand” (Keller, 1993, p. 2), or “consumers’ different response between
a focal branded and an unbranded product when both have the same level of marketing stimuli and
product attributes” (Yoo and Donthu, 2001, p. 1). Based on the fact presented, the concepts of brand
equity comprise of many components or dimensions. In which, for instance, brand equity is measured by
brand loyalty and brand associations (Shocker and Weitz, 1988); Brand loyalty, brand awareness,
perceived quality, brand associations (Aaker, 1991); Brand strength (Srivastava and Shocker, 1991);
Favorable impression, attitudinal disposition, behavioral predilection (Ranggaswamy et al., 1993);
Brand awareness and brand image (Keller, 1993); Performance, perceived value, social image,
trustworthiness, commitment (Lassar et al., 1995); Perceived quality, brand awareness, brand
associations (Cobb-Walgren et al., 1995); Brand performance and brand awareness (Prasad and Dev,
2000); Brand awareness and associations, perceived quality, brand loyalty (Yoo and Donthu, 2001);
Perceived quality, brand awareness, brand associations, brand loyalty (Atilgan et al., 2005); Perceived
quality, brand awareness, brand image, brand loyalty (Kim and Kim, 2005; Villarejo-Ramos and
Sanchez-Franco, 2005); Perceived quality, brand associations, brand loyalty, brand trust (Atilgan et al.,
2009);…
Two concepts are used to comprehend brand equity: Finance or investment concept and customer
concept (Lassar et al., 1995) in which customer concept (Cobb-Walgren et al., 1995; Yoo and Donthu,
2001) includes customer perception (i.e. brand awareness, brand associations, perceived quality) and
customer behavior (i.e. brand loyalty, willingness to pay a high price). For example, brand equity
positively affects future profit and long-term cash flow to business (Srivastara and Shocker, 1991), the
willingness to pay for a high price by customers (Keller, 1993) or decision making of merge and
acquisition (Mahajan et al., 1994). It also impacts on stock price (Simon and Sullivan, 1993),
competitive advantages (Bharadwaj et al., 1993) and the success of marketing activities (Ambler, 1997).
Besides, brand equity creates value for the company as well as for the customer (Aaker, 1991).
Increasing brand equity makes higher profit from customer, improves the effectiveness of marketing
communication and enhances opportunities for licensing (Keller, 1993). Thus, there are some other
methods, besides the measurement method of customer-based brand equity. For example, there are some
financial measures of brand equity based on stock prices (Simon and Sullivan, 1993) or potential value
(Mahajan et al., 1994), and customer behavior-based measures, such as purchase (Kamakura and
Russell, 1993). However, the measure of customer-based brand equity can be better than the stock-based
measure (Madhavaram et al., 2005). Which can be explained that when company has many brands, the
measure of brand equity based on stocks prices becomes problematic (by many different prices); and
customers’ perception is also a signal that gives prior notice for behavioral activities to brand (Cobb-
Walgren et al., 1995). Furthermore, stock price is also influenced by many factors in which there are the
macro environtment’s elements.
In short, although brand equity is researched by many academics, it is important to note that, firstly,
brand equity comes with several definitions; secondly, scale of brand equity has not yet standardized;
thirdly, brand equity can be measured by finance-based or customer-based concepts. Besides, many
previous studies just focused on investigating dimensions of brand equity, there has not been many
researches focusing on exploring dimensions’ relationships yet. Furthermore, gold is a special goods
traded to make profit and/or to keep as a high-valued property.
International Journal of Education and Social Science www.ijessnet.com Vol. 1 No. 1; August 2014
76
It is likely one of the most valued and interested properties for almost people in developing nations in
general and in Vietnam in particular. Therefore, how the model of customer-based brand equity in gold
industry is measured and its dimensions’ relationships are issues which are interested by many
academics and leaders. For these reasons, a research of customer-based brand equity in gold industry
will contribute a more concise and holistic understanding of brand equity model and develop gold
industry by increasing effectiveness of building brands of gold.
Literature Review and Hypotheses
Although some scholars in Vietnam have studied brand equity, a handful of papers were published by
academic journals, specifically, the study of brand equity in consumer goods industry done by Nguyen
and Nguyen (2002). The result shows that the measurement model of customer-based brand equity in
consumer goods industry consists of three components: brand awareness, perceived quality, brand
passion. However, the finding is only verified in shampoo product industry and plus, data collected is
limited in Northern Vietnam, thus its generalibility needs to be considered more. In the study of brand
loyalty in emerging markets, despite Nguyen et al. (2011) found brand awareness and perceived quality as key antecedents
of brand loyalty, a model of brand equity has not yet suggested. Another study of the impact of advertising and
sales promotion on brand equity in beverage, Le (2013) indicates that the model of brand equity is
measured by four components: brand awareness, brand associations, perceived quality, brand loyalty; in
which the author points out that brand awareness positively influences brand associations while
perceived quality positively affects brand loyalty. Le’s findings further explain and support for previous
findings researched by Aaker (1991), Yoo et al. (2000, 2001) or Villarejo-Ramos and Sanchez-Franco
(2005). These findings have noticeably contributed to marketing theories. Nevertheless, this study that is
done in Southern Vietnam can not be applied to other fields and places.
From these typical studies, the results indicate that the measurement model of brand equity in fast
moving consumer goods (FMCG) is not unified although both beverage and shampoo belong to FMCG
industry (Deliya, 2012). This result is also suitable for the real condition because there has not yet come up with a more
standardized definition of model of brand equity. Therefore, this research uses the model of brand equity of Aaker
(1991), which is measured by four components: brand awareness, brand associations, perceived quality,
brand loyalty. This famous and popular model is commonly applied by many academics. Moreover, this
model’s brand association dimension also describes the brand image component, which is one of two
components of brand equity that Keller (1993) proposes. This is supported by Aaker’s (1991, p. 109)
definitions of brand association as “anything linked in memory to a brand” and brand image as “a set of
brand associations, usually in some meaningful ways”; besides, Keller (1993, p. 3) proposes brand
image as “perceptions about a brand as reflected by the brand associations held in consumer memory”,
and the brand association is one of the brand image scale’s components.
Moreover, Aaker’s (1991, 1996) scales of dimensions of brand equity are built by other researchers in
markets which are different from gold; for instance, they are built by Yoo et al. (2000, 2001) in athletic
shoes, color televisions, and film industries; or built by Villarejo-Ramos and Sanchez-Franco (2005) in
washing machine market. It is important to note that gold is a special goods, which is not only bought
for trading but also kept as property. Besides, customers need to have a proper understanding of gold,
then they can associate, perceive and evaluate it in order to increase their trust upon purchasing. Even
after purchasing gold, the possibility of customers to continue to invest and/or buy gold depends on their
needs, impulse, demand and satisfactory. Therefore, brand trust may also be a component of the
measurement model of brand equity in gold industry. This component is also one dimension of the
model of brand equity that Atilgan et al. (2009) proposes.
Therefore, the model of brand equity in gold industry also consists of brand awareness, brand
associations, perceived quality, brand trust, brand loyalty.
©Research Institute for Progression of Knowledge www.ripknet.org
77
Although brand awareness and brand associations are separated in theory, they are measured by one
scale in real (Yoo et al., 2000, 2001). Hence, in this research, they are grouped as one component named
“brand awareness and associations”. From that, dimensions of brand equity and some hypotheses are
described as below:
Brand Awareness and Associations
Brand awareness is defined as “the ability for a buyer to recognize or recall that a brand is a member of
a certain product category” (Aaker, 1991, p. 61) or “the strength of the brand node or trace in memory,
as reflected by consumers’ ability to identify the brand under different conditions” (Rossiter and Percy,
1987; Keller, 1993). Thus, brand awareness consists of both brand recognition and recall. This is an
important component of brand equity because it can be an antecedent of other components. Moreover,
according to Aaker (1991, p. 109), brand association is defined as “anything linked in memory to a
brand”. When customers know or recall a brand, then they have associations of that brand. Plus, they
will have attitude and behavioral actions to that brand.
Perceived Quality
This construct is defined as “the consumer’s judgment about a product’s overall excellence or
superiority” (Zeithaml, 1988, p. 3). Therefore, perceived quality refers to customers’ subjective
evaluations of product quality. This component plays an important role in measuring brand equity. It is
created when customers know and have associations with the brand. Thus, brand awareness and
associations may have positive effects on perceived quality (Nguyen and Nguyen, 2002, Nguyen et al.,
2011)). From that, H1 hypothesis is developed as below:
H1:Brand awareness and associations have positive effect on perceived quality of brand
Brand Trust
It is defined as “the willingness of the average consumer to reply on the ability of the brand to perform
its stated function” (Chaudhuri and Holbrook, 2001, p. 82). Brand trust influences on relationship
commitment (Morgan and Hunt, 1994), product consideration and purchase (Erdem et al., 2006) as well
as satisfaction and loyalty (Lau and Lee, 1999). “Brand trust may also be evaluated as a consistency and
credibility clue by customers” (Atilgan et al., 2009, p. 121). Brand trust may be created by brand
awareness and positive associations or perceived quality of customers. Thus, brand trust can be one of
important elements that create customers’ interests, needs, demand, consideration and product purchase,
so it is likely a component of brand equity. From that, H2 and H3 hypotheses are developed as below:
H2: Brand awareness and associations have positive effect on trust of brand
H3: Perceived quality of brand has positive effect on trust of brand
Brand Loyalty
It is defined as “the attachment that a customer has to a brand” (Aaker, 1991, p. 39) or “a deeply held
commitment to rebuy or repatronize a preferred product or service consistently in future, despite
situation influences and marketing efforts having the potential to cause switching behavior” (Oliver,
1997, p. 392). Brand loyalty determines customer to buy focal brand regularly and prevent them from
switching to other brands. Therefore, brand loyalty is a component of brand equity (Aaker, 1991).
Moreover, development, maintenance and increasing of brand loyalty of product are often considered as
central of marketing activities (Dick and Basu, 1994). In other hand, by being committed to a brand,
customer may need to know and has positive associations with the brand, or perception of brand quality
is reliability (Nguyen and Nguyen, 2002; Nguyen et al., 2011; Le, 2013). From that, H4, H5 and H6
hypotheses are developed as below:

International Journal of Education and Social Science www.ijessnet.com Vol. 1 No. 1; August 2014
78
H4: Perceived quality of brand has positive effect on loyalty of brand
H5: Brand trust has positive effect on loyalty of brand
H6: Brand awareness and associations have positive effect on loyalty of brand
In summary, brand equity in gold industry is hypothesized to be measured by four components: brand
awareness and associations, perceived quality, brand trust, and brand loyalty. These hypotheses and
components are presented in conceptual model as below:
Figure 1: Conceptual model
Besides, the competitive model plays an important role in research of building scientific theory.
(Zaltman et al., 1982; Bollen and Long, 1993). In this study, therefore, the competitive model is
developed to check the research model (conceptual model). According to the previous studies (Yoo et
al., 2000, 2001; Villarejo-Ramos and Sanchez-Franco, 2005; Le, 2013), the relation between the
construct of brand awareness/ associations and brand loyalty has not yet been significantly highlighted
and focused, thus, Hc hypothesis is developed for the competitive model as below:
Hc: Brand awareness and associations does not have positive effect on loyalty of brand
Methodology
Measurement
The conceptual model of brand equity in gold industry proposed consists of four components: brand
awareness and associations (BA), perceived quality (PQ), brand trust (BT), brand loyalty (BL). These
components’ scale as a set of items (or statements) is derived from the previous studies. For instance, the
scale of brand awareness and associations and the scale of perceived quality are the unidimensional
scales, consisting of six items for each type, from BA1 to BA6 and from PQ1 to PQ6, derived from the
study of Yoo and Donthu (2001). The scales of brand loyalty and brand trust are also the unidimensional
scales, comprising of six items for brand loyalty, from BL1 to BL6, and four items for brand trust, from
BT1 to BT4, derived from the study of Atilgan et al. (2009). Then, the focus-group technique is applied
to explore and adapt items of scales of dimensions. As the result, there is one item supplied for the scale
of brand awareness and associations, two items for perceived quality and two items for brand loyalty.
The items are applied to design a questionnaire for the quantitative research.
Sample
The questionnaire is made of statements which are items of scales to be evaluated with the five-point
Likert scale graded from 1 to 5, of which 5 = “strongly agree” and 1 = “strongly disagree”. Data is
collected by the direct-interview technique. The research object is SJC brand. This is a gold brand, has
become well-known since the Government of Vietnam chose SJC as the national gold brand. Samples
that have purchased SJC during the last six months are chosen conveniently. Data is collected from May
to June in 2013 in Vietnam. There are 200 completed questionnaire collected in which females count for
83% and 17% for males.
H1
(+)
H2
(+) Brand Awareness/
Associations
Perceived Quality
H3
(+
) Brand Loyalty
Brand Trust
H6
(+
)
H4
(+)
H
5
(+
)
©Research Institute for Progression of Knowledge www.ripknet.org
79
Analysis Technique
Data is processed by SPSS/Amos 20 software. The scales are evaluated by the analyses of Cronbach’s
alpha, Exploratory Factor Analysis (EFA), Confirmatory Factor Analysis (CFA). The competitive model
is built to test the theoretical model. Its sustainable characterization is evaluated by the Bootstrap
method. The research hypotheses are then verified by Structural Equation Modeling (SEM).
Data Analysis and Results
Measurement Refinement
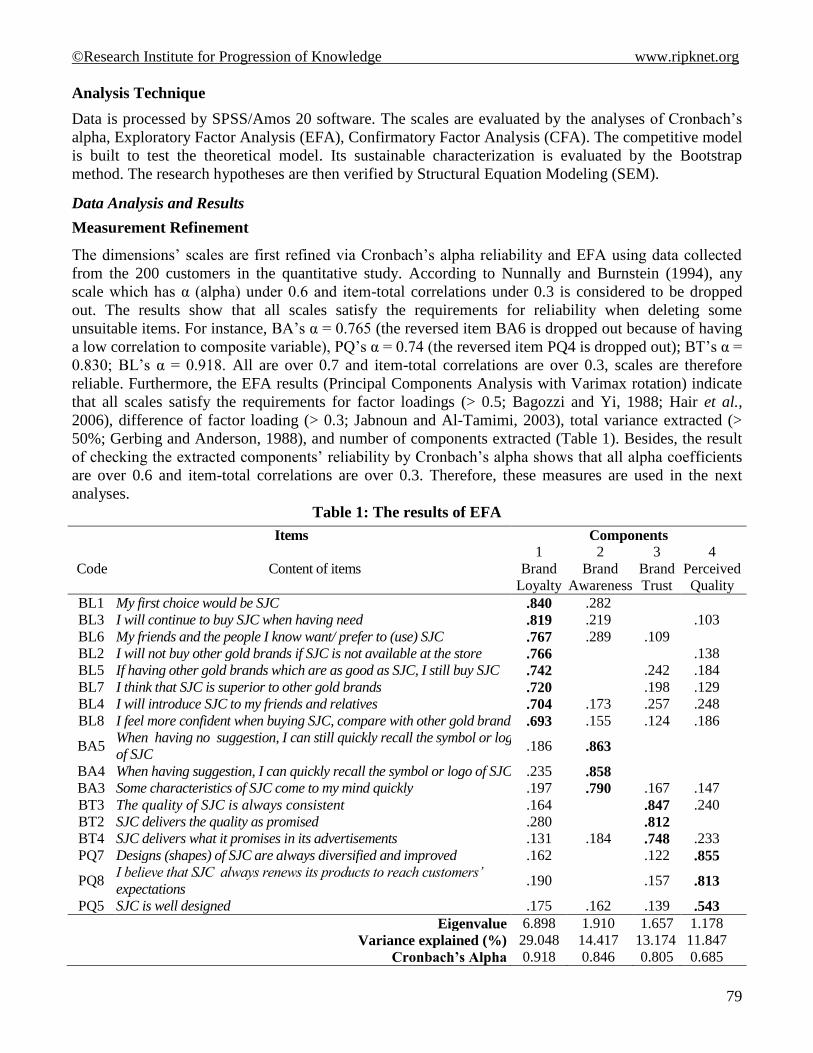
The dimensions’ scales are first refined via Cronbach’s alpha reliability and EFA using data collected
from the 200 customers in the quantitative study. According to Nunnally and Burnstein (1994), any
scale which has α (alpha) under 0.6 and item-total correlations under 0.3 is considered to be dropped
out. The results show that all scales satisfy the requirements for reliability when deleting some
unsuitable items. For instance, BA’s α = 0.765 (the reversed item BA6 is dropped out because of having
a low correlation to composite variable), PQ’s α = 0.74 (the reversed item PQ4 is dropped out); BT’s α =
0.830; BL’s α = 0.918. All are over 0.7 and item-total correlations are over 0.3, scales are therefore
reliable. Furthermore, the EFA results (Principal Components Analysis with Varimax rotation) indicate
that all scales satisfy the requirements for factor loadings (> 0.5; Bagozzi and Yi, 1988; Hair et al.,
2006), difference of factor loading (> 0.3; Jabnoun and Al-Tamimi, 2003), total variance extracted (>
50%; Gerbing and Anderson, 1988), and number of components extracted (Table 1). Besides, the result
of checking the extracted components’ reliability by Cronbach’s alpha shows that all alpha coefficients
are over 0.6 and item-total correlations are over 0.3. Therefore, these measures are used in the next
analyses.
Table 1: The results of EFA
Items Components
Code Content of items
1 2 3 4
Brand
Loyalty
Brand
Awareness
Brand
Trust
Perceived
Quality
BL1 My first choice would be SJC .840 .282
BL3 I will continue to buy SJC when having need .819 .219 .103
BL6 My friends and the people I know want/ prefer to (use) SJC .767 .289 .109
BL2 I will not buy other gold brands if SJC is not available at the store .766 .138
BL5 If having other gold brands which are as good as SJC, I still buy SJC .742 .242 .184
BL7 I think that SJC is superior to other gold brands .720 .198 .129
BL4 I will introduce SJC to my friends and relatives .704 .173 .257 .248
BL8 I feel more confident when buying SJC, compare with other gold brands .693 .155 .124 .186
BA5 When having no suggestion, I can still quickly recall the symbol or logo
of SJC .186 .863
BA4 When having suggestion, I can quickly recall the symbol or logo of SJC .235 .858
BA3 Some characteristics of SJC come to my mind quickly .197 .790 .167 .147
BT3 The quality of SJC is always consistent .164 .847 .240
BT2 SJC delivers the quality as promised .280 .812
BT4 SJC delivers what it promises in its advertisements .131 .184 .748 .233
PQ7 Designs (shapes) of SJC are always diversified and improved .162 .122 .855
PQ8 I believe that SJC always renews its products to reach customers’
expectations .190 .157 .813
PQ5 SJC is well designed .175 .162 .139 .543
Eigenvalue 6.898 1.910 1.657 1.178
Variance explained (%) 29.048 14.417 13.174 11.847
Cronbach’s Alpha 0.918 0.846 0.805 0.685
International Journal of Education and Social Science www.ijessnet.com Vol. 1 No. 1; August 2014
80
There are four components as dimensions of brand equity extracted from the result of EFA:
- The first component consists of eights items, from BL1 to BL8. All describe customer’s loyalty to
brand, therefore this dimension is named “brand loyalty”.
- The second component has three items, BA3, BA4 and BA5. They are items of the construct of
brand awareness and associations in the initial conceptual model. However, they focus on
measuring the construct of brand awareness instead of brand awareness and associations when
checking the content validity of these items basing on the related literatures, such as definitions of
brand awareness of Aaker (1991), Keller (1993) or definition of brand associations of Aaker
(1991); and checking the scale of the construct of brand awareness built by other researchers, such
as Nguyen and Nguyen (2002). Thus, the brand awareness is used instead of the brand awareness
and associations after the EFA analysis. It means that the dimension of brand associations of the
construct of brand awareness and association is dropped out in the research model.
- The third component has three items, BT2, BT3 and BT4. All describe customer’s trust to brand,
therefore this dimension is named “brand trust”.
- The fourth component has three items, PQ5, PQ7 and PQ8. All describe dimension of quality
perceived by customer to brand, therefore it is named “perceived quality”.
Measurement Validation
CFA is used to evaluate the scales. The maximum likelihood (ML) estimation method is applied. Four
constructs that are brand awareness, perceived quality, brand trust, brand loyalty are investigated by
CFA. The final measurement model of brand equity’s components in gold industry has 113 degrees of
freedom. The CFA results show that this model has an acceptable fit to the data [X2
(113) = 192.408, p
=.000; X2/df = 1.703 < 2; GFI = 0.904 > 0.9; CFI = 0.954 > 0.9; TLI = 0.945 > 0.9; RMSEA = 0.059 <
0.08]. Therefore, the scales of the components of brand equity are unidimensional (Steenkamp and Van
Trijp, 1991). Besides, all standardized factor loadings are substantial (≥ 0.5) and significant (p < 0.05)
except PQ5 (0.45) of the scale of perceived quality. However, this scale’s average standardized loading
is 0.67 which is over 0.5, thus, the scale’s convergence is likely accepted (Gerbing and Anderson, 1988).
Moreover, “the composite reliability is also an internal consistency reliability measure as evidence of
convergent validity computed from LISREL solutions” (Yoo et al., 2000, p. 204) or “variance extracted
estimates of 0.50 and above indicate convergent validity among items in a given scale” (Bagozzi and Yi,
1988, Fornell and Larcker, 1981; Atilgan et al., 2009, p. 124), they demonstrate that the composite
reliability and the variance extracted are also statistical indices as evidences of a scale’s convergent
validity. Basing on Table 2, factor loadings and these statements, the scales’ convergence is supported;
furthermore, the correlations among the components of brand equity are significantly below unity (p <
0.05), from 0.201 to 0.514, the scales’ discriminant validity is therefore supported (Steenkamp and Van
Trijp, 1991; Hair et al., 2006). For determining of the scales’ reliability, composite reliability (pc),
variance extracted (pvc), and Cronbach’s alpha coefficient (α) are calculated. The scales’ reliability is
supported when pc > 0.5 (Joreskog, 1971), pvc > 0.5 (Fornell and Larcker, 1981), and α > 0.6 (Nunnally
and Burnstein, 1994). The result of calculating of reliability is presented in Table 2.
Table 2: The results of evaluating reliability
Constructs
(Components) Composite Reliability
(pc) Variance extracted
(pvc) Cronbach’s alpha
(α)
Brand Awareness (BA) 0.859 0.655 0.846
Perceived Quality (PQ) 0.716 0.470 0.685
Brand Trust (BT) 0.817 0.600 0.805
Brand Loyalty (BL) 0.920 0.591 0.918
©Research Institute for Progression of Knowledge www.ripknet.org
81
The composite reliability and variance extracted are over 0.5 and Cronbach’α coefficient are over 0.6
except pvc(PQ) = 0.47, but pc(PQ) = 0.716, α(PQ) = 0.685, item-total correlations are over 0.3, at least 0.364
of PQ4. Thus, the scales’ reliability is considered to be accepted.
In summary, the validation of scales indicates that scales satisfy the requirements for constructs’
reliability and validity. Consequently, they are used to verify the structural model and hypotheses.
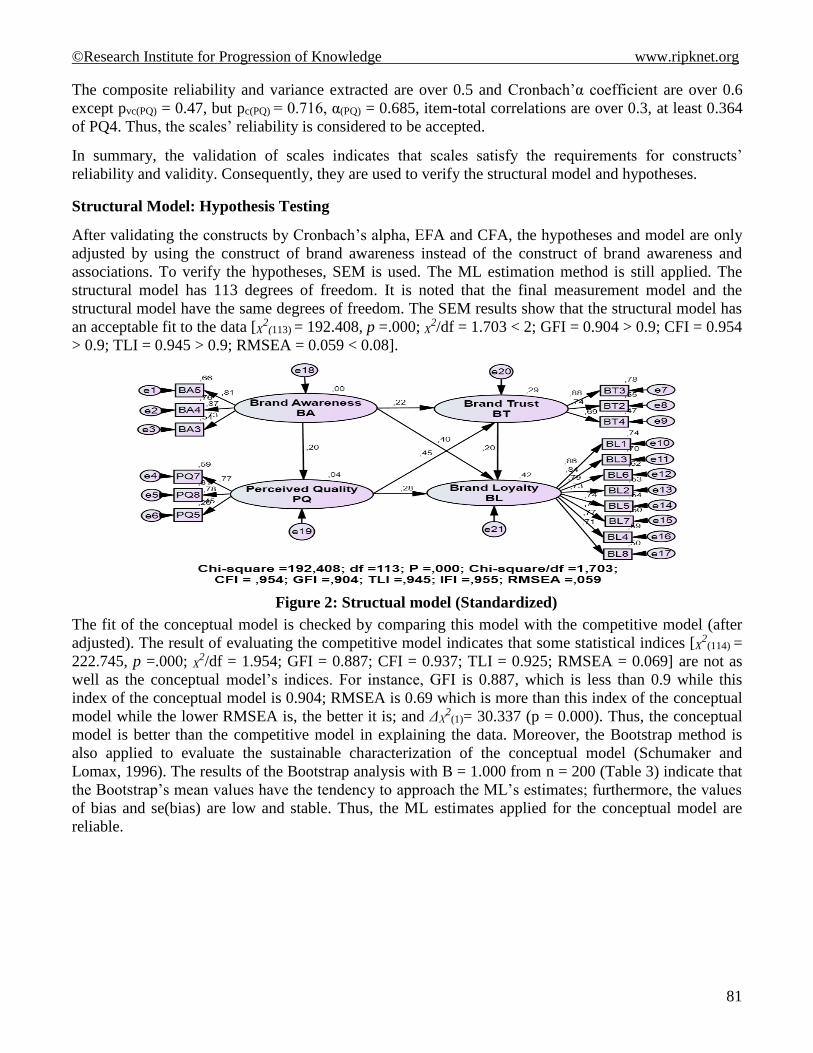
Structural Model: Hypothesis Testing
After validating the constructs by Cronbach’s alpha, EFA and CFA, the hypotheses and model are only
adjusted by using the construct of brand awareness instead of the construct of brand awareness and
associations. To verify the hypotheses, SEM is used. The ML estimation method is still applied. The
structural model has 113 degrees of freedom. It is noted that the final measurement model and the
structural model have the same degrees of freedom. The SEM results show that the structural model has
an acceptable fit to the data [X2
(113) = 192.408, p =.000; X
2/df = 1.703 < 2; GFI = 0.904 > 0.9; CFI = 0.954
> 0.9; TLI = 0.945 > 0.9; RMSEA = 0.059 < 0.08].
Figure 2: Structual model (Standardized)
The fit of the conceptual model is checked by comparing this model with the competitive model (after
adjusted). The result of evaluating the competitive model indicates that some statistical indices [X2
(114) =
222.745, p =.000; X2/df = 1.954; GFI = 0.887; CFI = 0.937; TLI = 0.925; RMSEA = 0.069] are not as
well as the conceptual model’s indices. For instance, GFI is 0.887, which is less than 0.9 while this
index of the conceptual model is 0.904; RMSEA is 0.69 which is more than this index of the conceptual
model while the lower RMSEA is, the better it is; and ΔΧ2
(1)= 30.337 (p = 0.000). Thus, the conceptual
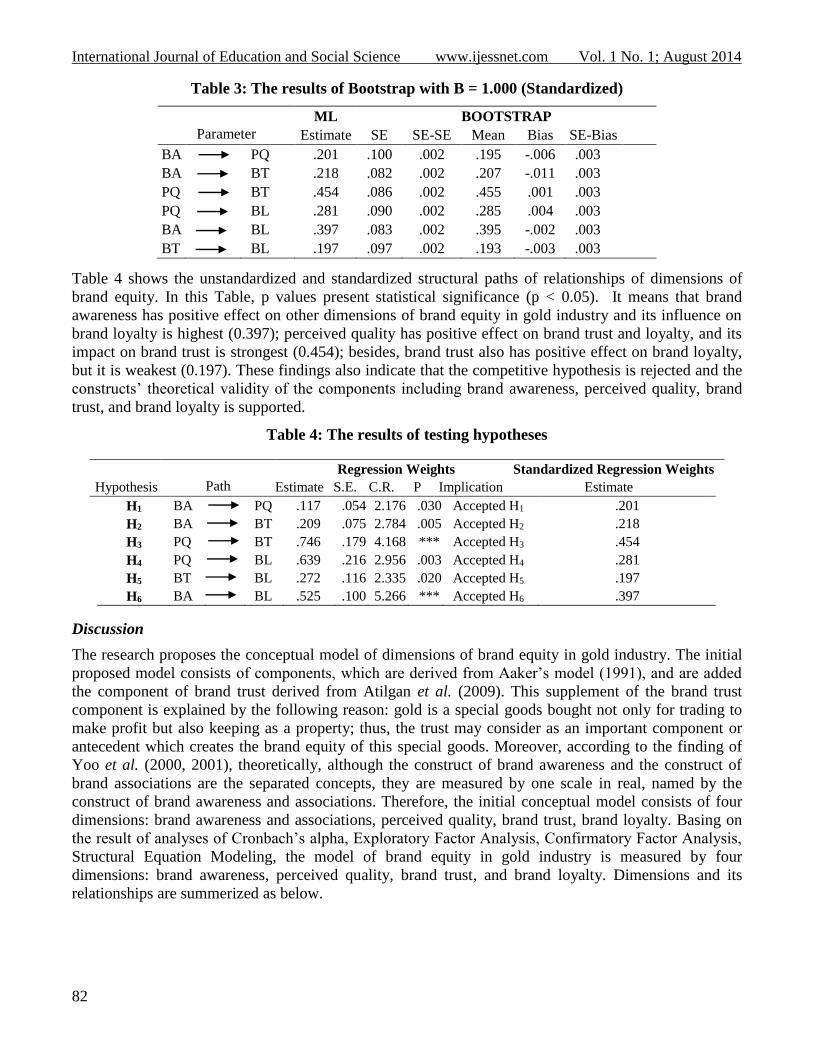
model is better than the competitive model in explaining the data. Moreover, the Bootstrap method is
also applied to evaluate the sustainable characterization of the conceptual model (Schumaker and
Lomax, 1996). The results of the Bootstrap analysis with B = 1.000 from n = 200 (Table 3) indicate that
the Bootstrap’s mean values have the tendency to approach the ML’s estimates; furthermore, the values
of bias and se(bias) are low and stable. Thus, the ML estimates applied for the conceptual model are
reliable.
International Journal of Education and Social Science www.ijessnet.com Vol. 1 No. 1; August 2014
82
Table 3: The results of Bootstrap with B = 1.000 (Standardized)
Parameter
ML BOOTSTRAP
Estimate SE SE-SE Mean Bias SE-Bias
BA PQ .201 .100 .002 .195 -.006 .003
BA BT .218 .082 .002 .207 -.011 .003
PQ BT .454 .086 .002 .455 .001 .003
PQ BL .281 .090 .002 .285 .004 .003
BA BL .397 .083 .002 .395 -.002 .003
BT BL .197 .097 .002 .193 -.003 .003
Table 4 shows the unstandardized and standardized structural paths of relationships of dimensions of
brand equity. In this Table, p values present statistical significance (p < 0.05). It means that brand
awareness has positive effect on other dimensions of brand equity in gold industry and its influence on
brand loyalty is highest (0.397); perceived quality has positive effect on brand trust and loyalty, and its
impact on brand trust is strongest (0.454); besides, brand trust also has positive effect on brand loyalty,
but it is weakest (0.197). These findings also indicate that the competitive hypothesis is rejected and the
constructs’ theoretical validity of the components including brand awareness, perceived quality, brand
trust, and brand loyalty is supported.
Table 4: The results of testing hypotheses
Path
Regression Weights Standardized Regression Weights
Hypothesis Estimate S.E. C.R. P Implication Estimate
H1 BA PQ .117 .054 2.176 .030 Accepted H1 .201
H2 BA BT .209 .075 2.784 .005 Accepted H2 .218
H3 PQ BT .746 .179 4.168 *** Accepted H3 .454
H4 PQ BL .639 .216 2.956 .003 Accepted H4 .281
H5 BT BL .272 .116 2.335 .020 Accepted H5 .197
H6 BA BL .525 .100 5.266 *** Accepted H6 .397
Discussion
The research proposes the conceptual model of dimensions of brand equity in gold industry. The initial
proposed model consists of components, which are derived from Aaker’s model (1991), and are added
the component of brand trust derived from Atilgan et al. (2009). This supplement of the brand trust
component is explained by the following reason: gold is a special goods bought not only for trading to
make profit but also keeping as a property; thus, the trust may consider as an important component or
antecedent which creates the brand equity of this special goods. Moreover, according to the finding of
Yoo et al. (2000, 2001), theoretically, although the construct of brand awareness and the construct of
brand associations are the separated concepts, they are measured by one scale in real, named by the
construct of brand awareness and associations. Therefore, the initial conceptual model consists of four
dimensions: brand awareness and associations, perceived quality, brand trust, brand loyalty. Basing on
the result of analyses of Cronbach’s alpha, Exploratory Factor Analysis, Confirmatory Factor Analysis,
Structural Equation Modeling, the model of brand equity in gold industry is measured by four
dimensions: brand awareness, perceived quality, brand trust, and brand loyalty. Dimensions and its
relationships are summerized as below.

©Research Institute for Progression of Knowledge www.ripknet.org
83
Figure 3: The model of brand equity in gold industry
The finding shows that the construct of brand awareness and associations in the initial proposed model is
replaced by the construct of brand awareness because some items measuring the dimension of brand
associations of the construct of brand awareness and associations are eliminated when validating
measures. Moreover, the theoretical model found is also different from some previous researchers’
model of brand equity. For instance, the dimension of brand associations which is proposed by Atilgan
et al. (2009) is replaced by the dimension of brand awareness; the dimension of brand associations
proposed by Aaker (1991, 1996) is replaced by the dimension of brand trust; or the dimension of brand
image proposed by Yoo et al. (2000, 2001), Villarejo-Ramos and Sanchez-Franco (2005) is also
replaced by the dimension of brand trust.
However, basing on the relative literatures and findings, the difference is supported. It means that the
model of brand equity depends on the type of product that it is used to verify. Moreover, some causal
relationships between four dimensions of brand equity are also found, for instance, brand awareness
impacts positively on perceived quality (λ = 0.201, p = 0.030), brand trust (λ = 0.218, p = 0.005) and
brand loyalty (λ = 0.397, p = 0.000); perceived quality has positive effects on brand trust (λ = 0.454, p =
0.000) and brand loyalty (λ = 0.281, p = 0.003); and brand trust is positively related to brand loyalty (λ =
0.197, p = 0.020). In other hand, this research also builds scales of dimensions of brand equity. These
scales are reliable, unidimensional and they have convergent, discriminant and theoretical validity; for
instance, the scale of brand awareness or perceived quality or brand trust is measured by three items for
each one, the scale of brand loyalty is measured by eight items.
Implications
Theoretical Implications
This study contributes to the under-investigating area of marketing by adding the model of brand equity
that is investigated in gold industry at an emerging market as Vietnam. Furthermore, it also explores
relationships of dimensions of brand equity. The scales of dimensions are verified rigorously. Moreover,
the methodology and the process applied for this research have a valid reference meaning for those who
are interested in this field.
Managerial Implications
The model of brand equity built can be used as a reliable reference resource for government officials in
building some policies relating gold in order to develop gold market. Some solutions are suggested, such
as building detail gold standards and management policies, then communicate them popularly;
encouraging and supporting companies in investing to build brands of gold by marketing mix from
reasonable policies; reducing barriers to develop the gold market’s operation, especially for retailers.
Besides, this research results suggest that managers of gold brands should recognize the differences
between model of brand equity in gold industry and other industries to design reasonable strategies of
communication for enhancing effectiveness of building gold brands.
Brand Awareness
Brand Loyalty
Brand Trust
Perceived Quality
International Journal of Education and Social Science www.ijessnet.com Vol. 1 No. 1; August 2014
84
Conclusion
This research built the theoretical model of customer-based brand equity in gold industry consisting of
four components: brand awareness, perceived quality, brand trust, brand loyalty. These components’
scales are reliable and unidimensional. Furthermore, they also obtain convergent, discriminant and
theoretical validity. The finding also has some differences from previous researches, it is therefore
believed to have significant supplements to marketing literature. Nevertheless, the research itself
contains some limitations. First, the data is only collected in the southern region of Vietnam. Second, the
research object is only the SJC gold although it is a national gold brand of Vietnam. It is therefore
necessary to be further tested by other gold brands or regions for increasing the theoretical model’s
generalizability proposed. Besides, this research has not examined the antecedences of brand equity yet,
thus it is recommended for further research studying on the impact of some factors, especial elements of
marketing and macro environments, on dimensions of brand equity.
References
Aaker, D.A. (1991), Managing Brand Equity, The Free Press, New York, NY.
Aaker, D.A. (1996), Building Strong Brands, The Free Press, New York, NY.
Atilgan, E., Akinci, S., Aksoy, S. and Kaynak, E. (2009), “Customer – Based Brand Equity for Global
Brands: A Multinational Approach”, Journal of Euromarketing, Vol. 18, pp. 115-132.
Bagozzi, R.P. and Yi, Y. (1988), “On the evaluation of structural equation models”, Journal of the
Academic of Marketing Science, Vol. 16 No. 1, pp. 74-95.
Bentler, P.M. and Bonett, D.G. (1980), “Significance tests and goodness of fit in the analysis of
covariance structures”, Psychological Bulletin, Vol. 88 No. 3, pp. 588-606.
Carmines, E. and McIver, J. (1981), Analyzing models with unobserved variables: analysis of
covariance, Sage Publications, CA.
Chaudhuri, A. and Holbrook, M.B. (2001), “The chain of effects from brand trust and brand affect to
brand performance: The role of brand loyalty”, Journal of Marketing, Vol. 65 No. 2, pp. 81-94.
Cobb-Walgren ,C.J, Ruble, C.A. and Donthu, N. (1995), “Brand Equity, Brand Preference, and Purchase
Intent”, Journal of Advertising, Vol. 24 (fall): 25-40.
Deliya, M. (2012), “Consumer Behavior Towards The New Packaging Of FMCG Products”, National
Monthly Refereed Journal of Research in Commerce & Management, Vol. 1 No. 11, pp. 199-
211.
Fornell, C. and Larker, D.F. (1981), “Evaluating structural equation models with unobservable variables
and measurement error”, Journal of Mark Research, Vol. 18 (02/1981), pp. 39-50.
Gerbing, W.D. and Anderson, J.C. (1988), “An update paradism for scale development incorporating
unidimensionality and its assessments”, Journal of Marketing Research, Vol. 25 No. 2, pp. 186-
192.
Hair, Black, Babin, Anderson and Tatham (2006), Multivariate Data Analysis, Prentice Hall, NJ.
Jabnoun, N. and Al-Tamimi, H.A.H. (2003), “Measuring perceived quality at UAE commercial banks”,
International Journal of Quality and Reliability Management, Vol. 20 No. 4, pp. 458-472.
Joreskog,K.G.(1971), “Statistical analysis of sets of congeneric tests”, Psychometrica, Vol. 36 No. 2, pp.
109-133.
Keller, K.L. (1993), “Conceptualizing, Measuring, and Managing Custommer-Based Brand Equity”,
Journal of Marketing, Vol. 57 (01/1993), pp. 1-22.
Keller, K.L. (1998), Strategic Brand Management: Building, Measuring and Managing Brand Equity,
Prentice Hall, NJ.
©Research Institute for Progression of Knowledge www.ripknet.org
85
Kim, H.B. and Kim, W.G. (2005), “The relationship between brand equity and firms’ performance in
luxury hotels and cain restaurants”, Tourism Management, Vol. 26, pp. 549-560.
Lassar, W., Mittal, B. and Sharma, A. (1995), “Measuring Customer – Based Brand Equity”, Journal of
Consumer Marketing, Vol. 12 No. 4, pp. 11-19.
Le, L.D. (2013), “Impacts of Advertising and Sales Promotion on Brand Equity of Soft Drinks”, Journal
of Economic Development, Vol. 216 (4/2013), pp. 131-145 (in Vietnamese).
Madhavaram, S., Badrinarayanan, V. and McDonald, R.E. (2005), “Integrated Marketing
Communication and Brand Identify as Critical Components of Brand Equity Strategy: A
Conceptual Framework and Research Proposition”, Journal of Advertising, Vol. 34 No. 4, pp.
69-80.
Mahajan, V., Rao, V.V. and Srivastara, R.K. (1994), “An Approach to Assess the Importance of Brand
Equity in Acquisition Decisions”, Journal of Product Innovation Management, Vol. 11 No. 3, pp.
221-235.
Nguyen, T.D. and Nguyen, T.T.M. (2002), Conceptualization and Measurement of Brand Equity in
Vietnam, Research Report No. B2002-22-33, HCMC University of Economics, HCM City (in
Vietnamese).
Nguyen, T.D., Barret, N.J. and Miller, K.E. (2011), “Brand loyalty in emerging markets”, Marketing
Intelligence & Planning, Vol. 29 No. 3, pp. 222-232.
Nunnally, J.C. and Bernstein, I.H. (1994), Psychometric Theory, McGraw-Hill, New York, NY.
Simon, C.J. and Sullivan, M.W. (1993), “The Measuarement and determinants of Brand Equity: A
Financial Approach”, Marketing Science, Vol. 12 (Winter), pp. 28-52.
Steenkamp and Van Trijp (1991), “The use of LISREL in validating marketing constructs”, International
Journal of Research in Marketing, Vol. 8 No. 4, pp. 283-299.
Steiger, J.H. (1990), “Structural Modeling Evaluation and Modification: An Interval Estimation
Approach”, Multivariate Behavioral Research, Vol. 25, pp.173-180.
Villarejo-Ramos, A.F. and Sanchez-Franco, M.J. (2005), “The Impact of Marketing Communication and
Price Promotion on Brand Equity”, Journal of Brand Management, Vol. 12 No. 6, pp. 431-444.
Yoo, B., Donthu, N. and Lee, S. (2000), “An Examination of Selected Marketing Mix Elements and
Brand Equity”, Journal of the Academy of Marketing Science, Vol. 28 No. 2, pp. 195-211.
Yoo, B. and Donthu, N. (2001), “Developing and Validating a Multidimensional Consumer-Based
Brand Equity Scale”, Journal of Business Research, Vol. 52, pp. 1-14.