Dimension reduction (1) Overview PCA Factor Analysis EDR space SIR References: Applied Multivariate...
38
Dimension reduction (1) Overview PCA Factor Analysis EDR space SIR ferences: plied Multivariate Analysis. tp://www.stat.ucla.edu/~kcli/sir-PHD.pdf
-
Upload
claire-potter -
Category
Documents
-
view
221 -
download
0
Transcript of Dimension reduction (1) Overview PCA Factor Analysis EDR space SIR References: Applied Multivariate...
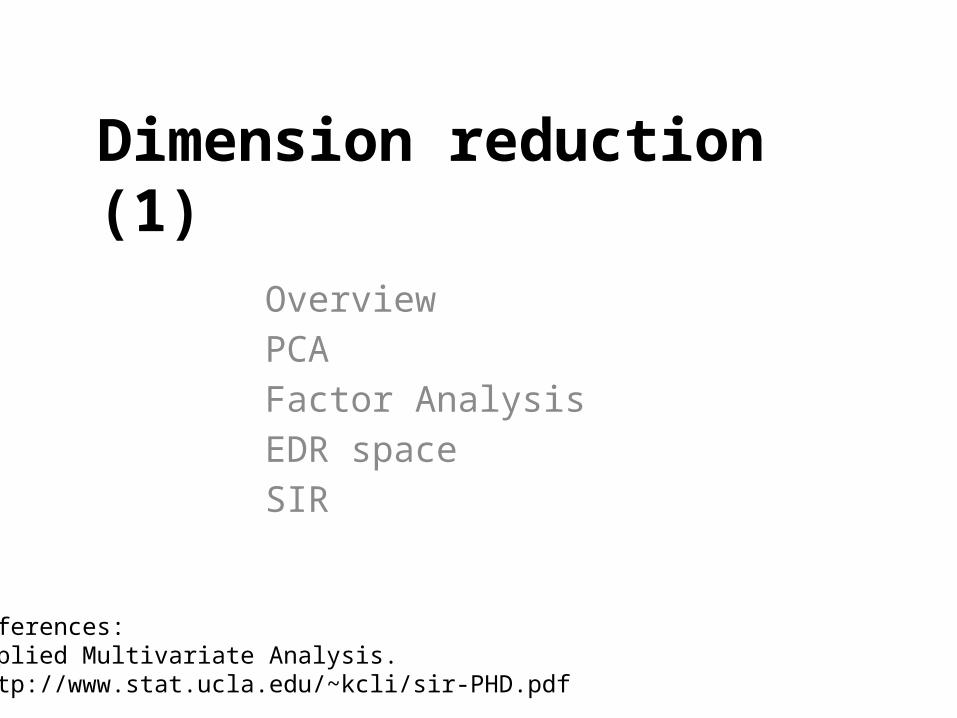
Dimension reduction (1)
OverviewPCAFactor AnalysisEDR spaceSIR
References: Applied Multivariate Analysis.http://www.stat.ucla.edu/~kcli/sir-PHD.pdf
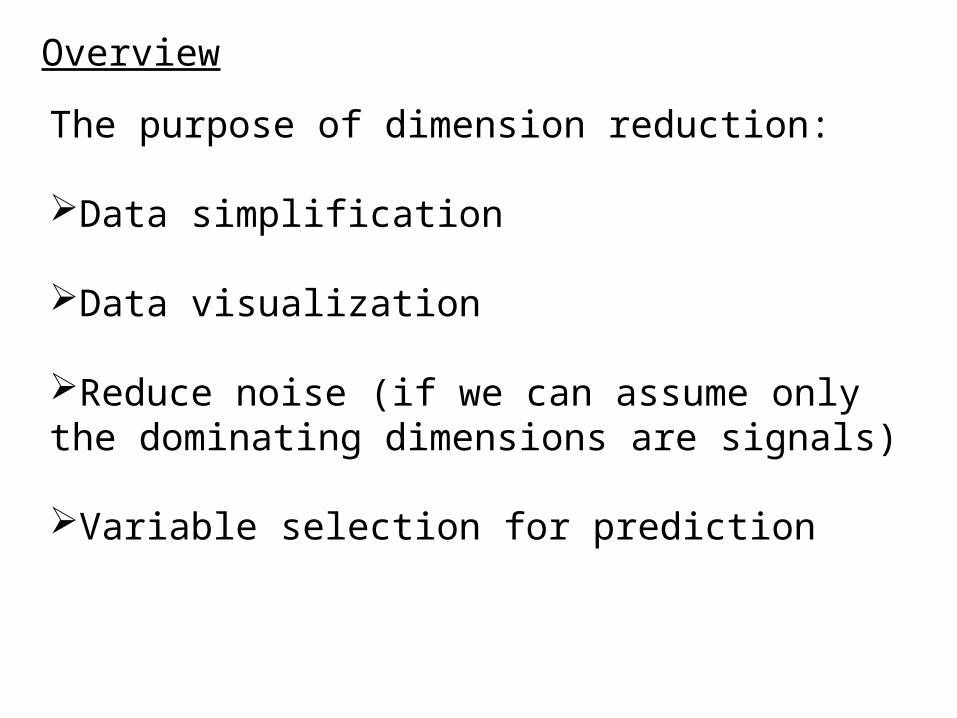
Overview
The purpose of dimension reduction:
Data simplification
Data visualization
Reduce noise (if we can assume only the dominating dimensions are signals)
Variable selection for prediction
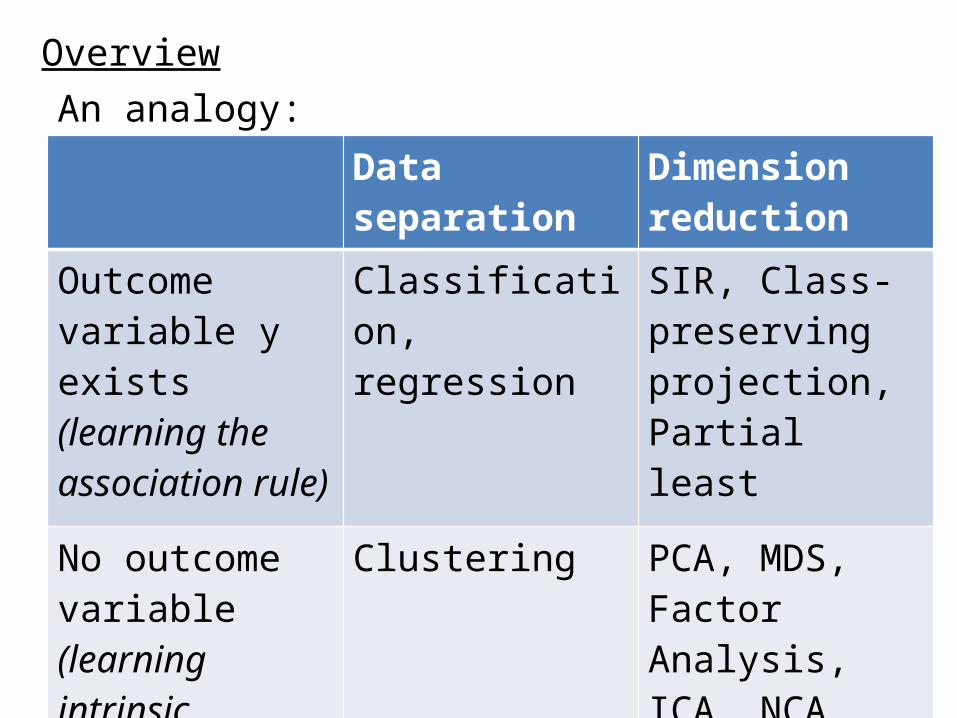
Overview
Data separation Dimension reduction
Outcome variable y exists (learning the association rule)
Classification, regression
SIR, Class-preserving projection, Partial least squares
No outcome variable (learning intrinsic structure)
Clustering PCA, MDS, Factor Analysis, ICA, NCA…
An analogy:
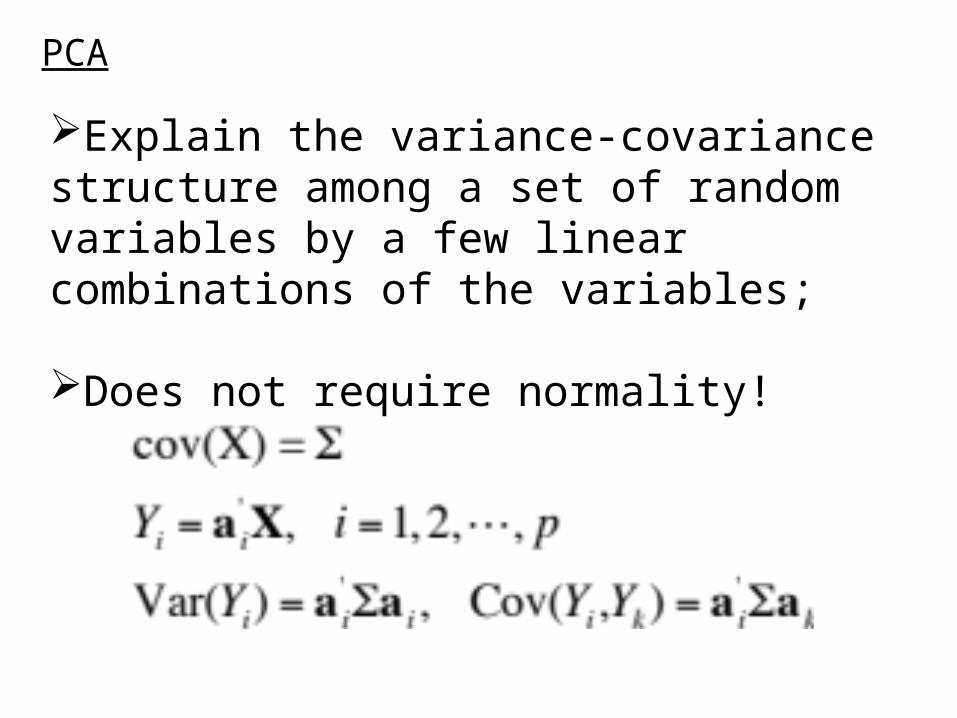
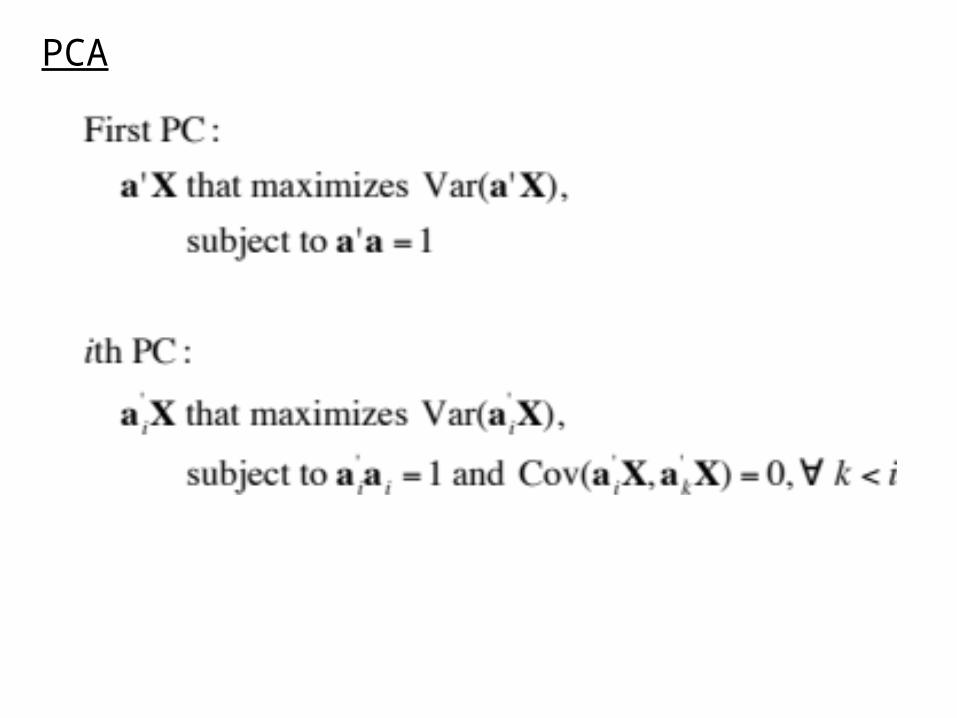
PCA
Explain the variance-covariance structure among a set of random variables by a few linear combinations of the variables;
Does not require normality!
PCA
PCA
7
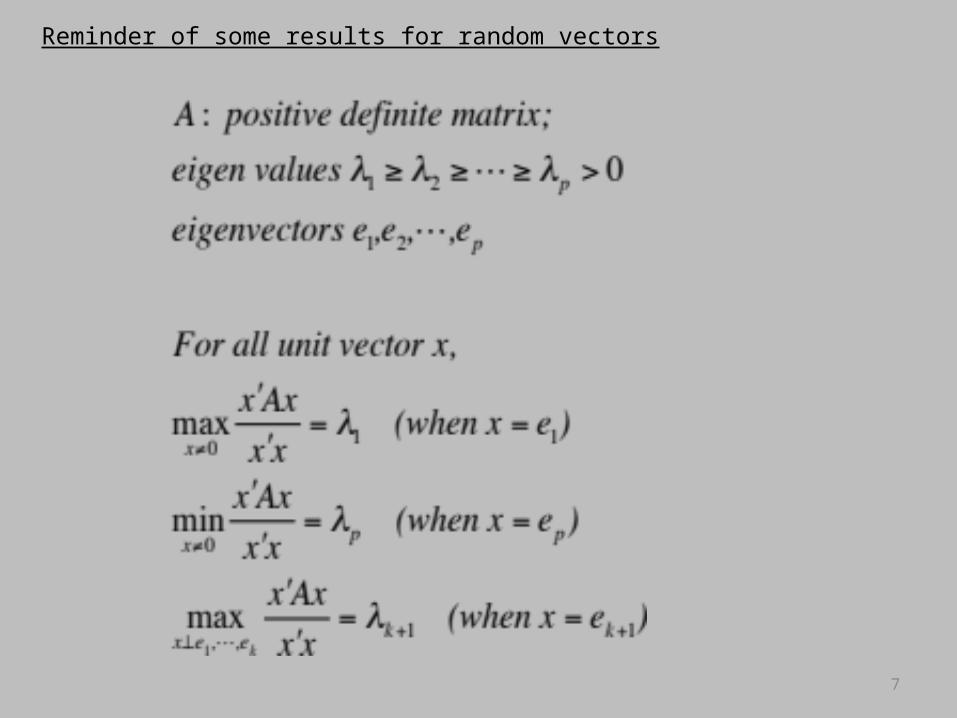
Reminder of some results for random vectors
8
A1/2 P1/2 P ,
y P x
x Axx x
x A1/2 A1/2 x
x P P x
x P1/2 P P1/2 P xy y
y yy y
iy i
2
i1
p
y i2
i1
p
1
y i2
i1
p
y i2
i1
p
1
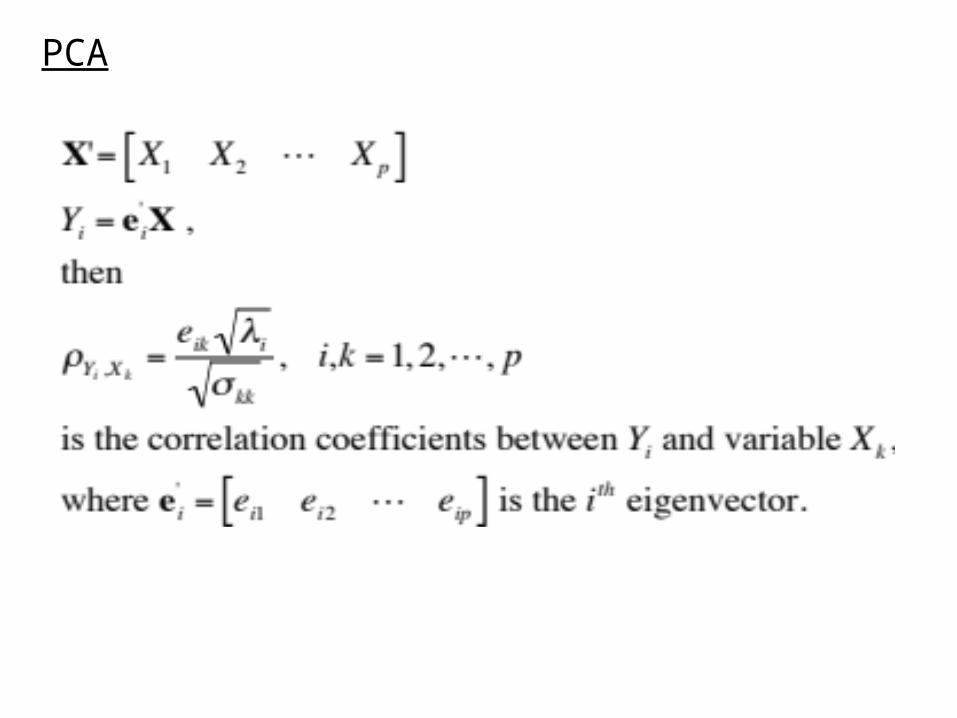
x e1, y (Pe1 ) [10 0],y yy y
1 e1Ae1
e1e1
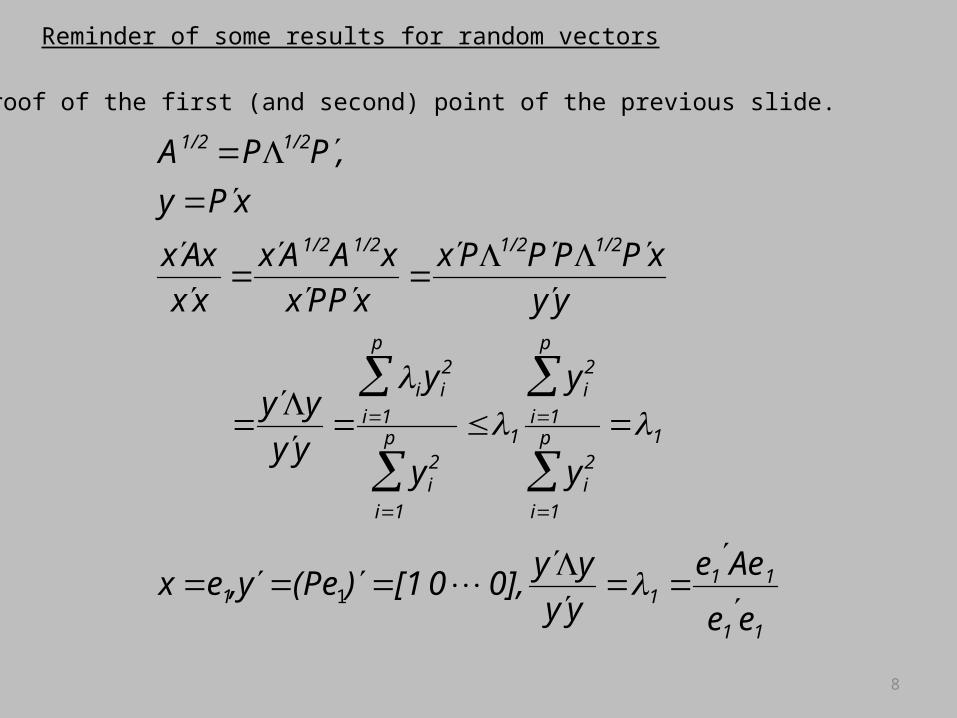
Reminder of some results for random vectors
Proof of the first (and second) point of the previous slide.
PCA
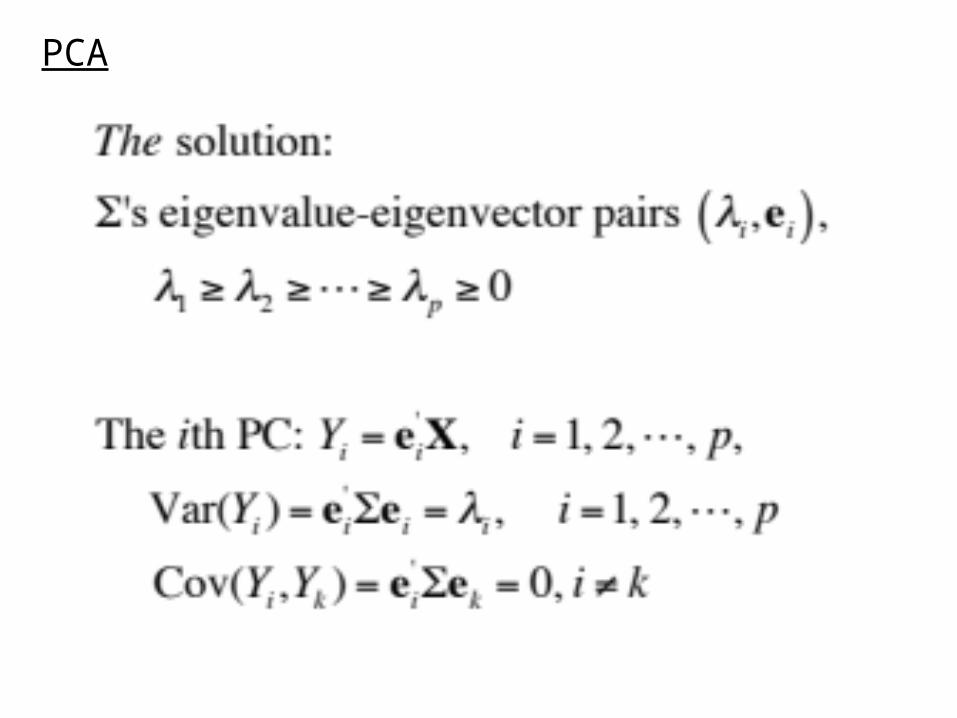
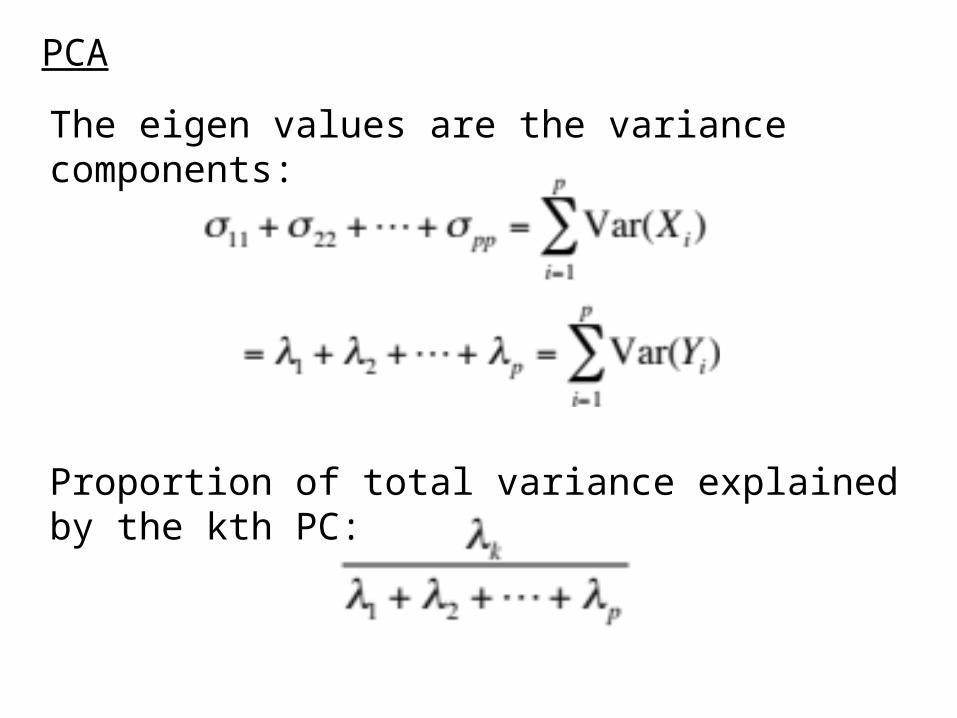
The eigen values are the variance components:
Proportion of total variance explained by the kth PC:
PCA
PCA
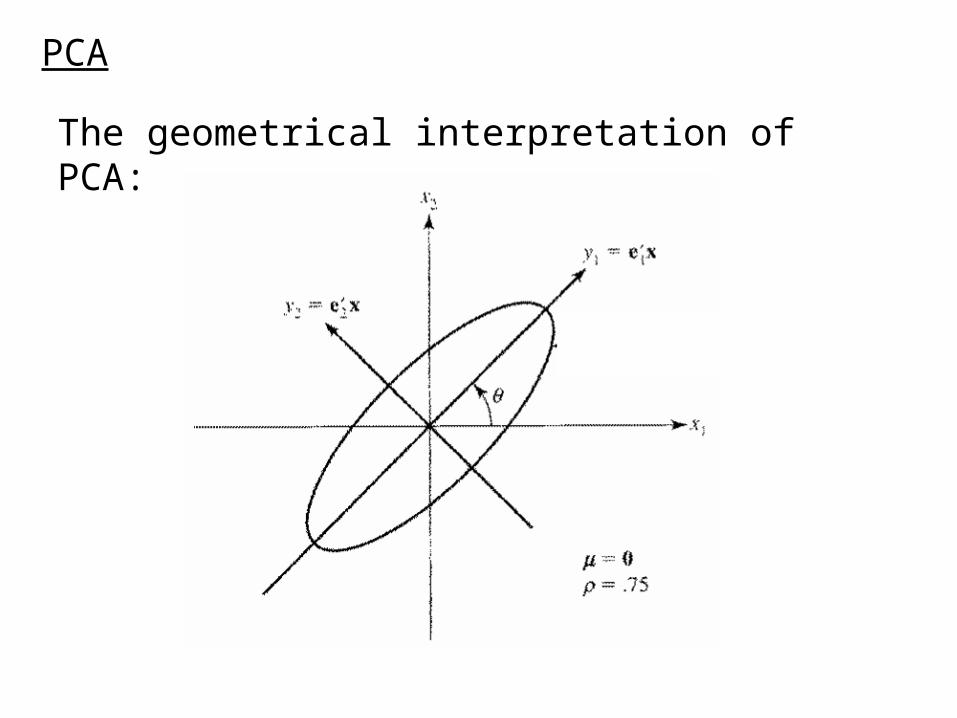
The geometrical interpretation of PCA:
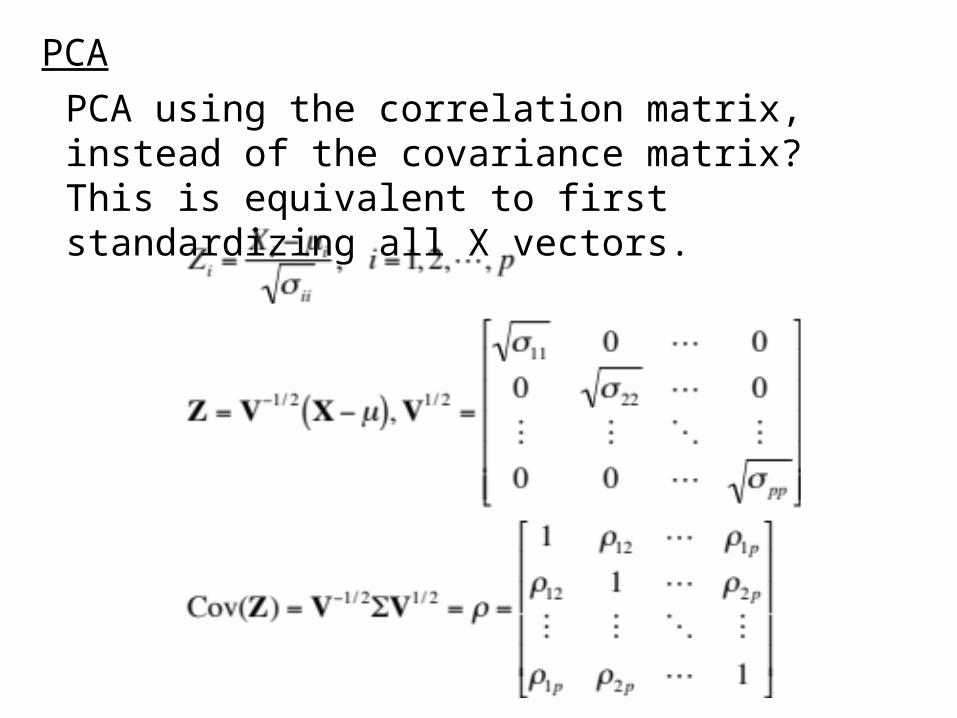
PCA using the correlation matrix, instead of the covariance matrix?This is equivalent to first standardizing all X vectors.
PCA
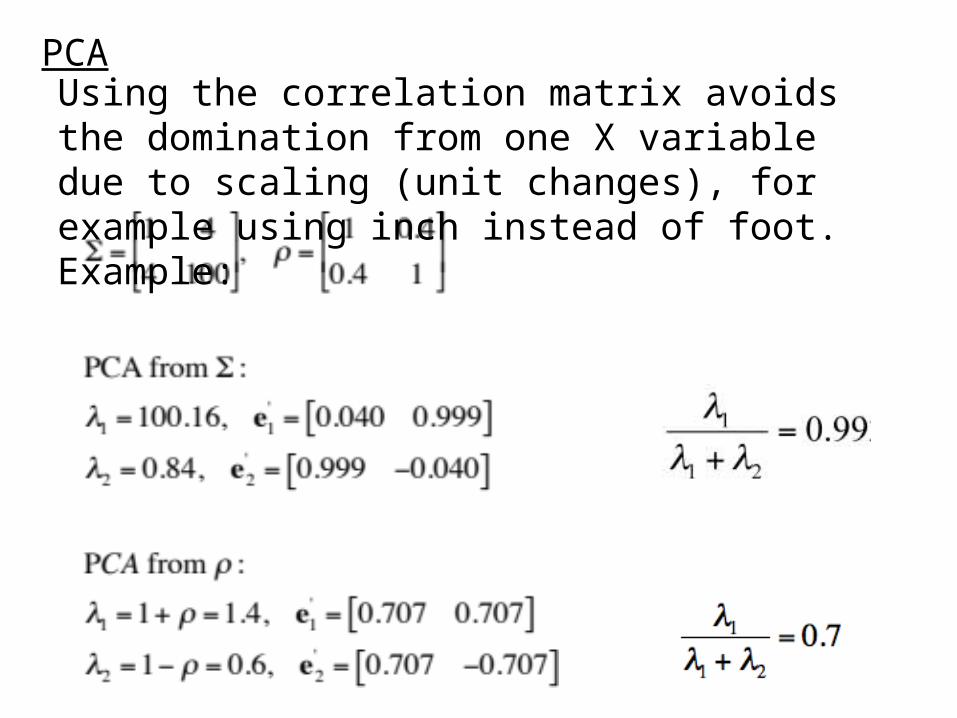
Using the correlation matrix avoids the domination from one X variable due to scaling (unit changes), for example using inch instead of foot. Example:
PCA
PCA
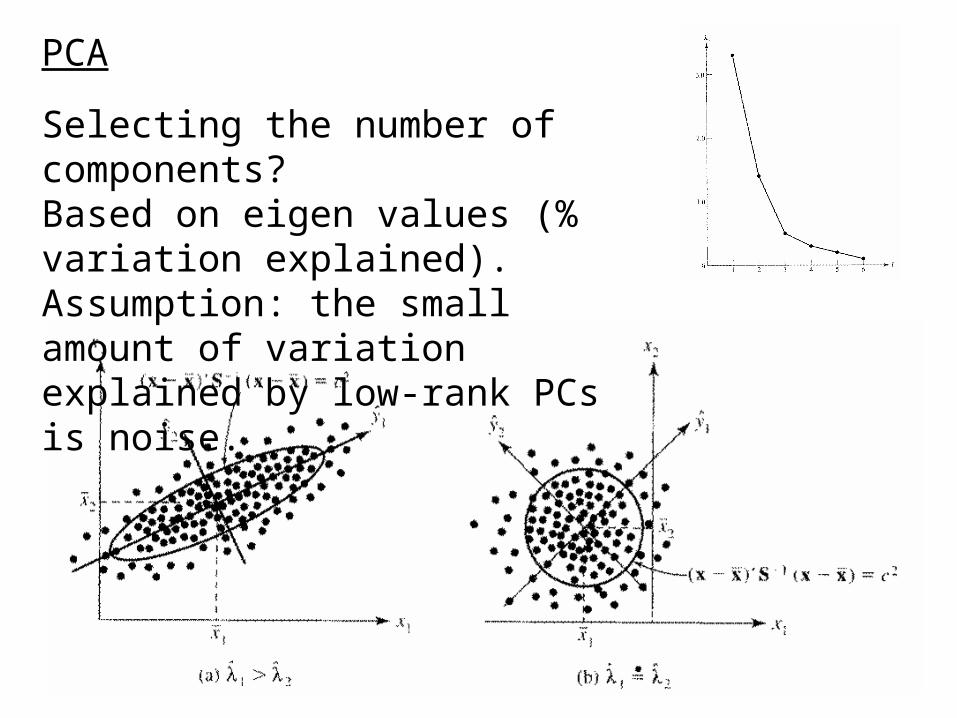
Selecting the number of components?Based on eigen values (% variation explained). Assumption: the small amount of variation explained by low-rank PCs is noise.
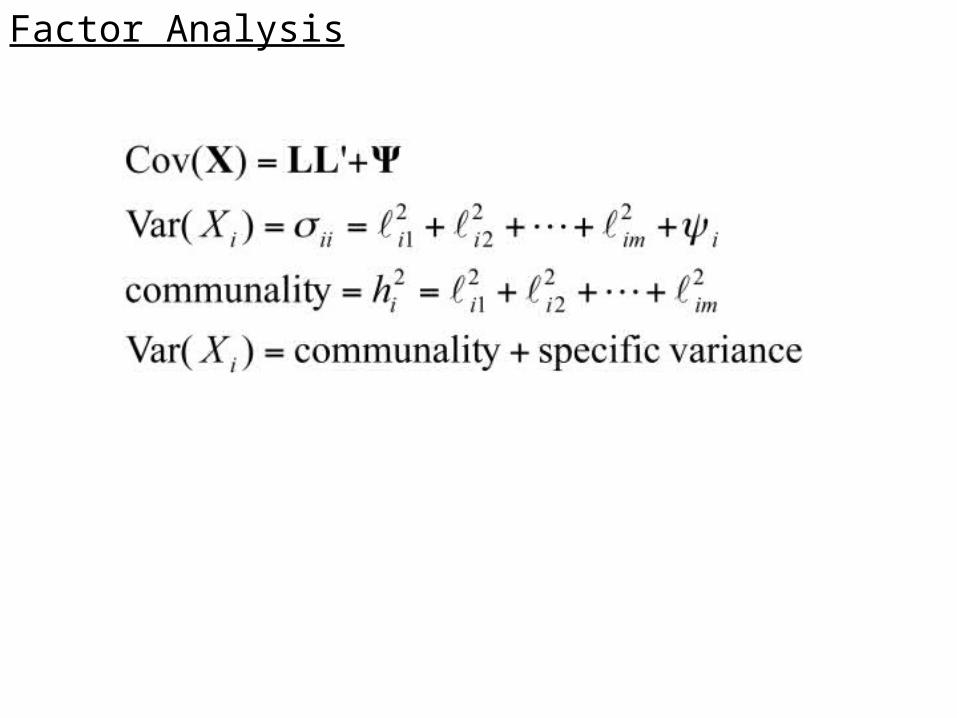
Factor Analysis
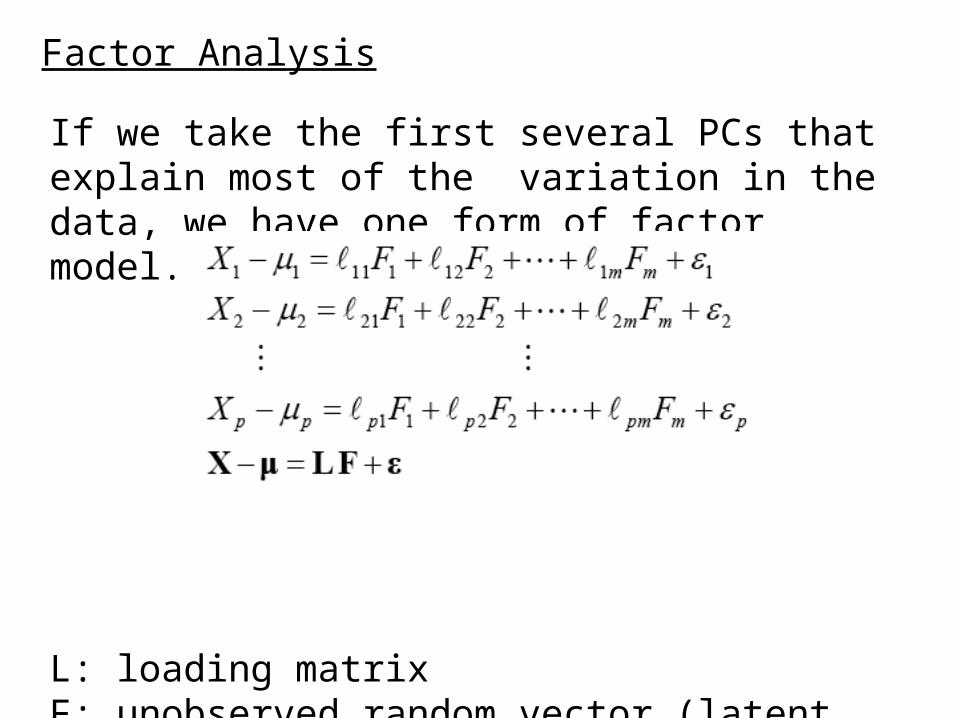
If we take the first several PCs that explain most of the variation in the data, we have one form of factor model.
L: loading matrixF: unobserved random vector (latent variables).ε: unobserved random vector (noise)
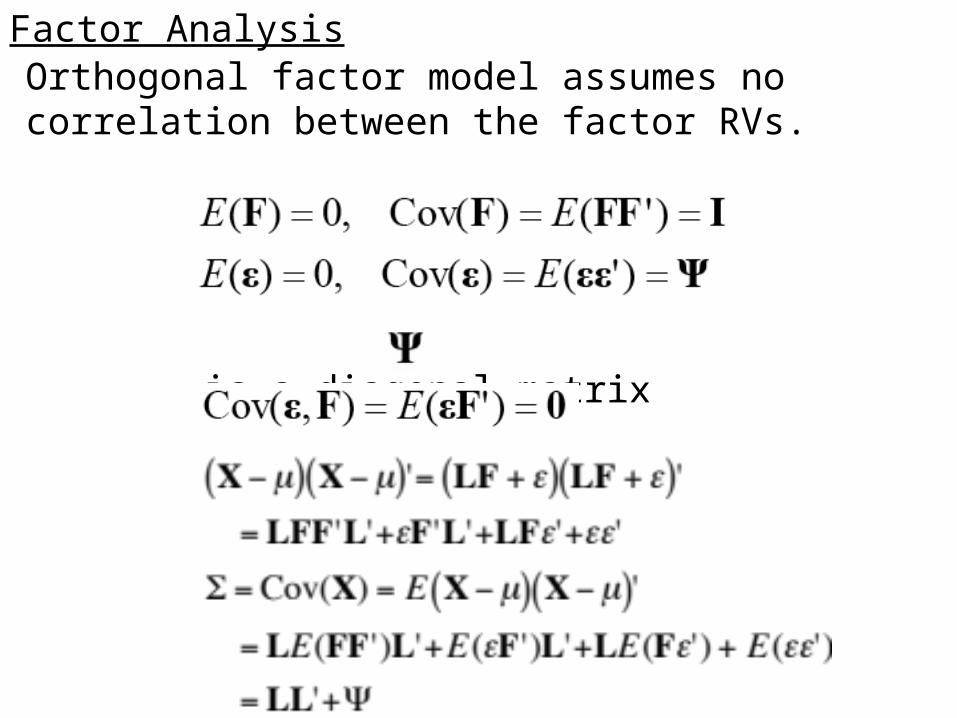
Factor AnalysisOrthogonal factor model assumes no correlation between the factor RVs.
is a diagonal matrix
Factor Analysis
Factor Analysis
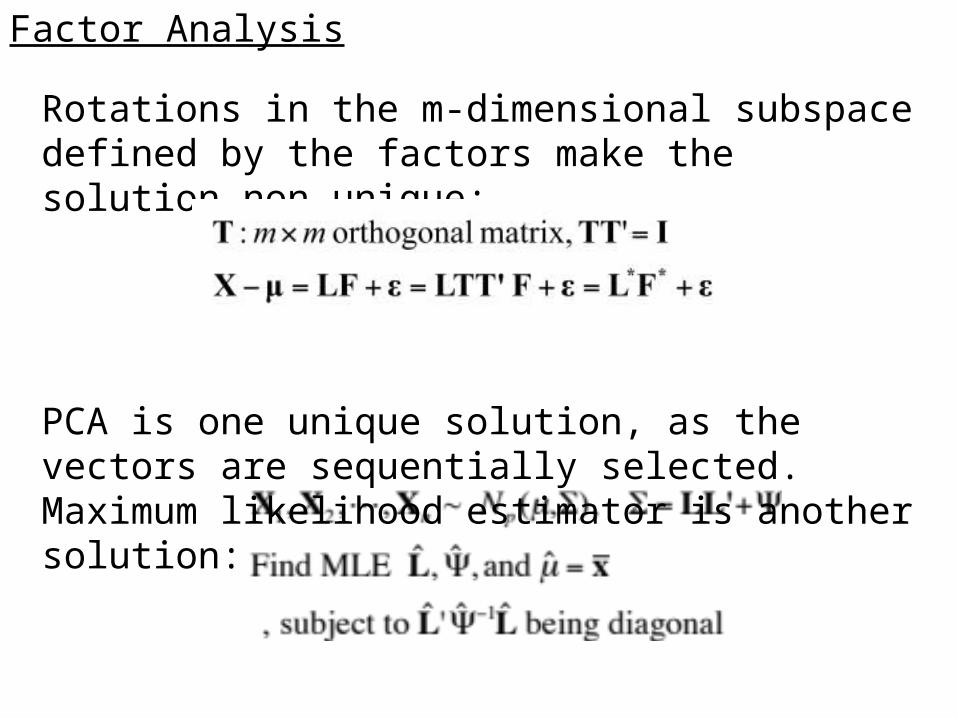
Rotations in the m-dimensional subspace defined by the factors make the solution non-unique:
PCA is one unique solution, as the vectors are sequentially selected. Maximum likelihood estimator is another solution:
Factor Analysis
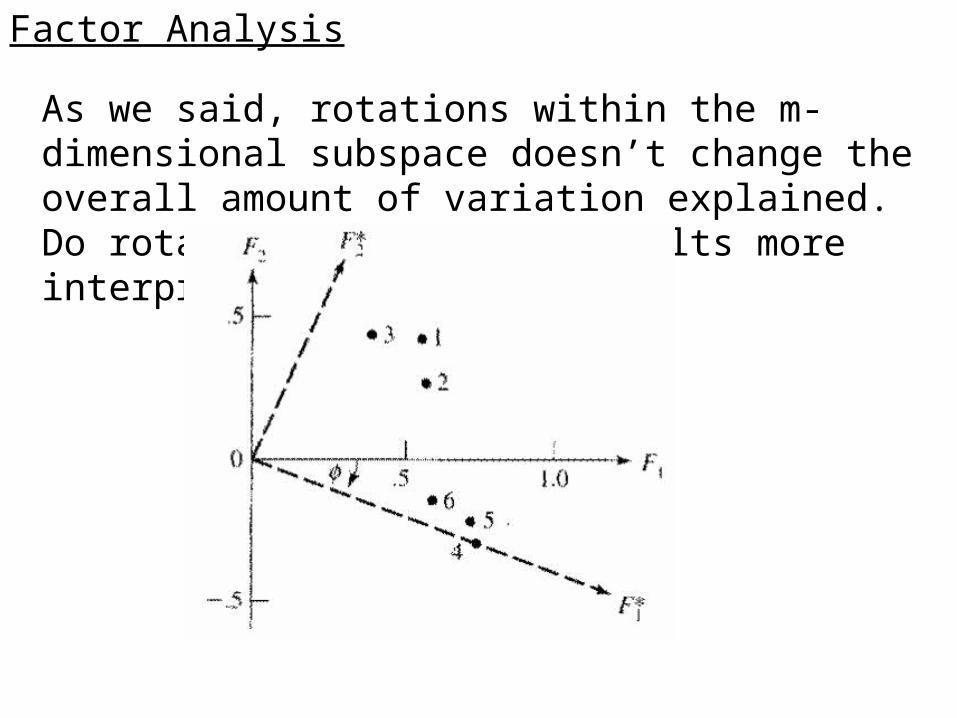
As we said, rotations within the m-dimensional subspace doesn’t change the overall amount of variation explained. Do rotation to make the results more interpretable:
Factor Analysis
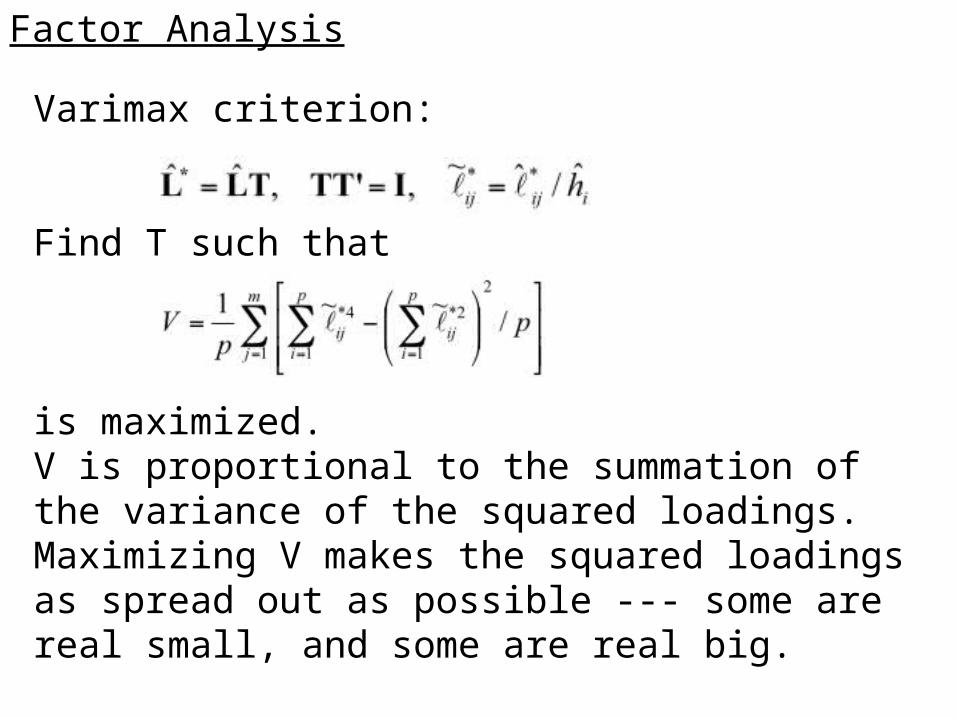
Varimax criterion:
Find T such that
is maximized.V is proportional to the summation of the variance of the squared loadings. Maximizing V makes the squared loadings as spread out as possible --- some are real small, and some are real big.
21
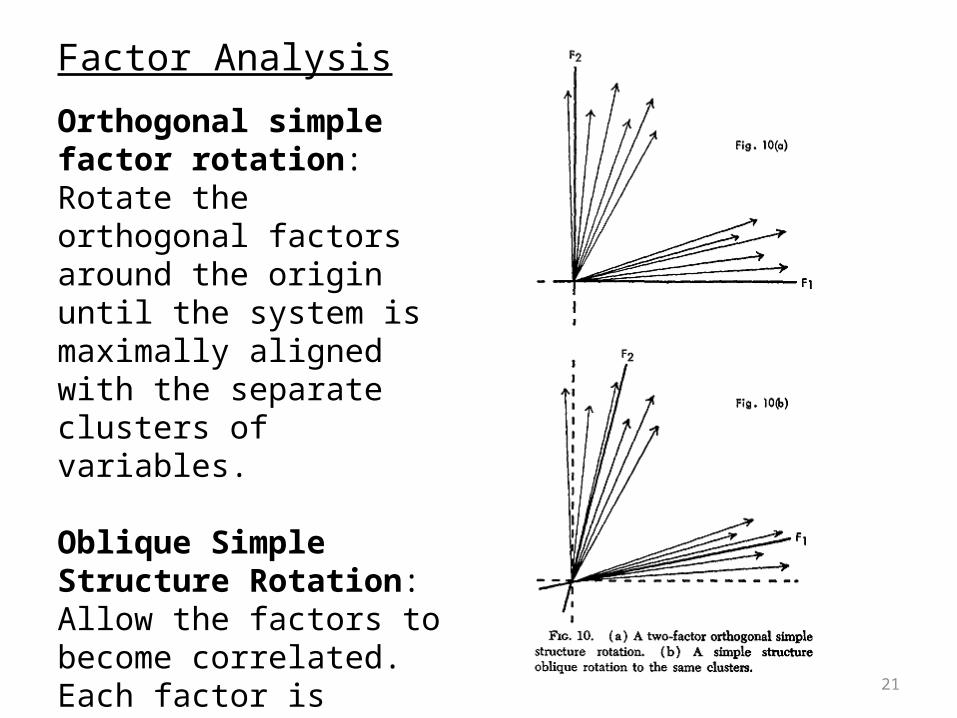
Orthogonal simple factor rotation: Rotate the orthogonal factors around the origin until the system is maximally aligned with the separate clusters of variables.
Oblique Simple Structure Rotation:Allow the factors to become correlated. Each factor is rotated individually to fit a cluster.
Factor Analysis
MDS
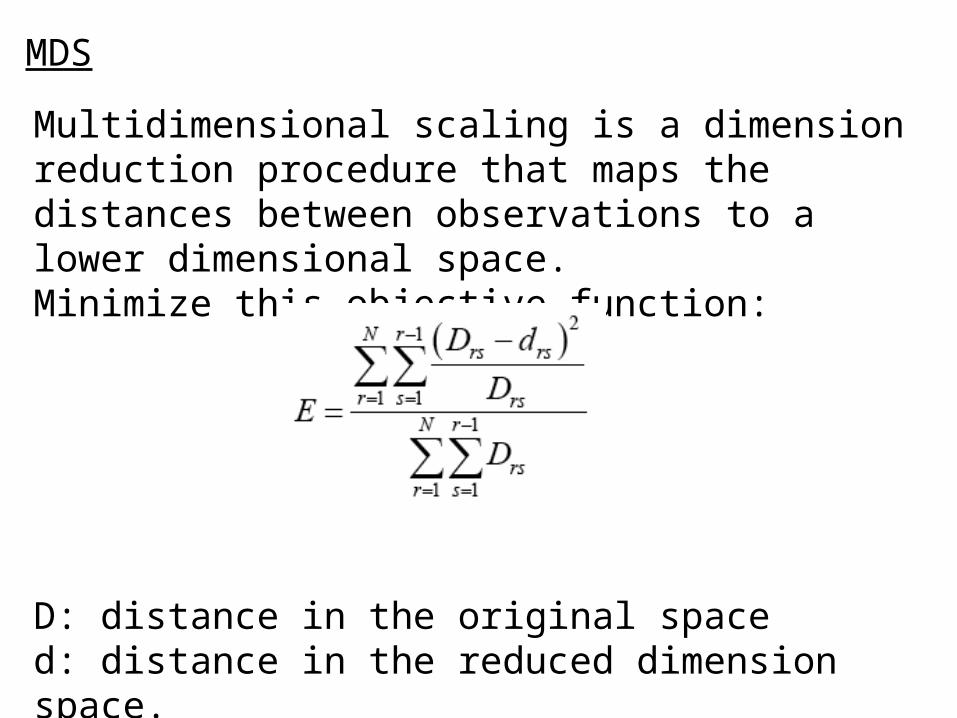
Multidimensional scaling is a dimension reduction procedure that maps the distances between observations to a lower dimensional space.Minimize this objective function:
D: distance in the original spaced: distance in the reduced dimension space.Numerical method is used for the minimization.
EDR space
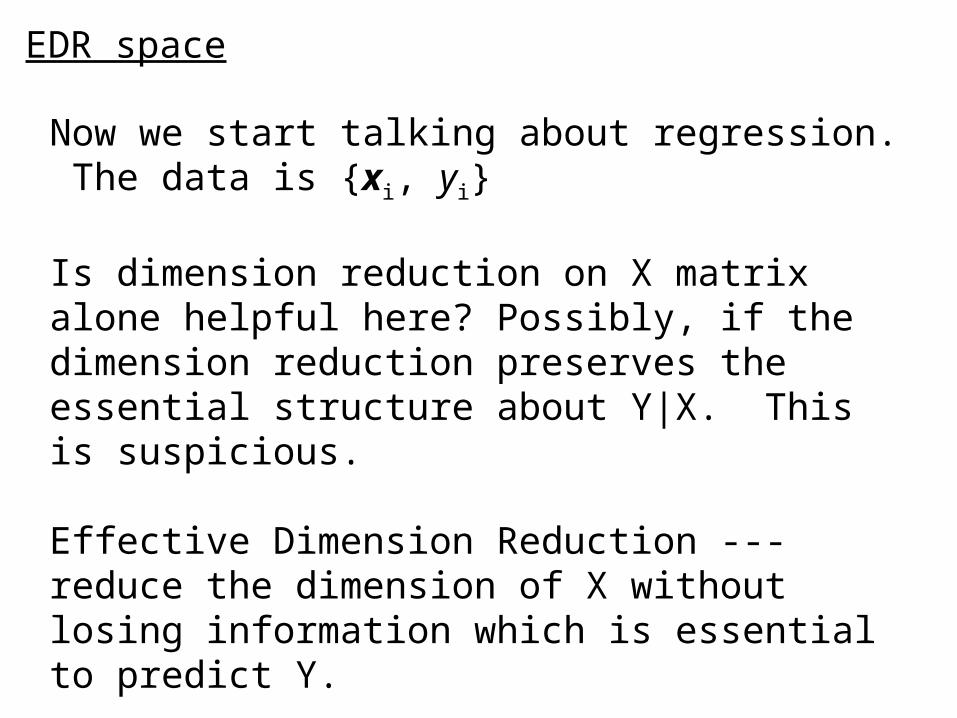
Now we start talking about regression. The data is {xi, yi}
Is dimension reduction on X matrix alone helpful here? Possibly, if the dimension reduction preserves the essential structure about Y|X. This is suspicious.
Effective Dimension Reduction --- reduce the dimension of X without losing information which is essential to predict Y.
EDR space
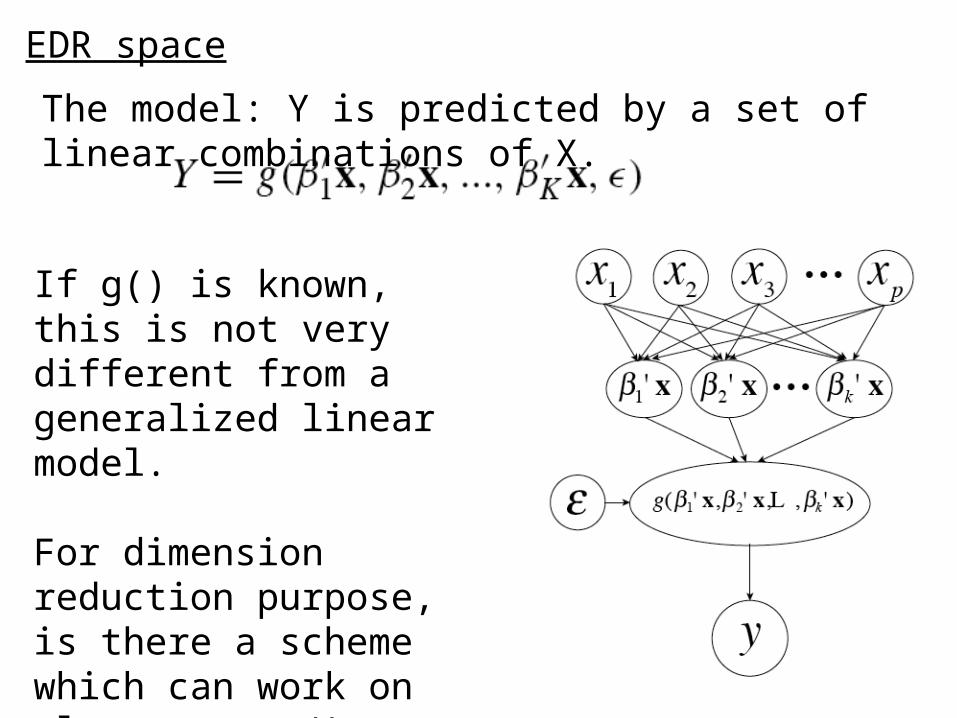
The model: Y is predicted by a set of linear combinations of X.
If g() is known, this is not very different from a generalized linear model.
For dimension reduction purpose, is there a scheme which can work on almost any g(), without knowledge of its actual form?
EDR space
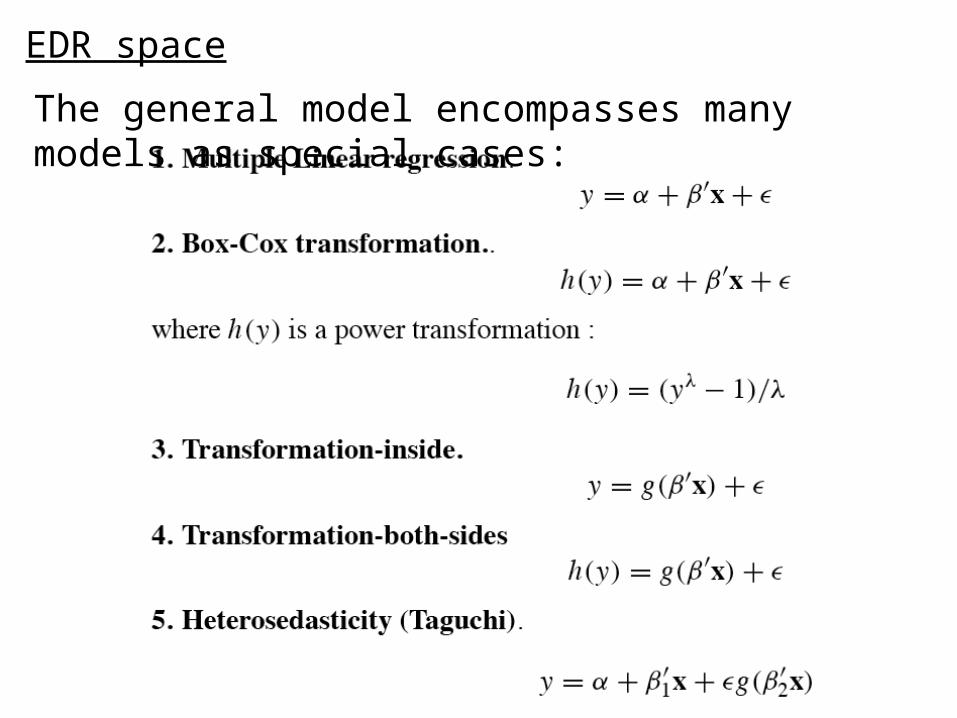
The general model encompasses many models as special cases:
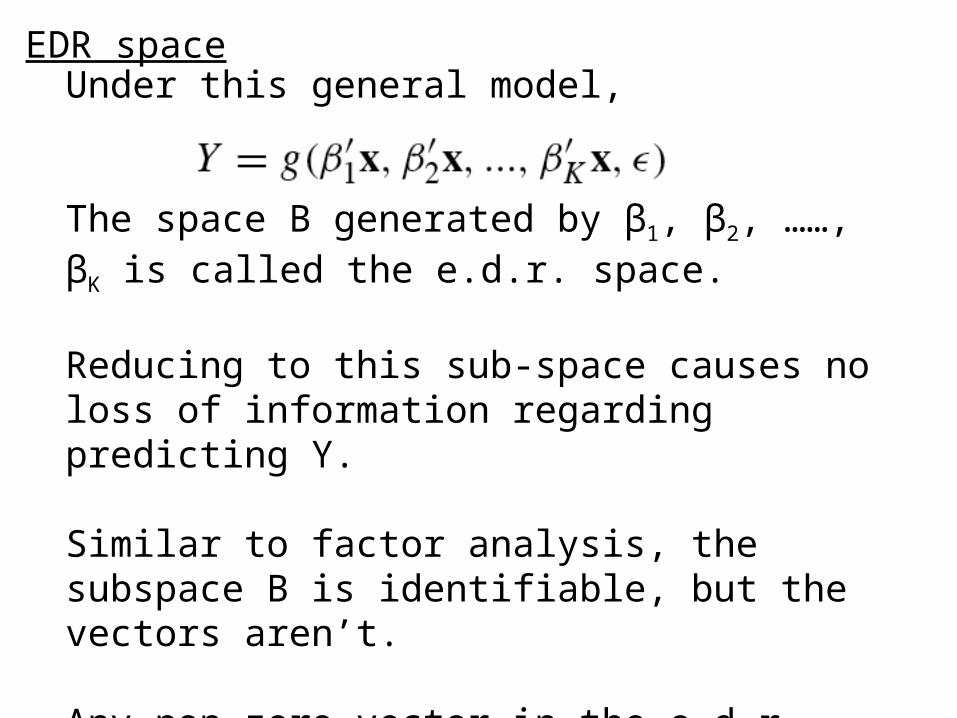
Under this general model,
The space B generated by β1, β2, ……, βK is called the e.d.r. space.
Reducing to this sub-space causes no loss of information regarding predicting Y.
Similar to factor analysis, the subspace B is identifiable, but the vectors aren’t.
Any non-zero vector in the e.d.r. space is called an e.d.r. direction.
EDR space
EDR space
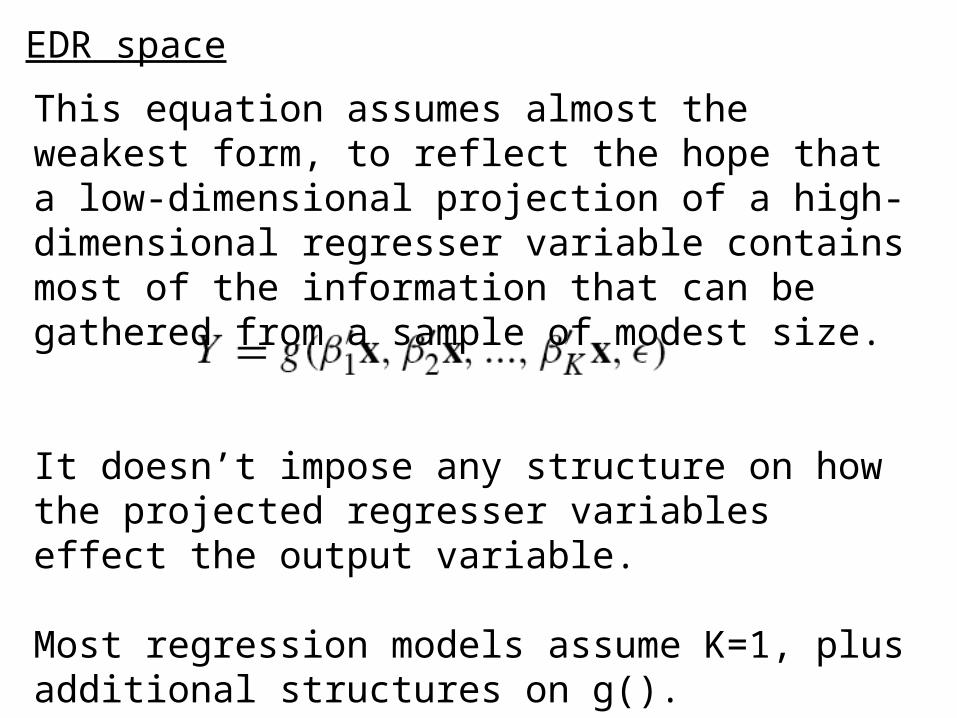
This equation assumes almost the weakest form, to reflect the hope that a low-dimensional projection of a high-dimensional regresser variable contains most of the information that can be gathered from a sample of modest size.
It doesn’t impose any structure on how the projected regresser variables effect the output variable.
Most regression models assume K=1, plus additional structures on g().
EDR space
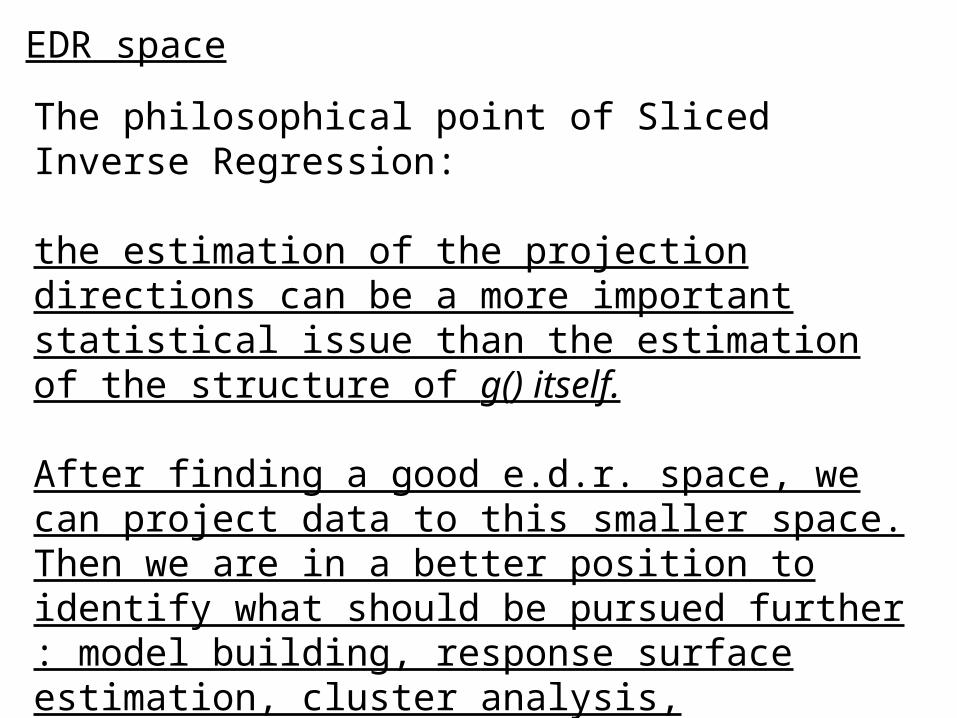
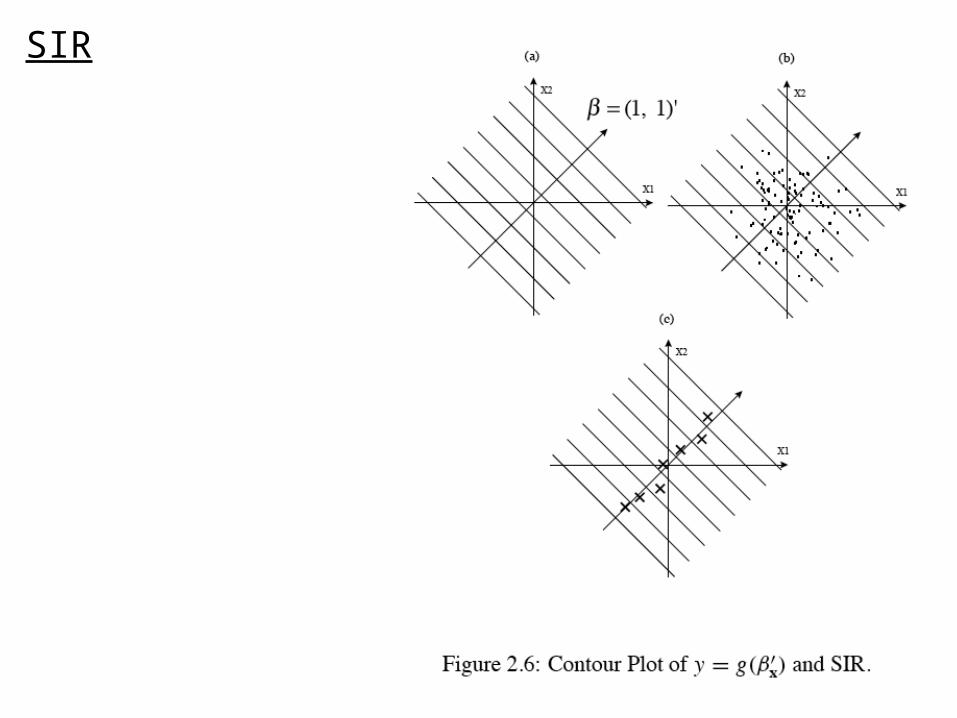
The philosophical point of Sliced Inverse Regression:
the estimation of the projection directions can be a more important statistical issue than the estimation of the structure of g() itself.
After finding a good e.d.r. space, we can project data to this smaller space. Then we are in a better position to identify what should be pursued further : model building, response surface estimation, cluster analysis, heteroscedasticity analysis, variable selection, ……
SIR
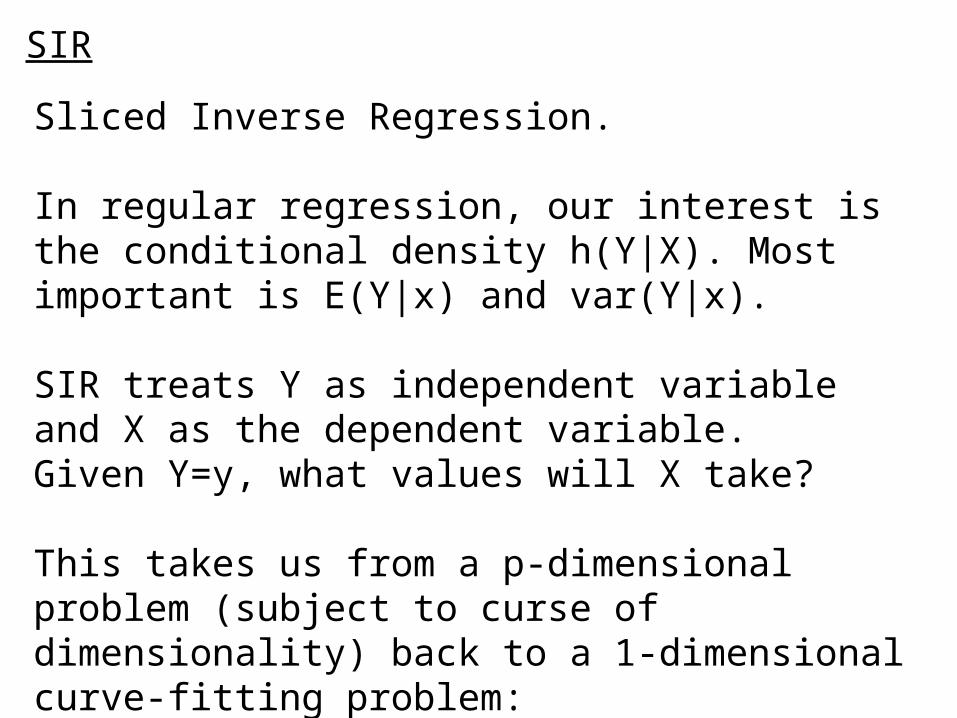
Sliced Inverse Regression.
In regular regression, our interest is the conditional density h(Y|X). Most important is E(Y|x) and var(Y|x).
SIR treats Y as independent variable and X as the dependent variable.Given Y=y, what values will X take?
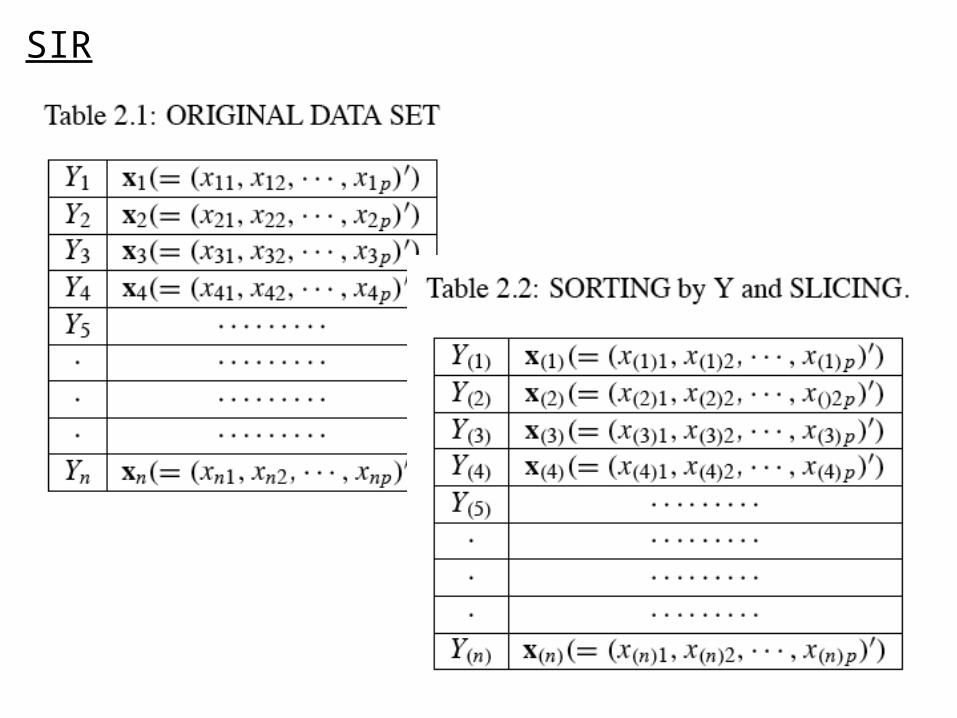
This takes us from a p-dimensional problem (subject to curse of dimensionality) back to a 1-dimensional curve-fitting problem: E(xi|y), i=1,…, p
SIR
SIR
SIR
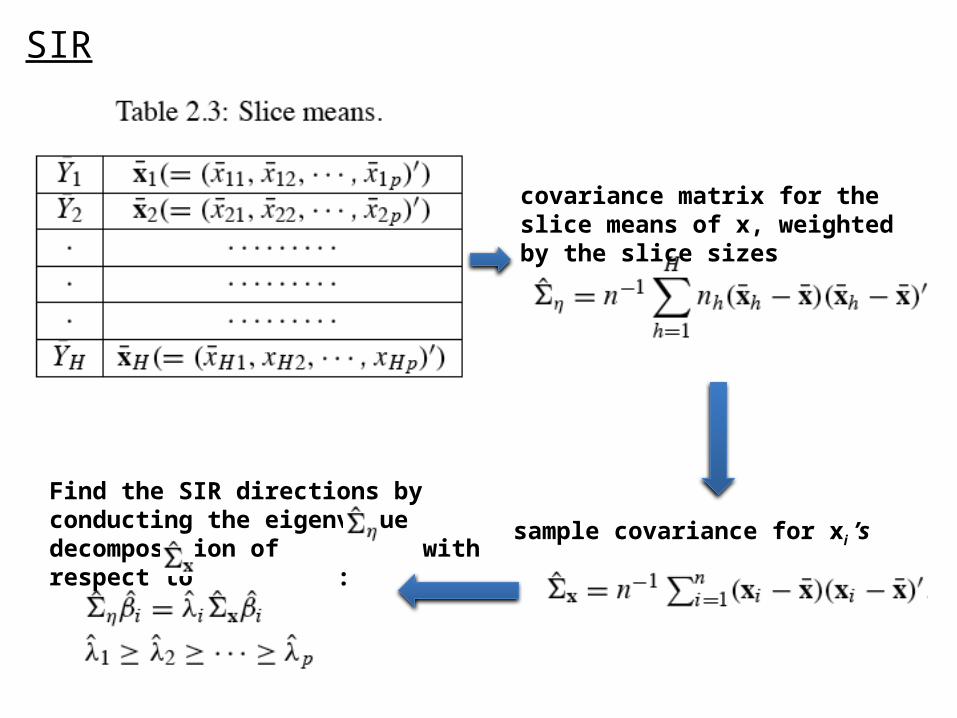
covariance matrix for the slice means of x, weighted by the slice sizes
sample covariance for xi ’s
Find the SIR directions by conducting the eigenvalue decomposition of with respect to :
SIR
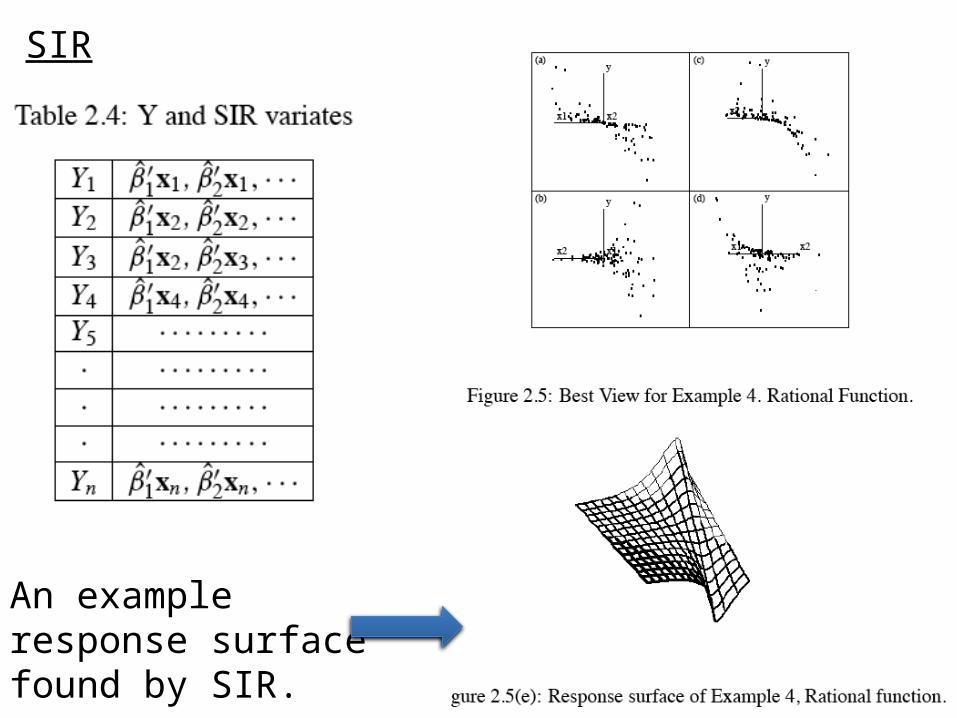
An example response surface found by SIR.
SIR and LDA
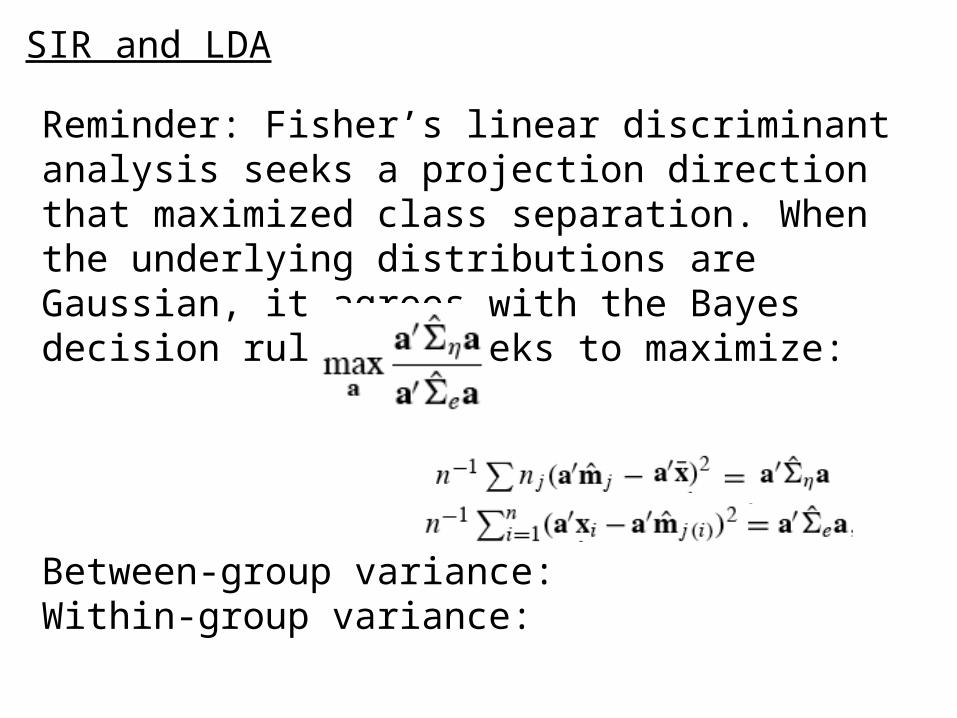
Reminder: Fisher’s linear discriminant analysis seeks a projection direction that maximized class separation. When the underlying distributions are Gaussian, it agrees with the Bayes decision rule. It seeks to maximize:
Between-group variance:Within-group variance:
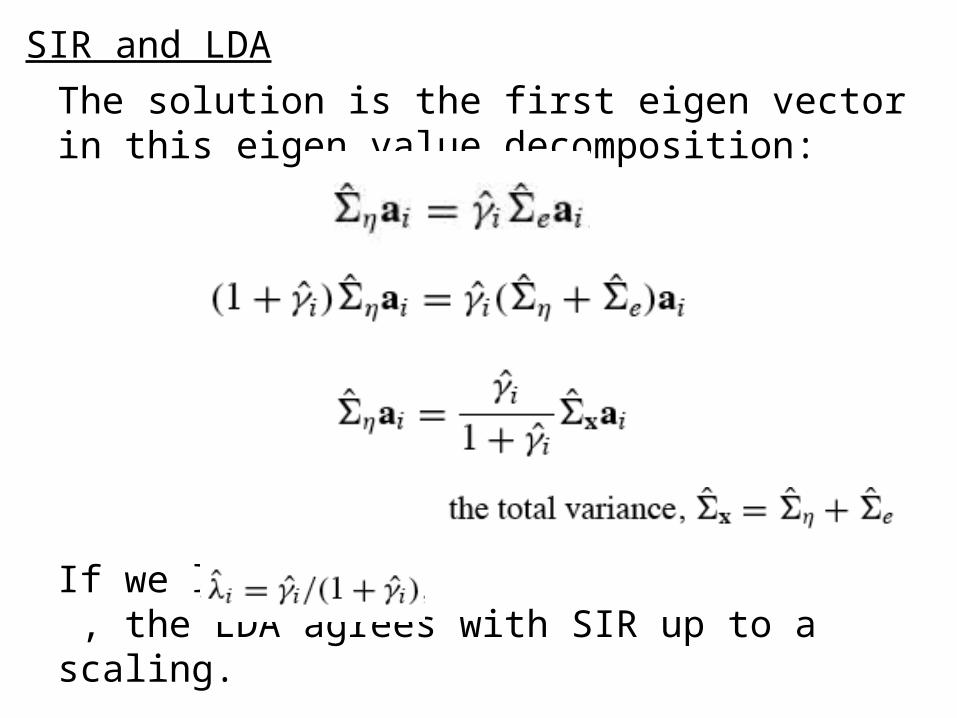
The solution is the first eigen vector in this eigen value decomposition:
If we let , the LDA agrees with SIR up to a scaling.
SIR and LDA
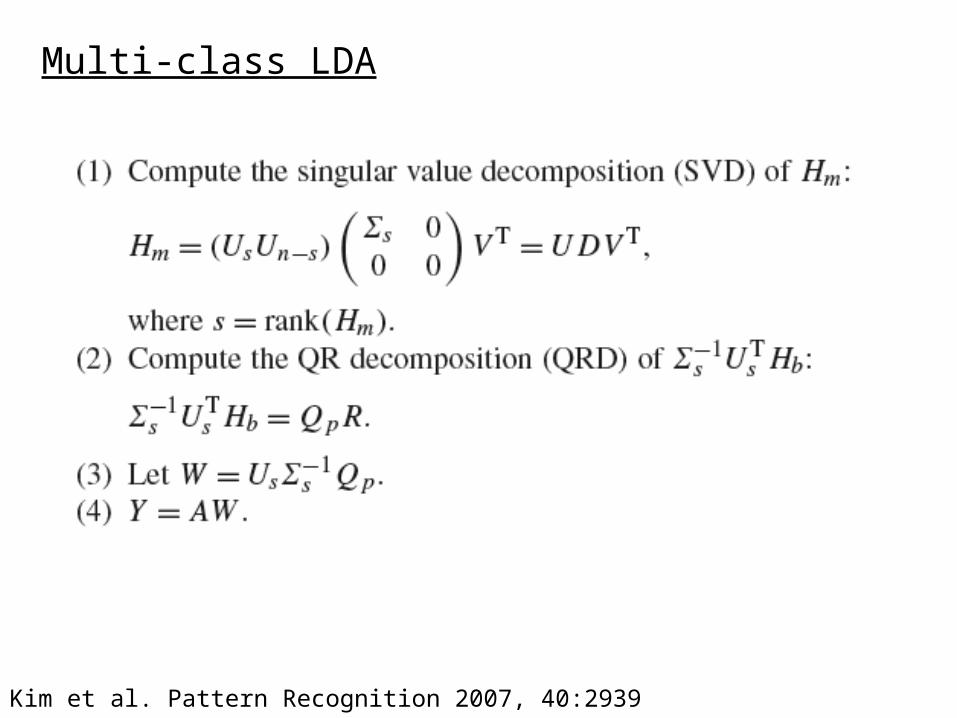
Multi-class LDA
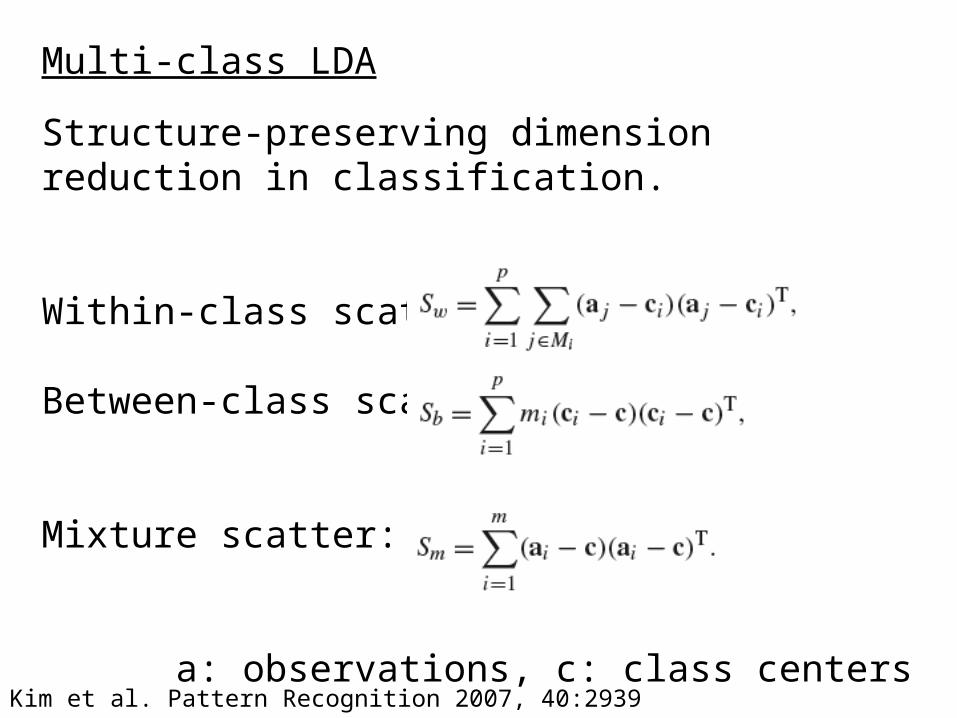
Structure-preserving dimension reduction in classification.
Within-class scatter:
Between-class scatter:
Mixture scatter:
a: observations, c: class centers
Kim et al. Pattern Recognition 2007, 40:2939
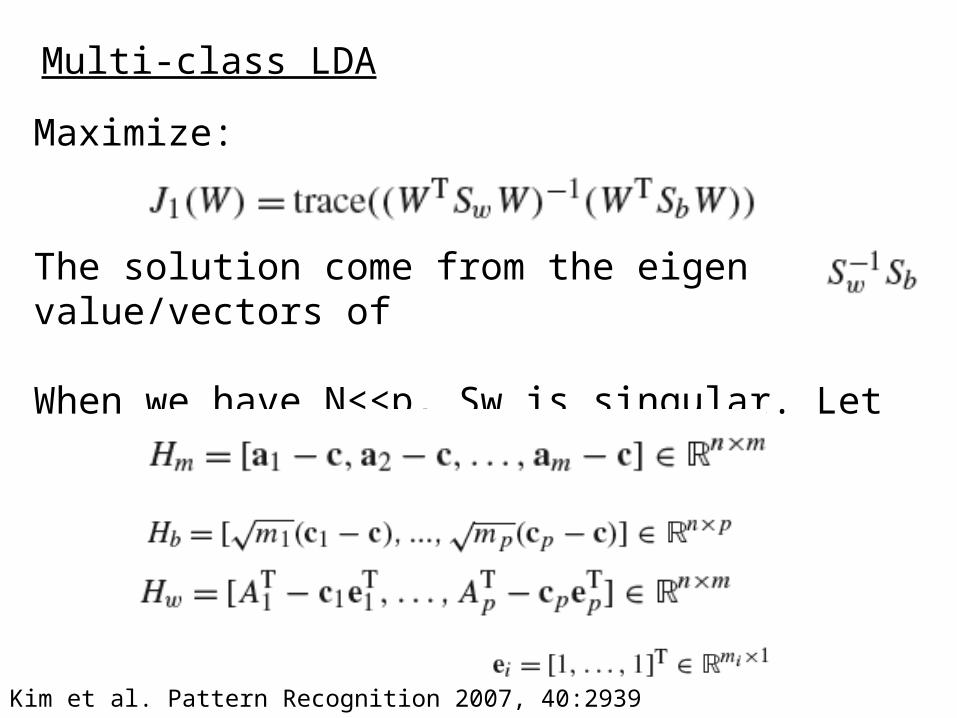
Maximize:
The solution come from the eigen value/vectors of
When we have N<<p, Sw is singular. Let
Multi-class LDA
Kim et al. Pattern Recognition 2007, 40:2939
Kim et al. Pattern Recognition 2007, 40:2939
Multi-class LDA