Digitizing Great Lakes Coastal Wetlands: A Case Study of...
27
Digitizing Great Lakes Coastal Wetlands: A Case Study of GIS Data Integration Chris Hippensteel Advisor: Dr. Benjamin Heumann Center for Geographic Information Science and Institute for Great Lakes Research, Central Michigan University Date: April 5, 2016
Transcript of Digitizing Great Lakes Coastal Wetlands: A Case Study of...
Digitizing Great Lakes
Coastal Wetlands: A Case
Study of GIS Data
Integration Chris Hippensteel
Advisor: Dr. Benjamin Heumann
Center for Geographic Information Science and
Institute for Great Lakes Research,
Central Michigan University
Date: April 5, 2016
Objectives
1. Update Great Lakes Wetland
Polygons using best available data
2. Use an analytical comparison to
see how coastal wetlands have
changed based on: area,
perimeter, and fragmentation
Used to determine if the utilization of
the latest GIS tools and remote sensing
products changes how coastal wetlands
are mapped
Great Lakes Coastal Wetlands?
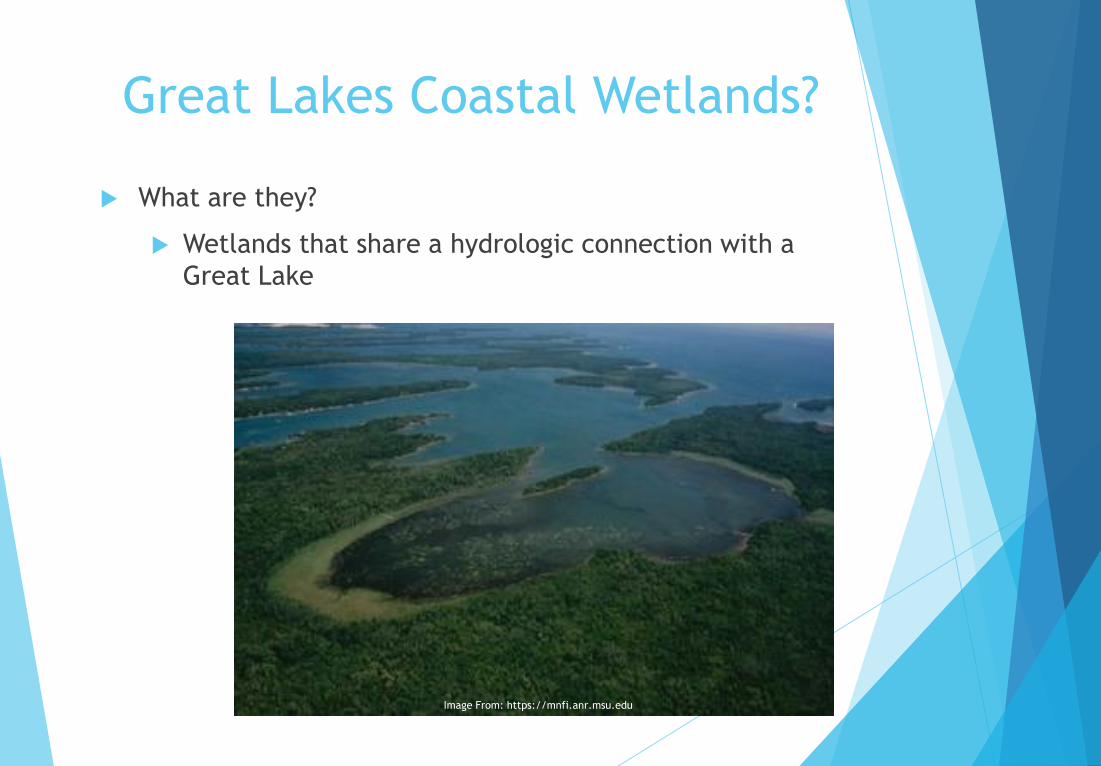
What are they?
Wetlands that share a hydrologic connection with a
Great Lake
Image From: https://mnfi.anr.msu.edu
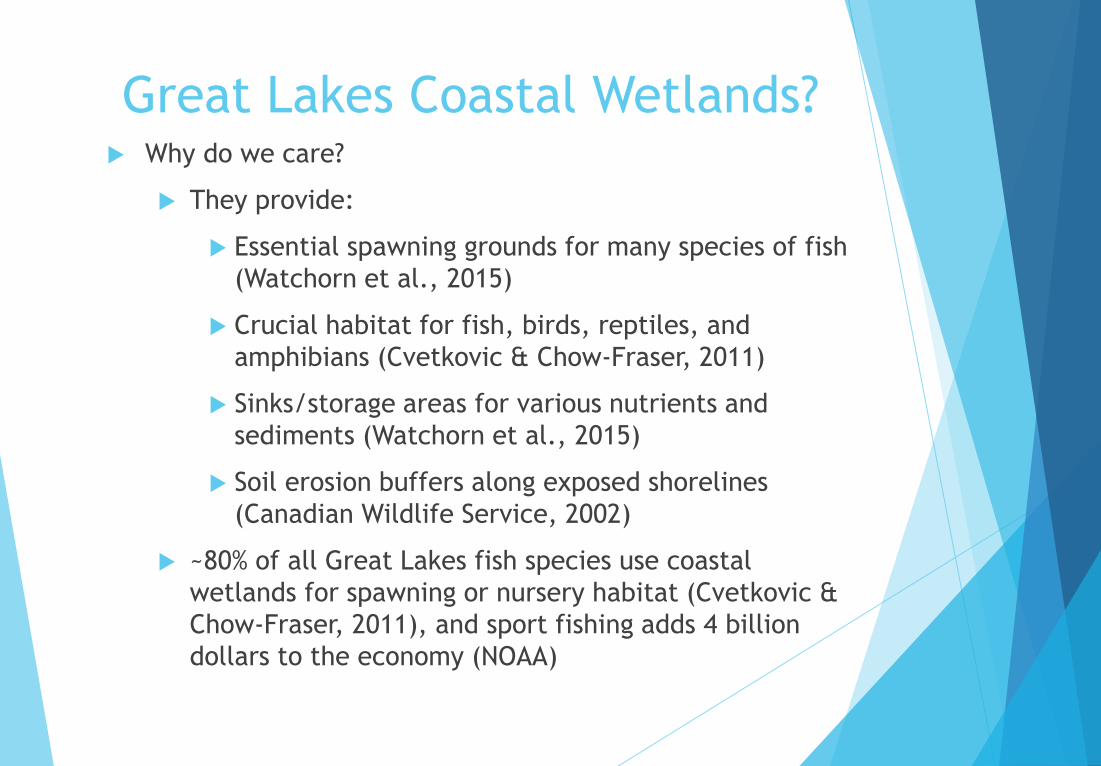
Why do we care?
They provide:
Essential spawning grounds for many species of fish
(Watchorn et al., 2015)
Crucial habitat for fish, birds, reptiles, and
amphibians (Cvetkovic & Chow-Fraser, 2011)
Sinks/storage areas for various nutrients and
sediments (Watchorn et al., 2015)
Soil erosion buffers along exposed shorelines
(Canadian Wildlife Service, 2002)
~80% of all Great Lakes fish species use coastal
wetlands for spawning or nursery habitat (Cvetkovic &
Chow-Fraser, 2011), and sport fishing adds 4 billion
dollars to the economy (NOAA)
Great Lakes Coastal Wetlands?
Great Lakes Coastal Wetlands?
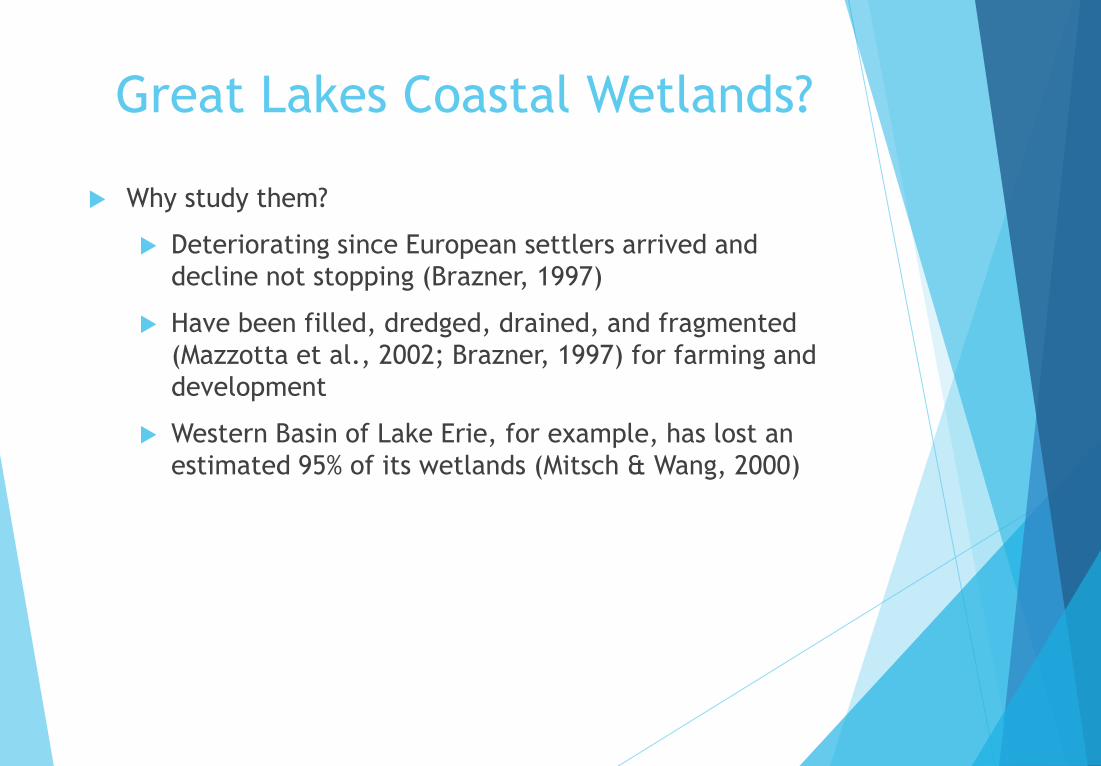
Why study them?
Deteriorating since European settlers arrived and
decline not stopping (Brazner, 1997)
Have been filled, dredged, drained, and fragmented
(Mazzotta et al., 2002; Brazner, 1997) for farming and
development
Western Basin of Lake Erie, for example, has lost an
estimated 95% of its wetlands (Mitsch & Wang, 2000)
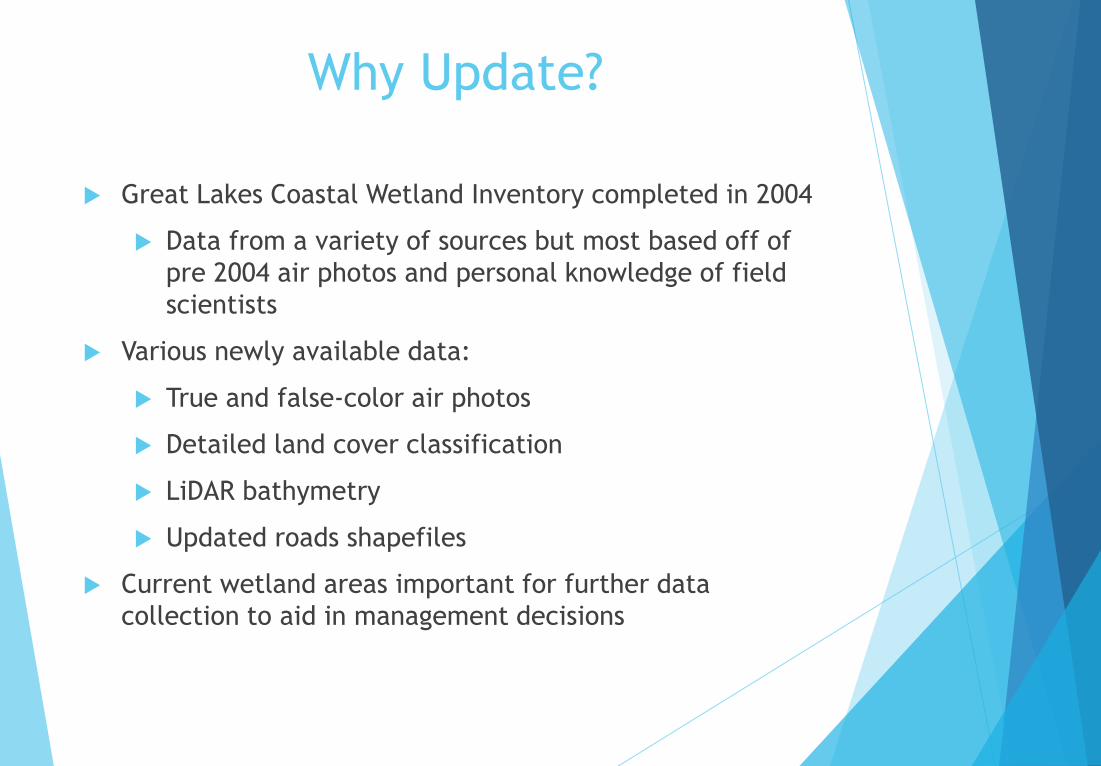
Why Update?
Great Lakes Coastal Wetland Inventory completed in 2004
Data from a variety of sources but most based off of
pre 2004 air photos and personal knowledge of field
scientists
Various newly available data:
True and false-color air photos
Detailed land cover classification
LiDAR bathymetry
Updated roads shapefiles
Current wetland areas important for further data
collection to aid in management decisions
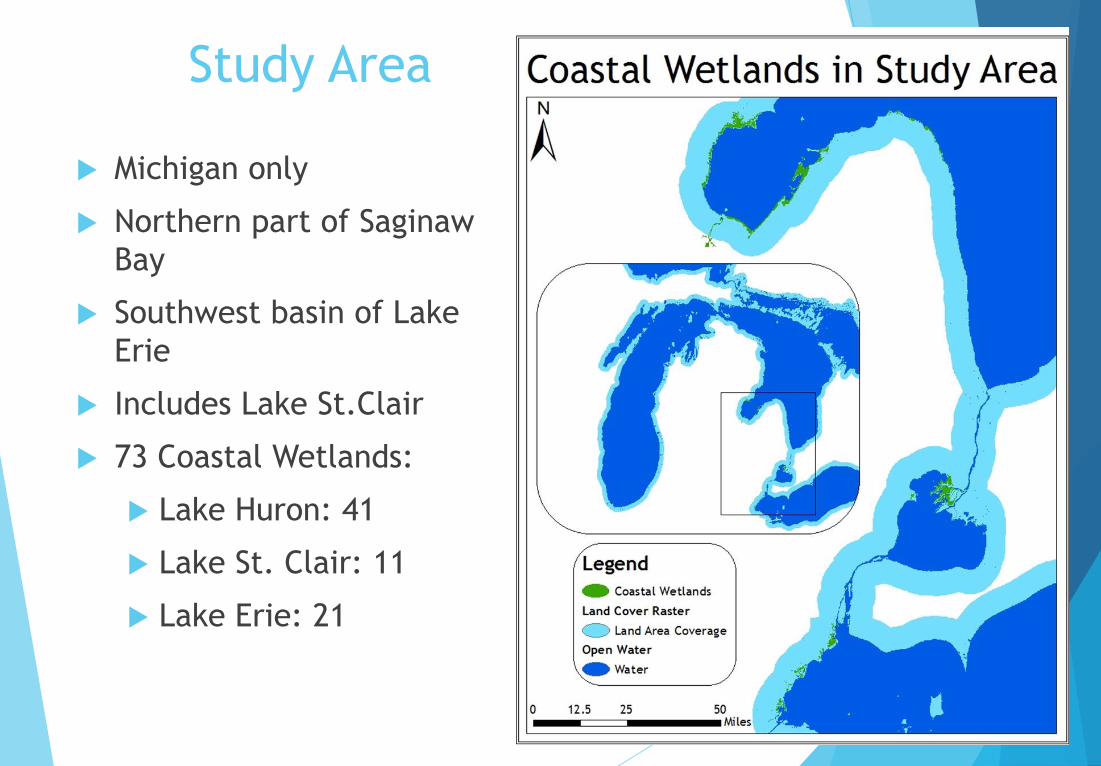
Study Area
Michigan only
Northern part of Saginaw
Bay
Southwest basin of Lake
Erie
Includes Lake St.Clair
73 Coastal Wetlands:
Lake Huron: 41
Lake St. Clair: 11
Lake Erie: 21
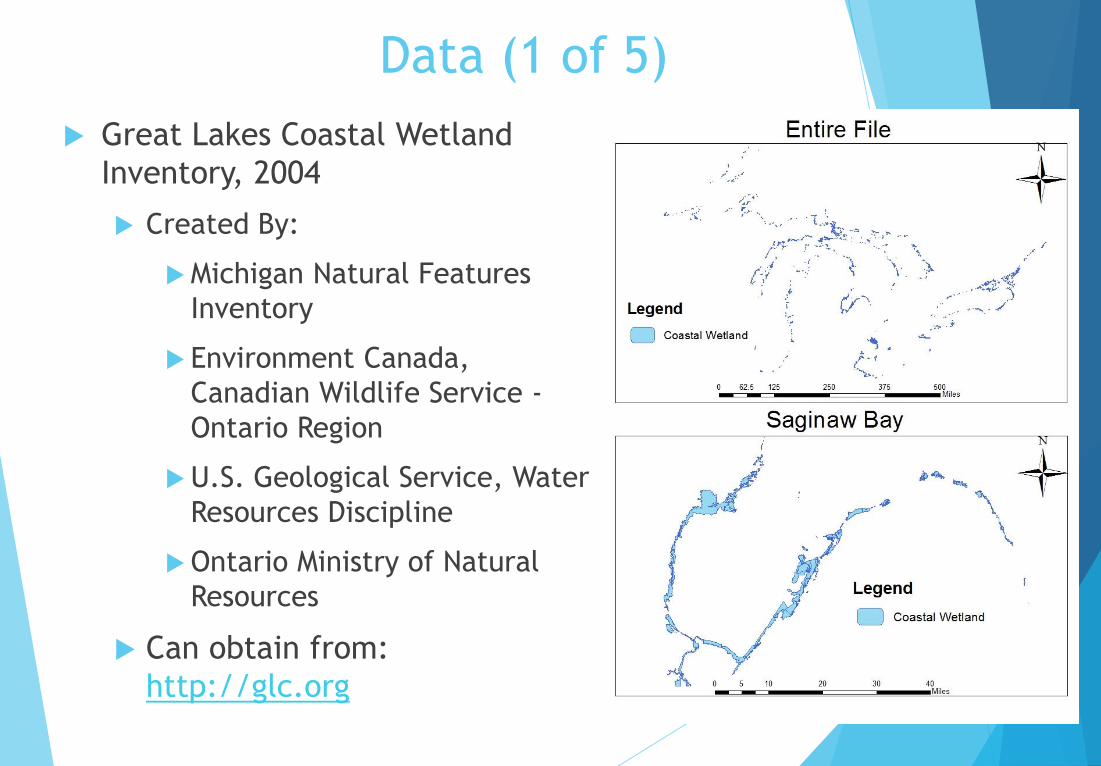
Data (1 of 5)
Great Lakes Coastal Wetland
Inventory, 2004
Created By:
Michigan Natural Features
Inventory
Environment Canada,
Canadian Wildlife Service -
Ontario Region
U.S. Geological Service, Water
Resources Discipline
Ontario Ministry of Natural
Resources
Can obtain from:
http://glc.org
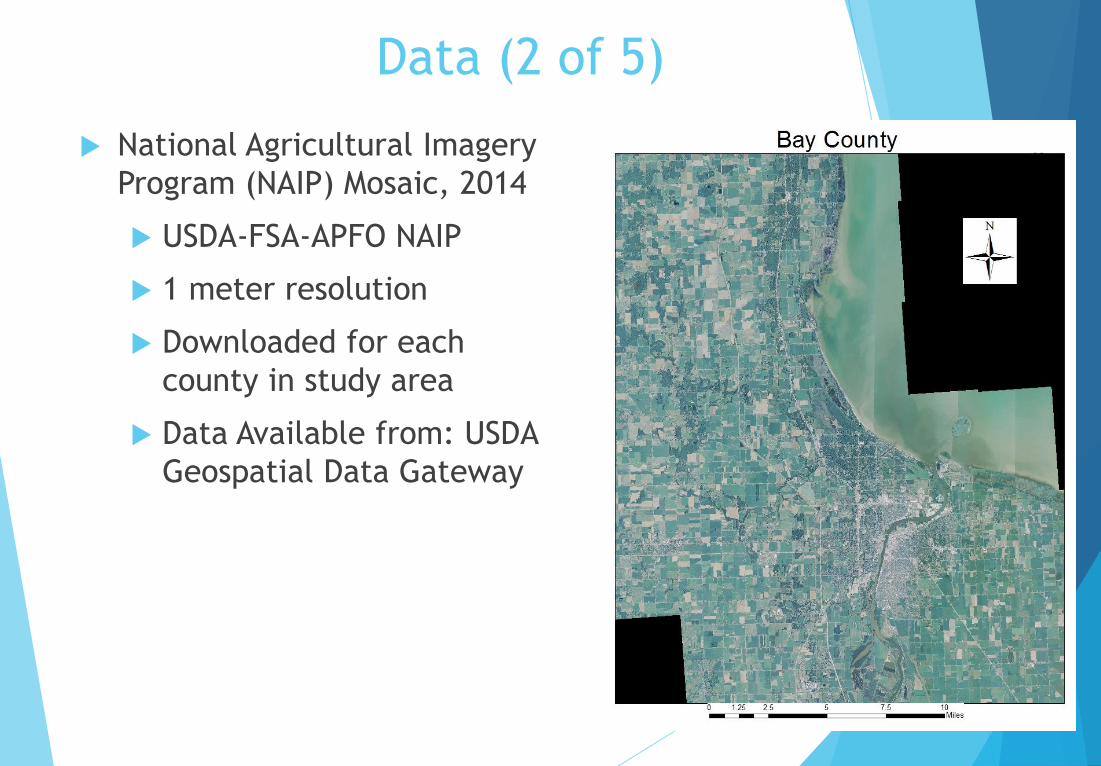
Data (2 of 5)
National Agricultural Imagery
Program (NAIP) Mosaic, 2014
USDA-FSA-APFO NAIP
1 meter resolution
Downloaded for each
county in study area
Data Available from: USDA
Geospatial Data Gateway
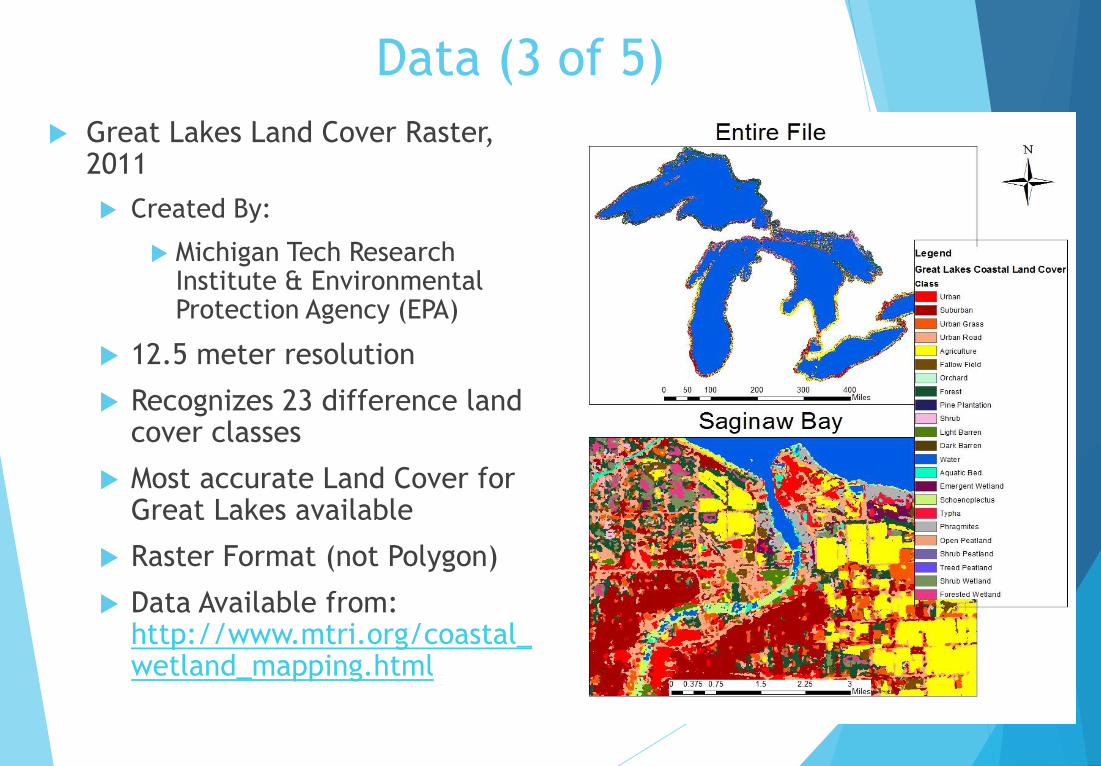
Data (3 of 5)
Great Lakes Land Cover Raster, 2011
Created By:
Michigan Tech Research Institute & Environmental Protection Agency (EPA)
12.5 meter resolution
Recognizes 23 difference land cover classes
Most accurate Land Cover for Great Lakes available
Raster Format (not Polygon)
Data Available from: http://www.mtri.org/coastal_wetland_mapping.html
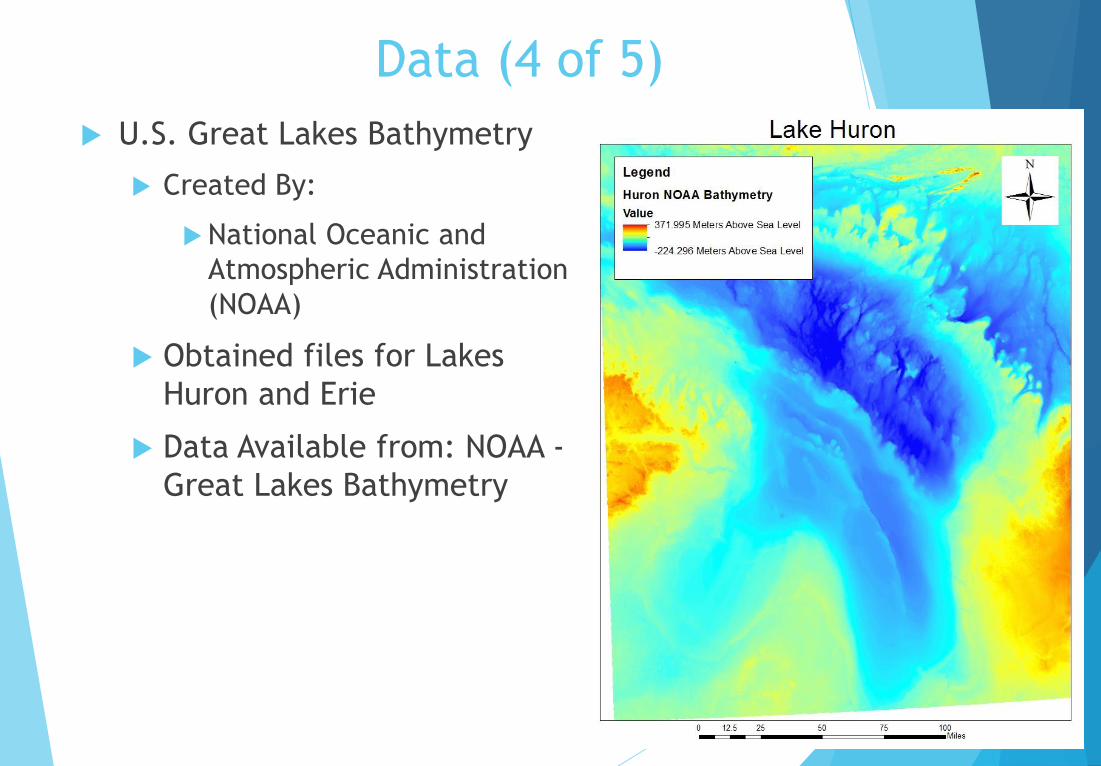
Data (4 of 5)
U.S. Great Lakes Bathymetry
Created By:
National Oceanic and
Atmospheric Administration
(NOAA)
Obtained files for Lakes
Huron and Erie
Data Available from: NOAA -
Great Lakes Bathymetry
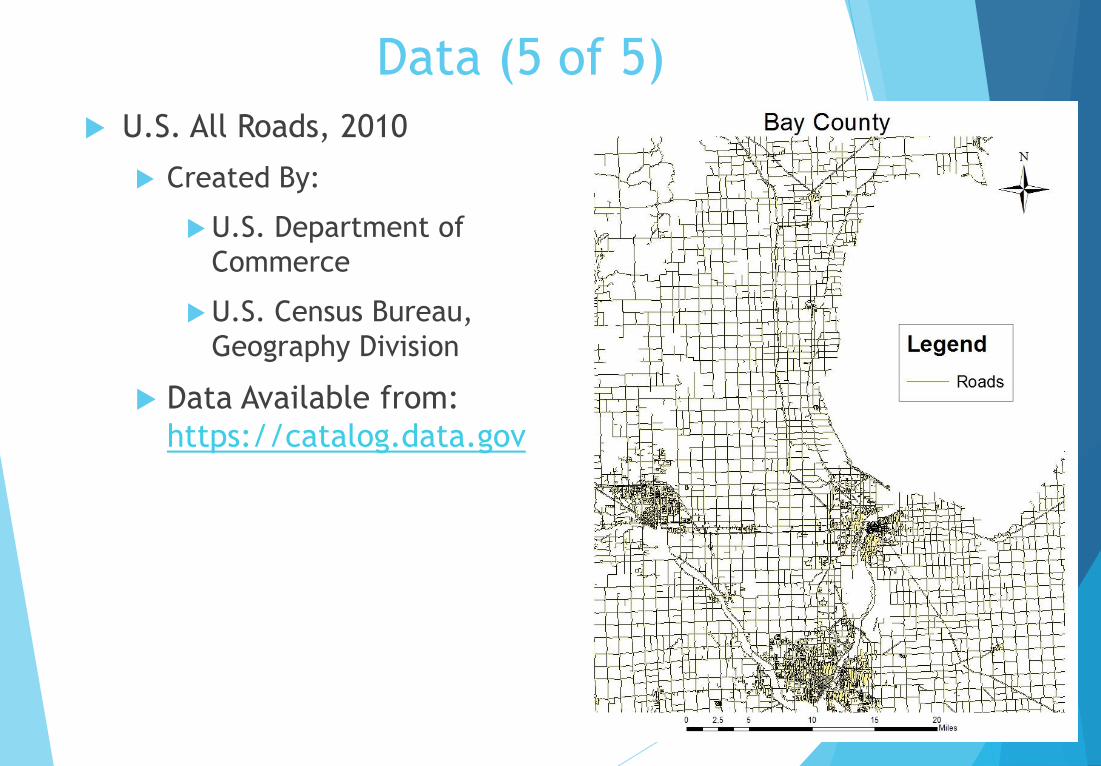
Data (5 of 5)
U.S. All Roads, 2010
Created By:
U.S. Department of
Commerce
U.S. Census Bureau,
Geography Division
Data Available from:
https://catalog.data.gov
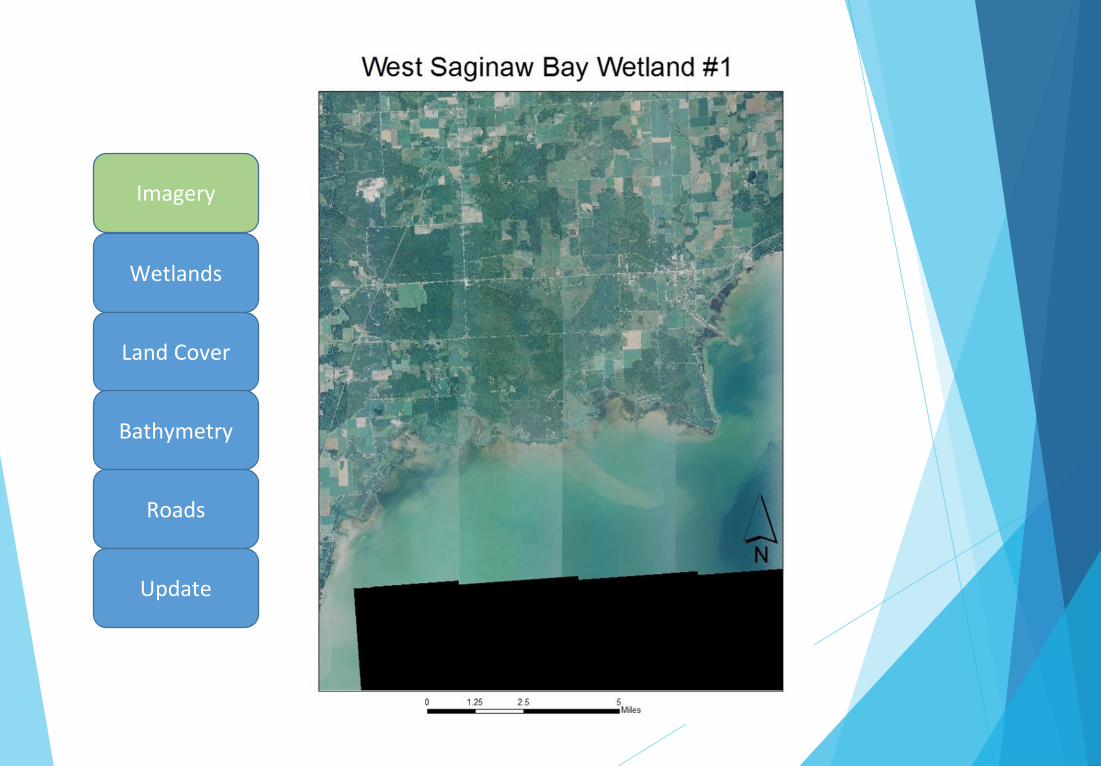
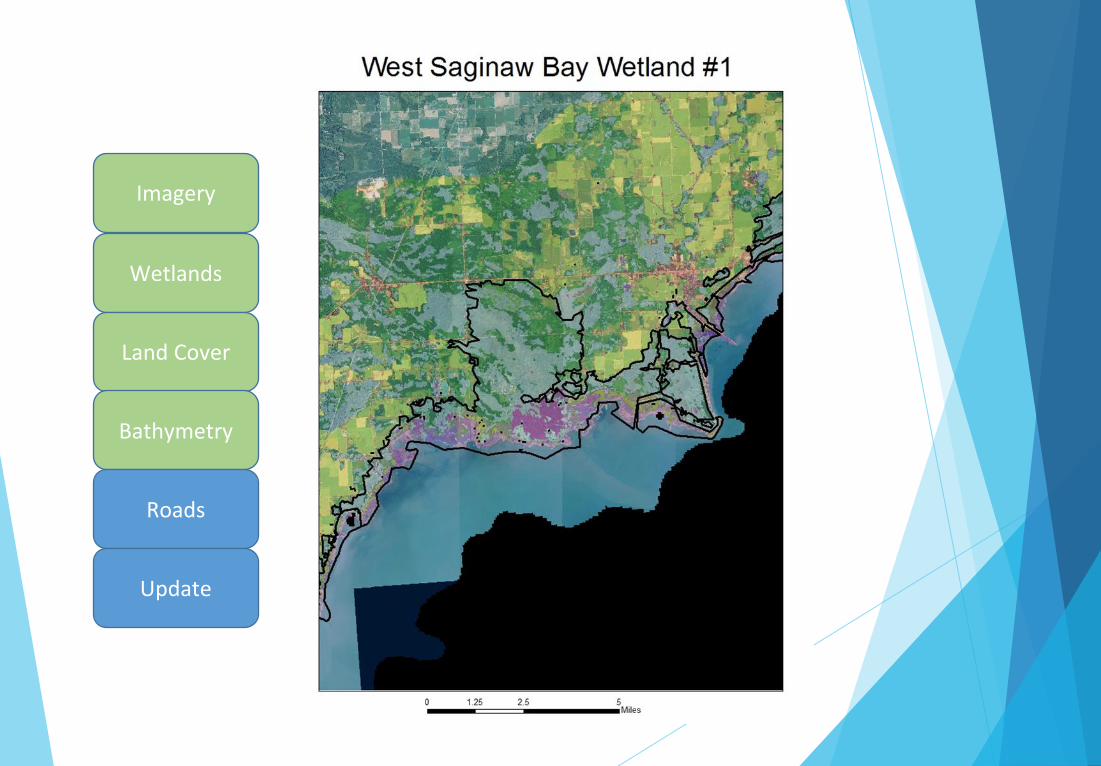
Imagery
Wetlands
Land Cover
Bathymetry
Roads
Update
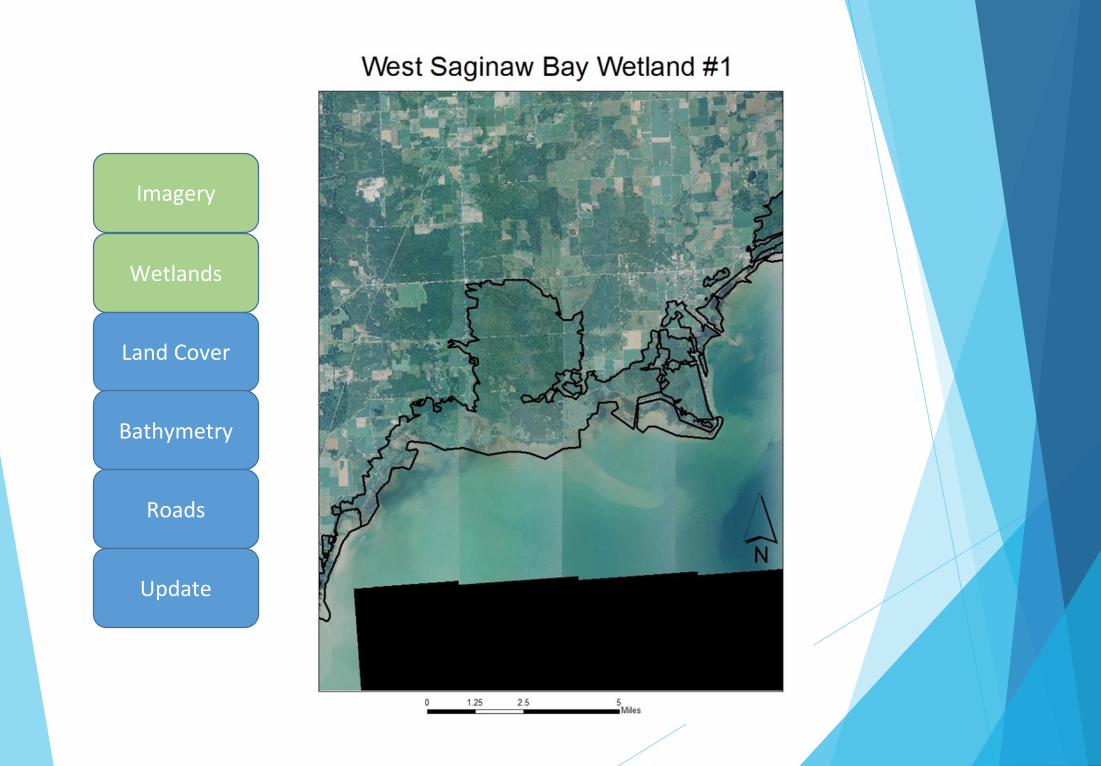
Imagery
Wetlands
Land Cover
Bathymetry
Roads
Update
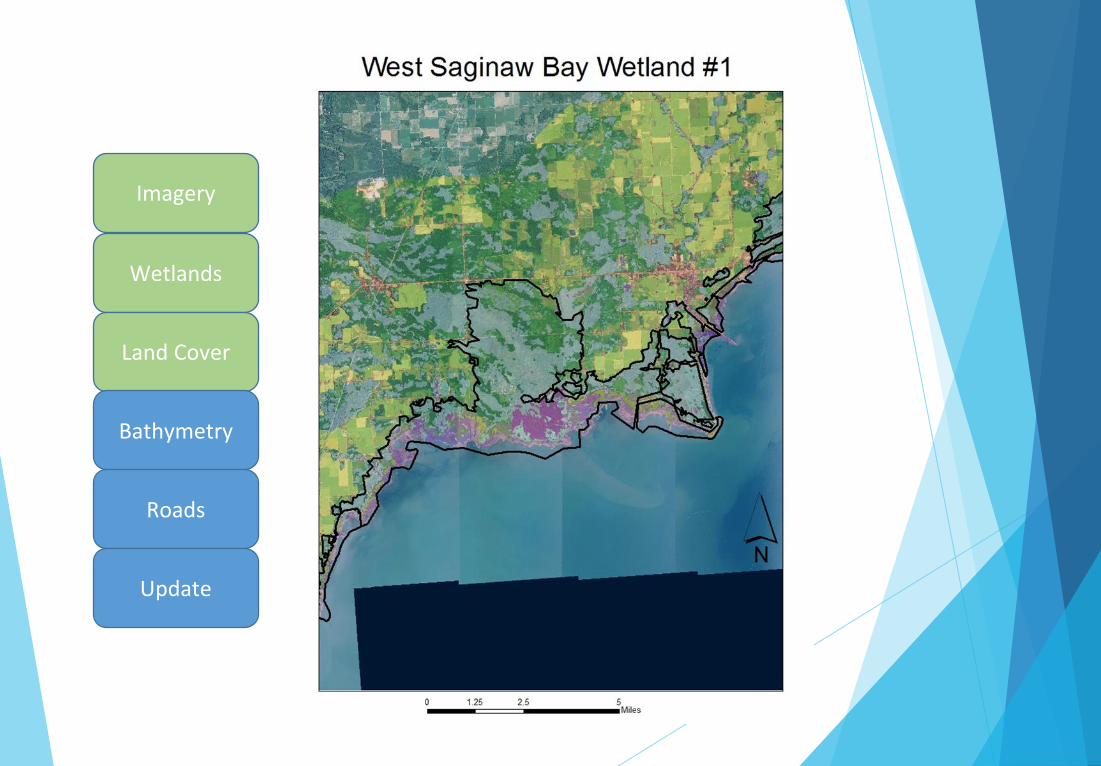
Imagery
Wetlands
Land Cover
Bathymetry
Roads
Update
Imagery
Wetlands
Land Cover
Bathymetry
Roads
Update
Imagery
Wetlands
Land Cover
Bathymetry
Roads
Update
Imagery
Wetlands
Land Cover
Bathymetry
Roads
Update
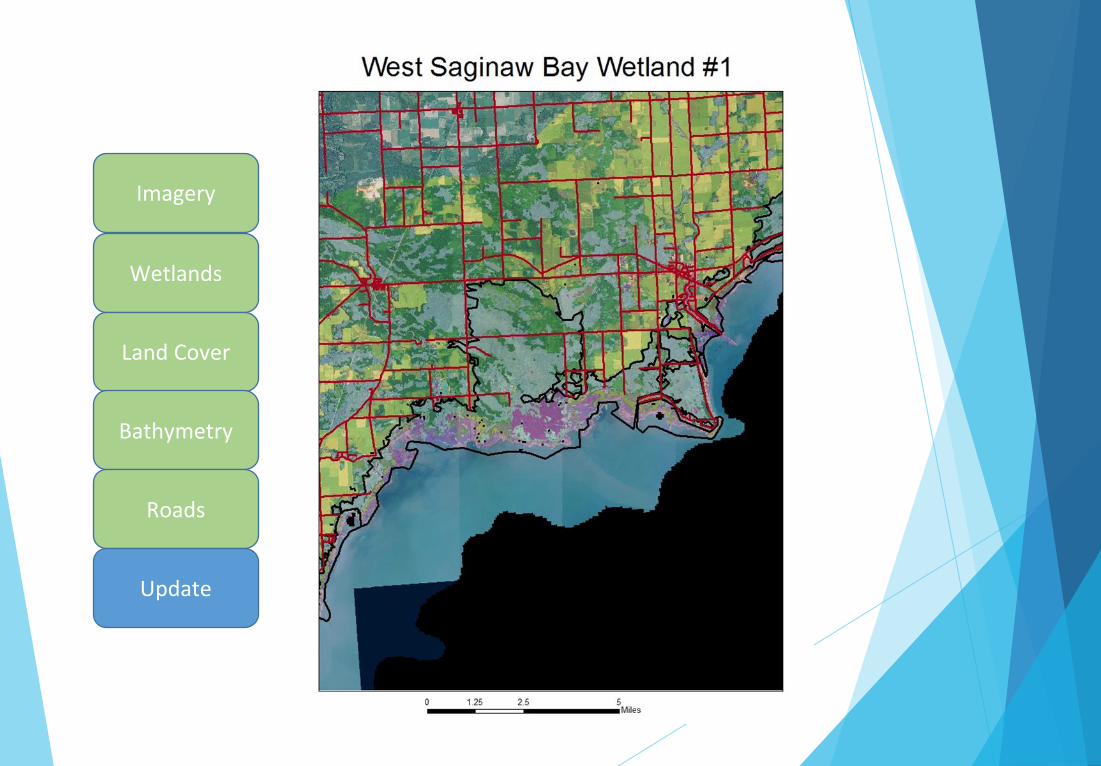
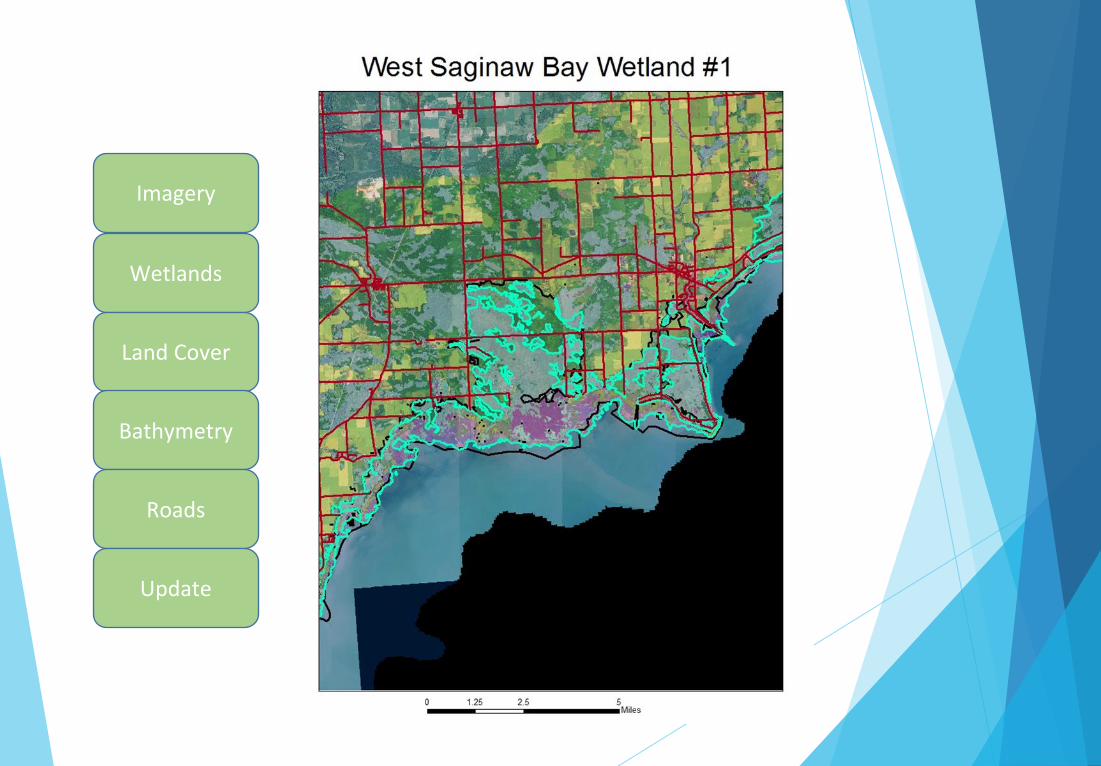
Simplified Rules/Processes
Select wetland to update
Zoom in to 1:3000 scale
Identify any conflicts between polygon boundary and datasets
Need to justify every polygon adjustment
If it does conflict:
Examine Land Cover and Aerial Imagery
Interpret new boundary
Edit vertices by hand
If new boundary can’t be interpreted, leave the
existing boundary alone!!
Once the boundaries are updated we can move on to
the second objective, analytical comparisons
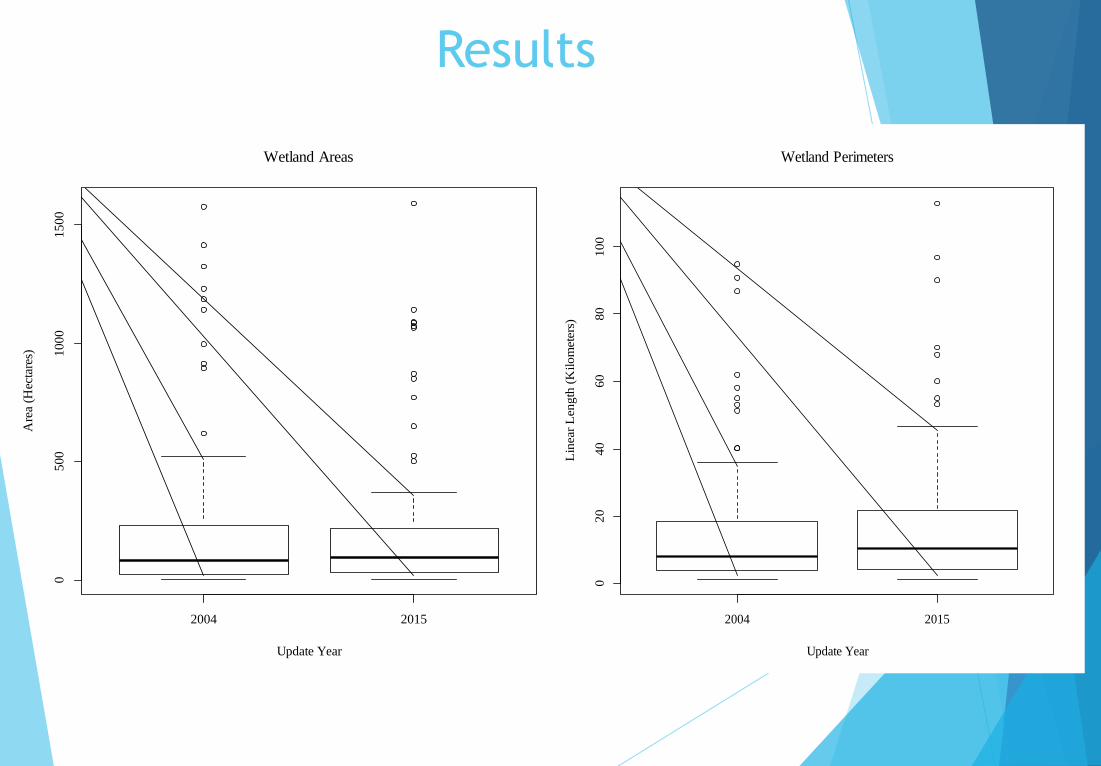
Results
2004 2015
02
04
06
08
01
00
Wetland Perimeters
Update Year
Lin
ear
Length
(K
ilom
ete
rs)
2004 2015
05
00
10
00
15
00
Wetland Areas
Update Year
Are
a (H
ecta
res)
0
5
10
15
20
25
<-25% -25% to -10% -10% to -5% -5% to 5% 5% to 10% 10% to 25% >25%
Nu
mb
er o
f W
etla
nd
s
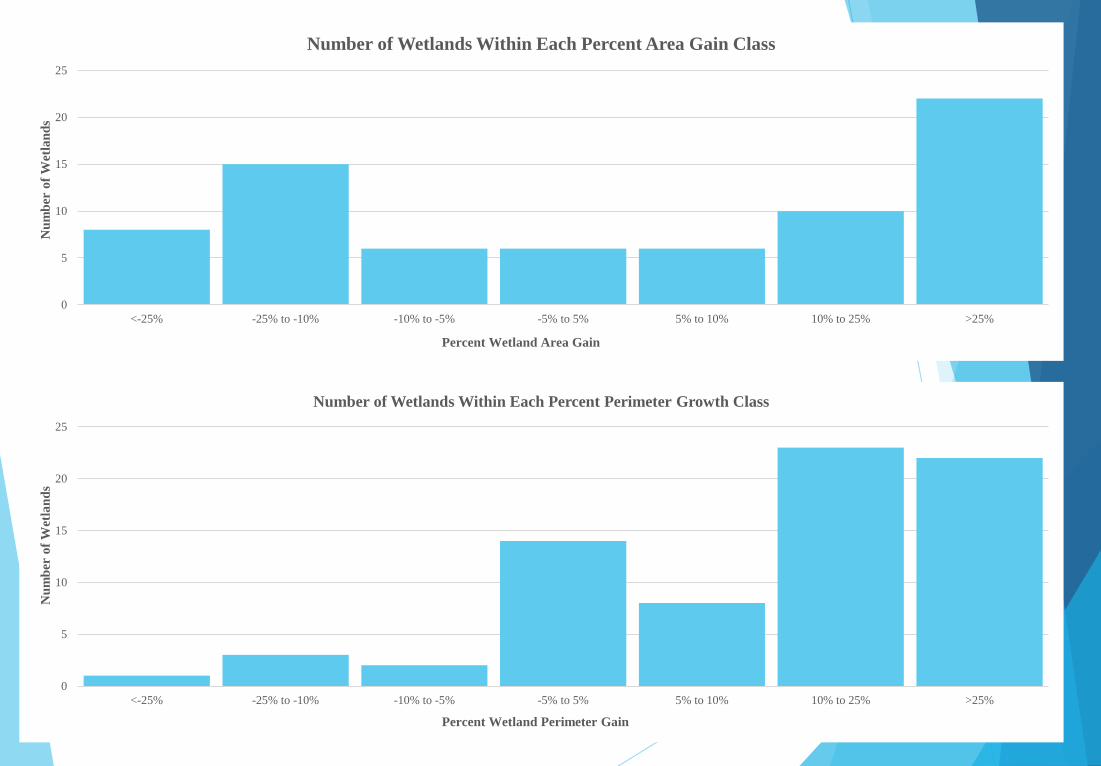
Percent Wetland Area Gain
Number of Wetlands Within Each Percent Area Gain Class
0
5
10
15
20
25
<-25% -25% to -10% -10% to -5% -5% to 5% 5% to 10% 10% to 25% >25%
Nu
mb
er o
f W
etla
nd
s
Percent Wetland Perimeter Gain
Number of Wetlands Within Each Percent Perimeter Growth Class
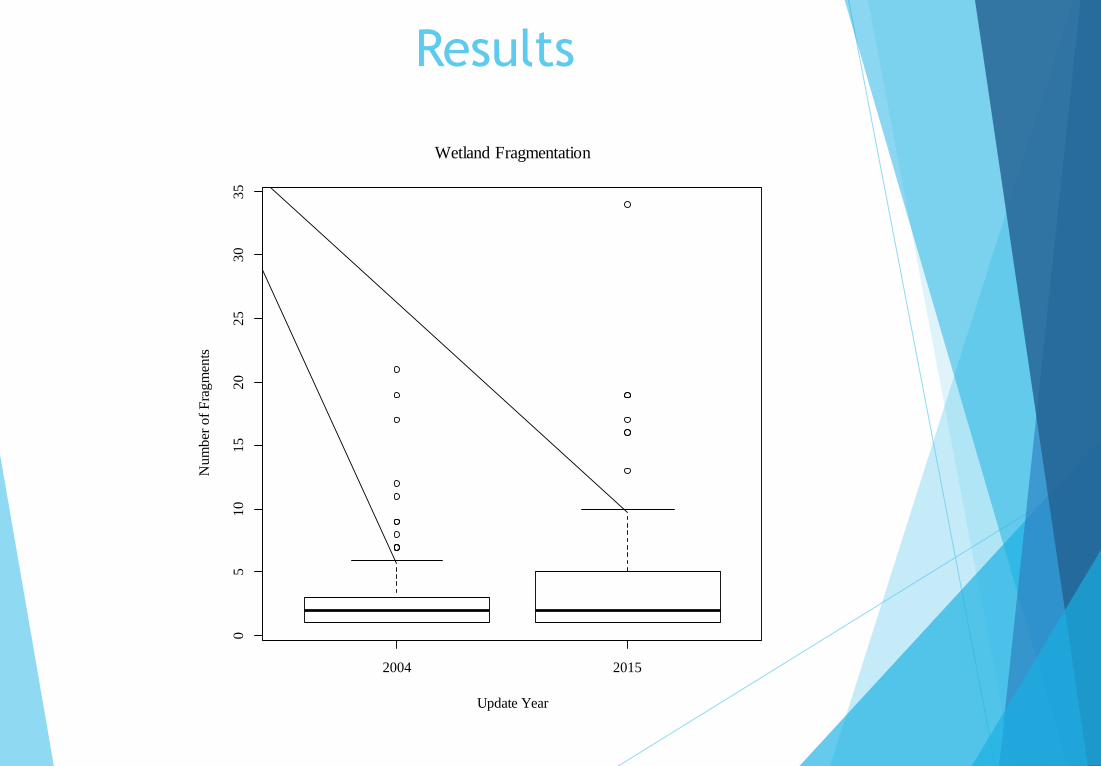
Results
2004 2015
05
10
15
20
25
30
35
Wetland Fragmentation
Update Year
Num
ber
of
Fra
gm
ents
Discussion
What caused the 11% decrease in area, 20% increase in perimeter, and 24% increase in fragmentation?
Likely 3 reasons:
Natural water level fluctuations
Great Lakes water levels can fluctuate over 1.5 meters from a wet year to a dry year (Mitsch & Wang, 2000)
Human development and agriculture
Less likely due to numerous state and federal laws
Differences in data while using conservative estimates
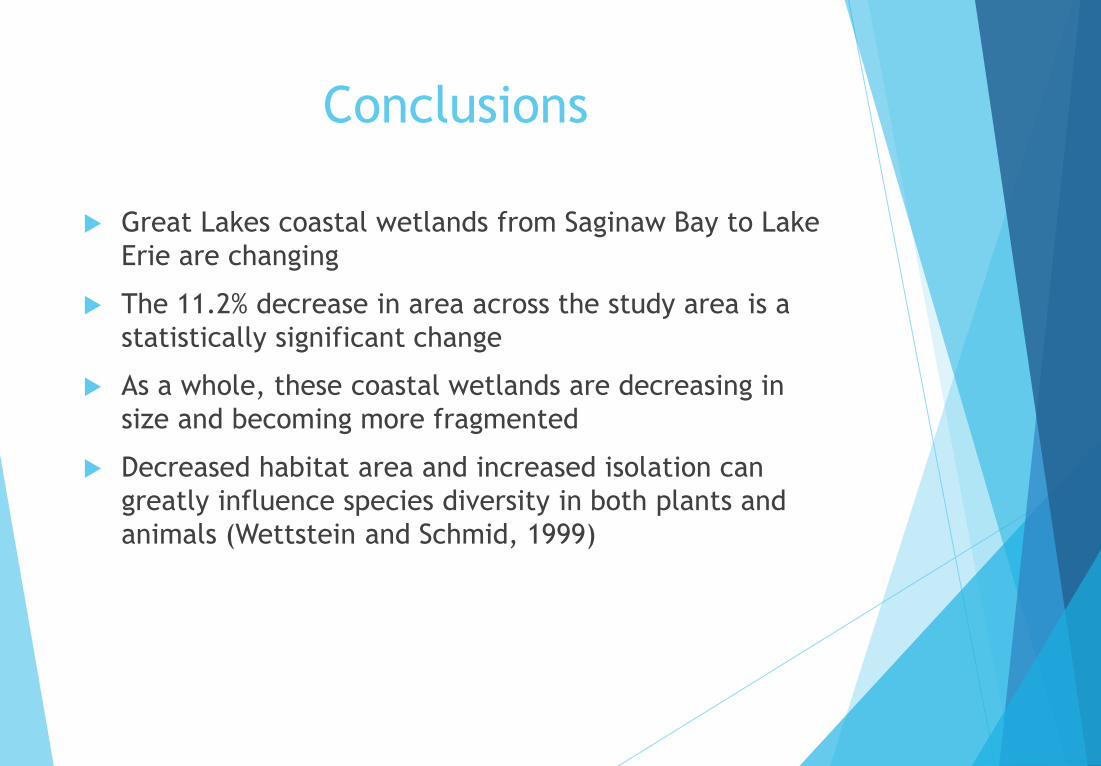
Conclusions
Great Lakes coastal wetlands from Saginaw Bay to Lake
Erie are changing
The 11.2% decrease in area across the study area is a
statistically significant change
As a whole, these coastal wetlands are decreasing in
size and becoming more fragmented
Decreased habitat area and increased isolation can
greatly influence species diversity in both plants and
animals (Wettstein and Schmid, 1999)
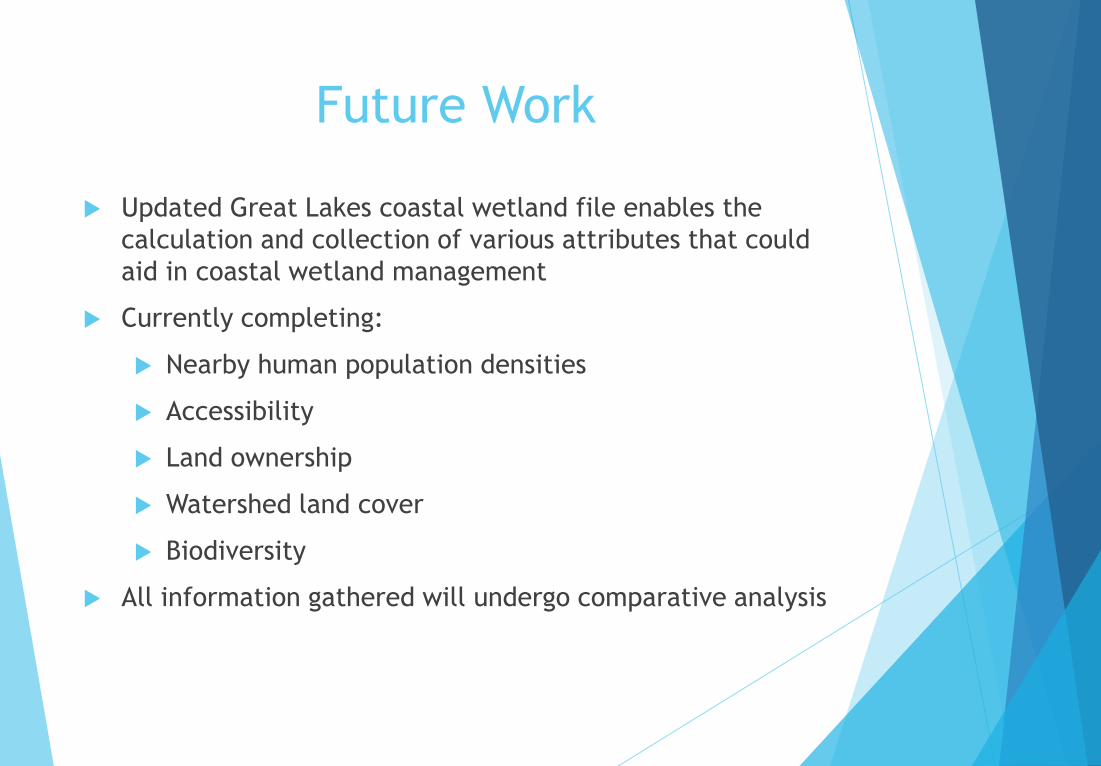
Future Work
Updated Great Lakes coastal wetland file enables the
calculation and collection of various attributes that could
aid in coastal wetland management
Currently completing:
Nearby human population densities
Accessibility
Land ownership
Watershed land cover
Biodiversity
All information gathered will undergo comparative analysis
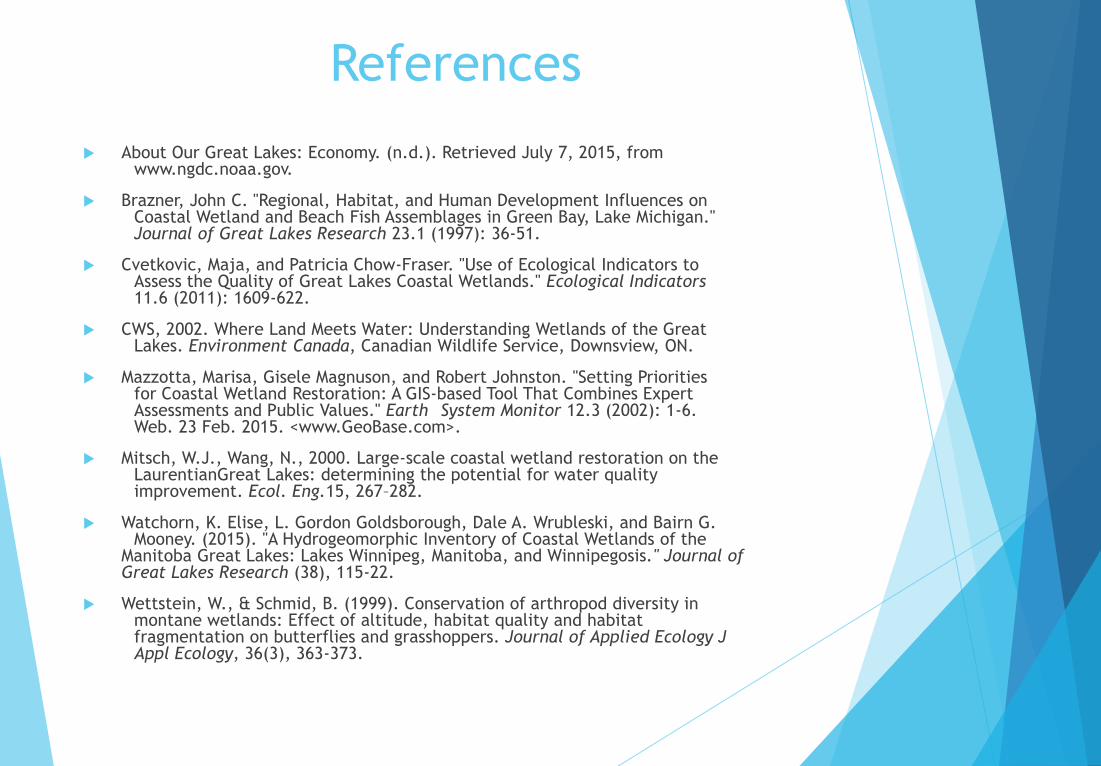
References
About Our Great Lakes: Economy. (n.d.). Retrieved July 7, 2015, from www.ngdc.noaa.gov.
Brazner, John C. "Regional, Habitat, and Human Development Influences on Coastal Wetland and Beach Fish Assemblages in Green Bay, Lake Michigan." Journal of Great Lakes Research 23.1 (1997): 36-51.
Cvetkovic, Maja, and Patricia Chow-Fraser. "Use of Ecological Indicators to Assess the Quality of Great Lakes Coastal Wetlands." Ecological Indicators 11.6 (2011): 1609-622.
CWS, 2002. Where Land Meets Water: Understanding Wetlands of the Great Lakes. Environment Canada, Canadian Wildlife Service, Downsview, ON.
Mazzotta, Marisa, Gisele Magnuson, and Robert Johnston. "Setting Priorities for Coastal Wetland Restoration: A GIS-based Tool That Combines Expert Assessments and Public Values." Earth System Monitor 12.3 (2002): 1-6. Web. 23 Feb. 2015. <www.GeoBase.com>.
Mitsch, W.J., Wang, N., 2000. Large-scale coastal wetland restoration on the LaurentianGreat Lakes: determining the potential for water quality improvement. Ecol. Eng.15, 267–282.
Watchorn, K. Elise, L. Gordon Goldsborough, Dale A. Wrubleski, and Bairn G. Mooney. (2015). "A Hydrogeomorphic Inventory of Coastal Wetlands of the Manitoba Great Lakes: Lakes Winnipeg, Manitoba, and Winnipegosis." Journal of Great Lakes Research (38), 115-22.
Wettstein, W., & Schmid, B. (1999). Conservation of arthropod diversity in montane wetlands: Effect of altitude, habitat quality and habitat fragmentation on butterflies and grasshoppers. Journal of Applied Ecology J Appl Ecology, 36(3), 363-373.
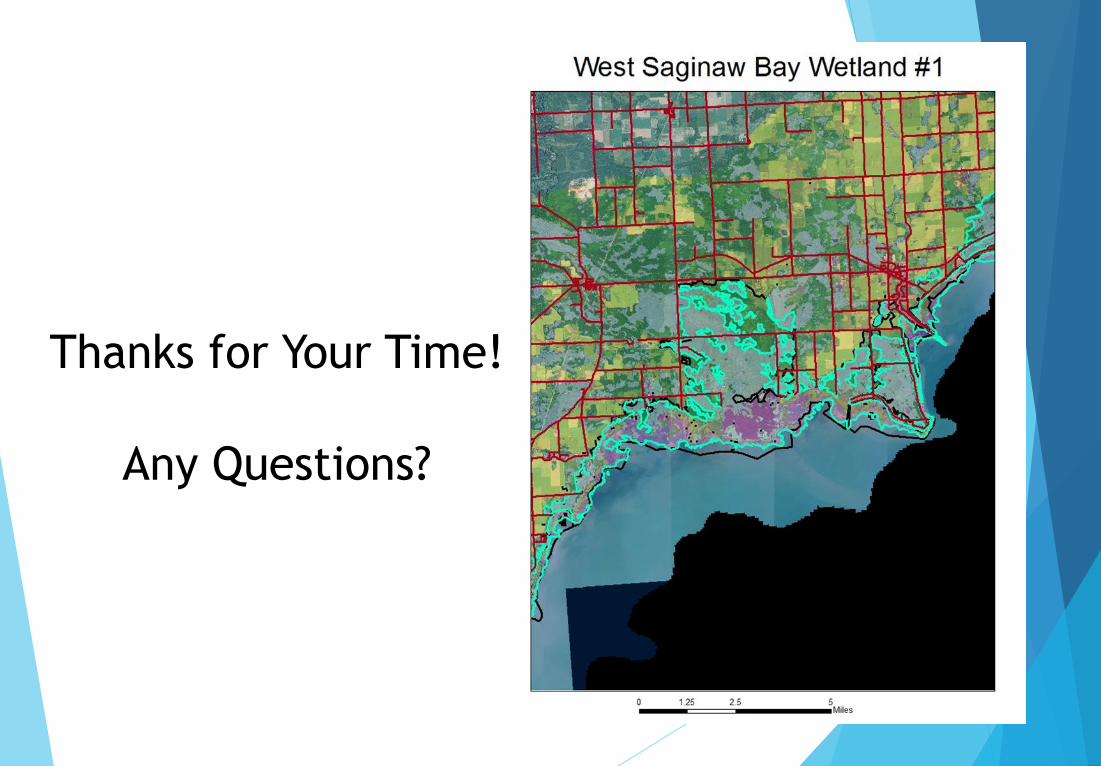
Thanks for Your Time!
Any Questions?


![E3. Lakes, rivers, streams and wetlands - Auckland Council Unitary... · E3 Lakes, rivers, streams and wetlands Auckland Unitary Plan Operative in part 3 E3.3. Policies [rp] General](https://static.fdocuments.net/doc/165x107/5f0920277e708231d425598d/e3-lakes-rivers-streams-and-wetlands-auckland-council-unitary-e3-lakes.jpg)