Digital Trends & Insights Scott VanderLey, Vice President, Digital Elliott Wilkerson, Director,...
40
Digital Trends & Insights Scott VanderLey, Vice President, Digital Elliott Wilkerson, Director, Digital Media
-
Upload
doris-warren -
Category
Documents
-
view
223 -
download
2
Transcript of Digital Trends & Insights Scott VanderLey, Vice President, Digital Elliott Wilkerson, Director,...

Digital Trends & Insights
Scott VanderLey, Vice President, DigitalElliott Wilkerson, Director, Digital Media

Website performance is on the rise, but a key opportunity exists in both US and Canada
2

3
Trend highlights
• Website traffic and revenue growth trends remain strong
• Average gifts climbing in US, flattening in Canada
• Canadian conversion rates and average gift notably higher than in US
• Conversion rates are down slightly – an opportunity to optimize

4
US Mission Website Performance Trends
• Our US mission composite has seen growth in online traffic, revenue & transactions in the 10 – 15% range within the last year.
• A combination of website investments/improvements and driving additional website traffic through paid media has contributed significantly to this increase
• Avg. gift has increased to $138 (up 6% over the last year)
• Conversion rates are fluctuating, but come in between 2.6 – 2.8%.
Source: Google Analytics Composite

5
Canadian Mission Website Performance Trends
• Our Canadian client composite has seen growth in online traffic, revenue & transactions in the 10 – 20% range for two years in a row
• Avg. gift has leveled off a roughly $150 (slightly higher than in the US)
• Conversion rates are fluctuating, but come in between 3 – 3.5% (again higher than in the US)
• Quality metrics such as pages/visit, avg. time on site & bounce rates are all very similar to the US and close to industry standards
Source: Google Analytics Composite

US and Canadian food banks have reached a make-or-break moment when it comes to mobile experience
6

7
Composite Mobile Trends
• Mobile and Tablet usage on your websites has seen a large increase year over year
• This change isn’t just happening in traffic/visits, but we are seeing larger year over year growth in giving in both the US and Canada
Source: Google Analytics Composite

8

9
Mobile-friendly sites a must for mobile users
Source: Google
• 74% of users more likely to return to mobile-friendly site• 52% less likely to engage again with organization that has poor mobile site
experience• Key attributes that users are seeking in mobile sites:
Load time of five seconds or less Mobile-friendly features: large buttons, easy search, minimal scrolling Quick access to contact info, product info, transaction funnel

Demographic trends = new marketing opportunities
10

11
Older audiences rapidly adopting digital, with HHI seniors leading the way

12

13

Social is mobile. Plan accordingly.
14

15

16

Optimization continues to be a game-changer for missions’ digital performance
17
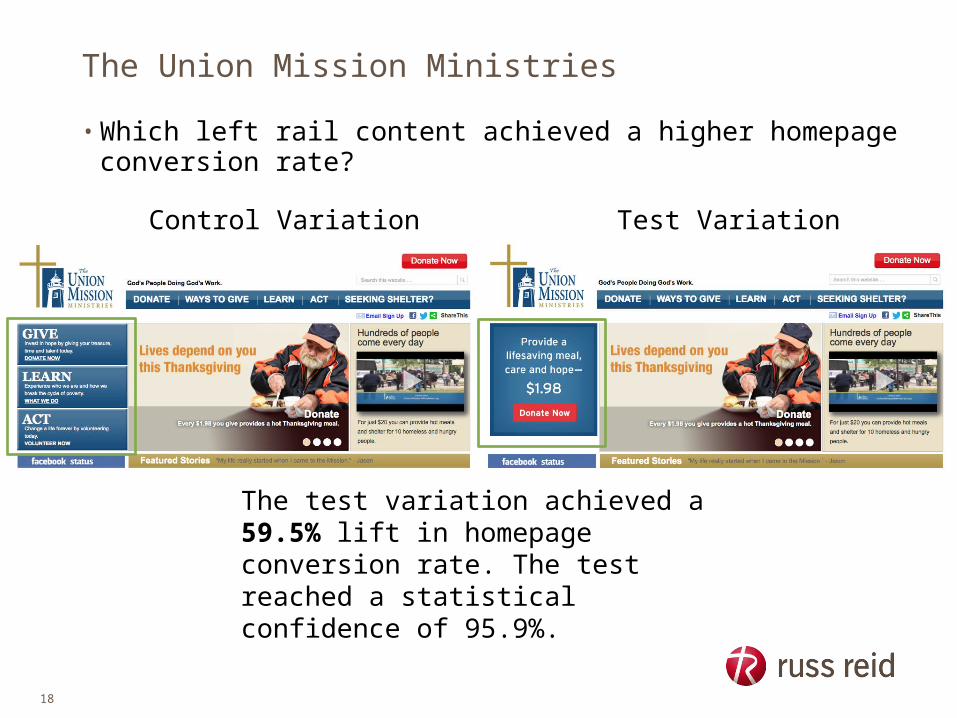
The Union Mission Ministries
• Which left rail content achieved a higher homepage conversion rate?
18
Control Variation Test Variation
The test variation achieved a 59.5% lift in homepage conversion rate. The test reached a statistical confidence of 95.9%.

Los Angeles Mission
• Which donation page value proposition achieved a higher conversion rate?
19
Control Variation Test Variation
The test variation achieved a 24.9% lift in conversion rate. The test reached a statistical confidence of 98.2%.

Denver Rescue Mission
• Which donation page feature content achieved a higher conversion rate?
20
Control Variation Test Variation
The test variation achieved a 8.3% lift in conversion rate. The test reached a statistical confidence of 96.8%.

Feed the Children
• Which donation page value proposition achieved the higher average order value?
21
Control Need
Multiplier

Feed the Children
• Which donation page value proposition achieved the higher average order value?
22
The Multiplier treatment achieved a 54.8% lift in average order value over the control. The test reached a confidence of 95.4%.
The Need treatment also achieved a 37.7% lift reaching a confidence of 91.9%.
The bulleted format of both the Need and Multiplier treatments improved readability and the perceived benefit of the multiplier compelled users to make larger donations.

23
What trends are you seeing?

24
What opportunities or threats are you seeing?

Biggest opportunities . . . biggest threats
25

The rise of mobile commerce
26

27

28

29
Mobile purchase study
• This Experian study shows that people who were asked were just as likely to give to a charity on Tablets as their PC (15%)
• There is a 33% drop in whether this group has given on a Mobile phone (10%)
• This percentage drop is well below the standard for all other sectors / industries listed in this study which average well over 50% drop-off in mobile conversion

30
Opportunities . . . And threats
• Responsiveness rules
• The impact on donor loyalty
• Cross-platform advertising
• Simple transaction technology

The Attribution Conundrum
31

32
Digital Channel Impact / Attribution
- Attribution has become the topic of interest in the industry (Offline & Online)
- We live in a complicated environment where campaigns and channels impact each other in all integral elements of a conversion funnel
- This study shows that some channels have strengths in certain steps within the path, but all have attribution issues
- Search has shown to be the best at single channel attribution, but only occurs 10% of the time
Source: Convertro Cross-Client Attribution Data Q1 2014

Digital attribution & reporting
33
• There are tools available that specialize in tracking multiple digital campaigns
• Russ Reid utilizes a combination of Google Analytics and Double Click (a 3rd party ad server)
• These tools can track touch points for multiple campaigns and help to determine the correct models for applying credit.
• This at the end of the day prevents double counting, and gives us the best information for making strategic decisions on how to best allocate budget
• Transaction IDs tracking allows us to do deep dive analysis to see the following:• New vs. existing vs. reactivated donors that our campaigns are influencing• Second gift conversion rates• Long-term donor value

Offline to Online Attribution Methodology
34
• Online/offline match back analysis to determine percentage of donors driven by complementary channels
• TV/digital/radio lift analyses to determine lift in markets where all channels vs. some are present, to determine impact of channel mix on total lift
• Correlation of lifts in gift frequency and retention to awareness driving activities
• Culminates in matrix credit for driver channels to enable optimal mix
• Not all clients need all methodologies – depends on the mix
• Formal attribution models are cost-prohibitive for virtually all nonprofits

35
Opportunities . . . And threats
• Simple solutions?
• The mix model
• The power of the assist
• Diversifying too fast, or too slow
• The danger of single touch metrics in a multi touch world
• New opportunities for competitive advantage

Trends in digital media
36

37
Cross platform retargeting
• #1 Thing to remember: Measure individual interactions across all device types
• Benefit: Reach audience with high frequency in timely manner on any connected device
• Needs: minimum spend, 6 week campaign recommended
Multiple touch points = increased awareness

Location Based Targeting
“Geo-fencing” for mobile reach and location data targetingGoals: Driving user activity while at a specific location, driving users to a specific location, gather data on user movement and trends for specific regions, or demos
Needs: Mobile Creative, Minimum Budget ($50K), Desired Location(s)

Offline to online targeting
#1 Thing to remember: Target all existing donors online
Benefit: Access loyal “offline” donors (or full CRM) with multi-channel messaging
Needs: Sizeable donor file, minimum spend, 3 month campaign recommended
39