Copper Tubes & Bars by Krishna Copper Pvt. Ltd. (Copper Nickel), Mumbai

Digital Reconstruction and Visualisation of Peshwa Period Water System of Pune
Pallavee Gokhale1 and Sushama G. Deo2 1. Department of Archaeology, Deccan College Post Graduate Research Institute,
Pune- 411006, Maharashtra, India (Email: [email protected]) 2. Department of Archaeology, Deccan College Post Graduate Research Institute,
Pune- 411006, Maharashtra, India (Email: [email protected])
Received: 19 August 2016; Accepted: 08 September 2016; Revised: 03 October 2016 Heritage: Journal of Multidisciplinary Studies in Archaeology 4 (2016): 653-669
Abstract: The water supply system of Pune during the Peshwa Period is a testament to exemplary engineering, administration and city planning. System of cisterns, reservoirs, dipping wells (Ooswas), and underground artificial aqueducts (Nal/ Nahar) constituted a dense network, and has worked efficiently since its incorporation in the 1750s to the present. Accelerated urbanisation over the last few decades has l e f t m an y comp o n e nt s o f t h i s sy s t em e i th e r a b a nd o n ed o r c omp l e t e ly d e s t roy ed . Despite this, we find the same being exploited at the time of water crisis. This paper aims at creating interactive digital 3D models of this underground water supply system of 18th century Pune. It is an effort to virtually reconstruct the entire system with the aid of Geographic Information System viz. GIS. These models have been built using multiple data sources such as raster source maps, Bing roadmap, topographical maps along with vector data of the aqueduct network created by the authors.
Keywords: GIS, Visualisation, Pune, Aqueduct, Peshwa, 3D, Water Supply
Introduction Pune, situated on the banks of the Mula and Mutha rivers, is central to the Deccan from both the geographic and political points of view. It provided an ideal location for Bajirao Ballal, popularly known as Peshwa Bajirao I to shift base from Satara and develop Pune as the capital city of the Maratha Empire. Prior to this, Pune existed as a small village whose oldest references date back to 800 CE. It was however well established as the capital city during the time of the Peshwas. Though the Peshwas ruled in the capacity of prime-ministers of Shahu Maharaj, a descendant of Shivaji Maharaj, their vigour and valour established them as leaders of the Maratha Empire.
Under Peshwa administration, due importance was given to city planning, and the same was implemented using the best possible means available at the time. Water management played a critical role in the development of Pune’s urbanity. Regular supply of potable and non-potable water was the responsibility of the ruling

ISSN 2347 – 5463 Heritage: Journal of Multidisciplinary Studies in Archaeology 4: 2016
654
administration, and we find it being executed in a well engineered manner by the Peshwas. System of cisterns/ reservoirs (Haud), dipping wells (Ooswas), and underground man-made aqueducts (Nal/ Nahar) constituted this network and has worked efficiently till date. The system was first built around 1750 and was fully functional until the middle of the 20th century. The artificially built underground channels, popularly known as aqueducts carried water from its source to core parts of the city making it available in every neighbourhood before being dispensed into the river.
Water supply systems have been a topic of detailed study and interest not only for archaeologists but also for historians, geologists, architects, geographers, and even government and administrative bodies. These systems were in place in various forms since protohistoric times. As is the case with Dholavira, the hydraulic system was in the form of wells and interconnected canals. At Shringaverpura, the exposed structure indicated that flood water was diverted from the river. In Maharashtra, at the chalcolithic site of Inamgaon an example of taming the river by creating embankments to restrict flood water was observed whereas at Bhon in Buldhana district, a well constructed canal system was seen. Studies till date have however mainly revolved around analysis of literary evidence, explorations, excavations, etc.
Information related to Pune’s water supply system during the Peshwa period is fragmented, and available in different formats. Information about where and how these underground aqueducts were built, which cisterns were fed by different aqueducts and their location in the city was available in scattered form in municipal corporation survey reports, volumes of city survey work carried out during t h e 1940s by t h e Bharat Itihas Samshodhak Mandal viz. BISM, Pune, surveyed maps generated during British rule, and other historical and recent literature about Pune. Accelerated urbanisation over the last few decades in core parts of the city severely damaged it leaving most of the components in a state of abandonment. However till 1970-80, active usage of this water system was prevalent within the older city limits. We also find the same being exploited at the time of water crisis. The aim of this project was to digitally reconstruct this partially existing, artificial water distribution system based on resources mentioned above. 3D digital model and visualisation of this underground water supply system of 18th century Pune was done using the open source Geographic Information System viz. GIS application named QGIS.
Study Area Pune, at 18°30' N and 73°53' E, and about 564 meter above sea level (Gazetteer, 1885) is an important city in the state of Maharashtra in western India. It is situated at the confluence of the Rivers Mula and Mutha. The south-eastern side and western side of city has small and big hillocks, making a natural saucer-like northward sloping terrain where the city grew adjacent to the rivers. The Katraj dam which acted as the main source for the Katraj aqueduct is constructed on the southern side on relatively higher ground. The historicity of Pune has been well established through the 8th

Gokhale and Deo 2016: 653-669
655
century CE Rashtrakut dynasty's copper plates relating to land-grants. The 10th century CE copper plate of the Shilahar King Aparajit identifies Pune as 'Punak Vishaya', a place of district importance (Dhavalikar, 2000).
For the first time, an effort in salvage archaeology was conducted by Shinde et al. (2002-2003) at the time when foundation trenches were being dug for new construction in core parts of the city. Based on ceramic assemblages, structures, bones, bricks, etc. it was noted that the oldest settlement could be dated from 200 BCE to 200 CE i.e. early to late Satavahana period, while later occupation belonged to the Vakataka period i.e. 4th-5th century CE. In 2006, a study by S. Deo, P. P. Jogalekar (Jogalekar et al. 2006) helped understand the fluctuating flood levels of Mutha, and then separating the antiquities from primary and semi-primary contexts. Thus it is clear that Pune’s location attracted people who settled there permanently at least since the beginning of the Christian era.
Though Pune, in a broader sense refers to the modern city covering an area greater than 240 sq km, and having a population in excess of 30 lakhs, the study area of the present work is restricted to the oldest part which comprises wards, locally known as Peths (Fig. 1).
Figure 1: Old Pune (Encircled in Centre; Outlined Areas in Legend) and New Pune
(Courtesy PMC)

ISSN 2347 – 5463 Heritage: Journal of Multidisciplinary Studies in Archaeology 4: 2016
656
Historic Water Supply System In 1750, during the reign of Peshwa Bajirao I (1740-1761), in order to meet the water supply needs of Pune city, two stone masonry dams at different levels were constructed in Katraj around 6 to 8 km away south of the site. The dams accumulated rainwater runoff from the hill slopes and also had fresh water springs in its bed. A gradual drop of about 100+ meters existed from the Katraj dam upto the Mutha river. The water percolated into the first tank allowing silt to settle down before flowing into the second tank. It was then carried into a masonry aqueduct locally known as Nal/Nahar. The aqueduct, an arched tunnel (Mate, 1998) which was about 2 to 3 meter below ground level measured around 80 cm in width and around 2 meter in height allowing a person to walk comfortably across its entire length. The water was brought into Shaniwar Wada, around 10 km to the north, the residential palace and court of the Peshwas with excess water being carried to the Mutha river.
On this entire track, air-shafts or dipping wells, locally known as Uchchhwas, literally meaning exhaling out air (mentioned as Ooswas in the surveyed maps), were built at intervals approximately 90 to 100 meters apart. These functioned to prevent silting, and choking due to air. Several cisterns, both public and private were built on this aqueduct throughout the city, making water available to people in their own neighbourhood. These cisterns, popularly known as ‘Haud (s)’ were also places of daily public interaction and social gatherings. The water discharge was controlled at regular intervals in these air-shafts by using masonry blocking with holes having 3 to 6 inch openings (Fig. 2).
Figure 2: Aqueduct and Airshafts Technical Details (After Kamalapurkar, 2006)

Gokhale and Deo 2016: 653-669
657
The aqueduct also received an additional supply of water through many springs, and in some cases from independent adjoining wells. Gokhale (1914) gave a list of 80 Hauds which were connected to the Katraj aqueduct with their Peth location, number and condition as observed at that time.
Besides Katraj, there were three more aqueducts built by royal dignitaries from the Peshwa’s palace. There was another small aqueduct built by Balshastri Tokekar in Vetal Peth, but little information is available on it. Table 1 provides a snapshot of the four major aqueducts along with their basic information collected from various sources.
Table 1: Basic Information of four major aqueducts Information> ----------Name
Built By Built Year
Daily supply in gallons
Source Distance/ Direction from Pune (Approx)
Katraj Balaji Bajirao
1750 6,50,000 Two dams in Katraj
6.5 km/ South
Chaudhari Rupram Chaudhari
Post 1790
50,000 Springs 11 km/ SouthWest
Fadnavis Nana Fadnavis
1790 1,00,000 Well in Narhe Ambegaon
9.5 km/ South
Raste Sardar Rastia
Post 1790
50,000 Spring 11 km/ SouthWest
Sources of Information The earliest authentic map drawings are available only from the British colonial era (1860s-70s). A map published in the Gazetteer (1885) mainly assisted in demarcating the Peth boundaries as of 1883. A map created during 1869-72 by R. E. H. Light at a scale of 1 inch: 200 feet depicted important features throughout the old city limits. Another set of maps was published by British officers around 1876 titled ‘Poona City Survey’ (PCS). This series of maps was at a scale of 1 inch: 50 feet, thereby encompassing higher levels of detail. It also depicted certain features in dash-dot type, which as per the survey drawing conventions represents underground features. These were the aqueduct connections which spread throughout the city forming a complex network. With regard to over ground features, along with the reservoirs and cisterns (Haud) the drawings also showed dipping wells (Ooswas) and junctions i.e. distribution points.
City survey works conducted and compiled by BISM were published in 1942-43, and then in 1946-52 under the title of 'Pune Nagar Samshodhan Vrutta' (PNSV). In its first volume, an independent chapter had details of the old cisterns (Karve 1942). It clearly mentioned the cisterns being fed by four different aqueducts, their approximate locations, and their ownership i.e. public or private. Other chapters also provided valuable information where the areas adjacent to locations of cisterns were described.

ISSN 2347 – 5463 Heritage: Journal of Multidisciplinary Studies in Archaeology 4: 2016
658
Recent work on the city of Pune by historians Diddi and Gupta (2000) also showed a rough tentative sketch of these aqueducts (Fig. 3). Though informative, this was inadequate to recreate a complete network in the digital space.
Figure 3: Aqueduct Network in Pune in 1818 (After Diddi and Gupta 2000)
The survey conducted by Bhagvat (2004) and others from 1992 to 2004 was probably the first effort to physically examine the status of these aqueducts and trace their connectivity through the densely populated area of the city. Their observations were in complete agreement with the information available in the Gazetteer and previous

Gokhale and Deo 2016: 653-669
659
survey of PNSV. Some Wadas, especially in the Peth areas of Budhwar, Guruwar, Shukrawar, and Shaniwar were still using the water from the cisterns. In areas expanding beyond Peths, water tankers were filled by pumping out water from the aqueducts via dipping well outlets. Other literary work provided valuable metadata and reference material for virtual reconstruction.
Textual and Spatial Reference Creation The methodology implemented for the present study was multi-fold in nature. PNSV volumes were studied in detail to understand the layout and details of the city. The information was tabulated into fields such as Peth Location, Feeder Aqueduct, Built By, Built Year, Daily Water Quantity etc. Data compiled by Gokhale (1914) was also incorporated into the table. The information about four different aqueducts which fed these cisterns was also tabulated and was used as a main reference to recreate the underground network. Though additional textual works pertinent to the historic period of Pune were referenced, the Gazetteer was used as the main reference text in case of ambiguity.
Compiling spatial information from maps of different scales was a challenging task. The Gazetteer map (1885) with a scale of 1 inch: 500 yard i.e. 1 Inch : 1500 feet was insufficient to capture details of the structures, roads etc. However this map was the only source of Peth boundaries (Fig. 4).
Figure 4: Sample Area from Gazetteer Map; Scale 1 Inch: 1500 Feet

ISSN 2347 – 5463 Heritage: Journal of Multidisciplinary Studies in Archaeology 4: 2016
660
A 1 inch: 200 feet scale map (Light, 1869-72), part of the BISM museum collection played a crucial role in understanding the overall layout of the old city (Fig. 5).
Figure 5: Sample Area from BISM Map; Scale 1 Inch: 200 Feet
Individual maps form the PCS series were used to create a continuous sequence for complete coverage of the city as seen in the BISM map. The exercise, acting like a jigsaw puzzle aided in matching the boundaries of the adjacent PCS maps. These boundary-matched PCS sheets were later superimposed on the BISM maps as described in the following sections. These maps, at the scale of 1 inch : 50 feet depicted large number of details such as plans of big mansions, layout of temples, burial ground details, etc. The precise location of cisterns, their main distribution points, locations of air-shafts were also clearly shown (Fig. 6).
The BISM map was geo-referenced using GCPs (Ground Control Points) collected from a field survey. GCPs were selected in such a way such that those locations were visible on a map as well as identifiable on t h e ground, and have been stationary since they came into existence. These were mostly temples, and corners of the still standing mansions. Positional accuracy was higher in the central portion than the peripheral regions towards the east of the city. This was due to the varying availability of suitable features further impacting the concentration of GCPs (Fig. 7).

Gokhale and Deo 2016: 653-669
661
Figure 6: Sample Area from PCS Map; Scale 1Inch: 50 Feet
Figure 7: BISM Map with GCPs

ISSN 2347 – 5463 Heritage: Journal of Multidisciplinary Studies in Archaeology 4: 2016
662
Another set of GCPs was used to geo-reference the map from the Gazetteer due to the different scale and limitation of identifiable features. It was used only for capturing the Peth boundaries. The next step was geo-referencing the entire set of PCS maps. For this task, GCPs were not collected from the ground but the already geo-referenced BISM map itself was used to place the GCPs. First order polynomial transformation was used with Nearest Neighbourhood re-sampling algorithm in all the geo-referencing (Fig. 8).
Figure 8: Geo-referenced PCS Sheets with BISM Map
Spatial Data Creation Creating digital data from all the source materials was a critical part of this project. Basic GIS guidelines were followed to define the data type for each type of feature. e.g. point data was used for wells, cisterns, air-shafts, joints, etc. Peth boundaries were captured as polygons. Line data type was used for features forming networks i.e. aqueducts and over ground natural drainage.
Offset resulting from geo-referencing different base maps was handled while digitising. The basic Peth boundaries and water bodies were digitised using BISM and Gazetteer maps as source data. PCS maps were used to capture feature level data. All the spatial features created in this process were attached with the attributes collected in the initial stages of the project from literature, other reference maps, survey
Gokhale and Deo 2016: 653-669
663
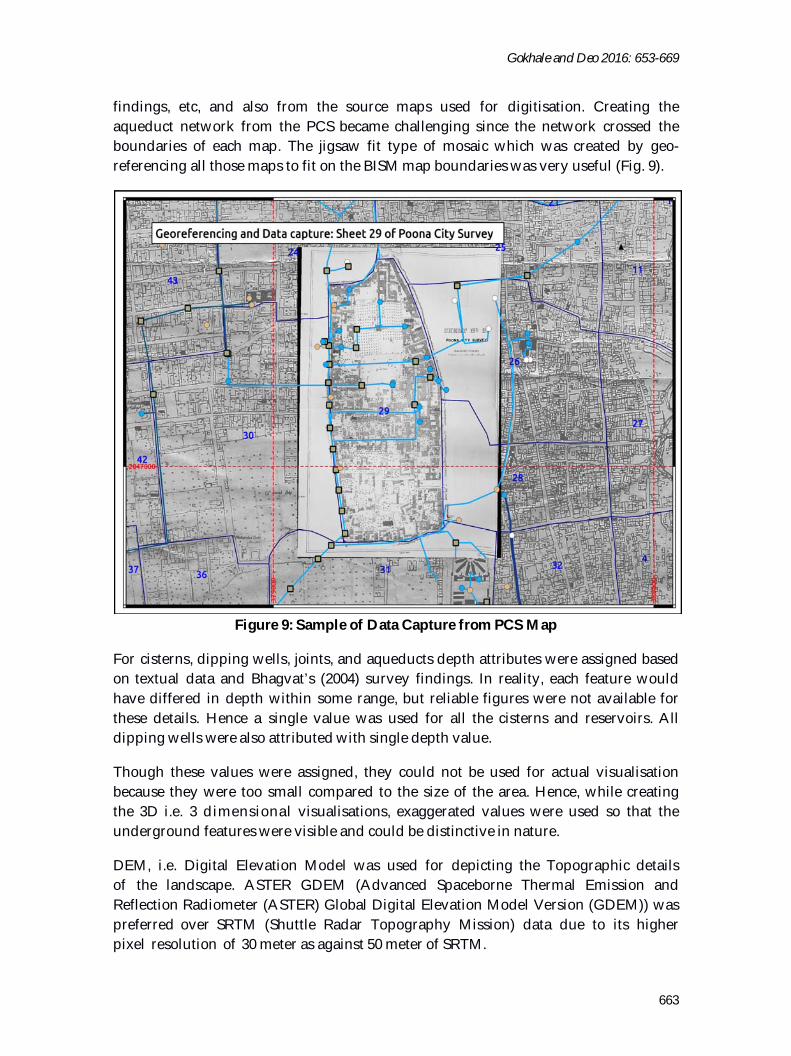
findings, etc, and also from the source maps used for digitisation. Creating the aqueduct network from the PCS became challenging since the network crossed the boundaries of each map. The jigsaw fit type of mosaic which was created by geo-referencing all those maps to fit on the BISM map boundaries was very useful (Fig. 9).
Figure 9: Sample of Data Capture from PCS Map
For cisterns, dipping wells, joints, and aqueducts depth attributes were assigned based on textual data and Bhagvat’s (2004) survey findings. In reality, each feature would have differed in depth within some range, but reliable figures were not available for these details. Hence a single value was used for all the cisterns and reservoirs. All dipping wells were also attributed with single depth value.
Though these values were assigned, they could not be used for actual visualisation because they were too small compared to the size of the area. Hence, while creating the 3D i.e. 3 dimensional visualisations, exaggerated values were used so that the underground features were visible and could be distinctive in nature.
DEM, i.e. Digital Elevation Model was used for depicting the Topographic details of the landscape. ASTER GDEM (Advanced Spaceborne Thermal Emission and Reflection Radiometer (ASTER) Global Digital Elevation Model Version (GDEM)) was preferred over SRTM (Shuttle Radar Topography Mission) data due to its higher pixel resolution of 30 meter as against 50 meter of SRTM.

ISSN 2347 – 5463 Heritage: Journal of Multidisciplinary Studies in Archaeology 4: 2016
664
Field Verification Though many of the over ground cisterns were destroyed in the process of modern urbanisation, their tentative locations were still known to the locals. The collective social memory is still very fresh because there are people of that generation for whom using water from these cisterns was an everyday affair. First hand information given by the locals in Peth areas related to the amount of water seen during the foundation stages of new building constructions. The ground verification was conducted in a limited area. Experiences shared by Bhagvat S. (1992-2004), their hand drawings and suggestions of locations for ground verification were vital. The results of this survey were incorporated into the spatial data by making necessary modifications to attributes or geometry or both. Few areas in the southern part of the city which were beyond the older city limits were also surveyed since they housed the Katraj aqueduct beneath them. It revealed few dipping wells which are still in use today for drawing out water. The local residents are aware of the connection of these water outlets to t h e Katraj lake and their antiquity belonging to the Peshwa period. However, no standard procedure is implemented to regularise the water supply from these dipping wells. This was experienced even in parts of the city.
Results The basic statistics for the features captured in the project is tabulated here (Tables 2 and 3).
Table 2: Feeder Aqueduct Statistics Feeder Length (Approximate in Km) Count of Outlets
Katraj 14 + 6 (City + From Katraj to City 134
Chaudhari 2.5 15 Raste 1 8 Fadnavis 5 22 No Link - 12
Table 3: Water Outlet Type Statistics Type Reservoir Cistern Dipping Well Joints Unknown
Count 52 51 69 18 19
Once the spatial data was ready, it was initially plotted in the map format (Figs. 10 and 11).
3-Dimensional (also referred as 2.5-Dimensional) models were built. Though the values of depth, radius were assigned, those were not used while creating the actual model. For the purpose of visualisation, exaggerated values were used for the depth and radius of both water outlets and aqueducts. For the DEM, vertical exaggeration of 1.5 was used. Different models were built with different datasets and focused on different areas of the entire network. The visualisation revealed the entire system

Gokhale and Deo 2016: 653-669
665
Figure 10: Complete Cistern-Aqueduct Network as of 1876
Figure 11: Aqueduct Network Overlaid on Elevation Data for 3D Model

ISSN 2347 – 5463 Heritage: Journal of Multidisciplinary Studies in Archaeology 4: 2016
666
design. Its close relationship with the topography became ‘visible’ for the first time. The density of both aqueducts and cisterns provided a detail view of the actual accessibility of water in every neighbourhood. It not only provided an underground view but also an insight into the massive scale of the system with details of its components as revealed from maps and their placements underground (Figs. 12-14).
Figure 12: Katraj Lakes with Topography
Figure 13: Katraj-City Link with Topography
Figure 14: Aqueduct Network and Dipping Wells with PCS Sheet

Gokhale and Deo 2016: 653-669
667
Hosting Interactive 3D Models The models were uploaded on the internet in an open source repository and are freely accessible to anyone. Viewers can interact i.e. zoom, pan, rotate, click for information etc with these models to ‘experience’ the water supply system of the Peshwa period. Weblinks for the hosted 3D models are listed below:
Main Page: http://g-pallavee.github.io/DDD CloserView: Peth (ward/ neighbourhood) level view of the network: http://g-
pallavee.github.io/DDD/pune/models/CloserView/CloserView.html DippingWells - Dipping wells and Cisterns: http://g-pallavee.github.io/DDD/
pune/models/CloserView/CloserView.html KatrajLake: Source of Katraj aqueduct. Katraj aqueduct was the biggest of
four aqueducts of the Pune city: http://g-pallavee.github.io/DDD/pune/ models/KatrajLake/KatrajLake.html
KatrajNetworkCity: Katraj aqueduct networkhttp://g-pallavee. github.io/DDD/ pune/models/KatrajNetworkCity/KatrajNetworkCity.html
KatrajToPune: Katraj aqueduct network to Pune city: http://g-pallavee.github.io/ DDD/pune/models/KatrajToPune/KatrajToPune.html
PuneAll: All cisterns and network of 4 aqueducts: http://g-pallavee.github.io/ DDD/pune/models/PuneAll/PuneAll.html
WithBing: Aqueduct network with Bing roadmap: Cutting across space and time: http://g-pallavee.github.io/DDD/pune/models/WithBing/WithBing.html
WithBISM: Aqueduct network with one of the oldest surveyed maps of Pune city: http://g-pallavee.github.io/DDD/pune/models/WithBISM/WithBISM.html
Summary The present project of 3D visualisation of the water system of the Peshwa period has for the first time given an all-inclusive view of the cisterns and aqueducts spreading across the old city limits of Pune. The detailed and precise work done in surveying and producing maps about 150 years ago is commendable. It brought clarity to otherwise ambiguous pieces of information. The density of the network was ‘visible’ for the first time once the data was captured in vector format. It was particularly dense in the areas near Shaniwar Wada, the Peshwa Palace and also in Shukrawar Peth, with a lot of dipping wells where mansions of the Peshwa palace dignitaries were located. The ultimate purpose of 3D visualisation was to let the common people ‘experience’ this legacy of their own city. Since the 3D models are interactive, these can now be viewed on the computer in any freely available internet browser using different actions such as pan, tilt, zoom, and one is actually able to ‘handle’ this system in a virtual digital space. The models are hosted on the internet and are therefore available to everyone round the clock and at no cost.
Acknowledgements This paper is based on a dissertation submitted by Pallavee Gokhale (2016) under the

ISSN 2347 – 5463 Heritage: Journal of Multidisciplinary Studies in Archaeology 4: 2016
668
guidance of Prof Sushama Deo to Deccan College in partial fulfilment of M.A. degree in 'A.I.H.C. and Archaeology'. We thank Andre Baptista for painstakingly reviewing the draft and suggesting grammatical modifications. We would like to thank Bharat Itihas Samshodhak Mandal (BISM), Pune and Bombay Archives, Mumbai, for allowing access to old maps and to Mr Sandesh Bhandare and Mr Siddhartha Kelkar for introducing us to the old surveyed maps of Pune. We especially appreciate Mr Sriram and Mr Srikrishna Bhagvat for openly sharing a lot of information collected during their own survey. Arch. Shubhada Kamalapurkar was kind to share her research on this subject. We are thankful to Mr Mandar Lawate, for extending help in accessing the maps and books in the BISM collection. Our thanks to Scott Madry for the QGIS training which he conducted at the Duke University campus in October 2014. We express deep gratitude to Mr Kevin Standage, UK for assisting us in accessing the old maps available in the British Library (BL), London. It is also worth mentioning that the BL staff was cooperative in allowing us access the maps. Few local residents such as Mrs Date and Mr Chaunde in Shukrawar Peth, Mr Gore in Padmavati, Mrs Gadgil in Sadashiv Peth provided valuable information which revealed that though the aqueduct system is not functioning today, it is very much alive in the social memory.
References ASTER DEM accessed online at https://asterweb.jpl.nasa.gov/gdem.asp. Bhagvat S., Bhagvat S., 1992 to 2004. Personal collection of photographs, sketches,
notes and news articles Bhagvat S., Bhagvat S., Bangude N., Lonkar S., 2004. Peshwekalin Pani Puravatha
Yantrana Punarvapar Yojana Samiticha Prathamik Ahaval (Marathi) – Preliminary Report by the Committee on the Plan of Resurgence of Peshwa Era Water Supply System, Submitted to Pune Municipal Corporation.
Cambridge Dictionaries Online. Accessed online at http://dictionary.cambridge.org/ dictionary/english/
Deo S., Rajaguru S. N., Joglekar P. P., Pawar N., Puratattviya Drushtikonatun Prachin Pune (Marathi). Pune: In Press.
Dhavalikar M. K., 2000. Prachin Pune (Marathi), pp 21-27 in Tikekar A., Tilak A. (eds.), Shahar Pune Vol 1. Pune: Nilubhau Limaye Pratishthan.
Diddi, J. and Gupta S., 2000. Pune: Queen of the Deccan. Pune: Elephant Design. Gazetteers of Bombay Presidency, Poona District, Volume XVIII, Part III, 1885. Gokhale L. R., 1914. Katraj chi Nala (Marathi). Joglekar P. P., Deo S., Balkawade P., Rajaguru S. N., Deshpande-Mukherjee A. and
Kulkarni A. N., 2006-07. A New Look at Ancient Pune through Salvage Archaeology (2004-2006). Bulletin of the Deccan College Research Institute Vol. 66-67, 211-225.
Kamalapurkar S., 2006. Conservation of The Traditional Urban Water Supply Systems of Pune, pp. 91-94 in Chakravarty K. K., Badam G. L., Paranjpye V., (eds.), Traditionalwater management systems of India: Seminar Proceedings on

Gokhale and Deo 2016: 653-669
669
Traditional Water Management Systems 1997-98, Bhopal and New Delhi: Indira Gandhi Rashtriya Manav Sangrahalaya and Aryan Books International.
Karve C. G., (ed), 1943. Pune Nagar Samshodhan Vrutta. Vol 2-4. Pune: Bharat Itihas Samshodhak Mandal
Karve C. G., 1942. June Haud (Marathi), pp 14 in Karve C. G., (ed.), 1942. Pune Nagar Samshodhan Vrutta. Vol 1. Pune: Bharat Itihas Samshodhak Mandal Light R. E. H., 1869-72. City of Poona. Poona.
Mate M. S., 1998. A History of Water Management and Hydraulic Technology in India (1500 BC to 1800 AD). Delhi: B R Publishing Corporation
Mate M. S., 2006. Pre-mughal water supply systems in the Deccan (AD 1300-1650), pp. 46-52 in Chakravarty K. K., Badam G. L., Paranjpye V., (eds.), Traditional water management systems of India: Seminar Proceedings on Traditional Water Management Systems 1997-98, Bhopal and New Delhi: Indira Gandhi Rashtriya Manav Sangrahalaya and Aryan Books International
Poona City Survey, 1876. Pune Municipal Corporation, 2013. Draft Development Plan For Old Pune City (2007 -
2027) Published U/S 26(1) Of Mr and Tp Act 1966. Accessed online at http://www.indiaenvironmentportal.org.in/files/file/Final_DP_Report New-1.pdf
Pune Municipal Corporation, Revision Of Development Plan Sanctioned In 1987, As Tp 1966 Section 38, Strategic Environmental Assessment Scoping Report. Accessed online http://www.punecorporation.org/informpdf/green%20Pune/SEA.pdf
QGIS documentation accessed online at http://docs.qgis.org/2.6/en/docs/user_manual/ Shinde V., Rajaguru S. N, Deshpande S. S., Deshpande S., Shirvalkar P.,
Balkawade P., Joglekar P. P., Deo S., Salim S., Kothari N., 2002-2003. New Light on the History of Pune City: Results of an Archaeological Rescue Operation. Puratattva 33, pp 52-63, 200-203.