Digital & Physical Piracy in GB - British Film · PDF fileDigital & Physical Piracy in GB ......
60
Digital & Physical Piracy in GB Wave 5: November 2007
Transcript of Digital & Physical Piracy in GB - British Film · PDF fileDigital & Physical Piracy in GB ......
Digital & Physical Piracy in GB
Wave 5: November 2007
2Piracy in G.B. Nov 2007
1. Approach / Key findings
2. Piracy: The scale of the problem
3. Impact of Piracy: Film and TV Series
4. Counterfeit and Home Copied DVDs
5. Downloading and Burning
6. Borrowing and Viewing
3Piracy in G.B. Nov 2007
BackgroundThis is the fifth wave of a national survey on the scale and impact of piracy and the motivations and behaviour of the people who engage in it.
The main objectives are to assess the scale and impact of video piracy in the UK, and to get a better understanding of the motivations and behaviour of the people who engage in it.
The survey explores the three types of piracy: Physical piracy: buying counterfeit or home copied DVDsDigital piracy: electronic distribution (downloading/streaming) from unofficial sourcesSecondary piracy: Borrowing or viewing an illegal copy – as opposed to making or buying one
For each type of piracy, we assess:The proportion of people who are engaged in itThe average number of pirated unitsThe prices paid per unitThe proportion of pirated units that result in genuine lost sales
This information is used to estimate the overall impact of piracy on the film and TV industry and identify trend.
4Piracy in G.B. Nov 2007
Fieldwork was conducted in November 2007.
Sample was consistent with earlier waves: 2000 adults aged 15+ who were interviewed by Ipsos in their own homes as part of it’s Capibus study.
The sample is nationally and regionally representative and is matched to the previous waves, ensuring direct comparability in the results (NB the respondents are not the same people as in the previous studies)
Respondents were initially asked for their experiences of film and TV consumption over the last 12 months.
Respondents involved in some form of piracy were then questioned in detail about a set list of titles (see appendix) to allow us to understand the extent to which piracy cannibalises the film and TV industry.
Methodology
5Piracy in G.B. Nov 2007
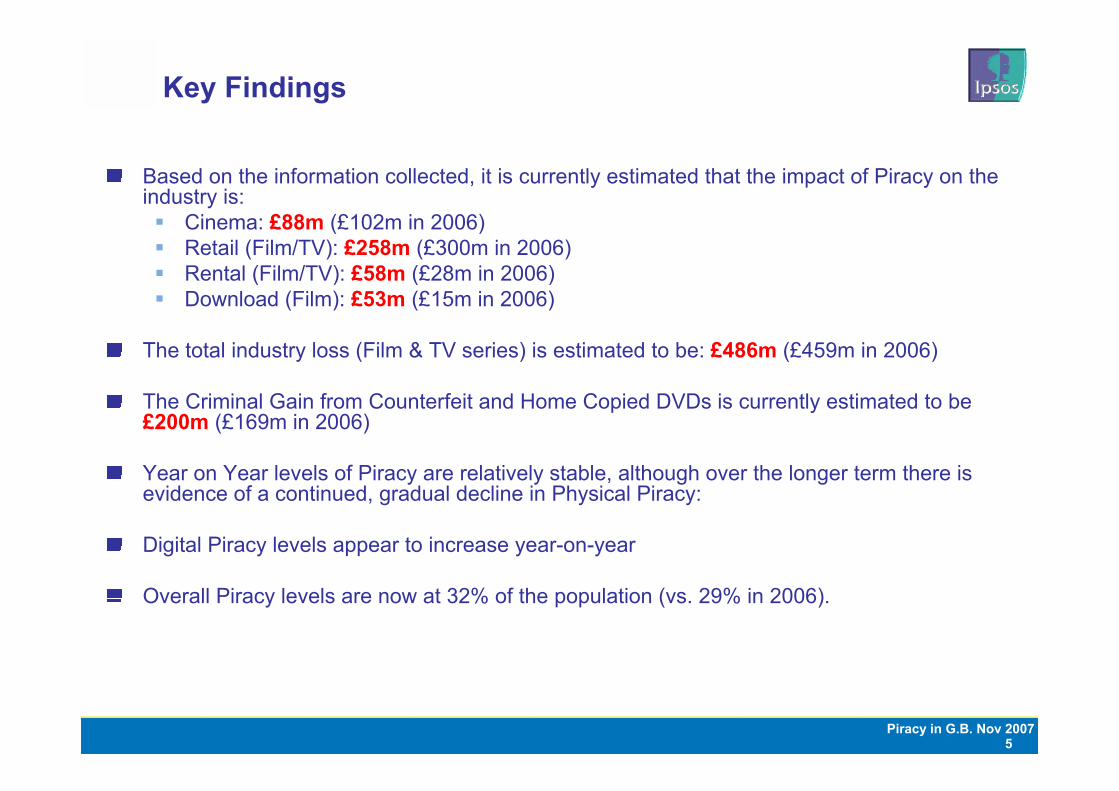
Based on the information collected, it is currently estimated that the impact of Piracy on the industry is:
Cinema: £88m (£102m in 2006)Retail (Film/TV): £258m (£300m in 2006)Rental (Film/TV): £58m (£28m in 2006)Download (Film): £53m (£15m in 2006)
The total industry loss (Film & TV series) is estimated to be: £486m (£459m in 2006)
The Criminal Gain from Counterfeit and Home Copied DVDs is currently estimated to be £200m (£169m in 2006)
Year on Year levels of Piracy are relatively stable, although over the longer term there is evidence of a continued, gradual decline in Physical Piracy:
Digital Piracy levels appear to increase year-on-year
Overall Piracy levels are now at 32% of the population (vs. 29% in 2006).
Key Findings
6Piracy in G.B. Nov 2007
1. Approach / Key findings
2. Piracy: The scale of the problem
3. Impact of Piracy: Film and TV Series
4. Counterfeit and Home Copied DVDs
5. Downloading and Burning
6. Borrowing and Viewing
7Piracy in G.B. Nov 2007
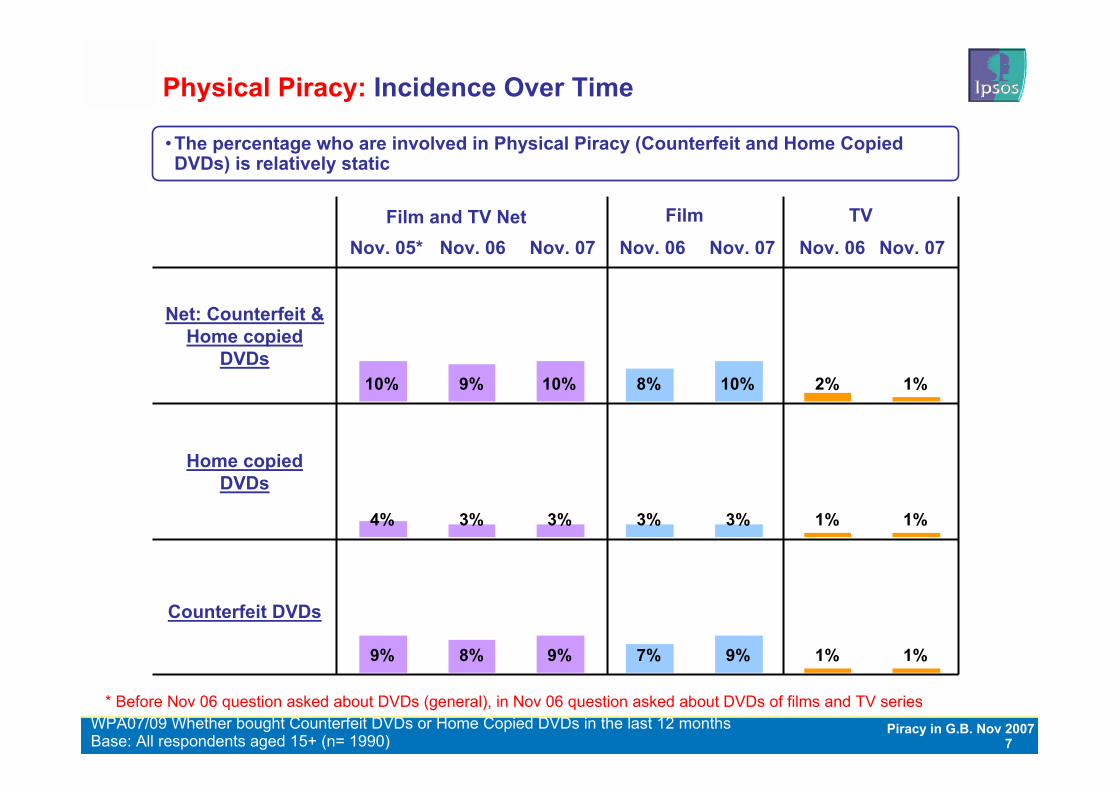
Physical Piracy: Incidence Over Time
10% 9% 10% 2% 1%8% 10%
Counterfeit DVDs
Home copied DVDs
Net: Counterfeit &Home copied
DVDs
Base: All respondents aged 15+ (n= 1990)WPA07/09 Whether bought Counterfeit DVDs or Home Copied DVDs in the last 12 months
* Before Nov 06 question asked about DVDs (general), in Nov 06 question asked about DVDs of films and TV series
• The percentage who are involved in Physical Piracy (Counterfeit and Home Copied DVDs) is relatively static
Nov. 05* Nov. 06 Nov. 07 Nov. 06 Nov. 07 Nov. 06 Nov. 07 Film and TV Net Film TV
4% 3% 3% 3% 3% 1% 1%
9% 8% 9% 1% 1%7% 9%
8Piracy in G.B. Nov 2007
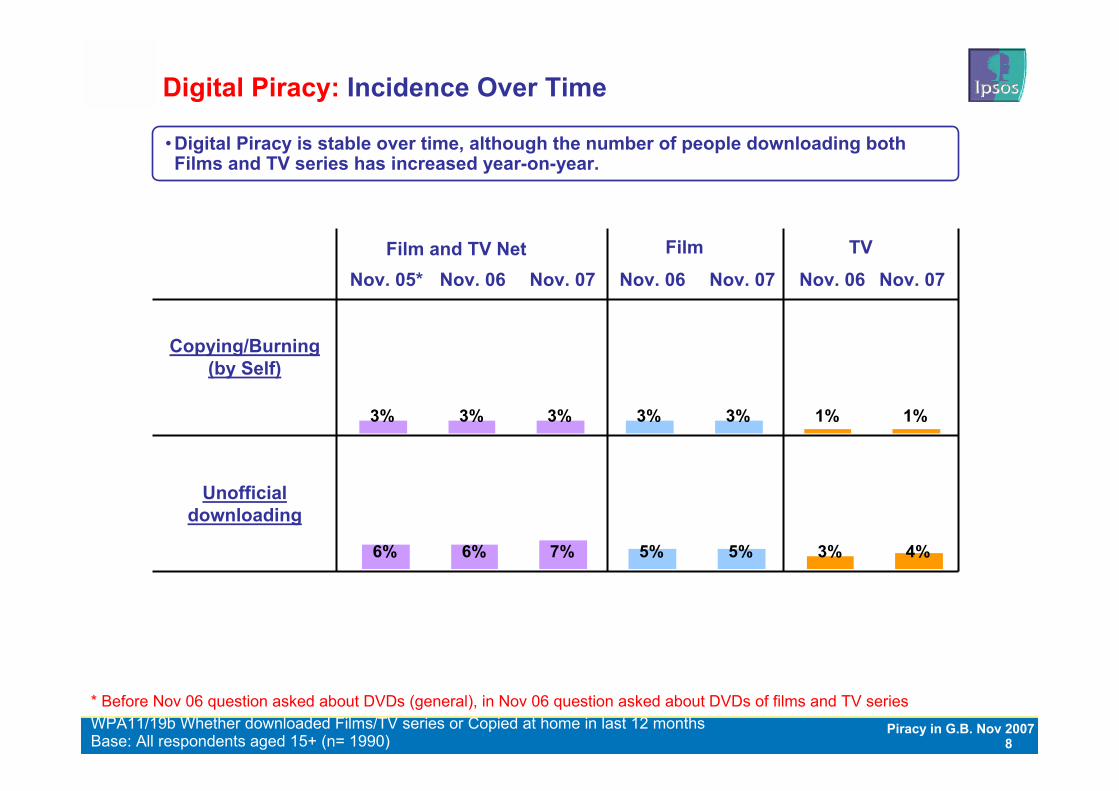
3% 3% 3% 1% 1%3% 3%
Unofficial downloading
Copying/Burning (by Self)
Nov. 05* Nov. 06 Nov. 07 Nov. 06 Nov. 07 Nov. 06 Nov. 07 Film and TV Net Film TV
3% 4%7%6%6% 5% 5%
Digital Piracy: Incidence Over Time
Base: All respondents aged 15+ (n= 1990)WPA11/19b Whether downloaded Films/TV series or Copied at home in last 12 months
• Digital Piracy is stable over time, although the number of people downloading both Films and TV series has increased year-on-year.
* Before Nov 06 question asked about DVDs (general), in Nov 06 question asked about DVDs of films and TV series
9Piracy in G.B. Nov 2007
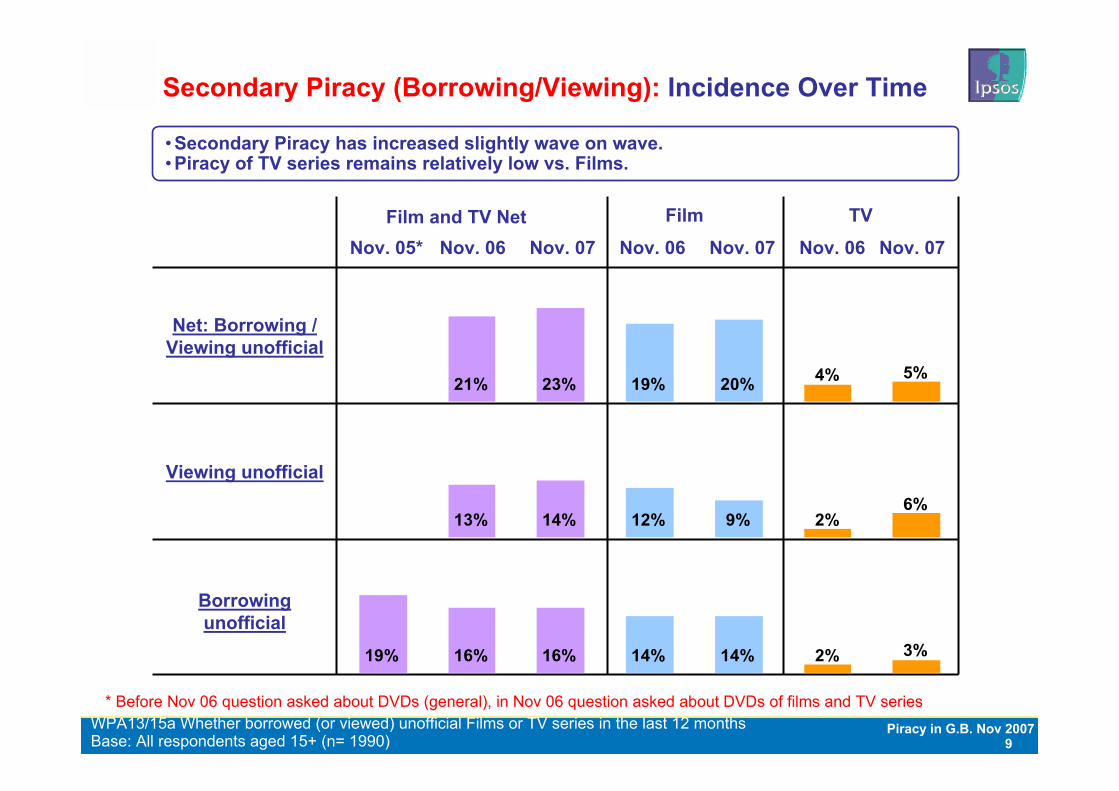
21% 23% 4% 5%19% 20%
Borrowing unofficial
Viewing unofficial
Net: Borrowing / Viewing unofficial
Nov. 05* Nov. 06 Nov. 07 Nov. 06 Nov. 07 Nov. 06 Nov. 07 Film and TV Net Film TV
13% 14% 12% 9% 2%6%
19% 16% 16% 2% 3%14% 14%
Secondary Piracy (Borrowing/Viewing): Incidence Over Time
Base: All respondents aged 15+ (n= 1990)WPA13/15a Whether borrowed (or viewed) unofficial Films or TV series in the last 12 months
* Before Nov 06 question asked about DVDs (general), in Nov 06 question asked about DVDs of films and TV series
• Secondary Piracy has increased slightly wave on wave. • Piracy of TV series remains relatively low vs. Films.
10Piracy in G.B. Nov 2007
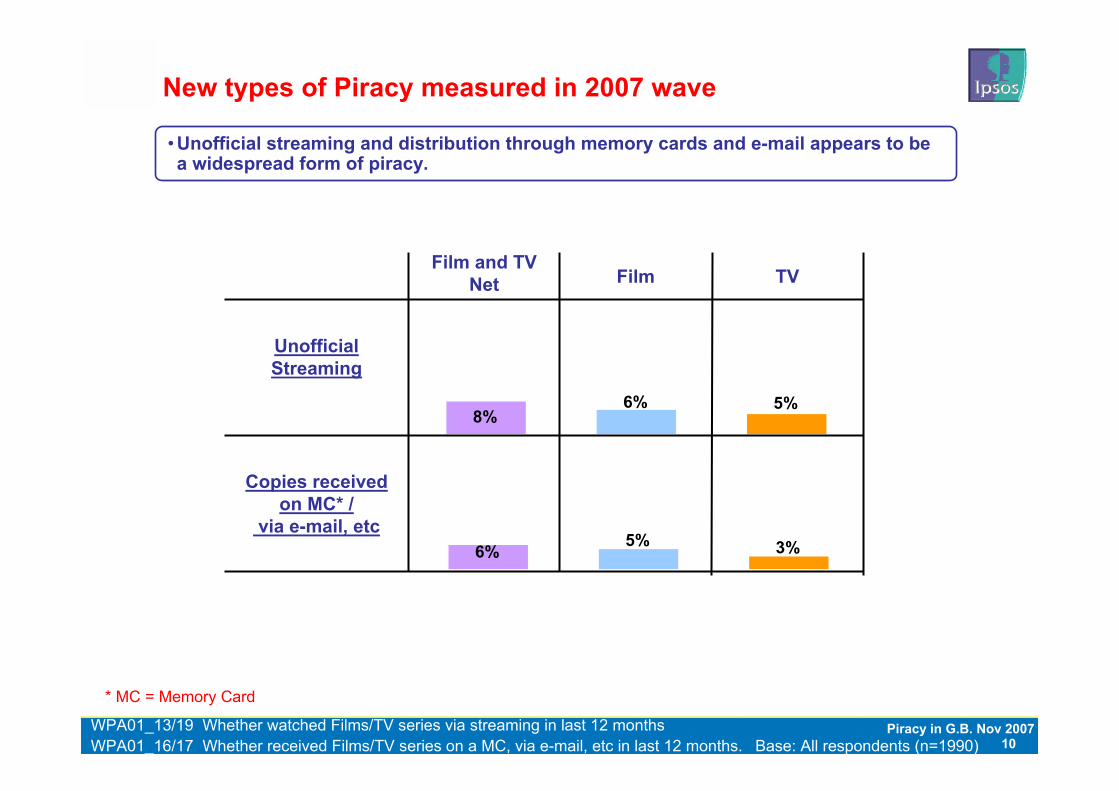
8%6% 5%
Copies received on MC* /
via e-mail, etc
Unofficial Streaming
Film and TV Net Film TV
New types of Piracy measured in 2007 wave
• Unofficial streaming and distribution through memory cards and e-mail appears to be a widespread form of piracy.
Base: All respondents (n=1990)WPA01_13/19 Whether watched Films/TV series via streaming in last 12 monthsWPA01_16/17 Whether received Films/TV series on a MC, via e-mail, etc in last 12 months.
* MC = Memory Card
6% 3%5%
11Piracy in G.B. Nov 2007
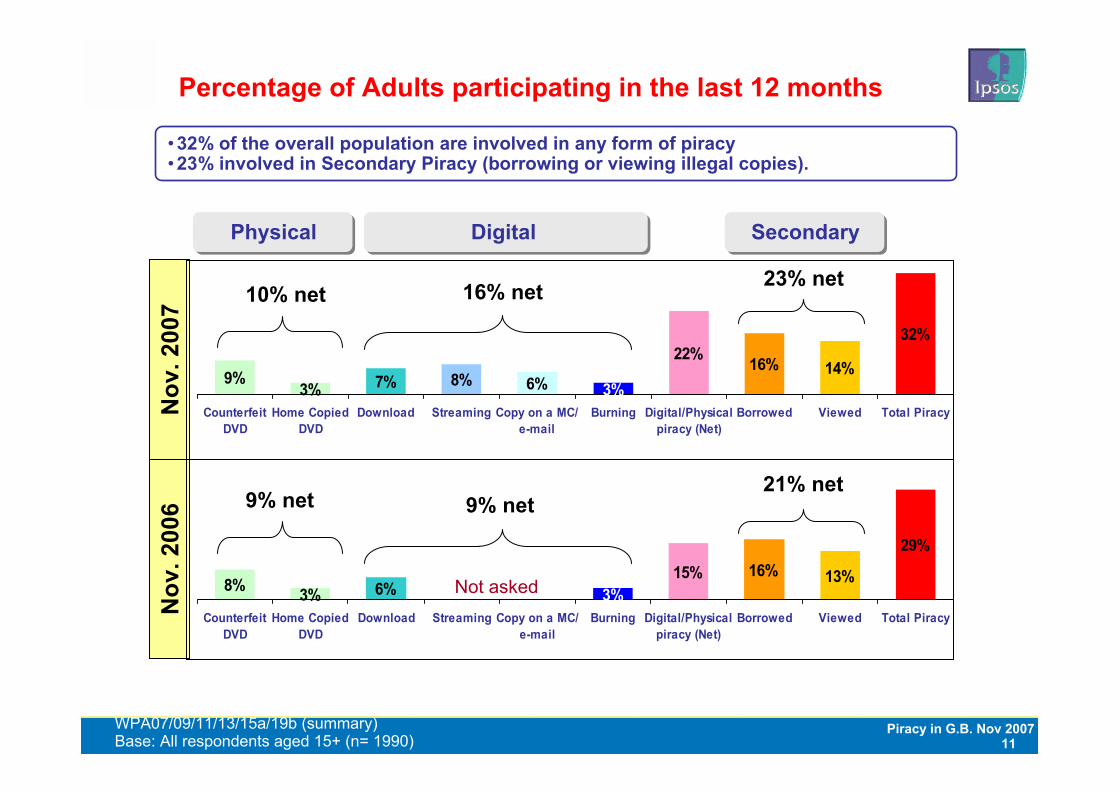
8% 3% 6%15% 16% 13%
29%
3%Counterfeit
DVDHome Copied
DVDDownload Streaming Copy on a MC/
e-mailBurning Digital/Physical
piracy (Net)Borrowed Viewed Total Piracy
Percentage of Adults participating in the last 12 months
9%3% 7% 8% 6%
22% 16% 14%
32%
3%Counterfeit
DVDHome Copied
DVDDownload Streaming Copy on a MC/
e-mailBurning Digital/Physical
piracy (Net)Borrowed Viewed Total Piracy
Base: All respondents aged 15+ (n= 1990)
10% net 16% net
Nov
. 200
7N
ov. 2
006
23% net
WPA07/09/11/13/15a/19b (summary)
9% net 9% net21% net
Not asked
• 32% of the overall population are involved in any form of piracy• 23% involved in Secondary Piracy (borrowing or viewing illegal copies).
Physical Digital Secondary
12Piracy in G.B. Nov 2007
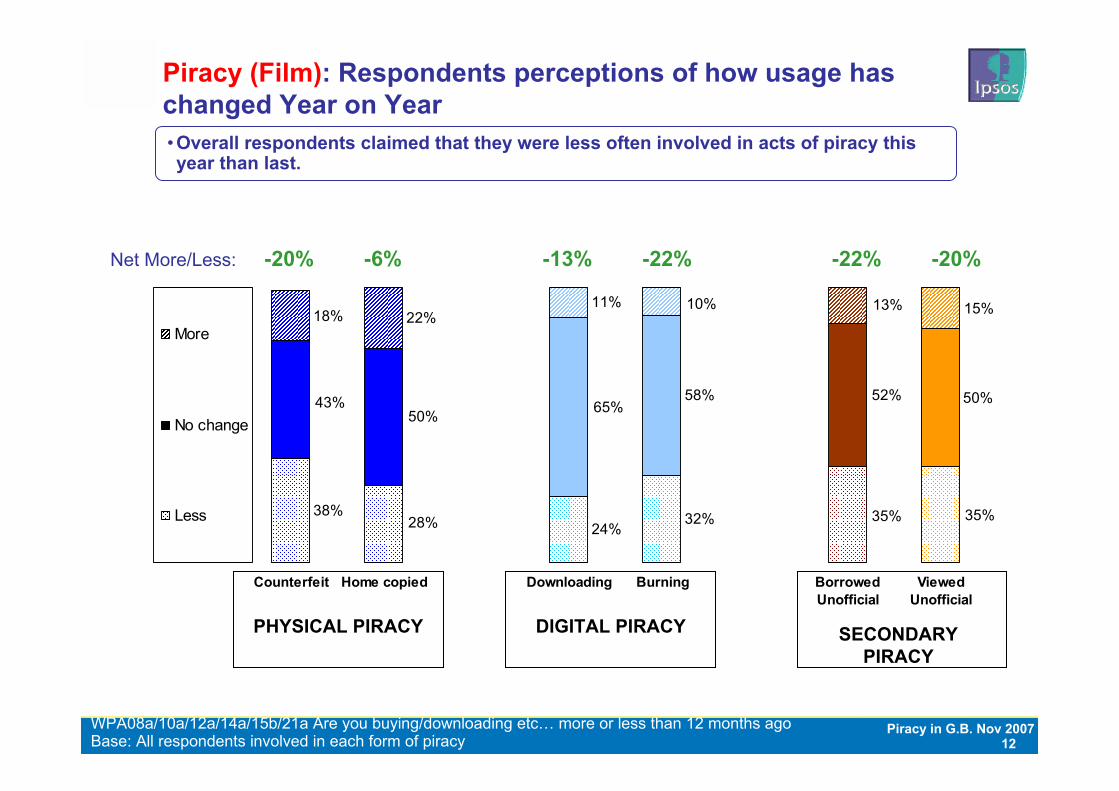
Piracy (Film): Respondents perceptions of how usage has changed Year on Year
Base: All respondents involved in each form of piracyWPA08a/10a/12a/14a/15b/21a Are you buying/downloading etc… more or less than 12 months ago
35%35%32%24%28%
38%
52% 50%58%65%50%
43%
15%13%10%11%22%18%
Counterfeit Home copied Downloading Burning BorrowedUnofficial
ViewedUnofficial
More
No change
Less
PHYSICAL PIRACY DIGITAL PIRACY SECONDARY PIRACY
Net More/Less: -20% -6% -13% -22% -22% -20%
• Overall respondents claimed that they were less often involved in acts of piracy this year than last.
13Piracy in G.B. Nov 2007
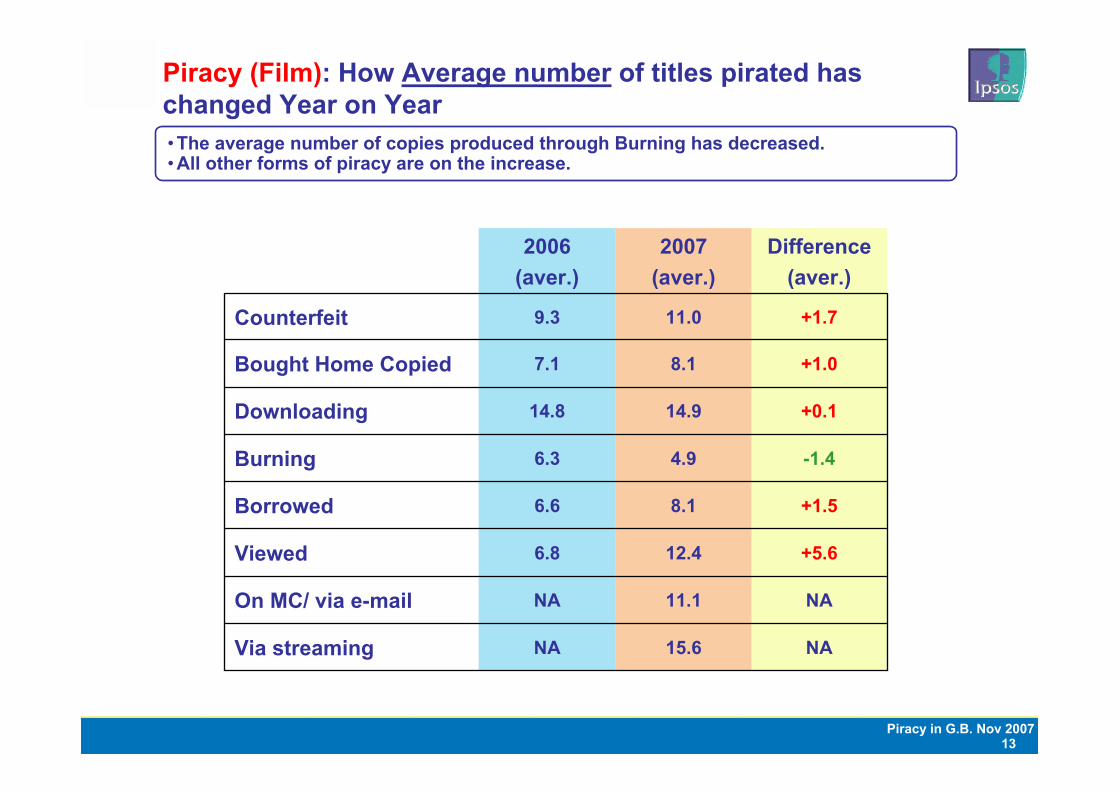
Piracy (Film): How Average number of titles pirated has changed Year on Year• The average number of copies produced through Burning has decreased.• All other forms of piracy are on the increase.
NA15.6NAVia streaming
NA11.1NAOn MC/ via e-mail
+5.612.46.8Viewed
+1.58.16.6Borrowed
-1.44.96.3Burning
+0.114.914.8Downloading
+1.08.17.1Bought Home Copied
+1.711.09.3Counterfeit
Difference(aver.)
2007(aver.)
2006(aver.)
14Piracy in G.B. Nov 2007
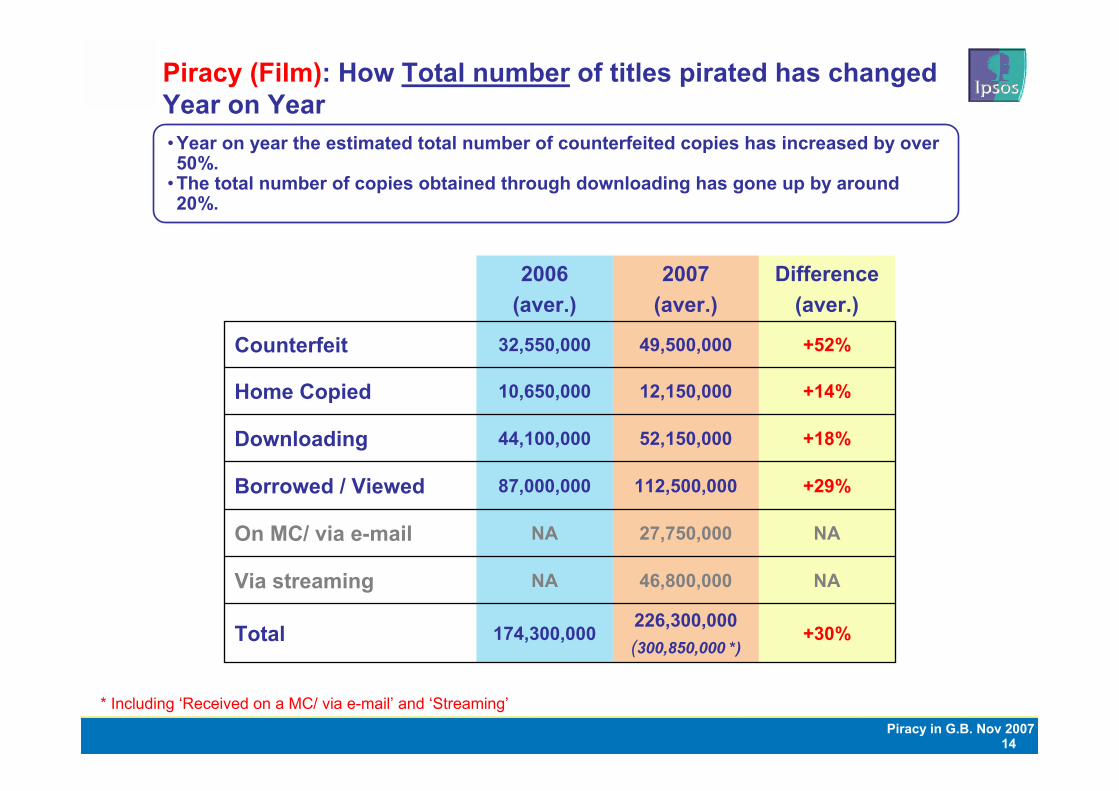
Piracy (Film): How Total number of titles pirated has changed Year on Year
+30%226,300,000(300,850,000 *)
174,300,000Total
NA46,800,000NAVia streaming
NA27,750,000NAOn MC/ via e-mail
+29%112,500,00087,000,000Borrowed / Viewed
+18%52,150,00044,100,000Downloading
+14%12,150,00010,650,000Home Copied
+52%49,500,00032,550,000Counterfeit
Difference(aver.)
2007(aver.)
2006(aver.)
• Year on year the estimated total number of counterfeited copies has increased by over 50%.
• The total number of copies obtained through downloading has gone up by around 20%.
* Including ‘Received on a MC/ via e-mail’ and ‘Streaming’
15Piracy in G.B. Nov 2007
1. Approach / Key findings
2. Piracy: The scale of the problem
3. Impact of Piracy: Film and TV Series
4. Counterfeit and Home Copied DVDs
5. Downloading and Burning
6. Borrowing and Viewing
16Piracy in G.B. Nov 2007
Impact of Piracy – Film: Introduction
• Respondents who had been involved in some form of Piracy were then shown a list of Current (2007) Films and TV series:
• See Appendix for details
• Respondents were then asked whether they had seen any of the titles in the last 12 months
• Respondents who had seen any of the titles (Film or TV series were then asked about these titles in detail:
• When they viewed• How they would have viewed if not seen unofficial copy• How likely they were to have viewed official copy if not seen unofficially:
Commitment to view official
• Information used to allow us to understand extent to which each form of Piracy cannibalised Cinema/DVD sales etc.
17Piracy in G.B. Nov 2007
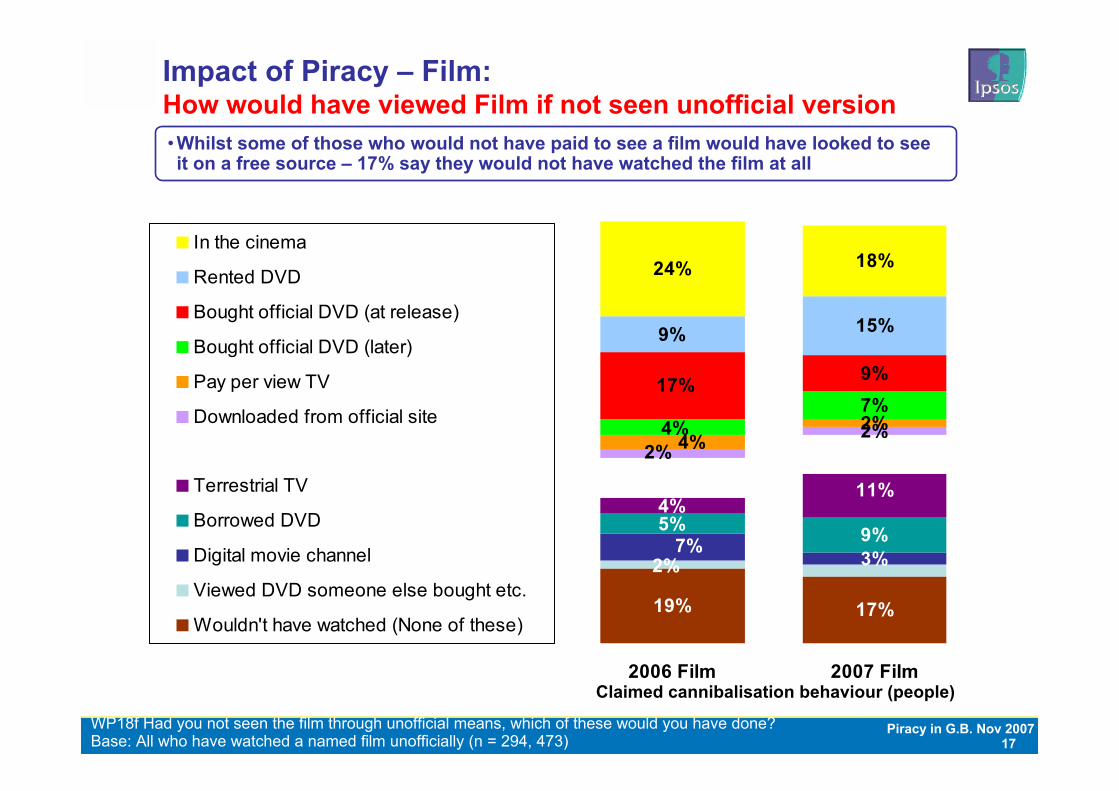
19% 17%
3%
5% 9%
2%2%7%9%
9% 15%
24% 18%
2%7%
11%4%
2% 4%4%
17%
2006 Film 2007 Film
In the cinema
Rented DVD
Bought official DVD (at release)
Bought official DVD (later)
Pay per view TV
Downloaded from official site
Column 6
Terrestrial TV
Borrowed DVD
Digital movie channel
Viewed DVD someone else bought etc.
Wouldn't have watched (None of these)
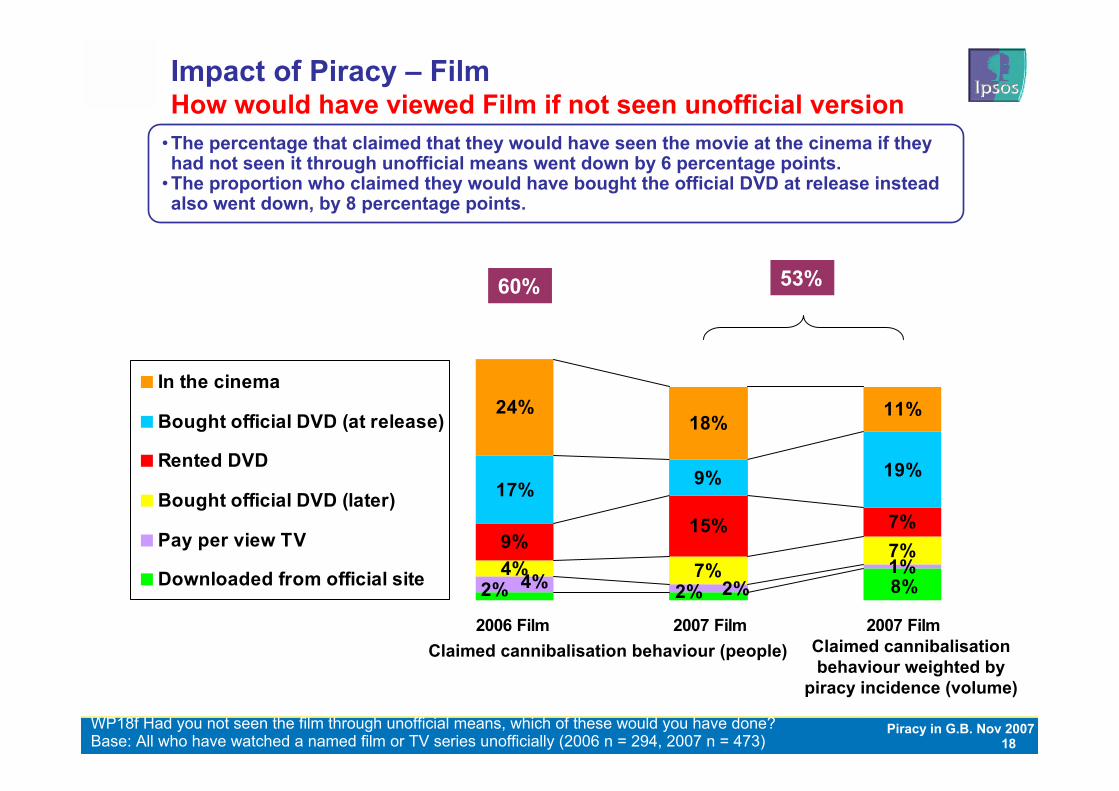
Base: All who have watched a named film unofficially (n = 294, 473)WP18f Had you not seen the film through unofficial means, which of these would you have done?
Impact of Piracy – Film: How would have viewed Film if not seen unofficial version• Whilst some of those who would not have paid to see a film would have looked to see it on a free source – 17% say they would not have watched the film at all
Claimed cannibalisation behaviour (people)
18Piracy in G.B. Nov 2007
Impact of Piracy – FilmHow would have viewed Film if not seen unofficial version
Base: All who have watched a named film or TV series unofficially (2006 n = 294, 2007 n = 473)WP18f Had you not seen the film through unofficial means, which of these would you have done?
1%
15%
17% 9% 19%
24%18%
11%
2% 8%2%4% 2%
7%4% 7%
7%9%
2006 Film 2007 Film 2007 Film
In the cinema
Bought official DVD (at release)
Rented DVD
Bought official DVD (later)
Pay per view TV
Downloaded from official site
60% 53%
• The percentage that claimed that they would have seen the movie at the cinema if they had not seen it through unofficial means went down by 6 percentage points.
• The proportion who claimed they would have bought the official DVD at release instead also went down, by 8 percentage points.
Claimed cannibalisation behaviour weighted by
piracy incidence (volume)
Claimed cannibalisation behaviour (people)
19Piracy in G.B. Nov 2007
Base: All who have watched a named film unofficially (n = 47, 68 CAUTION LOW BASE)WP18f Had you not seen the film through unofficial means, which of these would you have done?
20% 13%
9%3%
3%12%
12%
7%12%
22% 32%
4%
8%4%
10%10%
4%12%
4%
13%
2006 TV 2007 TV
Bought official DVD (at release)
Bought official DVD (later)
Rented DVD
Column 9
Waited until on terrestrial TV
Waited until on satellite TV
Borrowed DVD
Via Live streaming on official sites
Viewed DVD someone else bought etc.
Wouldn't have watched (none of these)
Don't know
.
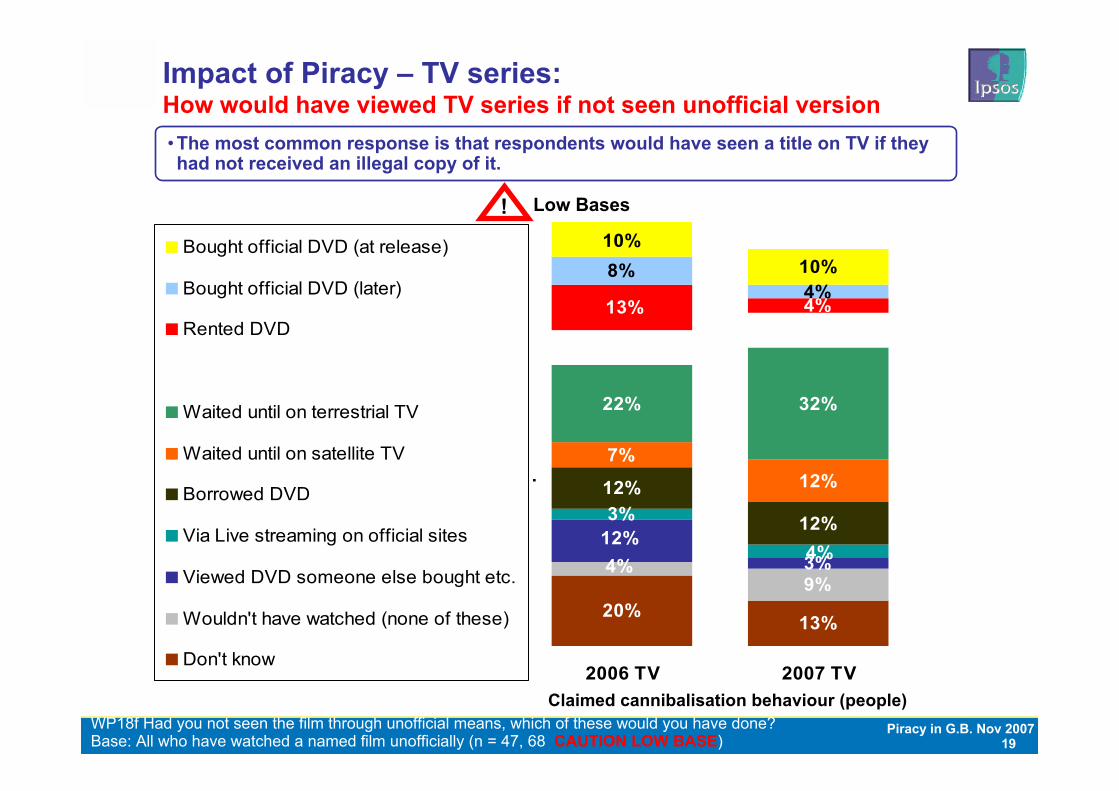
Impact of Piracy – TV series: How would have viewed TV series if not seen unofficial version• The most common response is that respondents would have seen a title on TV if they had not received an illegal copy of it.
Claimed cannibalisation behaviour (people)
! Low Bases
20Piracy in G.B. Nov 2007
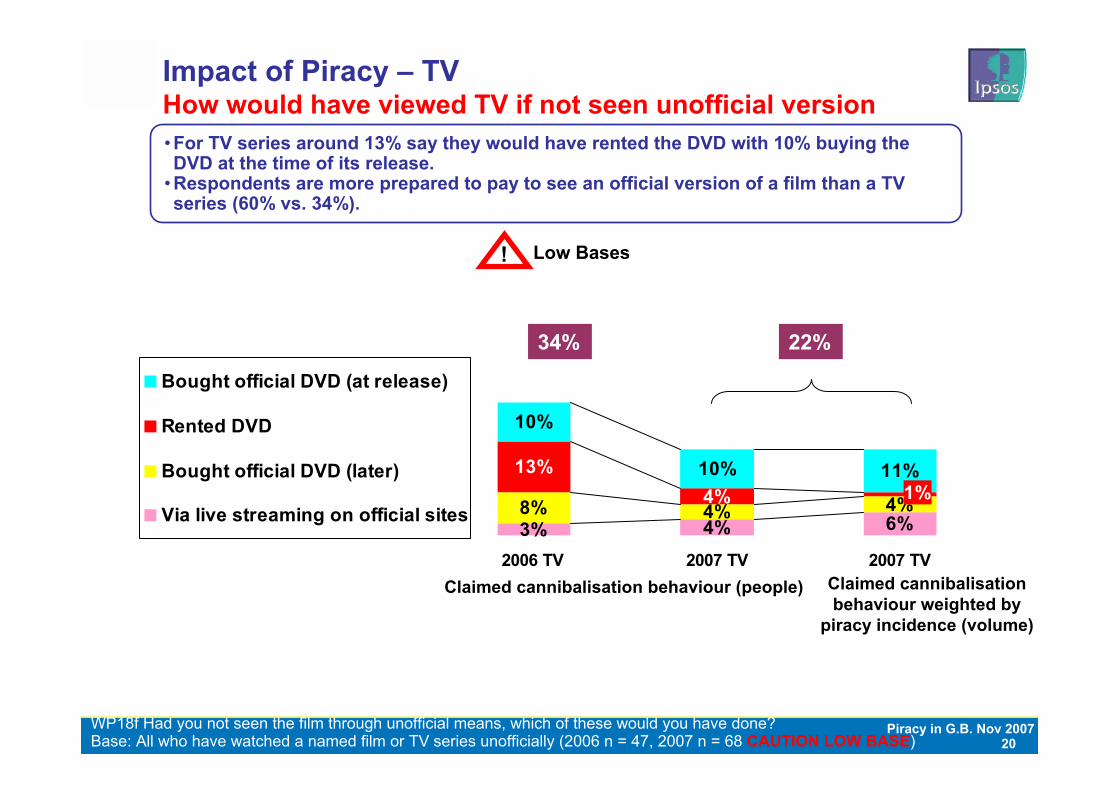
Impact of Piracy – TVHow would have viewed TV if not seen unofficial version
Base: All who have watched a named film or TV series unofficially (2006 n = 47, 2007 n = 68 CAUTION LOW BASE)WP18f Had you not seen the film through unofficial means, which of these would you have done?
3% 4% 6%8% 4% 4%
13%4%
10%
10% 11%1%
2006 TV 2007 TV 2007 TV
Bought official DVD (at release)
Rented DVD
Bought official DVD (later)
Via live streaming on official sites
34% 22%
• For TV series around 13% say they would have rented the DVD with 10% buying the DVD at the time of its release.
• Respondents are more prepared to pay to see an official version of a film than a TV series (60% vs. 34%).
Claimed cannibalisation behaviour weighted by
piracy incidence (volume)
Claimed cannibalisation behaviour (people)
! Low Bases
21Piracy in G.B. Nov 2007
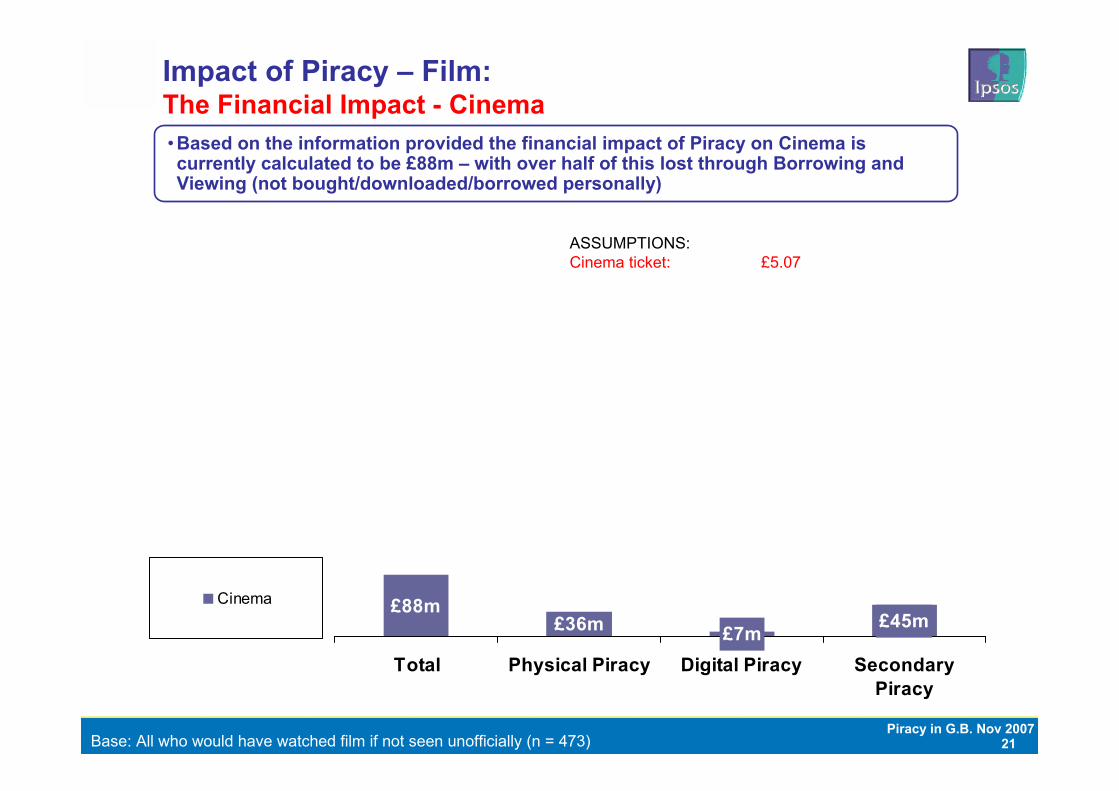
£88m£45m£36m £7m
Total Physical Piracy Digital Piracy SecondaryPiracy
Cinema
Impact of Piracy – Film: The Financial Impact - Cinema• Based on the information provided the financial impact of Piracy on Cinema is currently calculated to be £88m – with over half of this lost through Borrowing and Viewing (not bought/downloaded/borrowed personally)
ASSUMPTIONS:Cinema ticket: £5.07
Base: All who would have watched film if not seen unofficially (n = 473)
22Piracy in G.B. Nov 2007
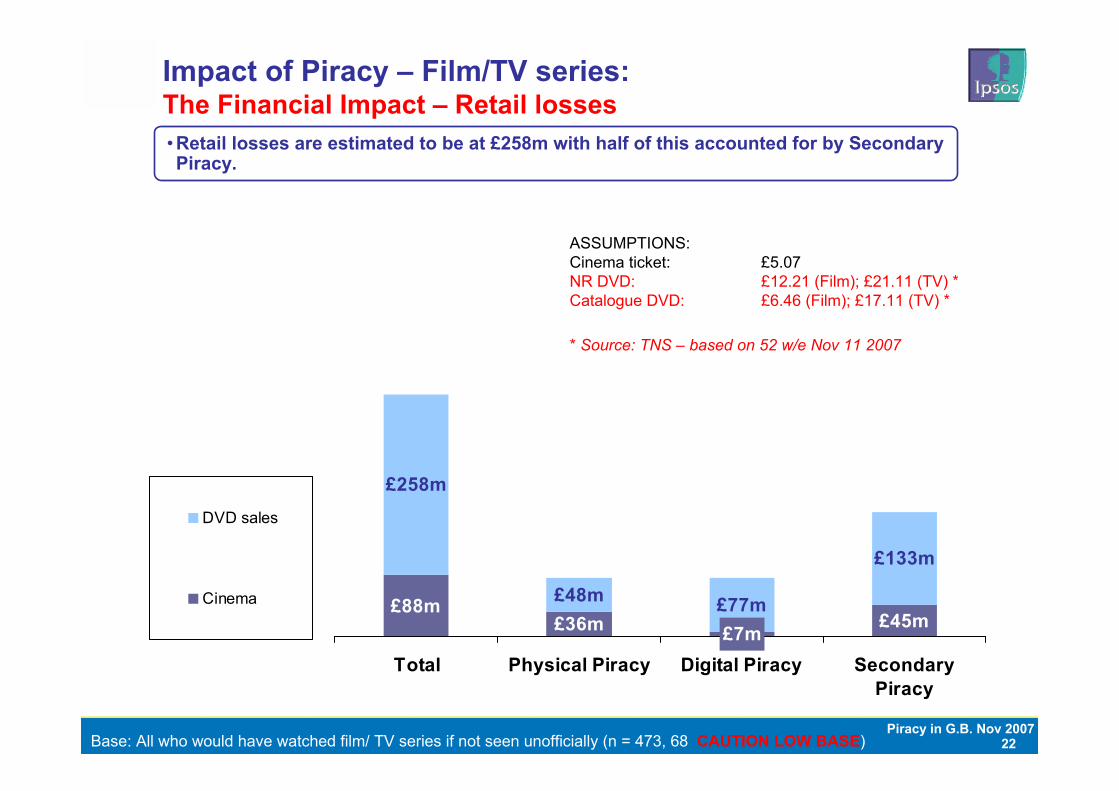
£88m£36m £45m
£258m
£48m £77m
£133m
£7mTotal Physical Piracy Digital Piracy Secondary
Piracy
DVD sales
Cinema
Impact of Piracy – Film/TV series: The Financial Impact – Retail losses
ASSUMPTIONS:Cinema ticket: £5.07NR DVD: £12.21 (Film); £21.11 (TV) *Catalogue DVD: £6.46 (Film); £17.11 (TV) *
• Retail losses are estimated to be at £258m with half of this accounted for by Secondary Piracy.
Base: All who would have watched film/ TV series if not seen unofficially (n = 473, 68 CAUTION LOW BASE)
* Source: TNS – based on 52 w/e Nov 11 2007
23Piracy in G.B. Nov 2007
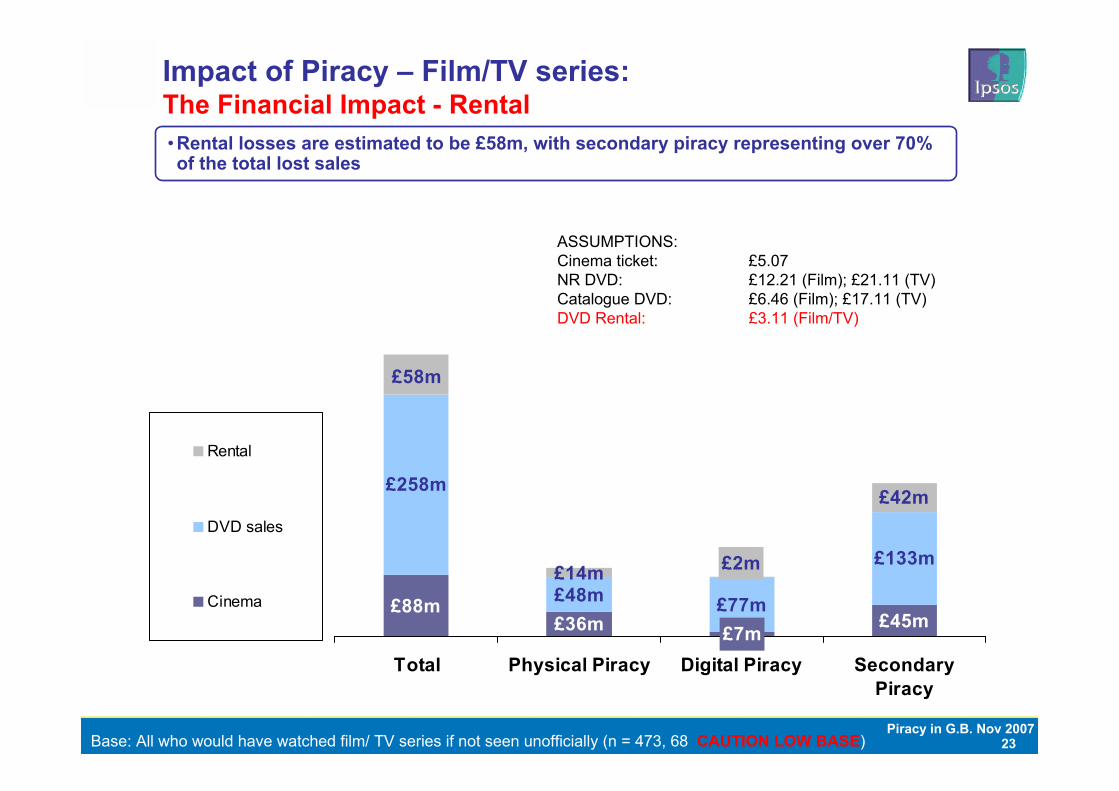
£88m£36m £45m
£258m
£48m £77m
£133m£14m
£42m
£7m
£2m
£58m
Total Physical Piracy Digital Piracy SecondaryPiracy
Rental
DVD sales
Cinema
Impact of Piracy – Film/TV series: The Financial Impact - Rental
ASSUMPTIONS:Cinema ticket: £5.07NR DVD: £12.21 (Film); £21.11 (TV)Catalogue DVD: £6.46 (Film); £17.11 (TV)DVD Rental: £3.11 (Film/TV)
• Rental losses are estimated to be £58m, with secondary piracy representing over 70% of the total lost sales
Base: All who would have watched film/ TV series if not seen unofficially (n = 473, 68 CAUTION LOW BASE)
24Piracy in G.B. Nov 2007
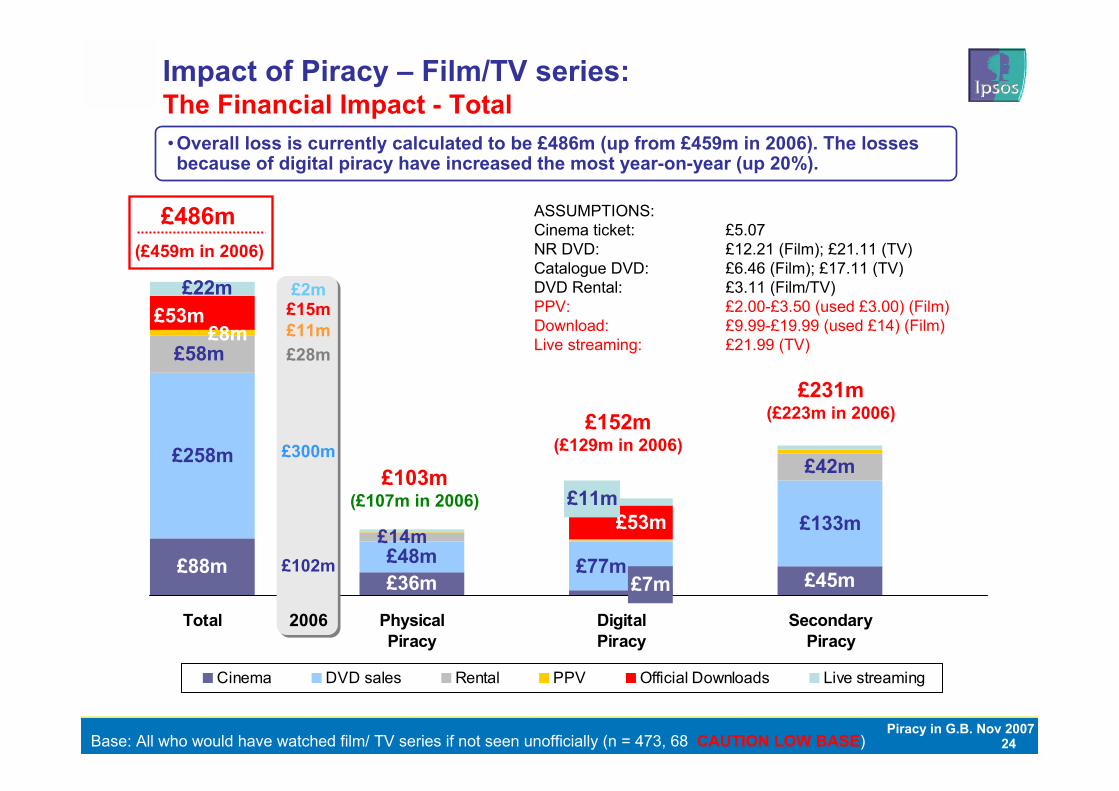
£88m£45m
£258m
£48m£133m
£42m
£7m£36m£77m
£14m
£58m£8m
£53m
£53m
£11m
£22m
Total 2006 PhysicalPiracy
DigitalPiracy
SecondaryPiracy
Cinema DVD sales Rental PPV Official Downloads Live streaming
£486m(£459m in 2006)
Impact of Piracy – Film/TV series: The Financial Impact - Total• Overall loss is currently calculated to be £486m (up from £459m in 2006). The losses because of digital piracy have increased the most year-on-year (up 20%).
£103m(£107m in 2006)
ASSUMPTIONS:Cinema ticket: £5.07NR DVD: £12.21 (Film); £21.11 (TV)Catalogue DVD: £6.46 (Film); £17.11 (TV)DVD Rental: £3.11 (Film/TV)PPV: £2.00-£3.50 (used £3.00) (Film)Download: £9.99-£19.99 (used £14) (Film)Live streaming: £21.99 (TV)
Base: All who would have watched film/ TV series if not seen unofficially (n = 473, 68 CAUTION LOW BASE)
£102m
£300m
£28m£11m£15m£2m
2006
£152m(£129m in 2006)
£231m(£223m in 2006)
25Piracy in G.B. Nov 2007
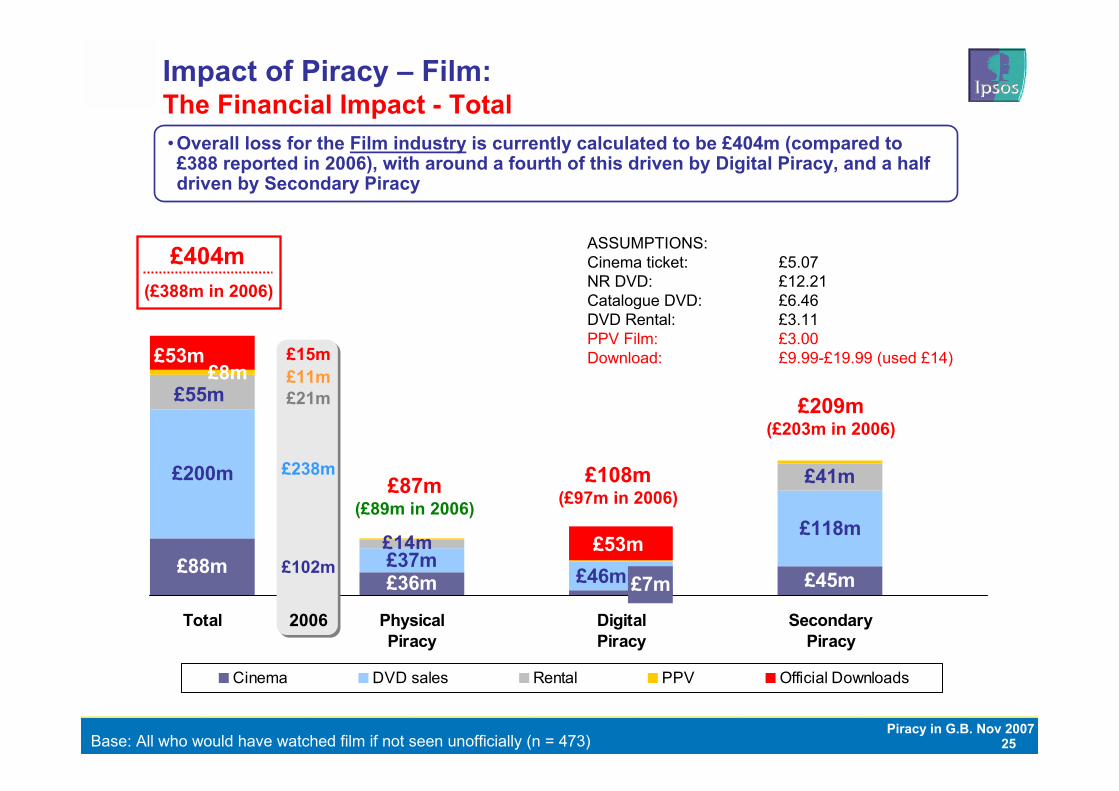
£88m£45m
£200m
£37m£118m
£41m
£7m£36m £46m£14m
£55m£8m
£53m
£53m
Total 2006 PhysicalPiracy
DigitalPiracy
SecondaryPiracy
Cinema DVD sales Rental PPV Official Downloads
Impact of Piracy – Film: The Financial Impact - Total• Overall loss for the Film industry is currently calculated to be £404m (compared to £388 reported in 2006), with around a fourth of this driven by Digital Piracy, and a half driven by Secondary Piracy
ASSUMPTIONS:Cinema ticket: £5.07NR DVD: £12.21Catalogue DVD: £6.46DVD Rental: £3.11PPV Film: £3.00Download: £9.99-£19.99 (used £14)
£404m(£388m in 2006)
Base: All who would have watched film if not seen unofficially (n = 473)
£102m
£238m
£21m
£15m£11m
2006
£87m(£89m in 2006)
£108m(£97m in 2006)
£209m(£203m in 2006)
26Piracy in G.B. Nov 2007
£57m
£11m£31m
£15m
£22m
£4m
£11m
£6m
£3m
Total 2006 PhysicalPiracy
DigitalPiracy
SecondaryPiracy
DVD sales Rental Live streaming
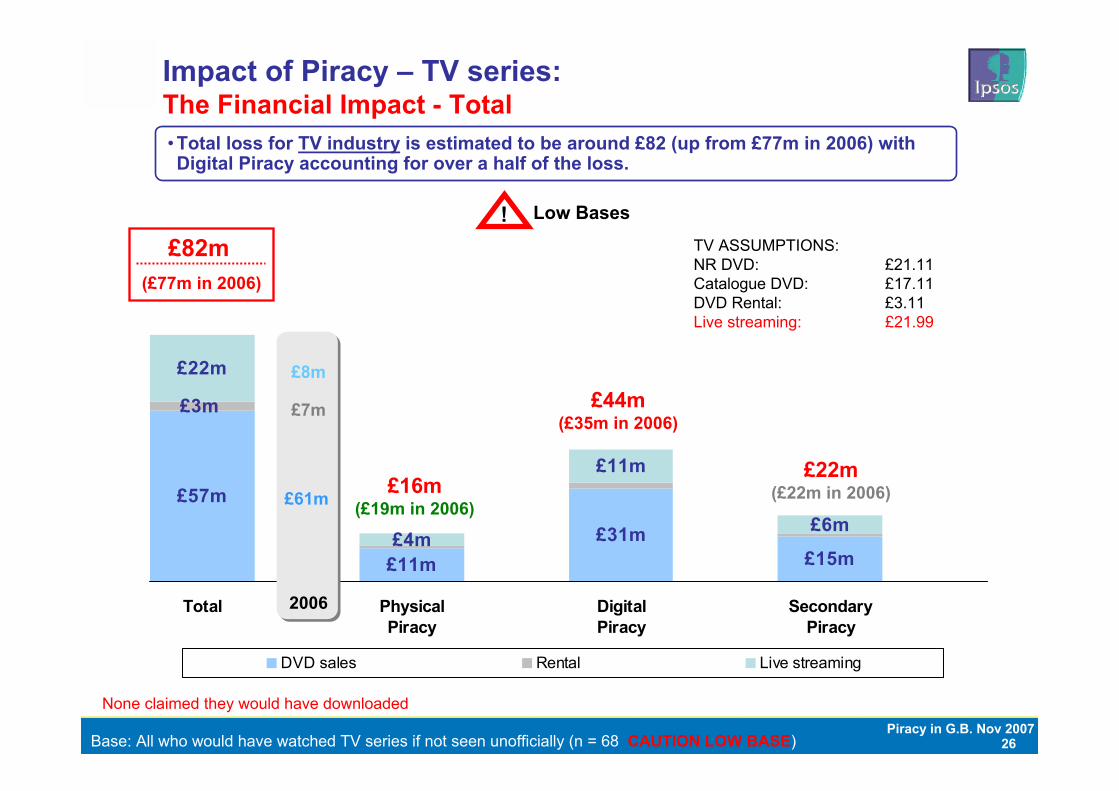
Impact of Piracy – TV series: The Financial Impact - Total• Total loss for TV industry is estimated to be around £82 (up from £77m in 2006) with Digital Piracy accounting for over a half of the loss.
TV ASSUMPTIONS:NR DVD: £21.11Catalogue DVD: £17.11DVD Rental: £3.11Live streaming: £21.99
£82m(£77m in 2006)
None claimed they would have downloaded
Base: All who would have watched TV series if not seen unofficially (n = 68 CAUTION LOW BASE)
£61m
£7m
£8m
2006
£16m(£19m in 2006)
£44m(£35m in 2006)
£22m(£22m in 2006)
! Low Bases
27Piracy in G.B. Nov 2007
1. Approach / Key findings
2. Piracy: The scale of the problem
3. Impact of Piracy: Film and TV Series
4. Counterfeit and Home Copied DVDs
5. Downloading and Burning
6. Borrowing and Viewing
28Piracy in G.B. Nov 2007
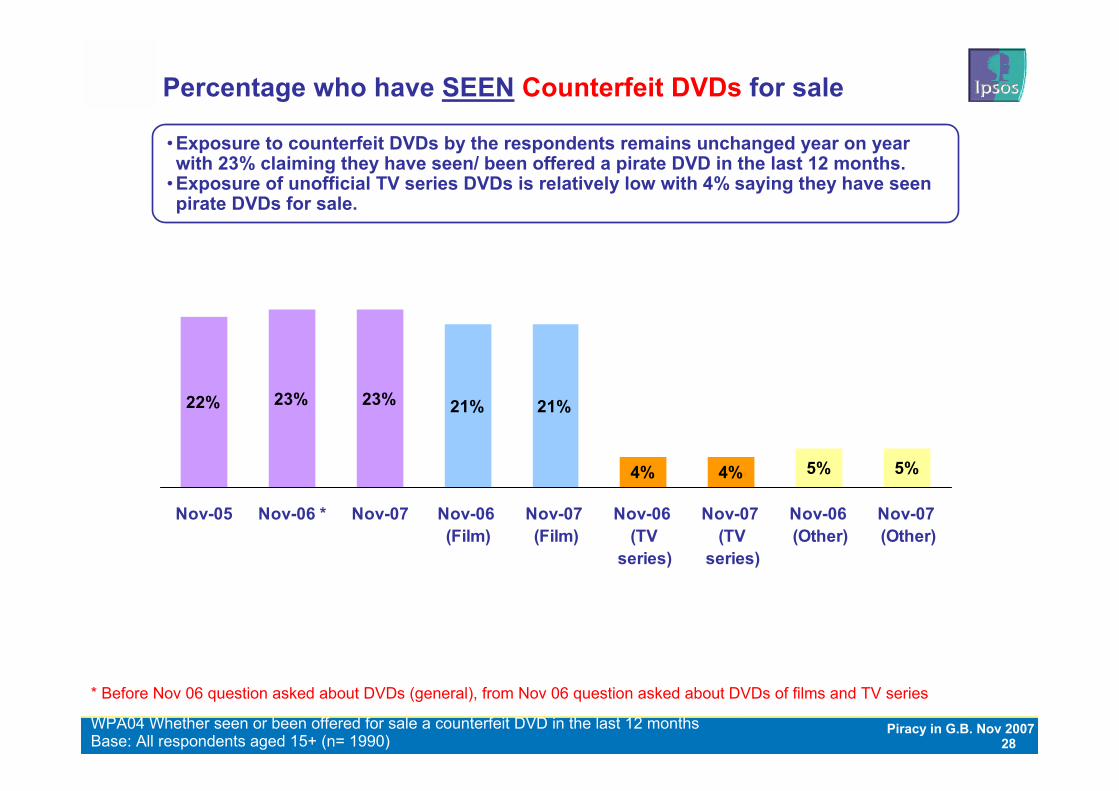
Percentage who have SEEN Counterfeit DVDs for sale
22% 23% 23% 21% 21%
4% 4% 5% 5%
Nov-05 Nov-06 * Nov-07 Nov-06 (Film)
Nov-07 (Film)
Nov-06 (TV
series)
Nov-07 (TV
series)
Nov-06 (Other)
Nov-07 (Other)
• Exposure to counterfeit DVDs by the respondents remains unchanged year on year with 23% claiming they have seen/ been offered a pirate DVD in the last 12 months.
• Exposure of unofficial TV series DVDs is relatively low with 4% saying they have seen pirate DVDs for sale.
Base: All respondents aged 15+ (n= 1990)WPA04 Whether seen or been offered for sale a counterfeit DVD in the last 12 months
* Before Nov 06 question asked about DVDs (general), from Nov 06 question asked about DVDs of films and TV series
29Piracy in G.B. Nov 2007
9% 8% 9% 7% 9%
1% 1% 1% 2%
Nov-05 Nov-06 * Nov-07 Nov-06 (Film)
Nov-07 (Film)
Nov-06 (TV
series)
Nov-07 (TV
series)
Nov-06 (Other)
Nov-07 (Other)
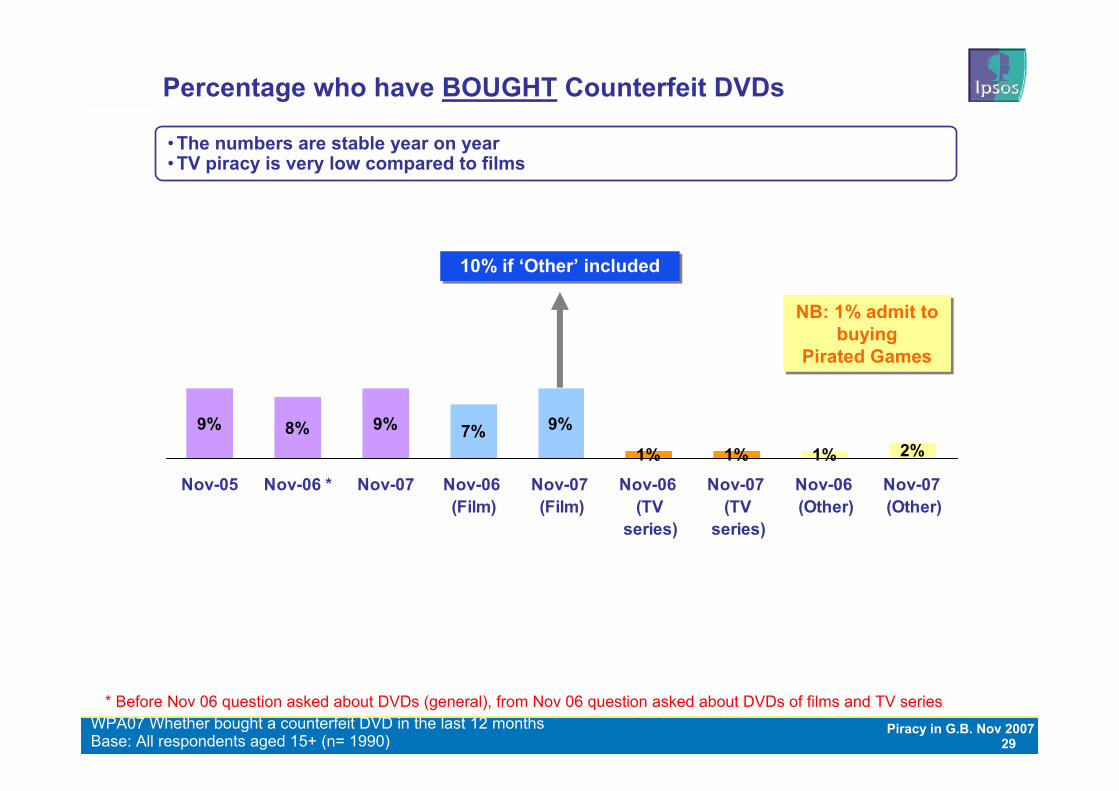
Percentage who have BOUGHT Counterfeit DVDs
Base: All respondents aged 15+ (n= 1990)WPA07 Whether bought a counterfeit DVD in the last 12 months
* Before Nov 06 question asked about DVDs (general), from Nov 06 question asked about DVDs of films and TV series
NB: 1% admit to buying
Pirated Games
NB: 1% admit to buying
Pirated Games
10% if ‘Other’ included10% if ‘Other’ included
• The numbers are stable year on year• TV piracy is very low compared to films
30Piracy in G.B. Nov 2007
50%
50%
10%
23%
23%
44%
18%
51%
31%
17%
14%
8%
28%
55%
45%
20%
34%
31%
15%
9%
55%
36%
28%
19%
15%
46%
Male Female 15-21 22-34 35-50 51+ AB C1-C2 DE Child<6
Child6-11
Child12-14
Anychild
Total sample profileBuy Counterfeit DVDs
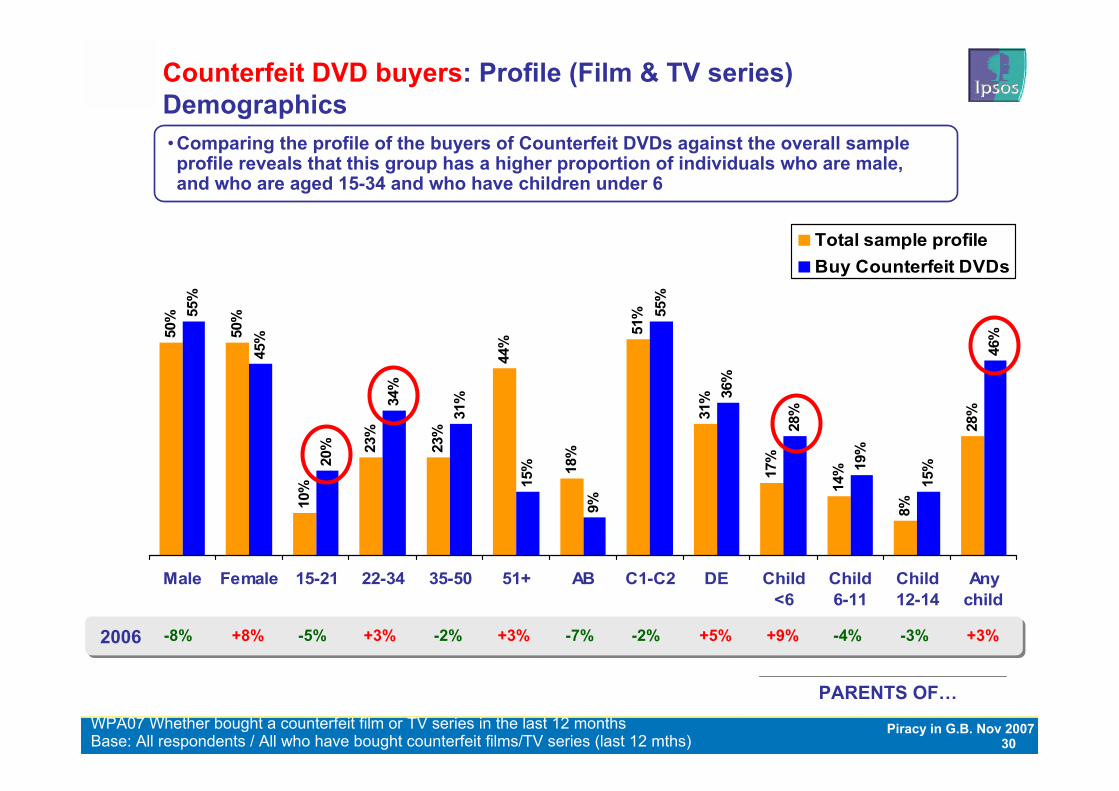
Counterfeit DVD buyers: Profile (Film & TV series)Demographics
WPA07 Whether bought a counterfeit film or TV series in the last 12 monthsBase: All respondents / All who have bought counterfeit films/TV series (last 12 mths)
PARENTS OF…
• Comparing the profile of the buyers of Counterfeit DVDs against the overall sample profile reveals that this group has a higher proportion of individuals who are male, and who are aged 15-34 and who have children under 6
-8% +8% -5% -2% -7% -2% -4% -3%+3% +3% +5% +9% +3%2006
31Piracy in G.B. Nov 2007
Scotland
North
Yorks. &Hum berside
North West
EastMidlands
W estMidlands
EastAnglia
W ales
South W estSouth East
Londo n
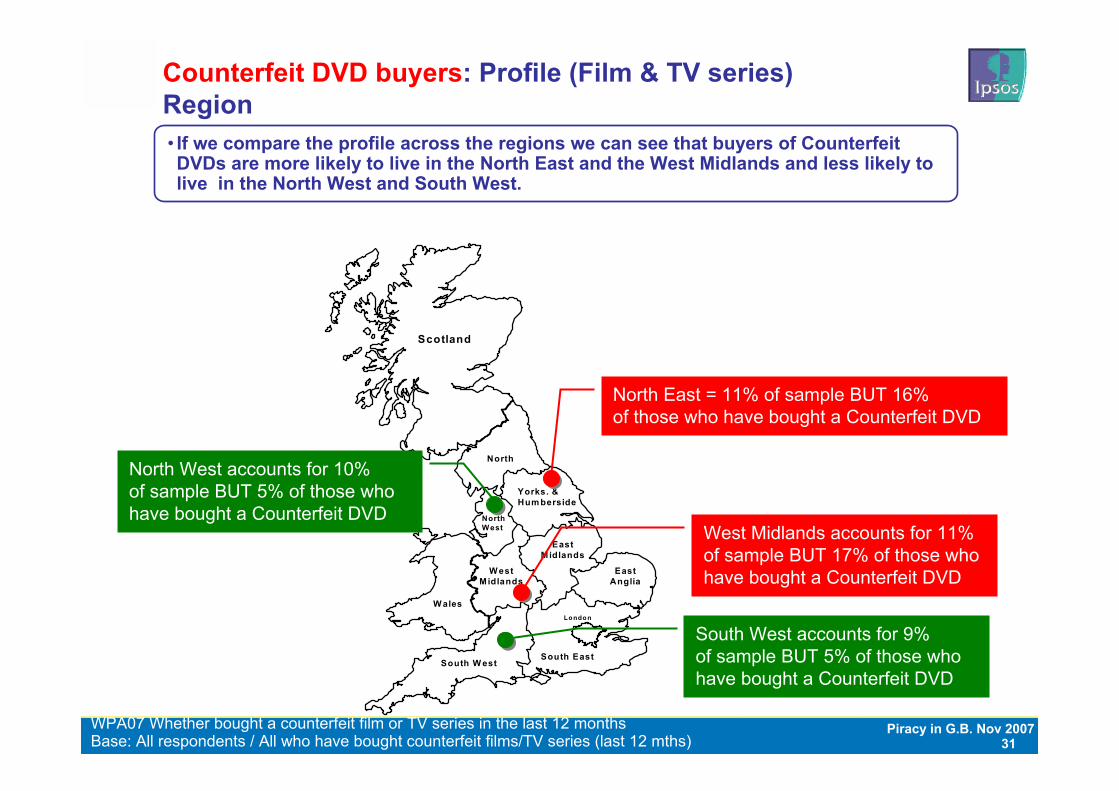
Counterfeit DVD buyers: Profile (Film & TV series)Region
WPA07 Whether bought a counterfeit film or TV series in the last 12 monthsBase: All respondents / All who have bought counterfeit films/TV series (last 12 mths)
• If we compare the profile across the regions we can see that buyers of Counterfeit DVDs are more likely to live in the North East and the West Midlands and less likely to live in the North West and South West.
North East = 11% of sample BUT 16%of those who have bought a Counterfeit DVD
West Midlands accounts for 11% of sample BUT 17% of those who have bought a Counterfeit DVD
South West accounts for 9% of sample BUT 5% of those who have bought a Counterfeit DVD
North West accounts for 10% of sample BUT 5% of those who have bought a Counterfeit DVD
32Piracy in G.B. Nov 2007
£3.78 £3.62 £3.09 £4.38 £3.89£3.52 £3.00
Nov-05 Nov-06 * Nov-07 Nov-06 (Film)
Nov-07 (Film)
Nov-06 (TV series)
Nov-07 (TV series)
Base: All who have bought counterfeit films/TV series (last 12 mths) (n = 185, 180, 22 * = V.LOW BASE)WP08d/e On average how much are you currently playing for pirated films/TV series?
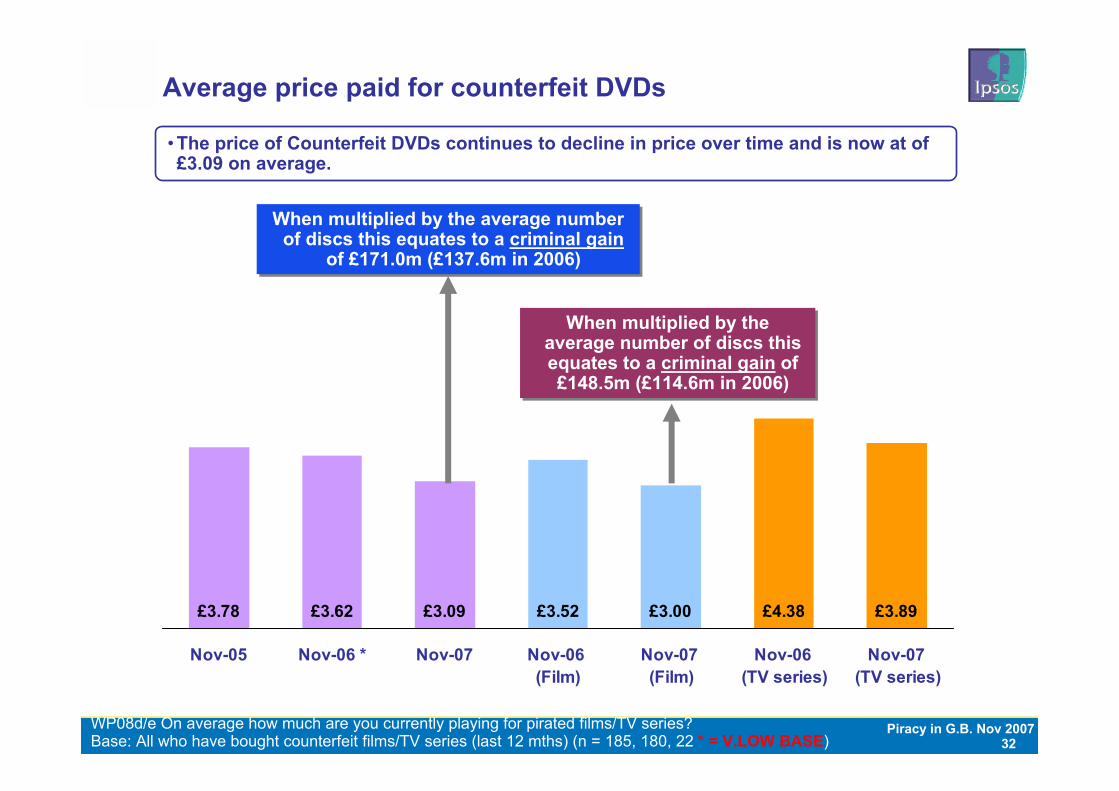
Average price paid for counterfeit DVDs
When multiplied by the average number of discs this equates to a criminal gain of £148.5m (£114.6m in 2006)
When multiplied by the average number of discs this equates to a criminal gain of £148.5m (£114.6m in 2006)
When multiplied by the average number of discs this equates to a criminal gain
of £171.0m (£137.6m in 2006)
When multiplied by the average number of discs this equates to a criminal gain
of £171.0m (£137.6m in 2006)
• The price of Counterfeit DVDs continues to decline in price over time and is now at of £3.09 on average.
33Piracy in G.B. Nov 2007
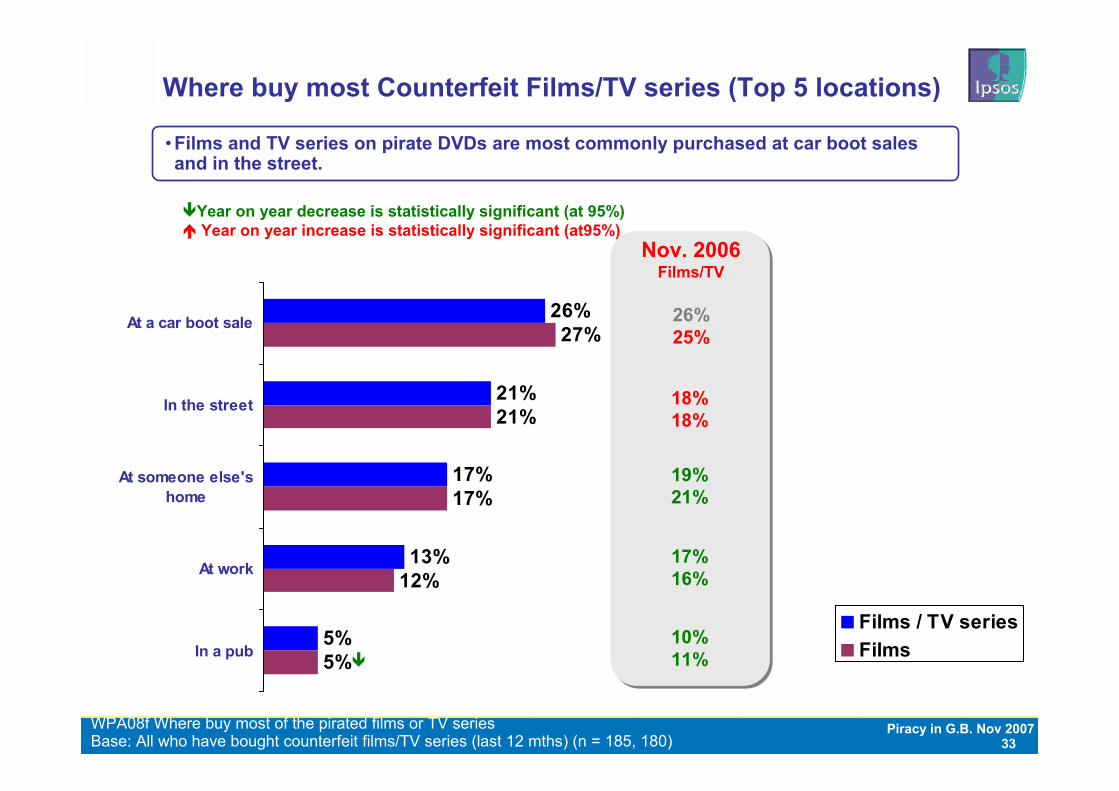
Where buy most Counterfeit Films/TV series (Top 5 locations)
26%
21%
17%
13%
5%
27%
21%
17%
12%
5%
At a car boot sale
In the street
At someone else'shome
At work
In a pub
Films / TV seriesFilms
Base: All who have bought counterfeit films/TV series (last 12 mths) (n = 185, 180)WPA08f Where buy most of the pirated films or TV series
Nov. 2006 Films/TV
26%25%
18%18%
19%21%
17%16%
• Films and TV series on pirate DVDs are most commonly purchased at car boot sales and in the street.
10%11%
Year on year decrease is statistically significant (at 95%)Year on year increase is statistically significant (at95%)
34Piracy in G.B. Nov 2007
Buying Counterfeit DVDs
Buying Home copied DVDs
2007 2006 2007 2006 It is much cheaper than buying official DVDs 89% 91%There’s a wide selection of films available 83% 61%It is cheaper than going to the cinema 83% 98%It means I can buy more DVDs 76% 50%It means I don’t have to wait for the official release in the shops 74% 73%All the new film releases are available 74% 55%I get hold of films which I wouldn’t otherwise buy 71% 77%The movie industry makes too much money 68% 68%They are ok in quality 61% 73%I have no interest in the bonus featureswhich you get on official DVDs 55% 58%It’s less hassle than buying DVDs from shops 52% 53%Pirate DVDs are not really harming anyone 48% 64%Once films and programmes have been broadcast on TV they’re free to copy 48% 41%I find it more difficult to get to the cinema nowadays but still want to see the latest releases as soon as they come out 47% 62%
There’s a wide selection of TV series available 46% 82%I can see specific TV series which are no longer available on TV 45% 47%Watching a film in a cinema is not as enjoyable as it used to be 43% 76%I can see specific TV series/ episodes I have missed 40% 88%I can see TV series which have yet to play on UK TV 38% 59%It keeps me ahead of the crowd 34% 62%
BASE 178 166 66 66
87% 78%82% 74%81% 77%74% 72%77% 77%72% 60%62% 69%59% 66%52% 62%48% 55%51% 61%46% 40%NA NA
60% 61%
44% 49%40% 44%38% 51%38% 38%43% 42%42% 50%
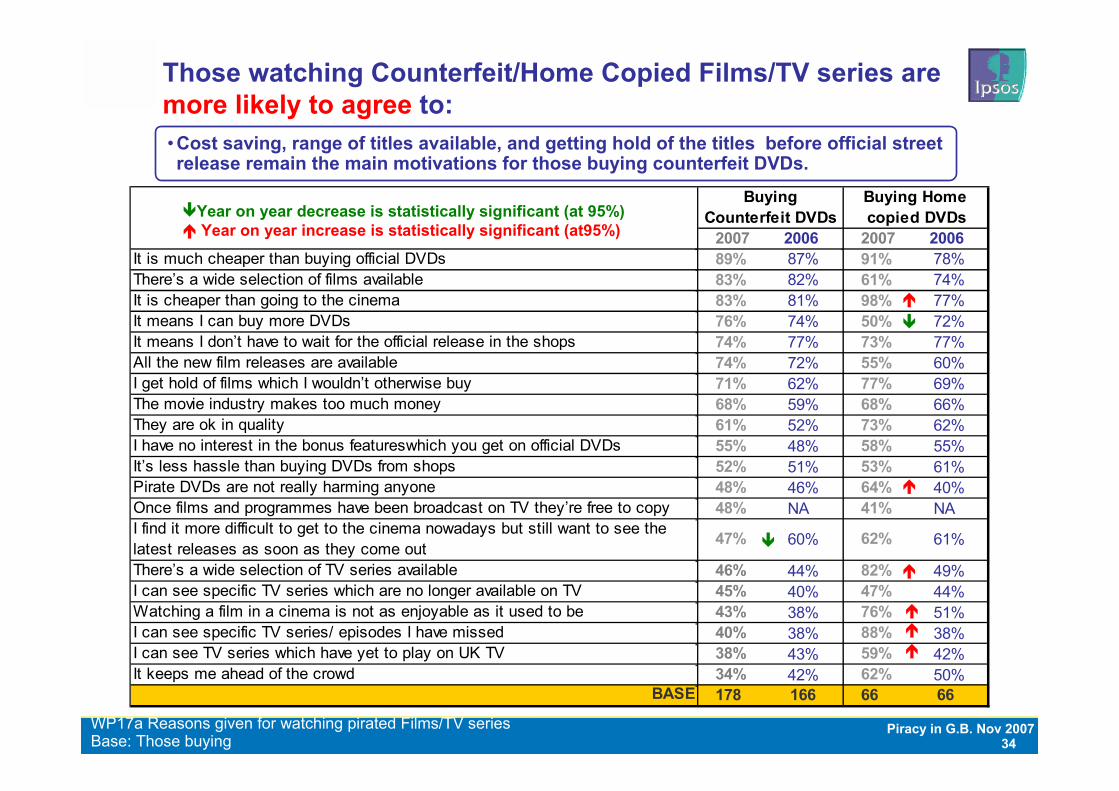
Those watching Counterfeit/Home Copied Films/TV series are more likely to agree to:
Base: Those buyingWP17a Reasons given for watching pirated Films/TV series
• Cost saving, range of titles available, and getting hold of the titles before official street release remain the main motivations for those buying counterfeit DVDs.
Year on year decrease is statistically significant (at 95%)Year on year increase is statistically significant (at95%)
35Piracy in G.B. Nov 2007
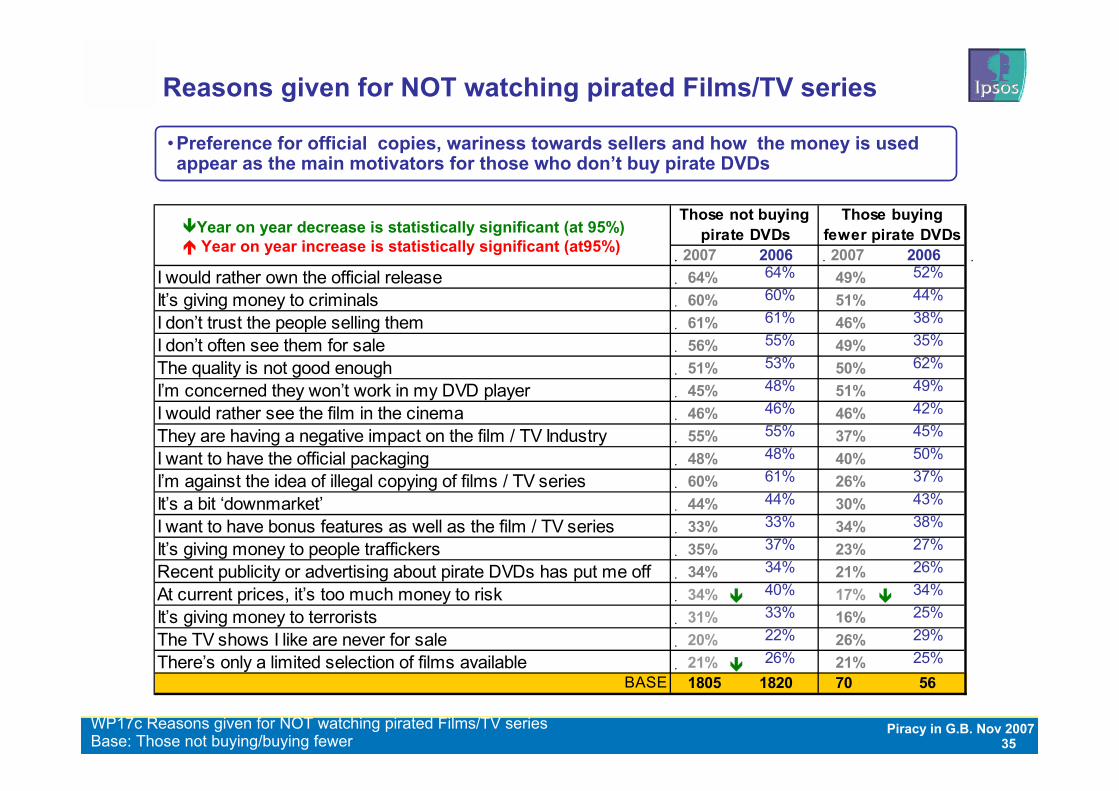
Reasons given for NOT watching pirated Films/TV series
Base: Those not buying/buying fewerWP17c Reasons given for NOT watching pirated Films/TV series
• Preference for official copies, wariness towards sellers and how the money is used appear as the main motivators for those who don’t buy pirate DVDs
Those not buying pirate DVDs
Those buying fewer pirate DVDs
2007 2006 2007 2006 I would rather own the official release 64% 49%It’s giving money to criminals 60% 51%I don’t trust the people selling them 61% 46%I don’t often see them for sale 56% 49%The quality is not good enough 51% 50%I’m concerned they won’t work in my DVD player 45% 51%I would rather see the film in the cinema 46% 46%They are having a negative impact on the film / TV Industry 55% 37%I want to have the official packaging 48% 40%I’m against the idea of illegal copying of films / TV series 60% 26%It’s a bit ‘downmarket’ 44% 30%I want to have bonus features as well as the film / TV series 33% 34%It’s giving money to people traffickers 35% 23%Recent publicity or advertising about pirate DVDs has put me off 34% 21%At current prices, it’s too much money to risk 34% 17%It’s giving money to terrorists 31% 16%The TV shows I like are never for sale 20% 26%There’s only a limited selection of films available 21% 21%
BASE 1805 1820 70 56
64% 52%60% 44%61% 38%55% 35%53% 62%48% 49%46% 42%55% 45%48% 50%61% 37%44% 43%33% 38%37% 27%34% 26%40% 34%33% 25%22% 29%26% 25%
Year on year decrease is statistically significant (at 95%)Year on year increase is statistically significant (at95%)
36Piracy in G.B. Nov 2007
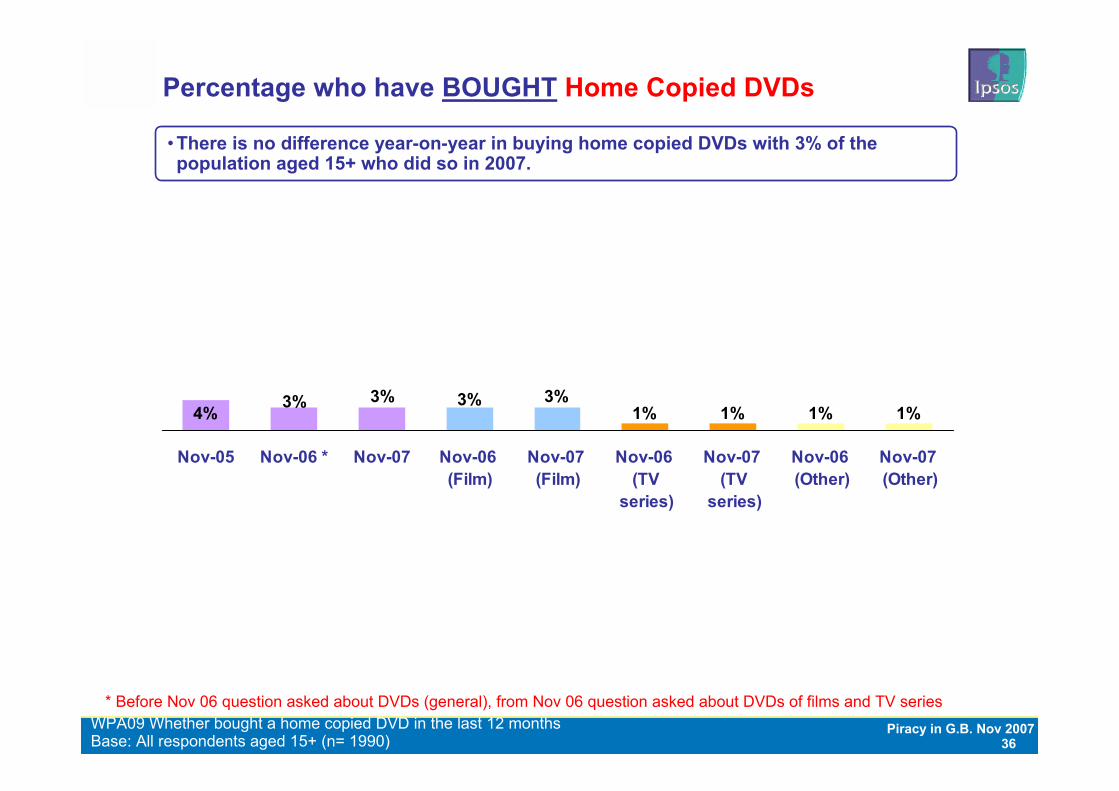
Percentage who have BOUGHT Home Copied DVDs
Base: All respondents aged 15+ (n= 1990)WPA09 Whether bought a home copied DVD in the last 12 months
* Before Nov 06 question asked about DVDs (general), from Nov 06 question asked about DVDs of films and TV series
• There is no difference year-on-year in buying home copied DVDs with 3% of the population aged 15+ who did so in 2007.
4% 1% 1% 1% 1%3%3% 3% 3%
Nov-05 Nov-06 * Nov-07 Nov-06 (Film)
Nov-07 (Film)
Nov-06 (TV
series)
Nov-07 (TV
series)
Nov-06 (Other)
Nov-07 (Other)
37Piracy in G.B. Nov 2007
50%
50%
10%
23%
23%
44%
18%
51%
31%
17%
14%
8%
28%
56%
44%
22%
35%
29%
13%
6%
66%
28% 34
%
22%
15%
54%
Male Female 15-21 22-34 35-50 51+ AB C1-C2 DE Child <6 Child 6-11
Child12-14
Anychild
Total sample profileBuy Home Copied DVDs
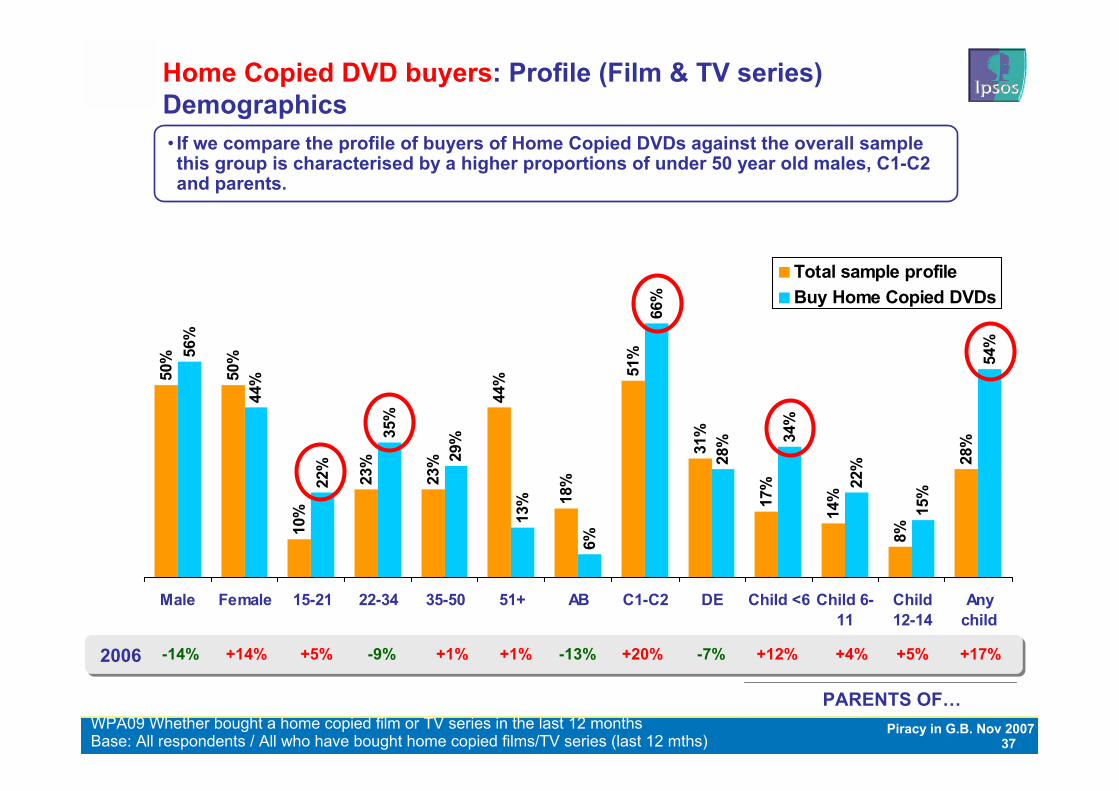
Home Copied DVD buyers: Profile (Film & TV series)Demographics
Base: All respondents / All who have bought home copied films/TV series (last 12 mths)WPA09 Whether bought a home copied film or TV series in the last 12 months
PARENTS OF…
• If we compare the profile of buyers of Home Copied DVDs against the overall sample this group is characterised by a higher proportions of under 50 year old males, C1-C2 and parents.
-14% +14% +5% +1% +4%-9% +1%2006 -13% +20% -7% +12% +5% +17%
38Piracy in G.B. Nov 2007
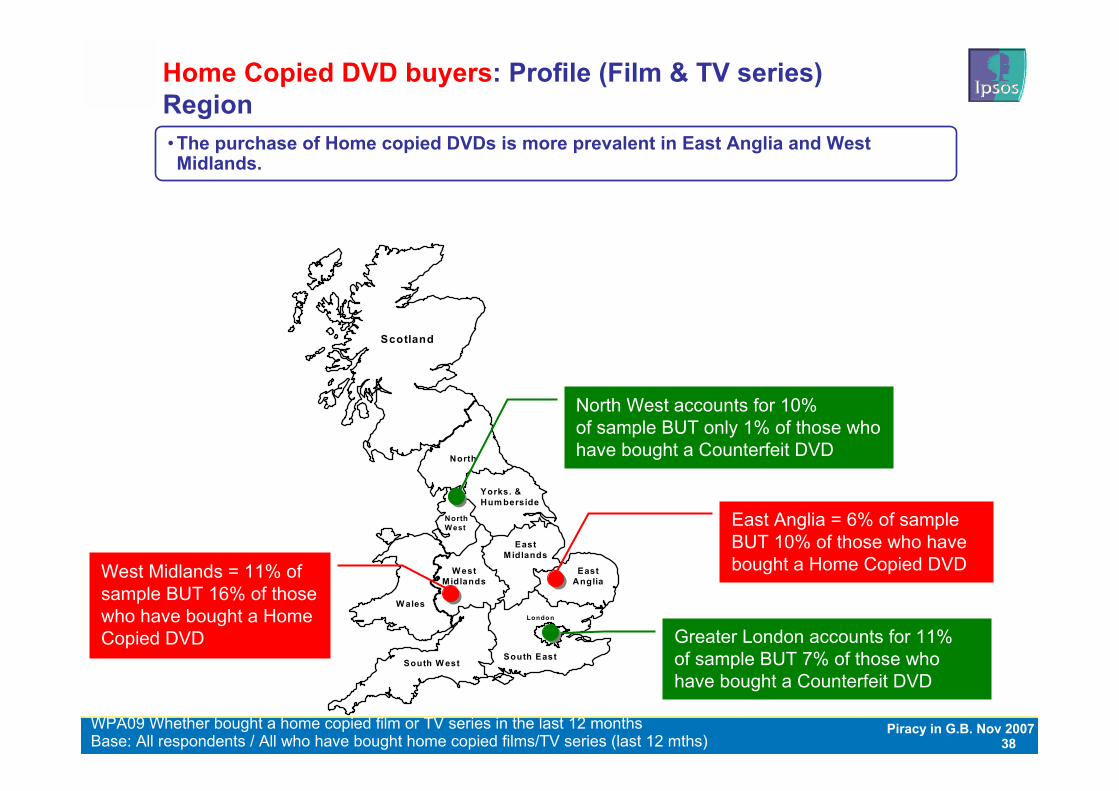
Home Copied DVD buyers: Profile (Film & TV series)Region
WPA09 Whether bought a home copied film or TV series in the last 12 monthsBase: All respondents / All who have bought home copied films/TV series (last 12 mths)
• The purchase of Home copied DVDs is more prevalent in East Anglia and West Midlands.
Scotland
North
Yorks. &Hum berside
North West
EastMidlands
W estMidlands
EastAnglia
W ales
South W estSouth East
Londo n
East Anglia = 6% of sample BUT 10% of those who have bought a Home Copied DVDWest Midlands = 11% of
sample BUT 16% of those who have bought a Home Copied DVD
North West accounts for 10% of sample BUT only 1% of those who have bought a Counterfeit DVD
Greater London accounts for 11% of sample BUT 7% of those who have bought a Counterfeit DVD
39Piracy in G.B. Nov 2007
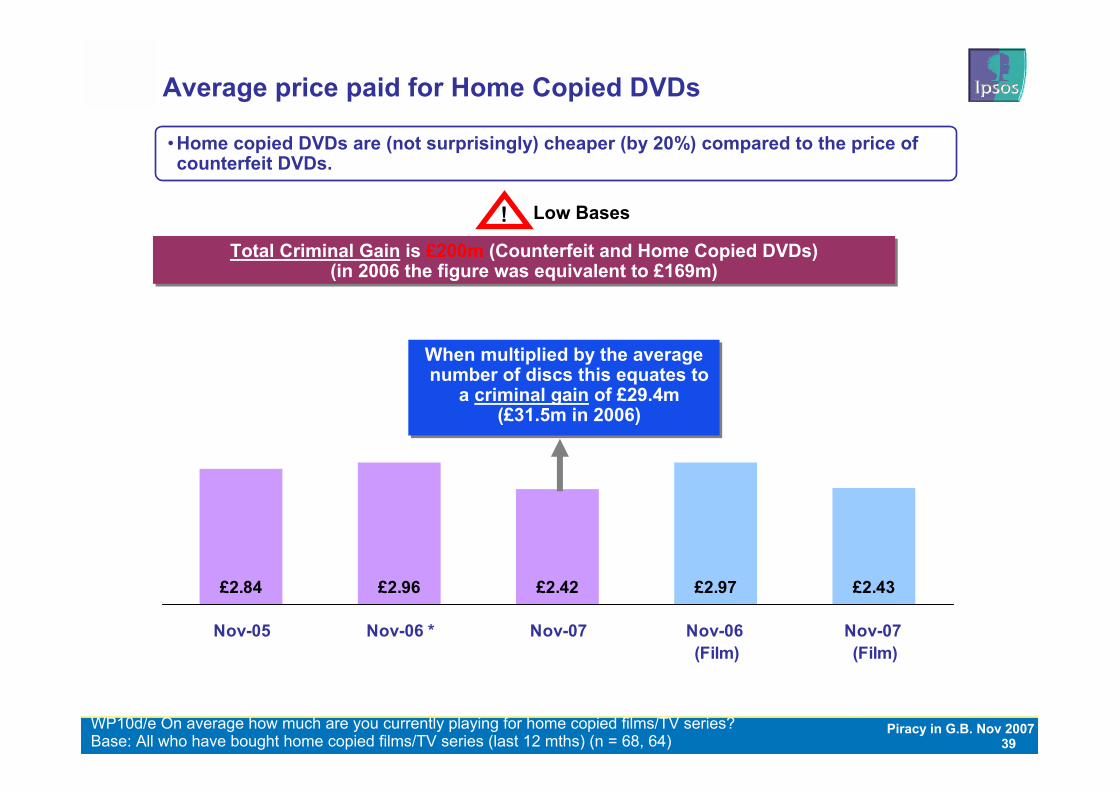
£2.84 £2.96 £2.42 £2.97 £2.43
Nov-05 Nov-06 * Nov-07 Nov-06 (Film)
Nov-07 (Film)
When multiplied by the average number of discs this equates to
a criminal gain of £29.4m (£31.5m in 2006)
When multiplied by the average number of discs this equates to
a criminal gain of £29.4m (£31.5m in 2006)
Base: All who have bought home copied films/TV series (last 12 mths) (n = 68, 64)WP10d/e On average how much are you currently playing for home copied films/TV series?
Average price paid for Home Copied DVDs
Total Criminal Gain is £200m (Counterfeit and Home Copied DVDs)(in 2006 the figure was equivalent to £169m)
Total Criminal Gain is £200m (Counterfeit and Home Copied DVDs)(in 2006 the figure was equivalent to £169m)
• Home copied DVDs are (not surprisingly) cheaper (by 20%) compared to the price of counterfeit DVDs.
! Low Bases
40Piracy in G.B. Nov 2007
56%
19%
12%
7%
7%
58%
20%
11%
6%
8%
At someone else'shome
At work
At home
In a pub/café
At school/college/uni Films / TV seriesFilms
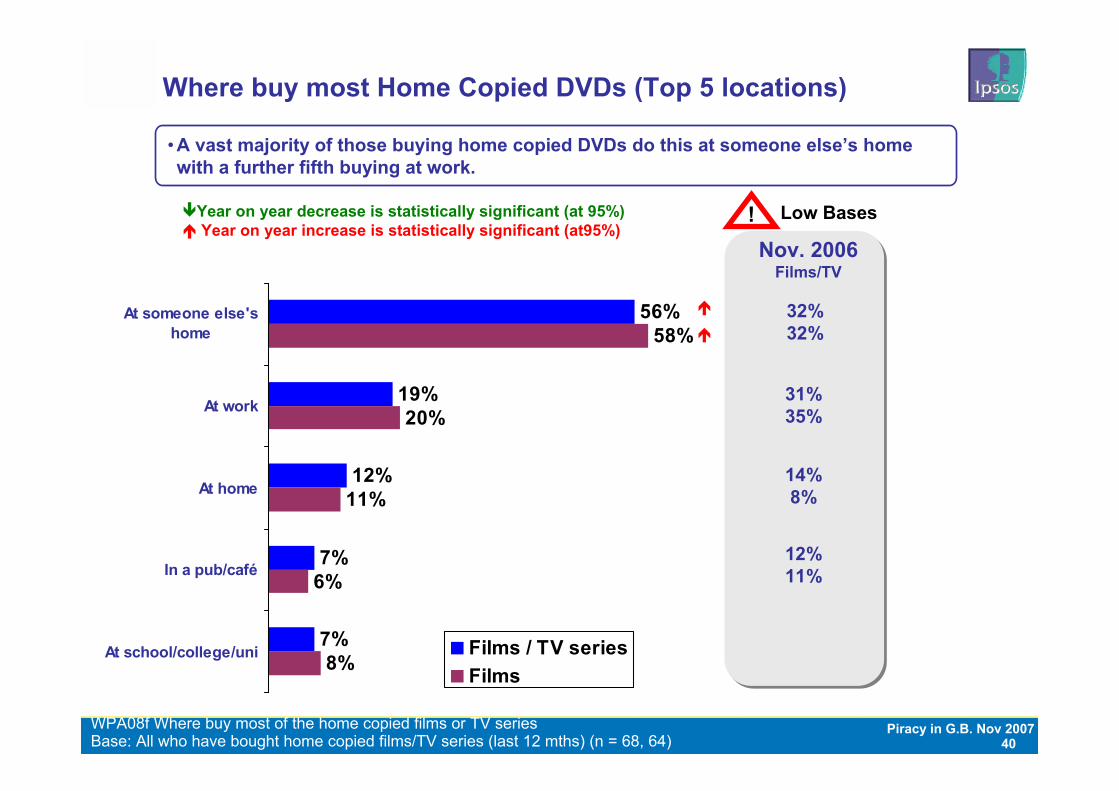
Where buy most Home Copied DVDs (Top 5 locations)
Base: All who have bought home copied films/TV series (last 12 mths) (n = 68, 64)WPA08f Where buy most of the home copied films or TV series
Nov. 2006 Films/TV
32%32%
31%35%
14%8%
12%11%
• A vast majority of those buying home copied DVDs do this at someone else’s home with a further fifth buying at work.
Year on year decrease is statistically significant (at 95%)Year on year increase is statistically significant (at95%)
! Low Bases
41Piracy in G.B. Nov 2007
1. Approach / Key findings
2. Piracy: The scale of the problem
3. Impact of Piracy: Film and TV Series
4. Counterfeit and Home Copied DVDs
5. Downloading and Burning
6. Borrowing and Viewing
42Piracy in G.B. Nov 2007
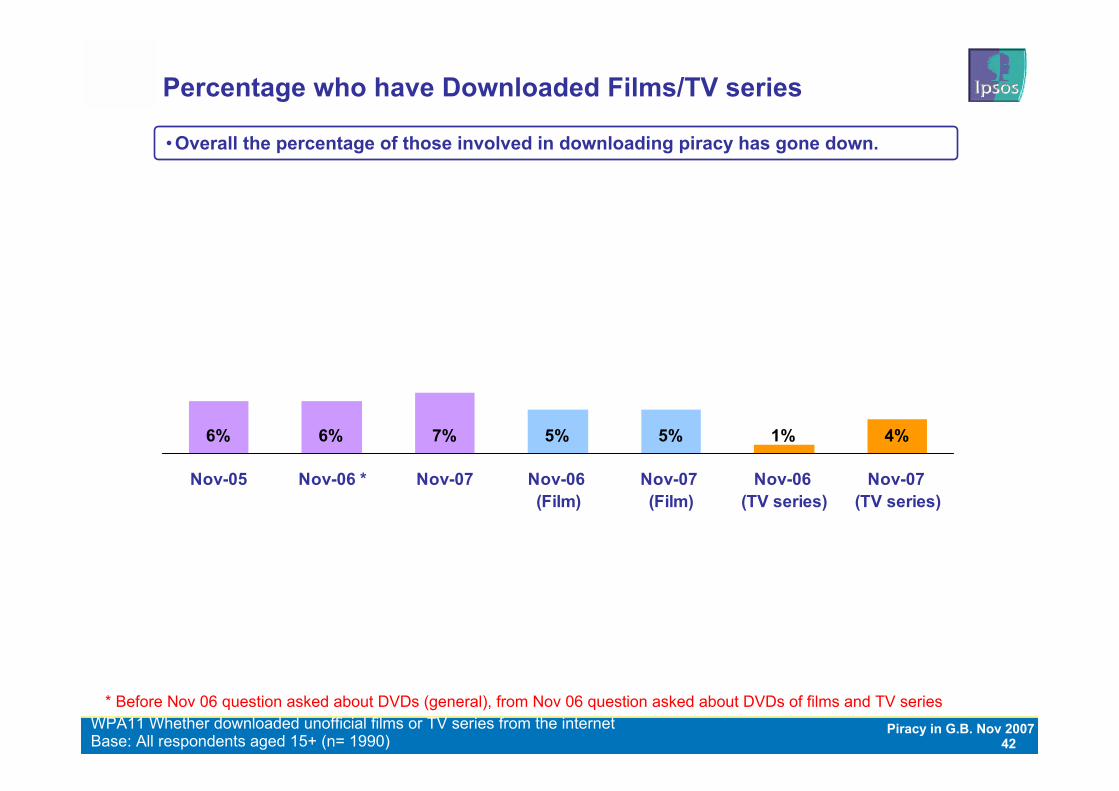
Percentage who have Downloaded Films/TV series
Base: All respondents aged 15+ (n= 1990)WPA11 Whether downloaded unofficial films or TV series from the internet
* Before Nov 06 question asked about DVDs (general), from Nov 06 question asked about DVDs of films and TV series
• Overall the percentage of those involved in downloading piracy has gone down.
6% 6% 7% 1% 4%5% 5%
Nov-05 Nov-06 * Nov-07 Nov-06 (Film)
Nov-07 (Film)
Nov-06 (TV series)
Nov-07 (TV series)
43Piracy in G.B. Nov 2007
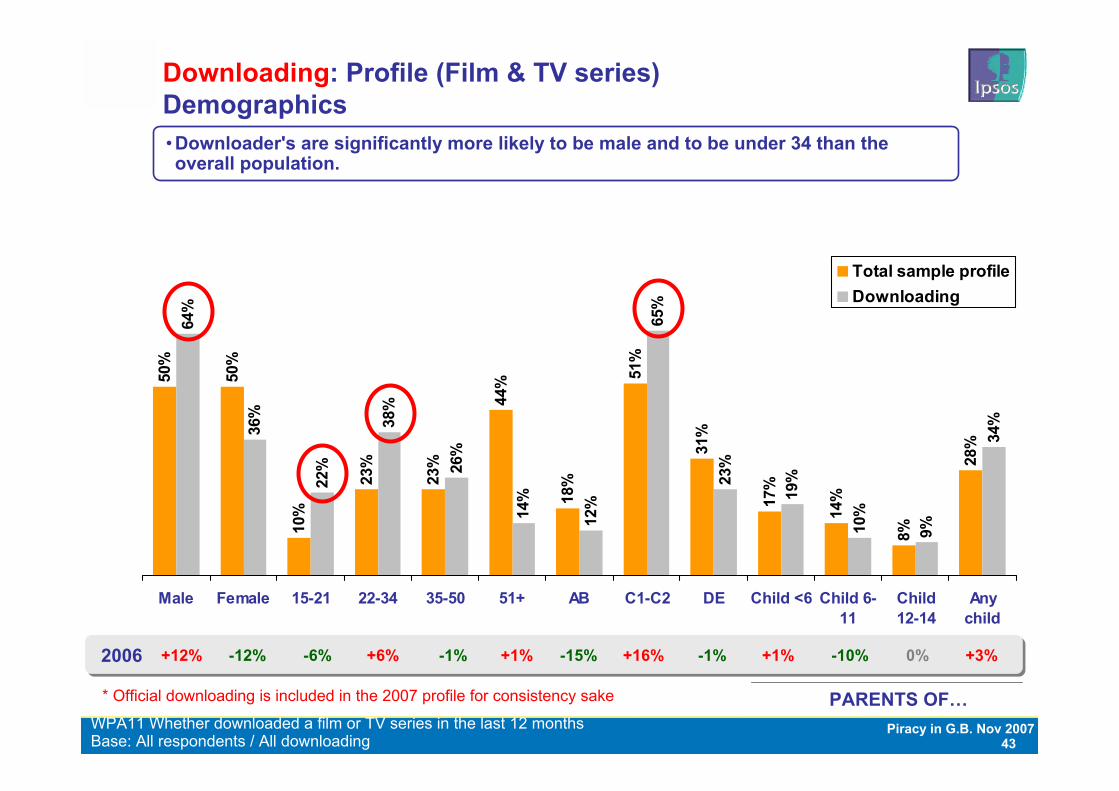
Downloading: Profile (Film & TV series)Demographics
Base: All respondents / All downloadingWPA11 Whether downloaded a film or TV series in the last 12 months
PARENTS OF…
• Downloader's are significantly more likely to be male and to be under 34 than the overall population.
50%
50%
10%
23%
23%
44%
18%
51%
31%
17%
14%
8%
28%
64%
36%
22%
38%
26%
14%
12%
65%
23%
19%
10%
9%
34%
Male Female 15-21 22-34 35-50 51+ AB C1-C2 DE Child <6 Child 6-11
Child12-14
Anychild
Total sample profileDownloading
+12% -12% -6% -1% -10%+6% +1%2006 -15% +16% -1% +1% 0% +3%
* Official downloading is included in the 2007 profile for consistency sake
44Piracy in G.B. Nov 2007
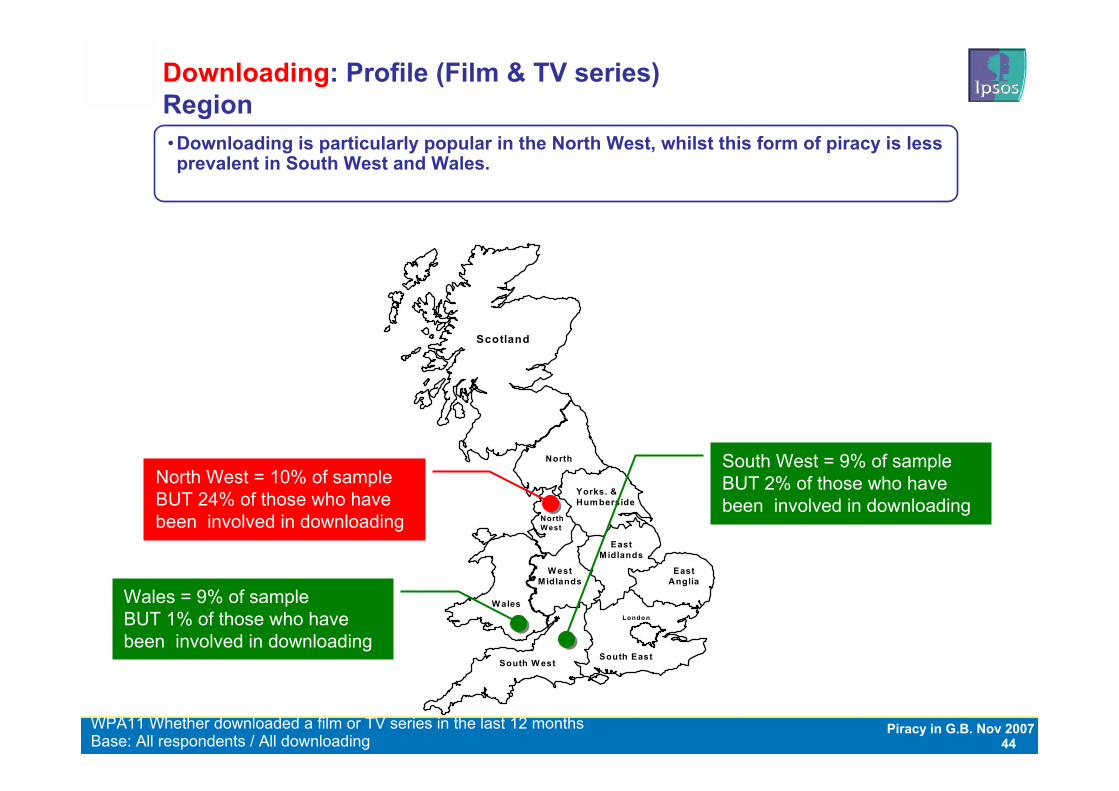
Downloading: Profile (Film & TV series)Region
Base: All respondents / All downloadingWPA11 Whether downloaded a film or TV series in the last 12 months
• Downloading is particularly popular in the North West, whilst this form of piracy is less prevalent in South West and Wales.
Scotland
North
Yorks. &Hum berside
North West
EastMidlands
W estMidlands
EastAnglia
W ales
South W estSouth East
Londo n
North West = 10% of sample BUT 24% of those who have been involved in downloading
Wales = 9% of sample BUT 1% of those who have been involved in downloading
South West = 9% of sample BUT 2% of those who have been involved in downloading
45Piracy in G.B. Nov 2007
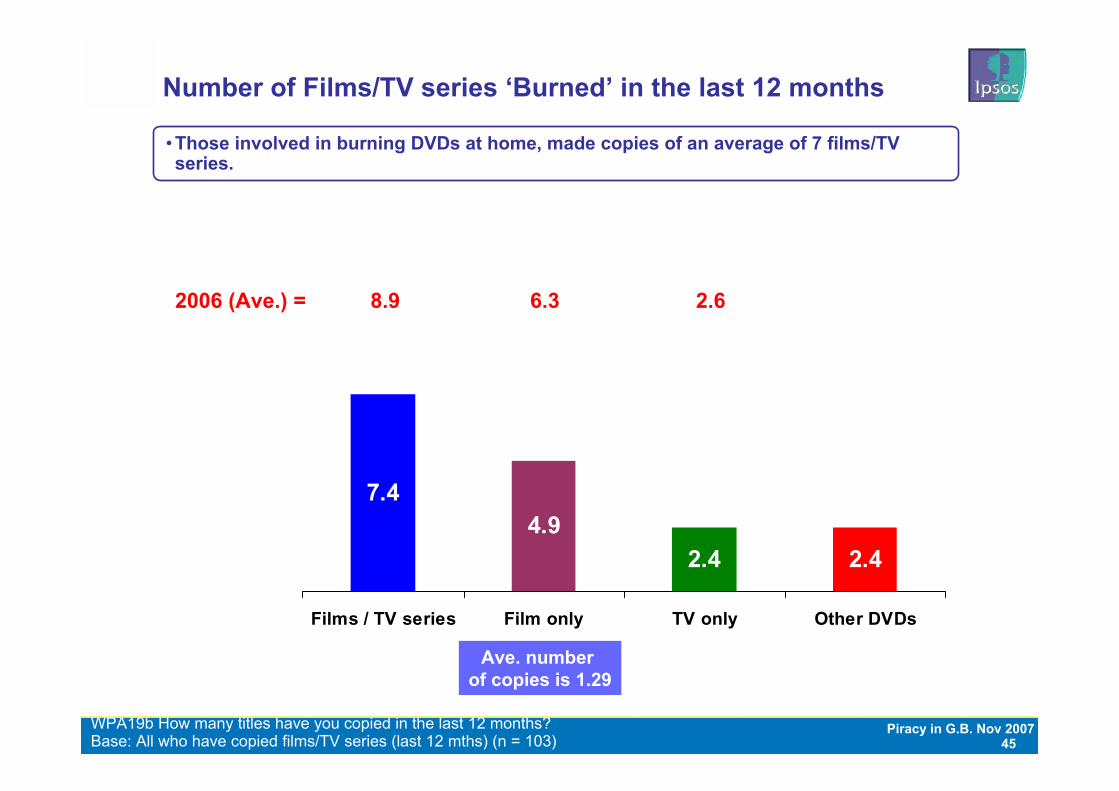
7.44.9
2.4 2.4
Films / TV series Film only TV only Other DVDs
Base: All who have copied films/TV series (last 12 mths) (n = 103)WPA19b How many titles have you copied in the last 12 months?
Number of Films/TV series ‘Burned’ in the last 12 months
Ave. number of copies is 1.29
2006 (Ave.) = 8.9 6.3 2.6
• Those involved in burning DVDs at home, made copies of an average of 7 films/TV series.
46Piracy in G.B. Nov 2007
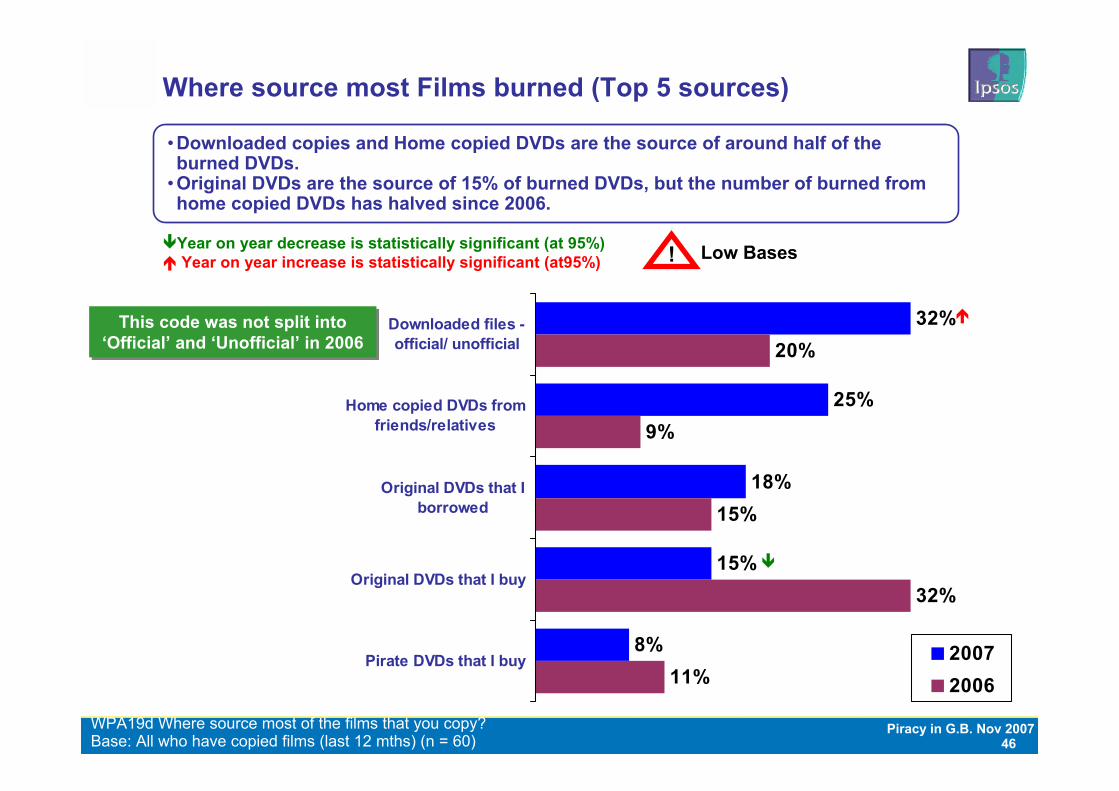
Where source most Films burned (Top 5 sources)
32%
25%
18%
15%
8%
20%
9%
15%
32%
11%
Downloaded files -official/ unofficial
Home copied DVDs fromfriends/relatives
Original DVDs that Iborrowed
Original DVDs that I buy
Pirate DVDs that I buy 20072006
Base: All who have copied films (last 12 mths) (n = 60)WPA19d Where source most of the films that you copy?
• Downloaded copies and Home copied DVDs are the source of around half of the burned DVDs.
• Original DVDs are the source of 15% of burned DVDs, but the number of burned from home copied DVDs has halved since 2006.
This code was not split into ‘Official’ and ‘Unofficial’ in 2006
This code was not split into ‘Official’ and ‘Unofficial’ in 2006
Year on year decrease is statistically significant (at 95%)Year on year increase is statistically significant (at95%) ! Low Bases
47Piracy in G.B. Nov 2007
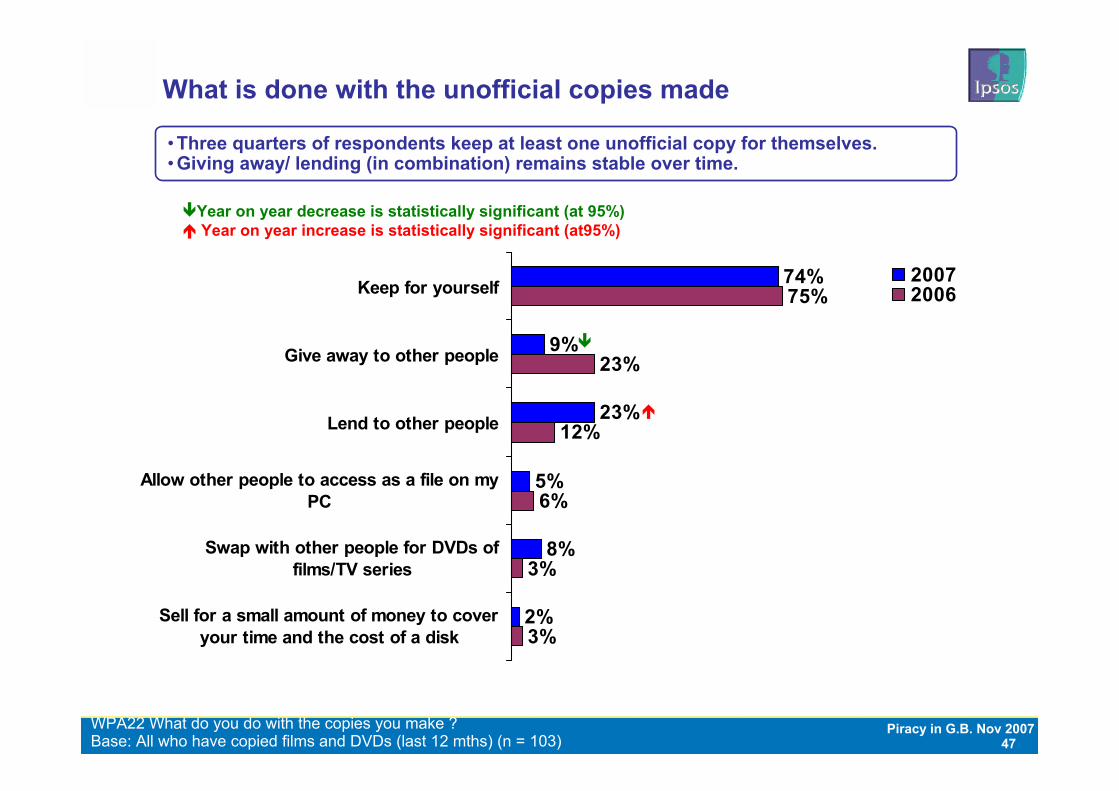
What is done with the unofficial copies made
74%
9%
23%
5%
8%
2%
75%
23%
12%
6%
3%
3%
Keep for yourself
Give away to other people
Lend to other people
Allow other people to access as a file on myPC
Swap with other people for DVDs offilms/TV series
Sell for a small amount of money to coveryour time and the cost of a disk
20072006
Base: All who have copied films and DVDs (last 12 mths) (n = 103)WPA22 What do you do with the copies you make ?
• Three quarters of respondents keep at least one unofficial copy for themselves. • Giving away/ lending (in combination) remains stable over time.
Year on year decrease is statistically significant (at 95%)Year on year increase is statistically significant (at95%)
48Piracy in G.B. Nov 2007
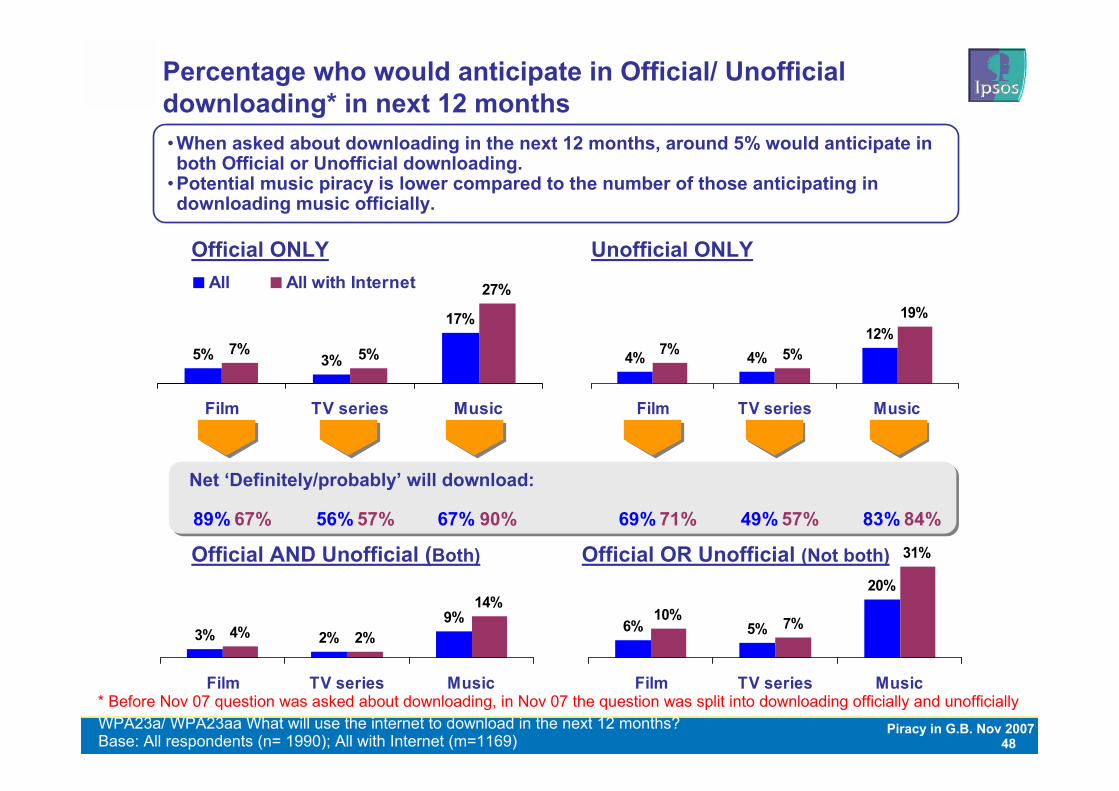
6% 5%
20%
10% 7%
31%
Film TV series Music
Percentage who would anticipate in Official/ Unofficial downloading* in next 12 months• When asked about downloading in the next 12 months, around 5% would anticipate in both Official or Unofficial downloading.
• Potential music piracy is lower compared to the number of those anticipating in downloading music officially.
Base: All respondents (n= 1990); All with Internet (m=1169)WPA23a/ WPA23aa What will use the internet to download in the next 12 months?* Before Nov 07 question was asked about downloading, in Nov 07 the question was split into downloading officially and unofficially
Official ONLY Unofficial ONLY
5% 3%
17%
7% 5%
27%
Film TV series Music
4% 4%12%
7% 5%
19%
Film TV series Music
Net ‘Definitely/probably’ will download:
89% 67% 56% 57% 67% 90% 69% 71% 49% 57% 83% 84%
All All with Internet
3% 2%9%
4% 2%
14%
Film TV series Music
Official AND Unofficial (Both) Official OR Unofficial (Not both)
49Piracy in G.B. Nov 2007
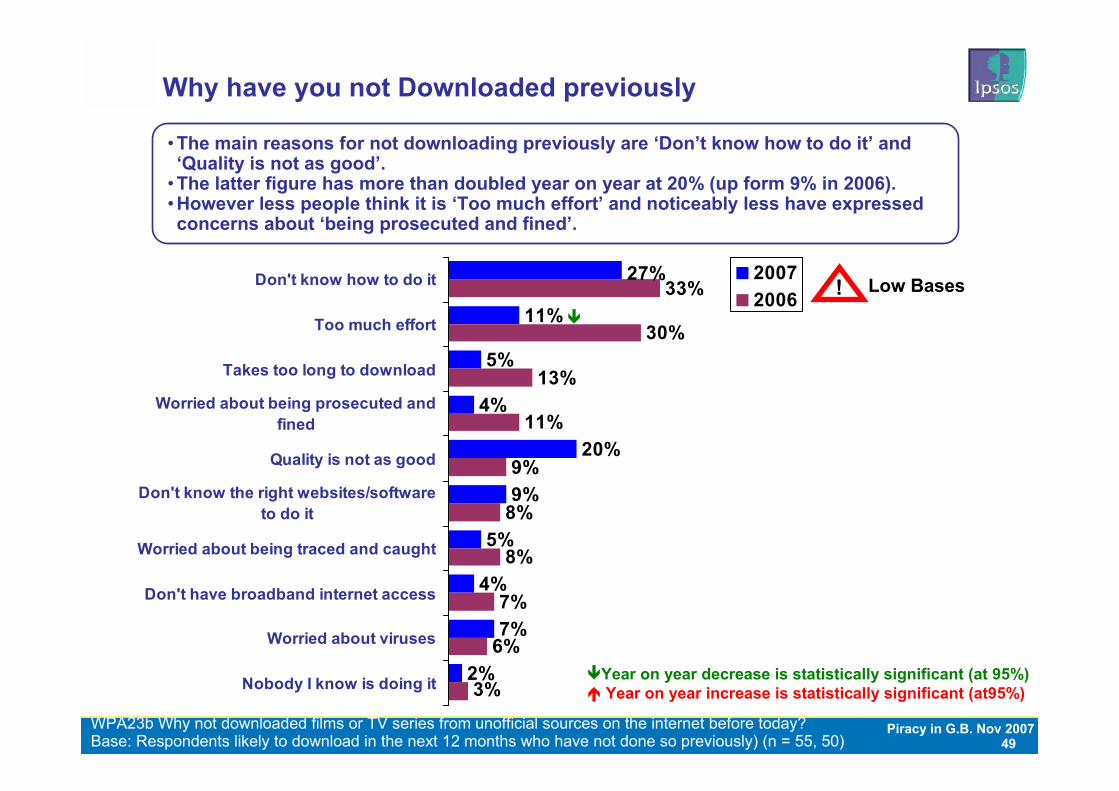
Why have you not Downloaded previously
27%
11%
5%
4%
20%
9%
5%
4%
7%
2%
33%
30%
13%
11%
9%
8%
8%
7%
6%
3%
Don't know how to do it
Too much effort
Takes too long to download
Worried about being prosecuted andfined
Quality is not as good
Don't know the right websites/softwareto do it
Worried about being traced and caught
Don't have broadband internet access
Worried about viruses
Nobody I know is doing it
20072006
Base: Respondents likely to download in the next 12 months who have not done so previously) (n = 55, 50)WPA23b Why not downloaded films or TV series from unofficial sources on the internet before today?
• The main reasons for not downloading previously are ‘Don’t know how to do it’ and ‘Quality is not as good’.
• The latter figure has more than doubled year on year at 20% (up form 9% in 2006). • However less people think it is ‘Too much effort’ and noticeably less have expressed concerns about ‘being prosecuted and fined’.
Year on year decrease is statistically significant (at 95%)Year on year increase is statistically significant (at95%)
! Low Bases
50Piracy in G.B. Nov 2007
1. Approach / Key findings
2. Piracy: The scale of the problem
3. Impact of Piracy: Film and TV Series
4. Counterfeit and Home Copied DVDs
5. Downloading and Burning
6. Borrowing and Viewing
51Piracy in G.B. Nov 2007
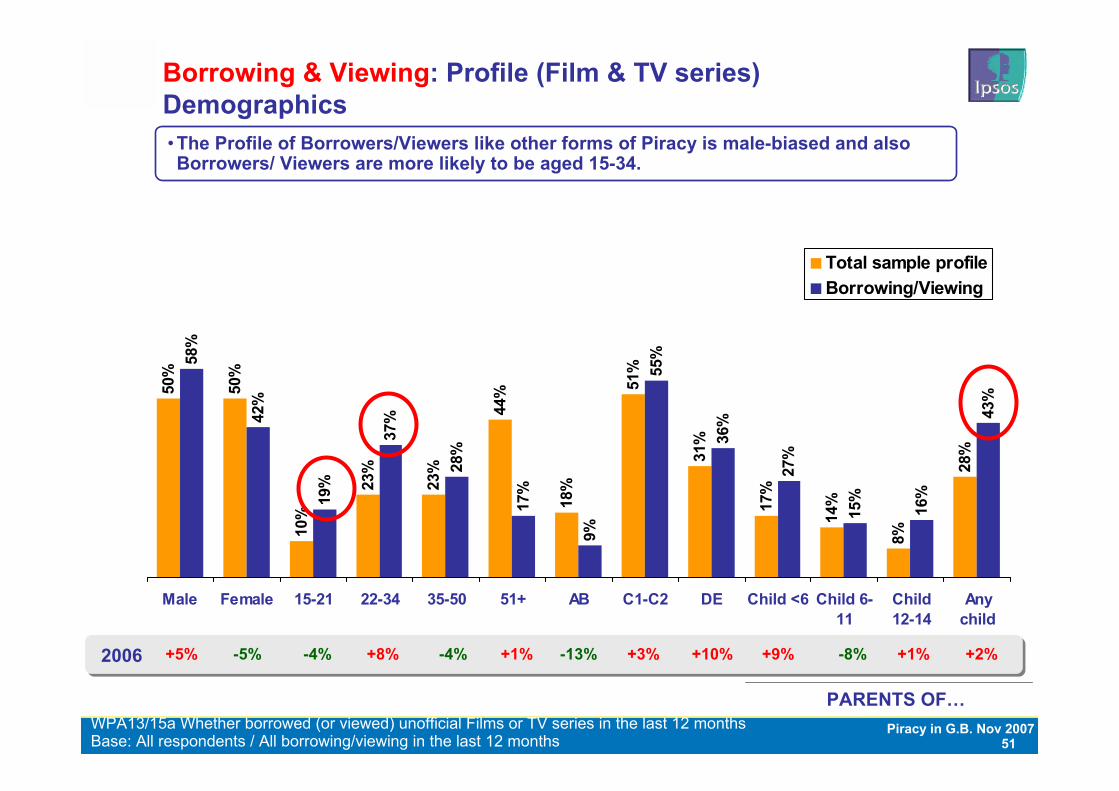
Borrowing & Viewing: Profile (Film & TV series)Demographics
Base: All respondents / All borrowing/viewing in the last 12 monthsWPA13/15a Whether borrowed (or viewed) unofficial Films or TV series in the last 12 months
• The Profile of Borrowers/Viewers like other forms of Piracy is male-biased and also Borrowers/ Viewers are more likely to be aged 15-34.
50%
50%
10%
23%
23%
44%
18%
51%
31%
17%
14%
8%
28%
58%
42%
19%
37%
28%
17%
9%
55%
36%
27%
15%
16%
43%
Male Female 15-21 22-34 35-50 51+ AB C1-C2 DE Child <6 Child 6-11
Child12-14
Anychild
Total sample profileBorrowing/Viewing
PARENTS OF…
+5% -5% -4% -4% -8%+8% +1%2006 -13% +3% +10% +9% +1% +2%
52Piracy in G.B. Nov 2007
Scotland
North
Yorks. &Hum berside
North West
EastMidlands
W estMidlands
EastAnglia
W ales
South W estSouth East
Londo n
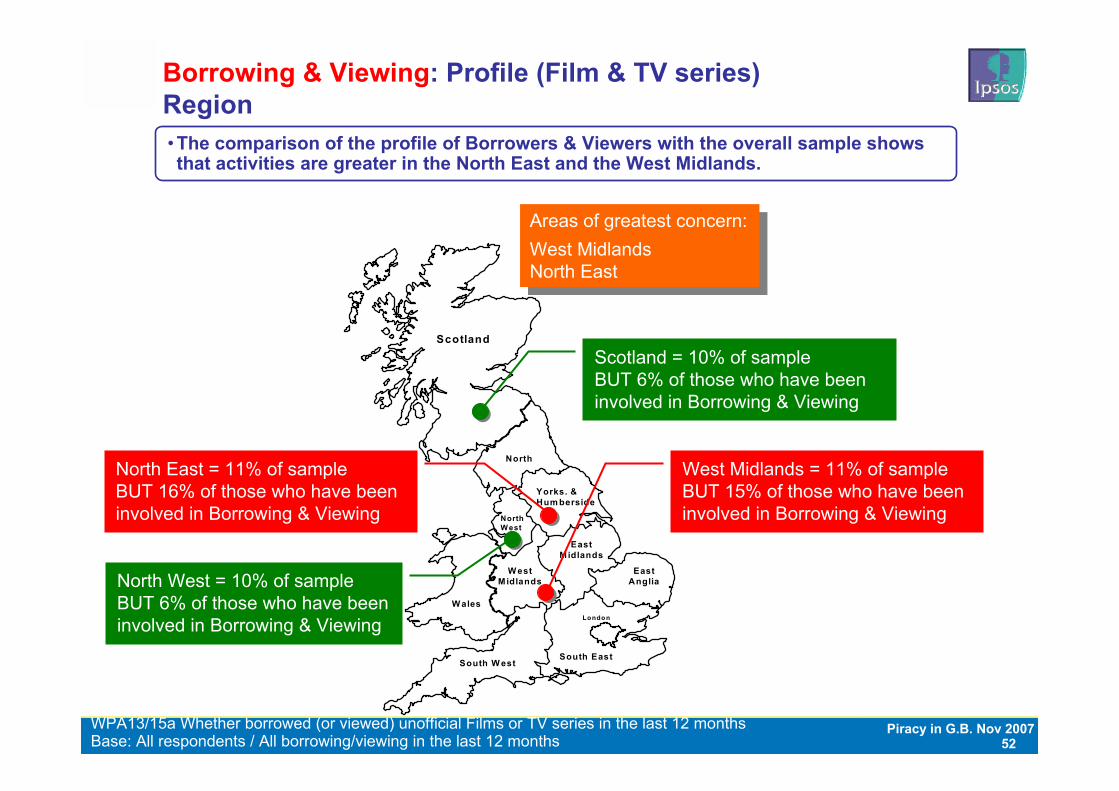
Borrowing & Viewing: Profile (Film & TV series)Region
Base: All respondents / All borrowing/viewing in the last 12 monthsWPA13/15a Whether borrowed (or viewed) unofficial Films or TV series in the last 12 months
• The comparison of the profile of Borrowers & Viewers with the overall sample shows that activities are greater in the North East and the West Midlands.
Areas of greatest concern:West MidlandsNorth East
Areas of greatest concern:West MidlandsNorth East
West Midlands = 11% of sample BUT 15% of those who have been involved in Borrowing & Viewing
Scotland = 10% of sample BUT 6% of those who have been involved in Borrowing & Viewing
North East = 11% of sample BUT 16% of those who have been involved in Borrowing & Viewing
North West = 10% of sample BUT 6% of those who have been involved in Borrowing & Viewing

Appendix
54Piracy in G.B. Nov 2007
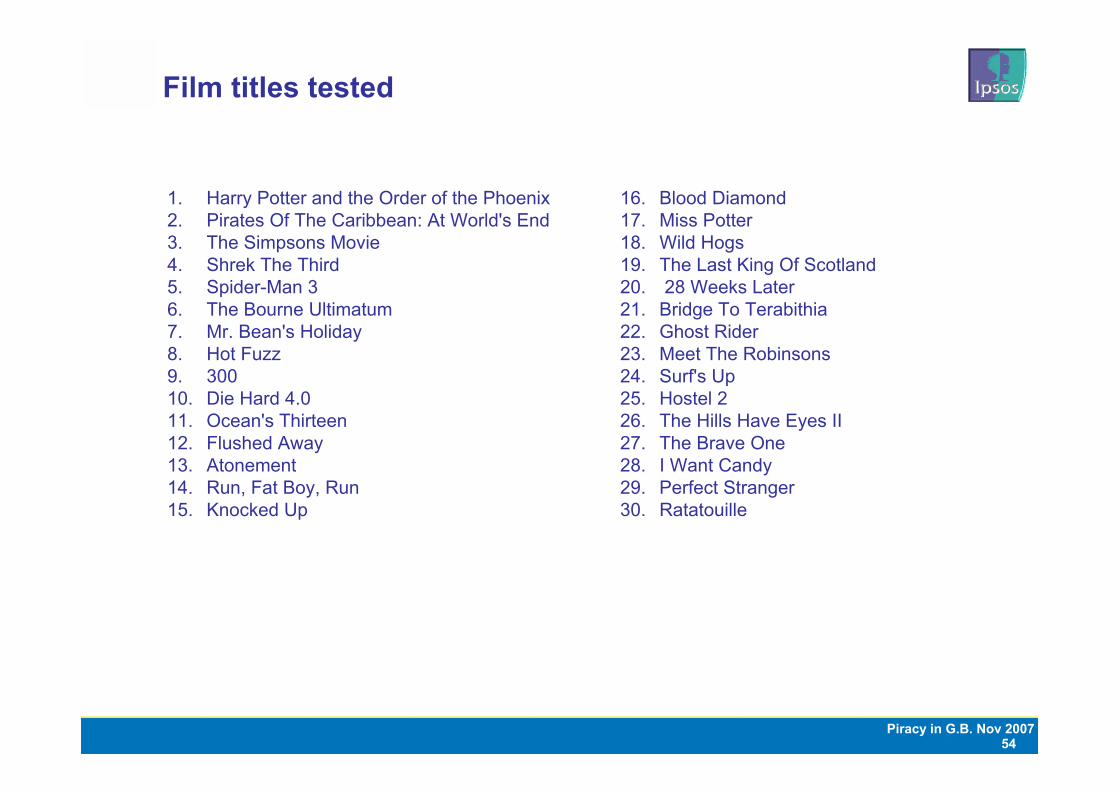
Film titles tested
1. Harry Potter and the Order of the Phoenix2. Pirates Of The Caribbean: At World's End3. The Simpsons Movie4. Shrek The Third 5. Spider-Man 3 6. The Bourne Ultimatum7. Mr. Bean's Holiday 8. Hot Fuzz 9. 30010. Die Hard 4.011. Ocean's Thirteen 12. Flushed Away 13. Atonement 14. Run, Fat Boy, Run 15. Knocked Up
16. Blood Diamond 17. Miss Potter 18. Wild Hogs 19. The Last King Of Scotland20. 28 Weeks Later21. Bridge To Terabithia 22. Ghost Rider 23. Meet The Robinsons 24. Surf's Up 25. Hostel 2 26. The Hills Have Eyes II27. The Brave One28. I Want Candy 29. Perfect Stranger30. Ratatouille
55Piracy in G.B. Nov 2007
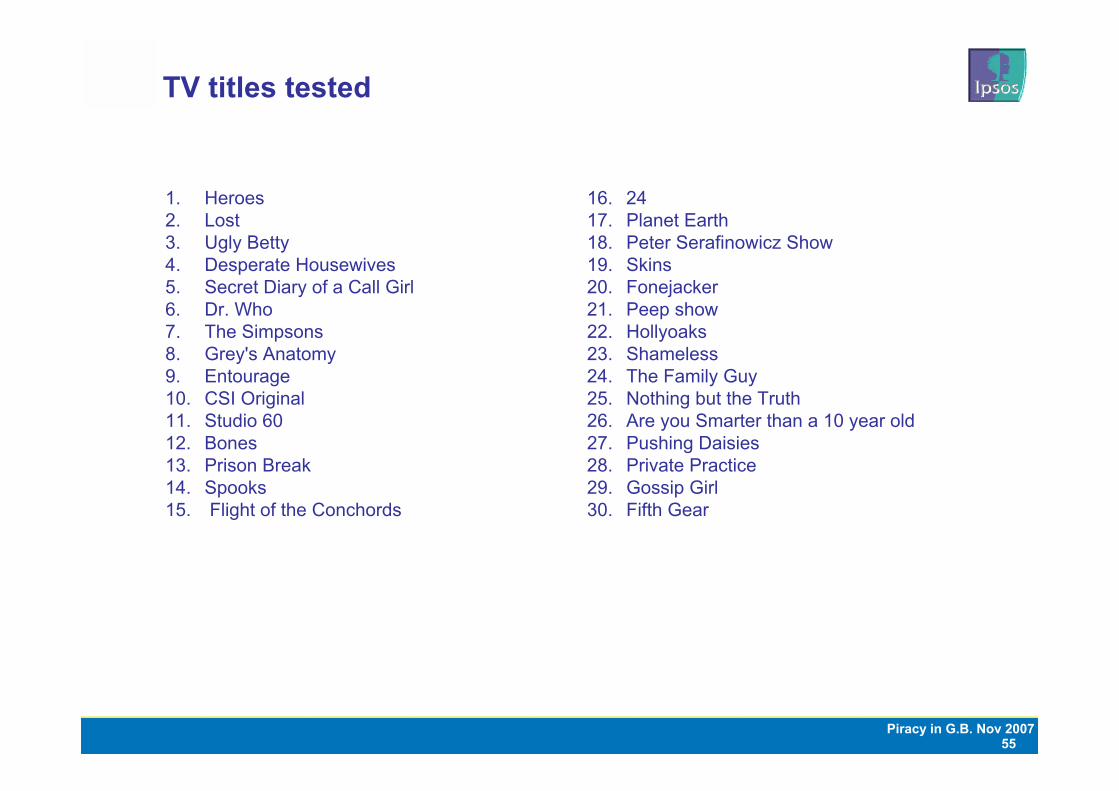
TV titles tested
1. Heroes2. Lost3. Ugly Betty4. Desperate Housewives5. Secret Diary of a Call Girl6. Dr. Who7. The Simpsons8. Grey's Anatomy9. Entourage 10. CSI Original11. Studio 6012. Bones13. Prison Break14. Spooks15. Flight of the Conchords
16. 2417. Planet Earth18. Peter Serafinowicz Show19. Skins20. Fonejacker21. Peep show22. Hollyoaks23. Shameless24. The Family Guy25. Nothing but the Truth26. Are you Smarter than a 10 year old27. Pushing Daisies 28. Private Practice 29. Gossip Girl30. Fifth Gear
56Piracy in G.B. Nov 2007
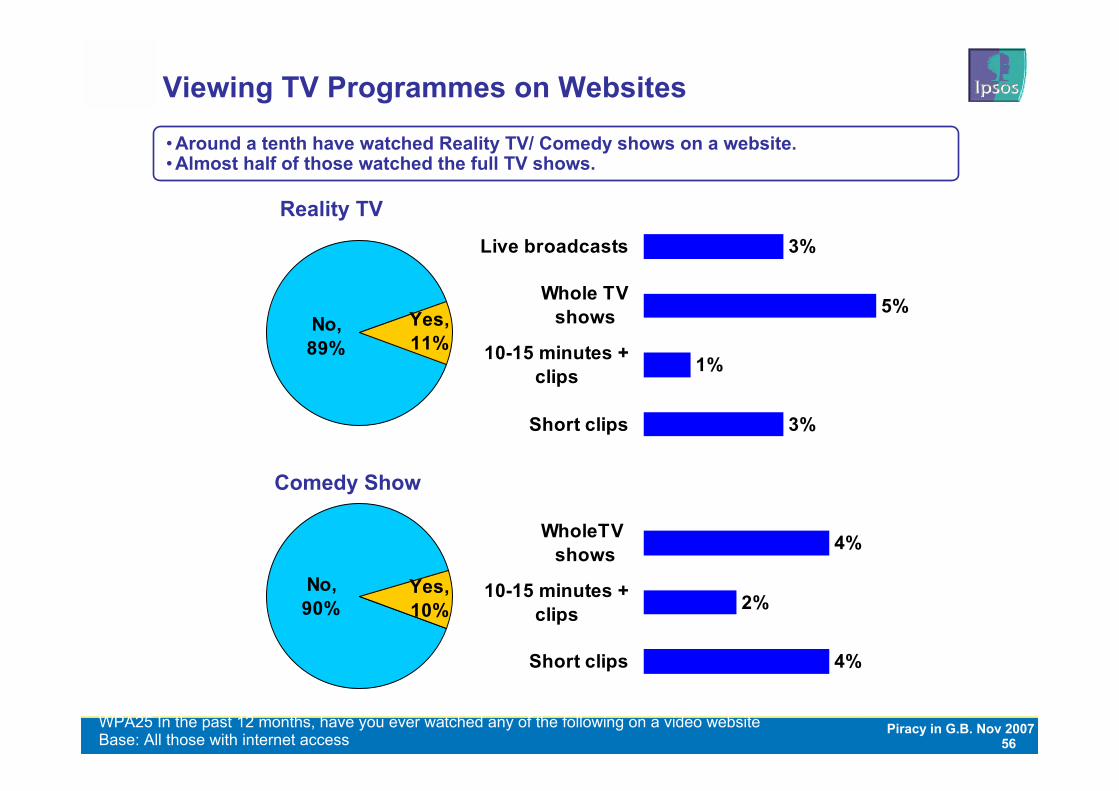
4%
2%
4%
3%
1%
5%
3%
Short clips
10-15 minutes +clips
WholeTV shows
Short clips
10-15 minutes +clips
Whole TVshows
Live broadcasts
Comedy Show
Viewing TV Programmes on Websites
No, 90%
Yes, 10%
• Around a tenth have watched Reality TV/ Comedy shows on a website. • Almost half of those watched the full TV shows.
Reality TV
Base: All those with internet accessWPA25 In the past 12 months, have you ever watched any of the following on a video website
No, 89%
Yes, 11%
57Piracy in G.B. Nov 2007
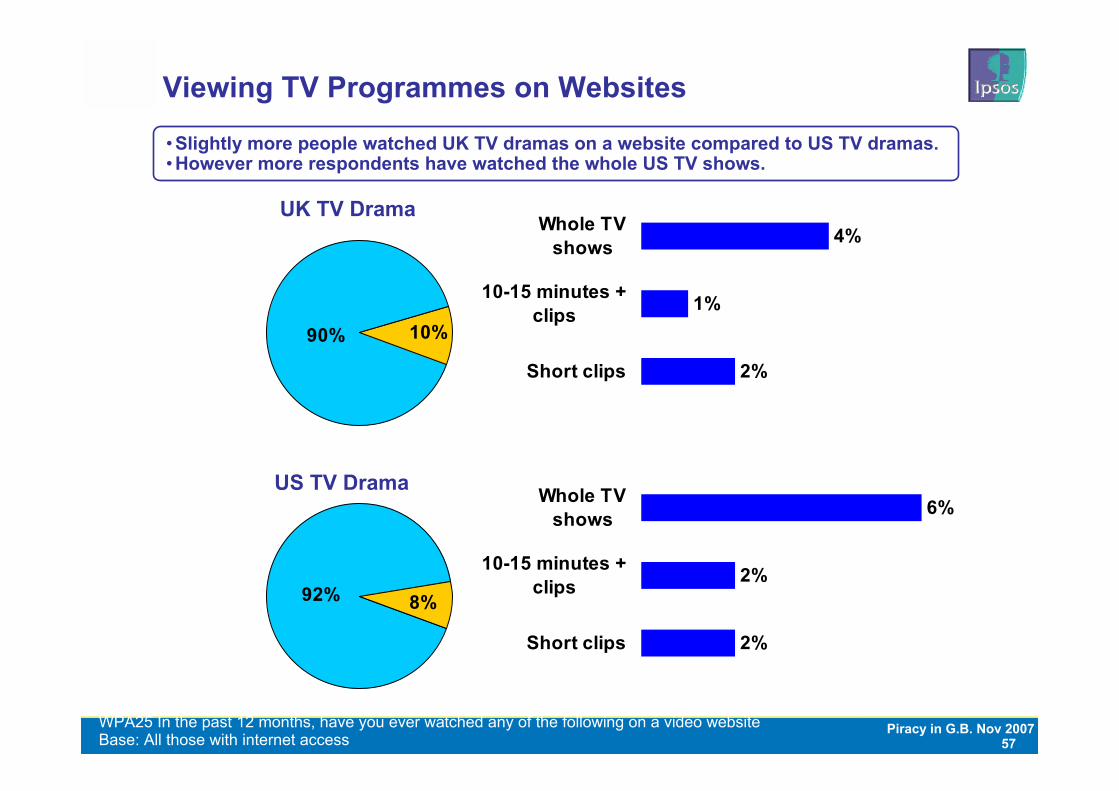
92% 8%
2%
2%
6%
2%
1%
4%
Short clips
10-15 minutes +clips
Whole TVshows
Short clips
10-15 minutes +clips
Whole TVshows
US TV Drama
Viewing TV Programmes on Websites
• Slightly more people watched UK TV dramas on a website compared to US TV dramas. • However more respondents have watched the whole US TV shows.
90% 10%
UK TV Drama
Base: All those with internet accessWPA25 In the past 12 months, have you ever watched any of the following on a video website
58Piracy in G.B. Nov 2007
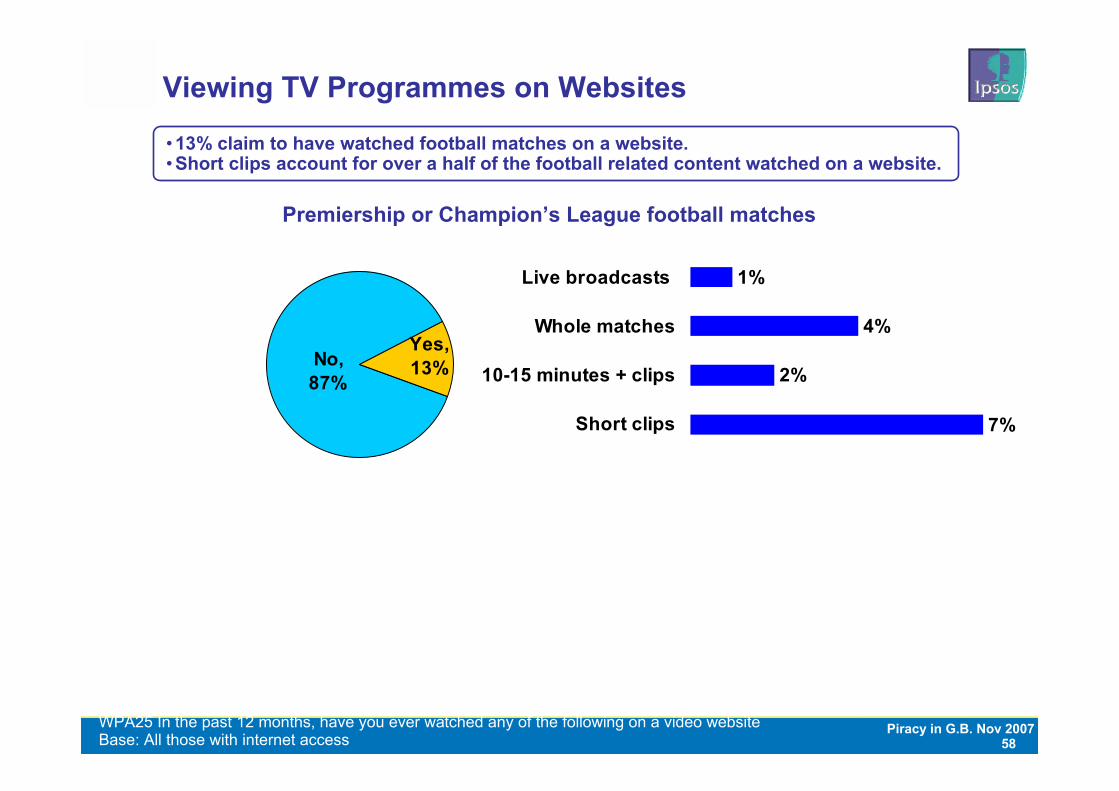
7%
2%
4%
1%
Short clips
10-15 minutes + clips
Whole matches
Live broadcasts
Viewing TV Programmes on Websites
• 13% claim to have watched football matches on a website. • Short clips account for over a half of the football related content watched on a website.
No, 87%
Yes, 13%
Premiership or Champion’s League football matches
Base: All those with internet accessWPA25 In the past 12 months, have you ever watched any of the following on a video website
59Piracy in G.B. Nov 2007
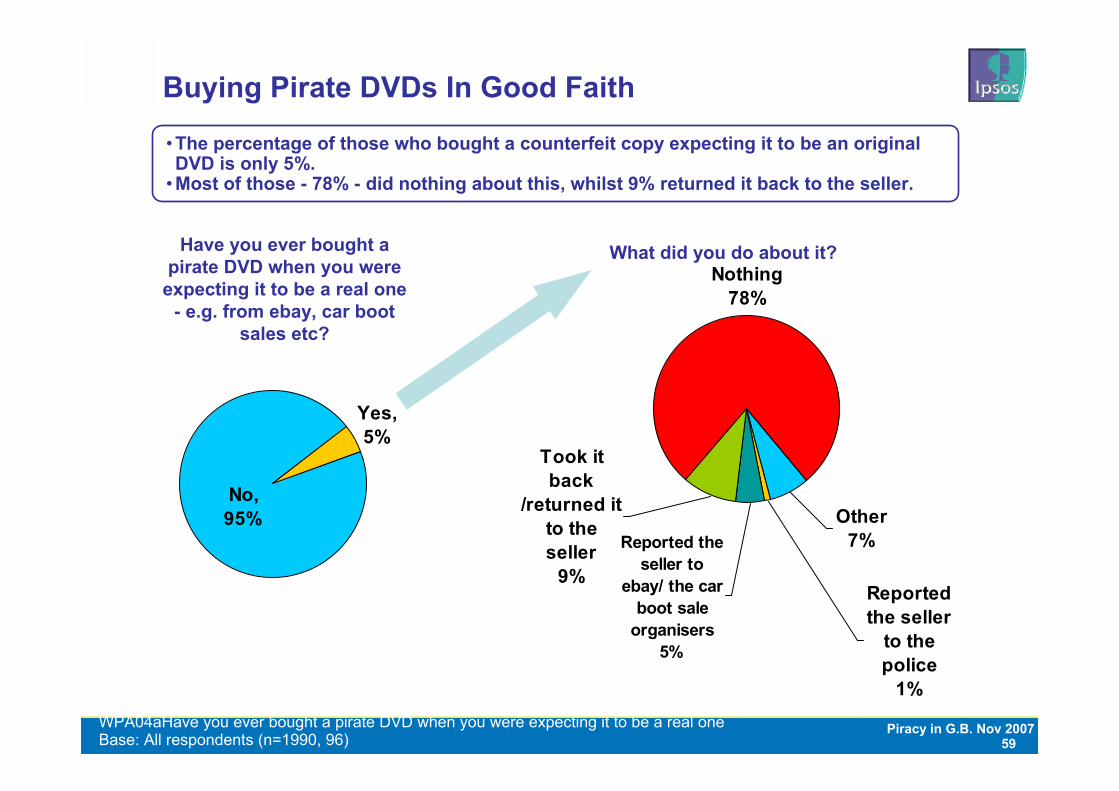
Nothing78%
Reported the seller
to the police
1%
Other7%
Took it back
/returned it to the seller
9%
Reported the seller to
ebay/ the car boot sale
organisers5%
Buying Pirate DVDs In Good Faith
• The percentage of those who bought a counterfeit copy expecting it to be an original DVD is only 5%.
• Most of those - 78% - did nothing about this, whilst 9% returned it back to the seller.
No, 95%
Yes, 5%
Have you ever bought a pirate DVD when you were
expecting it to be a real one - e.g. from ebay, car boot
sales etc?
Base: All respondents (n=1990, 96)WPA04aHave you ever bought a pirate DVD when you were expecting it to be a real one
What did you do about it?
60Piracy in G.B. Nov 2007
Thank you!
If you have any questions regarding this presentation, please feel free to contact:
Jean-Philippe [email protected]
Rimantas [email protected]