DIGITAL HUMANITIES 2009 Interactive Visual Analysis of ...ruck/PAP/dh09.pdf ·...
3
DIGITAL HUMANITIES 2009 Page 278 Interactive Visual Analysis of Personal Names in Japanese Historical Diary Alejandro Toledo Ritsumeikan University [email protected] Ruck Thawonmas Ritsumeikan University [email protected] Akira Maeda Ritsumeikan University [email protected] Fuminori Kimura Ritsumeikan University [email protected] H istorical diaries provide information about and facilitate understanding of daily life during their periods. The historical diary of an aristocrat not only contains historic facts but might also help us disclose them. In this paper, we present an interactive web-based system for visualizing aristocrat names mentioned in a historical Japanese diary called “Hyohanki” written by an aristocrat during the late Heian era (1132-1184). In our web-based system, the stacked graph is utilized to dynamically analyze the time-series of those aristocrat names. We have found that trends in the name occur- rence and co-occurrence visualized by the system cor- relate well with historic facts regarding the rise and fall of power of as well as the confrontation among the cor- responding aristocrats. 1. Introduction A diary is a daily record of events that have happened over the course of a day. Diaries written long time ago or historical diaries provide information about daily life during their periods. They can be also utilized to facili- tate understanding of the life and times of mentioned individuals in those days. Historical diaries written by aristocrats not only contain historic facts but might also help us disclose such facts. Information visualization techniques have been success- fully applied to historical artifacts. Typical applications include Picasso’s artworks and documents (Audenaert et al., 2008; Meneses et al., 2008), 17th-century Portuguese shipbuilding treatises (Furuta et al., 2007), and Vertot’s Roman Revolutions (Jensen, 2006). In this paper, we ap- ply information visualization to a historical diary called “Hyohanki (or Heihanki)” which is a diary written by a Japanese aristocrat, Taira no Nobunori, during the late Heian era (1132-1184). Hyohanki is a relevant resource for the research of Japa- nese culture of that time period. Although some part of Hyohanki has been deteriorated and missing, all re- maining pages are digitized into the text format (Fig. 1), awaiting for digital humanities research activities. An example of such digital humanities research is Cross- Age and Cross-Cultural Information Retrieval discussed in (Maeda and Kimura, 2008). In this paper, we present an interactive web-based sys- tem 1 for visualizing aristocrat names mentioned in Hyo- hanki. In our system, the stacked graph (Wattenberg, 2005) is utilized to dynamically analyze the time-series of those aristocrat names. This kind of dynamic analysis helps the viewer to track trends in the name occurrence and co-occurrence and thus facilitates revealing of his- toric facts behind them. Fig. 1 Example of a digitized page of historical Japanese diary “Hyohanki” 2. Methodology 2.1 Data Our system is based on entries derived from the Hyo- hanki Diary. Such entries, contained in a delimited text file, are expressed by a tabular representation consisting of three attributes: (i) year, (ii) aristocrat name for which the family name is placed before the given name, and (iii) a numerical value indicating the number of occur- rences of that name in that year. This data was extracted from “Personal Names Index” of Hyohanki, which was manually created by experts in Japanese history. 2.2 Visualization The method used to visualize the data is straightfor-
Transcript of DIGITAL HUMANITIES 2009 Interactive Visual Analysis of ...ruck/PAP/dh09.pdf ·...
DIGITAL HUMANITIES 2009
Page 278
Interactive Visual Analysis of Personal Names in Japanese Historical DiaryAlejandro ToledoRitsumeikan [email protected]
Ruck ThawonmasRitsumeikan [email protected]
Akira MaedaRitsumeikan [email protected]
Fuminori KimuraRitsumeikan University [email protected]
Historical diaries provide information about and facilitate understanding of daily life during their
periods. The historical diary of an aristocrat not only contains historic facts but might also help us disclose them. In this paper, we present an interactive web-based system for visualizing aristocrat names mentioned in a historical Japanese diary called “Hyohanki” written by an aristocrat during the late Heian era (1132-1184). In our web-based system, the stacked graph is utilized to dynamically analyze the time-series of those aristocrat names. We have found that trends in the name occur-rence and co-occurrence visualized by the system cor-relate well with historic facts regarding the rise and fall of power of as well as the confrontation among the cor-responding aristocrats.
1. IntroductionA diary is a daily record of events that have happened over the course of a day. Diaries written long time ago or historical diaries provide information about daily life during their periods. They can be also utilized to facili-tate understanding of the life and times of mentioned individuals in those days. Historical diaries written by aristocrats not only contain historic facts but might also help us disclose such facts.
Information visualization techniques have been success-fully applied to historical artifacts. Typical applications includePicasso’sartworksanddocuments(Audenaertet
al., 2008; Meneses et al., 2008), 17th-century Portuguese shipbuildingtreatises(Furutaetal.,2007),andVertot’sRoman Revolutions (Jensen, 2006). In this paper, we ap-ply information visualization to a historical diary called “Hyohanki (or Heihanki)” which is a diary written by a Japanese aristocrat, Taira no Nobunori, during the late Heian era (1132-1184).
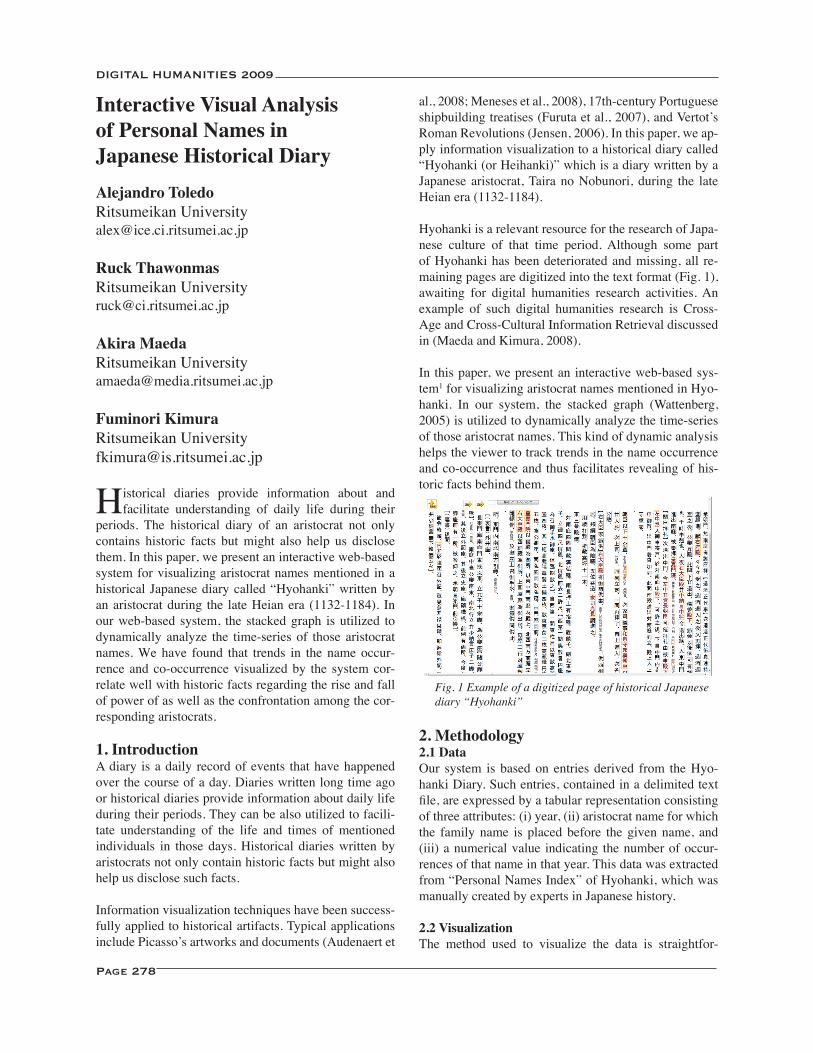
Hyohanki is a relevant resource for the research of Japa-nese culture of that time period. Although some part of Hyohanki has been deteriorated and missing, all re-maining pages are digitized into the text format (Fig. 1), awaiting for digital humanities research activities. An example of such digital humanities research is Cross-Age and Cross-Cultural Information Retrieval discussed in (Maeda and Kimura, 2008).
In this paper, we present an interactive web-based sys-tem1 for visualizing aristocrat names mentioned in Hyo-hanki. In our system, the stacked graph (Wattenberg, 2005) is utilized to dynamically analyze the time-series of those aristocrat names. This kind of dynamic analysis helps the viewer to track trends in the name occurrence and co-occurrence and thus facilitates revealing of his-toric facts behind them.
Fig. 1 Example of a digitized page of historical Japanese diary “Hyohanki”
2. Methodology 2.1 Data Our system is based on entries derived from the Hyo-hanki Diary. Such entries, contained in a delimited text file,areexpressedbyatabularrepresentationconsistingof three attributes: (i) year, (ii) aristocrat name for which the family name is placed before the given name, and (iii) a numerical value indicating the number of occur-rences of that name in that year. This data was extracted from “Personal Names Index” of Hyohanki, which was manually created by experts in Japanese history.
2.2 Visualization The method used to visualize the data is straightfor-
DIGITAL HUMANITIES 2009
Page 279
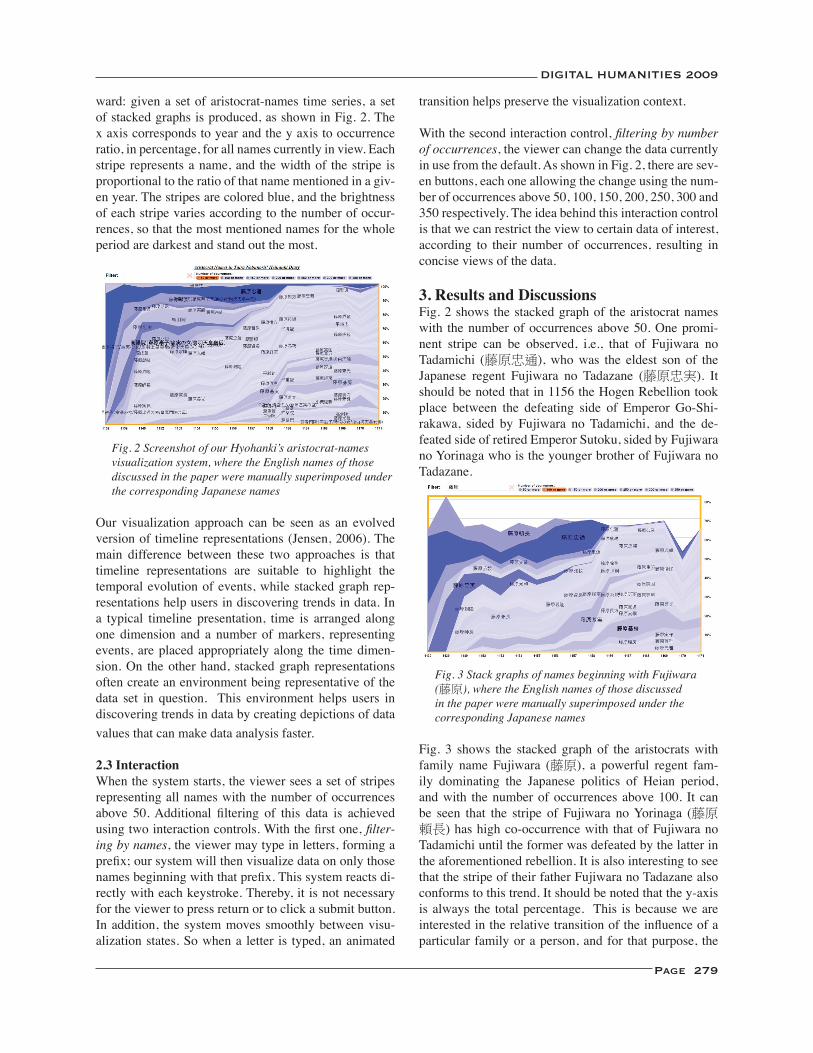
ward: given a set of aristocrat-names time series, a set of stacked graphs is produced, as shown in Fig. 2. The x axis corresponds to year and the y axis to occurrence ratio, in percentage, for all names currently in view. Each stripe represents a name, and the width of the stripe is proportional to the ratio of that name mentioned in a giv-en year. The stripes are colored blue, and the brightness of each stripe varies according to the number of occur-rences, so that the most mentioned names for the whole period are darkest and stand out the most.
Fig. 2 Screenshot of our Hyohanki’s aristocrat-names visualization system, where the English names of those discussed in the paper were manually superimposed under the corresponding Japanese names
Our visualization approach can be seen as an evolved version of timeline representations (Jensen, 2006). The main difference between these two approaches is that timeline representations are suitable to highlight the temporal evolution of events, while stacked graph rep-resentations help users in discovering trends in data. In a typical timeline presentation, time is arranged along one dimension and a number of markers, representing events, are placed appropriately along the time dimen-sion. On the other hand, stacked graph representations often create an environment being representative of the data set in question. This environment helps users in discovering trends in data by creating depictions of data values that can make data analysis faster.
2.3 Interaction When the system starts, the viewer sees a set of stripes representing all names with the number of occurrences above 50.Additional filtering of this data is achievedusingtwointeractioncontrols.Withthefirstone,filter-ing by names, the viewer may type in letters, forming a prefix;oursystemwillthenvisualizedataononlythosenamesbeginningwiththatprefix.Thissystemreactsdi-rectly with each keystroke. Thereby, it is not necessary for the viewer to press return or to click a submit button. In addition, the system moves smoothly between visu-alization states. So when a letter is typed, an animated
transition helps preserve the visualization context.
With the second interaction control, filtering by number of occurrences, the viewer can change the data currently in use from the default. As shown in Fig. 2, there are sev-en buttons, each one allowing the change using the num-ber of occurrences above 50, 100, 150, 200, 250, 300 and 350 respectively. The idea behind this interaction control is that we can restrict the view to certain data of interest, according to their number of occurrences, resulting in concise views of the data.
3. Results and Discussions Fig. 2 shows the stacked graph of the aristocrat names with the number of occurrences above 50. One promi-nent stripe can be observed, i.e., that of Fujiwara no Tadamichi (藤原忠通), who was the eldest son of the Japanese regent Fujiwara no Tadazane (藤原忠実). It should be noted that in 1156 the Hogen Rebellion took place between the defeating side of Emperor Go-Shi-rakawa, sided by Fujiwara no Tadamichi, and the de-feated side of retired Emperor Sutoku, sided by Fujiwara no Yorinaga who is the younger brother of Fujiwara no Tadazane.
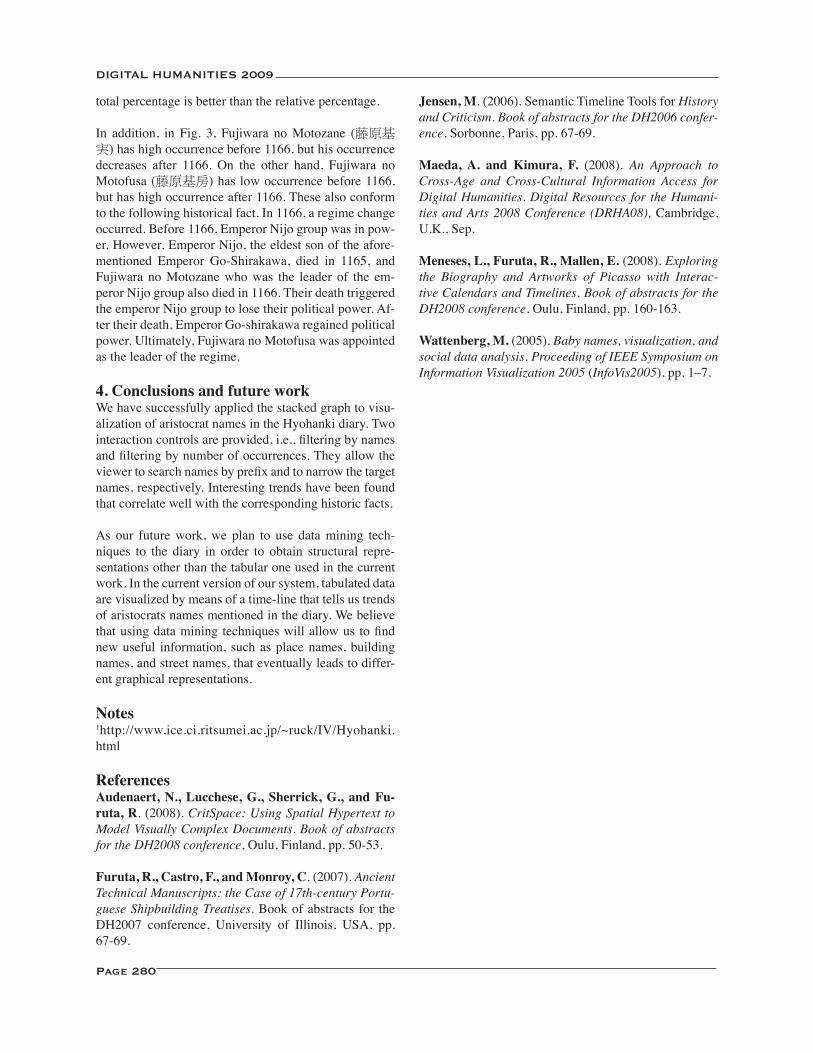
Fig. 3 Stack graphs of names beginning with Fujiwara (藤原), where the English names of those discussed in the paper were manually superimposed under the corresponding Japanese names
Fig. 3 shows the stacked graph of the aristocrats with family name Fujiwara (藤原), a powerful regent fam-ily dominating the Japanese politics of Heian period, and with the number of occurrences above 100. It can be seen that the stripe of Fujiwara no Yorinaga (藤原頼長) has high co-occurrence with that of Fujiwara no Tadamichi until the former was defeated by the latter in the aforementioned rebellion. It is also interesting to see that the stripe of their father Fujiwara no Tadazane also conforms to this trend. It should be noted that the y-axis is always the total percentage. This is because we are interestedintherelativetransitionoftheinfluenceofaparticular family or a person, and for that purpose, the
DIGITAL HUMANITIES 2009
Page 280
total percentage is better than the relative percentage.
In addition, in Fig. 3, Fujiwara no Motozane (藤原基実) has high occurrence before 1166, but his occurrence decreases after 1166. On the other hand, Fujiwara no Motofusa (藤原基房) has low occurrence before 1166, but has high occurrence after 1166. These also conform to the following historical fact. In 1166, a regime change occurred. Before 1166, Emperor Nijo group was in pow-er. However, Emperor Nijo, the eldest son of the afore-mentioned Emperor Go-Shirakawa, died in 1165, and Fujiwara no Motozane who was the leader of the em-peror Nijo group also died in 1166. Their death triggered the emperor Nijo group to lose their political power. Af-ter their death, Emperor Go-shirakawa regained political power. Ultimately, Fujiwara no Motofusa was appointed as the leader of the regime.
4. Conclusions and future workWe have successfully applied the stacked graph to visu-alization of aristocrat names in the Hyohanki diary. Two interactioncontrolsareprovided,i.e.,filteringbynamesandfilteringbynumberofoccurrences.Theyallowtheviewertosearchnamesbyprefixandtonarrowthetargetnames, respectively. Interesting trends have been found that correlate well with the corresponding historic facts.
As our future work, we plan to use data mining tech-niques to the diary in order to obtain structural repre-sentations other than the tabular one used in the current work. In the current version of our system, tabulated data are visualized by means of a time-line that tells us trends of aristocrats names mentioned in the diary. We believe thatusingdataminingtechniqueswillallowustofindnew useful information, such as place names, building names, and street names, that eventually leads to differ-ent graphical representations.
Notes1http://www.ice.ci.ritsumei.ac.jp/~ruck/IV/Hyohanki.html
References Audenaert, N., Lucchese, G., Sherrick, G., and Fu-ruta, R. (2008). CritSpace: Using Spatial Hypertext to Model Visually Complex Documents. Book of abstracts for the DH2008 conference, Oulu, Finland, pp. 50-53.
Furuta, R., Castro, F., and Monroy, C. (2007). Ancient Technical Manuscripts: the Case of 17th-century Portu-guese Shipbuilding Treatises. Book of abstracts for the DH2007 conference, University of Illinois, USA, pp. 67-69.
Jensen, M. (2006). Semantic Timeline Tools for History and Criticism. Book of abstracts for the DH2006 confer-ence, Sorbonne, Paris, pp. 67-69.
Maeda, A. and Kimura, F. (2008). An Approach to Cross-Age and Cross-Cultural Information Access for Digital Humanities. Digital Resources for the Humani-ties and Arts 2008 Conference (DRHA08), Cambridge, U.K., Sep.
Meneses, L., Furuta, R., Mallen, E. (2008). Exploring the Biography and Artworks of Picasso with Interac-tive Calendars and Timelines. Book of abstracts for the DH2008 conference, Oulu, Finland, pp. 160-163.
Wattenberg, M. (2005). Baby names, visualization, and social data analysis. Proceeding of IEEE Symposium on Information Visualization 2005 (InfoVis2005), pp. 1–7.