Digital Geologic Maps Data Model · PDF fileDIGITAL GEOLOGIC MAPS DATA MODEL Version 4.1...
81
Geologic Map Data Model 10/17/97 Forward: Version 4.1 1 DRAFT - DRAFT - DRAFT DIGITAL GEOLOGIC MAPS DATA MODEL Version 4.1 October 17, 1997 By Bruce R. Johnson, Boyan Brodaric, and Gary L. Raines AASG/USGS Geologic Map Data Model Committee* Gary Raines 1 , Chairman, US Geological Survey, [email protected] Boyan Brodaric 1 , Geological Survey of Canada, [email protected] Jim Cobb, Kentucky Geological Survey, [email protected] Ralph Haugerud, US Geological Survey, [email protected] Greg Hermann, New Jersey Geological Survey, [email protected] Bruce Johnson 1 , US Geological Survey, [email protected] Jon Matti, US Geological Survey, [email protected] Jim McDonald, Ohio Geologica Survey, [email protected] Don Mckay, Illinois Geological Survey, [email protected] Steve P Schilling, US Geological Survey, [email protected]) Randy Schumann, US Geological Survey, [email protected] Bill Shilts, Illinois Geological Survey, [email protected] Ron Wahl, US Geological Survey, [email protected] * Names listed in alphabetical order after the chairman 1 Contacts for detailed questions about this report
Transcript of Digital Geologic Maps Data Model · PDF fileDIGITAL GEOLOGIC MAPS DATA MODEL Version 4.1...
Geologic Map Data Model 10/17/97Forward: Version 4.1
1
DRAFT - DRAFT - DRAFTDIGITAL GEOLOGIC MAPS DATA MODEL
Version 4.1October 17, 1997
ByBruce R. Johnson, Boyan Brodaric, and Gary L. Raines
AASG/USGS Geologic Map Data Model Committee*Gary Raines1, Chairman, US Geological Survey, [email protected] Brodaric1, Geological Survey of Canada, [email protected] Cobb, Kentucky Geological Survey, [email protected] Haugerud, US Geological Survey, [email protected] Hermann, New Jersey Geological Survey, [email protected] Johnson1, US Geological Survey, [email protected] Matti, US Geological Survey, [email protected] McDonald, Ohio Geologica Survey, [email protected] Mckay, Illinois Geological Survey, [email protected] P Schilling, US Geological Survey, [email protected])Randy Schumann, US Geological Survey, [email protected] Shilts, Illinois Geological Survey, [email protected] Wahl, US Geological Survey, [email protected]
* Names listed in alphabetical order after the chairman1 Contacts for detailed questions about this report

Geologic Map Data Model 10/17/97Forward: Version 4.1
2
ContentsPreface Warnings and AcknowledgmentsChapter 1 Introduction and PurposeChapter 2 The Relational ModelChapter 3 Implementation ConsiderationsAppendix A Suggested future extensions and additional attributes
Additional Chapters on the Object Model, Background, and Tools are in preparation (October 17, 1997)

Geologic Map Data Model 10/17/97Forward: Version 4.1
3
WARNING! WARNING! WARNING!The following is a working document which constitutes the recommendations of the Data Model
Committee of the AASG/USGS Committee on Digital Geologic Maps. This report has not been reviewed orapproved by either the AASG or USGS. Updated releases of this report will be placed on the Web(http://ncgmp.usgs.gov/ngmdbproject/) as the report evolves. It is available in this draft form for commentsand suggestions as part of an informal review process. Please forward all comments and suggestions to GaryRaines (address below). To discuss this report or ask detailed questions, contact one of the following: Bruce R.Johnson, U.S. Geological Survey, 954 National Center, Reston, Virginia 20192, USA, telephone: 703-648-6051, fax: 703-648-6383, email: [email protected]; Boyan Brodaric, Geological Survey of Canada, 615Booth St., room 234B, Ottawa, Ontario K1A 0E9, Canada, telephone: 613/992-3562 fax: 613/995-9273 email:[email protected]; or Gary Raines, U.S. Geological Survey, c/o Mackay School of Mines MS 176,University of Nevada Reno, Reno, Nevada 89557, USA, telephone: 702-784-5596, fax: 702-784-5079, email:[email protected]. It is anticipated that there will be frequent updates and changes. Please label all commentswith the version and date of the manuscript.
This data model does not address the format or content of the metadata. The formats and content ofthe metadata files are treated separately elsewhere. The metadata files, of course, eventually need to beassociated with the files described here.
AcknowledgmentThe effort to create a data model for digital geologic maps has involved many people and a lot of
intense discussion. This paper attempts to condense that discussion into a manageable form and to present theresults, a data model. Consequently the authors have drawn on their own experiences and have functioned in afashion similar to compilers of geologic maps. We wish to acknowledge that many people have contributed.We have attempted to organize and compile our understanding of these diverse thoughts to define thegrammar and some of the vocabulary of geologic maps in a computer geographic information system context.If this report generates nothing more than discussion of what is a digital geologic map, then we will havesucceeded.
Geologic Map Data Model 10/17/97Chapter 1: Version 4.1
4
CHAPTER 1: Introduction and Purpose
ContentsCHAPTER 1: Introduction and Purpose....................................................................................................4
Introduction..........................................................................................................................................4Overview...........................................................................................................................................5
Purpose.................................................................................................................................................6Design Objectives..............................................................................................................................6
FiguresFigure 1- 1: Diagram showing the three classes of objects in the geologic map data model........................5Figure 1- 2: Diagrammatic representation of the scope of the data model..................................................7
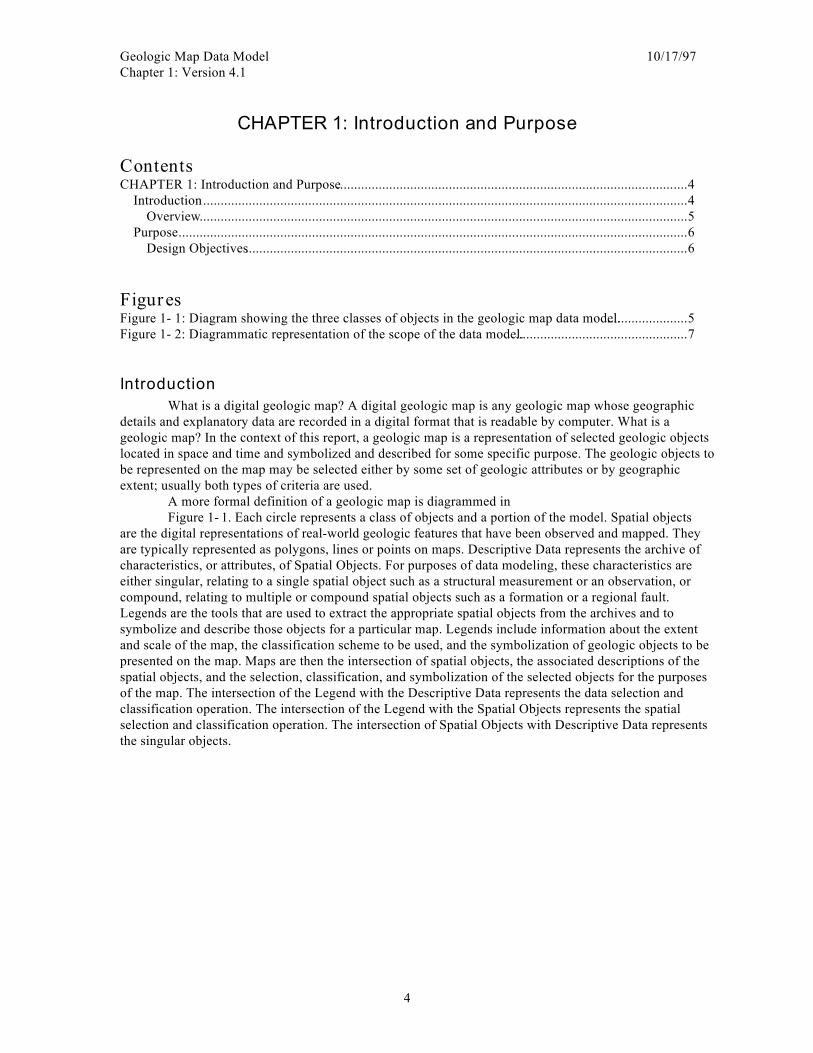
IntroductionWhat is a digital geologic map? A digital geologic map is any geologic map whose geographic
details and explanatory data are recorded in a digital format that is readable by computer. What is ageologic map? In the context of this report, a geologic map is a representation of selected geologic objectslocated in space and time and symbolized and described for some specific purpose. The geologic objects tobe represented on the map may be selected either by some set of geologic attributes or by geographicextent; usually both types of criteria are used.
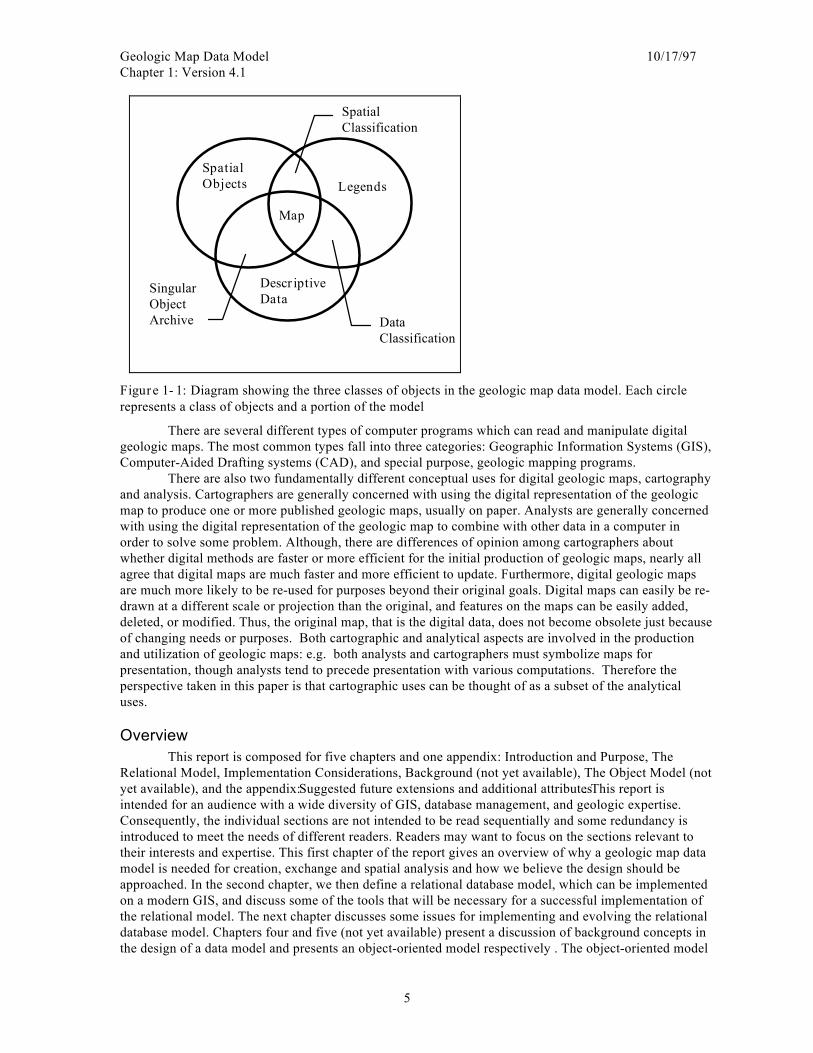
A more formal definition of a geologic map is diagrammed inFigure 1- 1. Each circle represents a class of objects and a portion of the model. Spatial objects
are the digital representations of real-world geologic features that have been observed and mapped. Theyare typically represented as polygons, lines or points on maps. Descriptive Data represents the archive ofcharacteristics, or attributes, of Spatial Objects. For purposes of data modeling, these characteristics areeither singular, relating to a single spatial object such as a structural measurement or an observation, orcompound, relating to multiple or compound spatial objects such as a formation or a regional fault.Legends are the tools that are used to extract the appropriate spatial objects from the archives and tosymbolize and describe those objects for a particular map. Legends include information about the extentand scale of the map, the classification scheme to be used, and the symbolization of geologic objects to bepresented on the map. Maps are then the intersection of spatial objects, the associated descriptions of thespatial objects, and the selection, classification, and symbolization of the selected objects for the purposesof the map. The intersection of the Legend with the Descriptive Data represents the data selection andclassification operation. The intersection of the Legend with the Spatial Objects represents the spatialselection and classification operation. The intersection of Spatial Objects with Descriptive Data representsthe singular objects.
Geologic Map Data Model 10/17/97Chapter 1: Version 4.1
5
Figure 1- 1: Diagram showing the three classes of objects in the geologic map data model. Each circlerepresents a class of objects and a portion of the model.
There are several different types of computer programs which can read and manipulate digitalgeologic maps. The most common types fall into three categories: Geographic Information Systems (GIS),Computer-Aided Drafting systems (CAD), and special purpose, geologic mapping programs.
There are also two fundamentally different conceptual uses for digital geologic maps, cartographyand analysis. Cartographers are generally concerned with using the digital representation of the geologicmap to produce one or more published geologic maps, usually on paper. Analysts are generally concernedwith using the digital representation of the geologic map to combine with other data in a computer inorder to solve some problem. Although, there are differences of opinion among cartographers aboutwhether digital methods are faster or more efficient for the initial production of geologic maps, nearly allagree that digital maps are much faster and more efficient to update. Furthermore, digital geologic mapsare much more likely to be re-used for purposes beyond their original goals. Digital maps can easily be re-drawn at a different scale or projection than the original, and features on the maps can be easily added,deleted, or modified. Thus, the original map, that is the digital data, does not become obsolete just becauseof changing needs or purposes. Both cartographic and analytical aspects are involved in the productionand utilization of geologic maps: e.g. both analysts and cartographers must symbolize maps forpresentation, though analysts tend to precede presentation with various computations. Therefore theperspective taken in this paper is that cartographic uses can be thought of as a subset of the analyticaluses.
OverviewThis report is composed for five chapters and one appendix: Introduction and Purpose, The
Relational Model, Implementation Considerations, Background (not yet available), The Object Model (notyet available), and the appendix: Suggested future extensions and additional attributes. This report isintended for an audience with a wide diversity of GIS, database management, and geologic expertise.Consequently, the individual sections are not intended to be read sequentially and some redundancy isintroduced to meet the needs of different readers. Readers may want to focus on the sections relevant totheir interests and expertise. This first chapter of the report gives an overview of why a geologic map datamodel is needed for creation, exchange and spatial analysis and how we believe the design should beapproached. In the second chapter, we then define a relational database model, which can be implementedon a modern GIS, and discuss some of the tools that will be necessary for a successful implementation ofthe relational model. The next chapter discusses some issues for implementing and evolving the relationaldatabase model. Chapters four and five (not yet available) present a discussion of background concepts inthe design of a data model and presents an object-oriented model respectively . The object-oriented model
SpatialObjects Legends
DescriptiveData
Map
SpatialClassification
DataClassification
SingularObjectArchive
Geologic Map Data Model 10/17/97Chapter 1: Version 4.1
6
cannot be implemented on any current GIS, but is clearly the direction that modern GIS and databasesystems are evolving. The appendix tabulates suggestions for future extensions of the model and suggestshow these extensions could be added.
PurposeThe purpose of a data model for digital geologic maps is to provide a structure for the
organization, storage, and use of geologic map data in a computer. The data model defines formally thegrammar of the geologic maps. This grammar is independent of the vocabulary of geologic maps. To betruly powerful it is necessary to address both the grammar and the vocabulary. The primary objective ofthis effort is to develop a digital data model (formal grammar) for geologic map information. A secondaryobjective is to develop as much of the vocabulary as possible, in the time available and as examples of thevocabulary that might be used. This vocabulary also helps communicate a better understanding of themodel.
The data model is presented in two forms: an entity-relational model for relational databases, andan object model which is more conceptual in nature and future oriented. Both approaches attempt to beindependent of any specific software/hardware configuration. Because technology is rapidly evolving, weare attempting to be forward looking in developing a conceptual data model using Object-Orientednotation. Some aspects of this conceptual model cannot be easily implemented in common relationaldatabase based GIS software. The entity-relation model is a translation of the more general conceptualmodel into a general relational database format which can be more easily implemented in current databasesoftware. The relational model is the stepping off point for implementing the data model in a GIS such asArc/Info or Arcview. We intend to implement this model in Arc/Info and ArcView 3/Microsoft Access.The majority of the state geological surveys and the USGS National Cooperative Geologic MappingProgram plan to use the model in Arc/Info. Therefore, we feel it is incumbent upon us to implement themodel in this GIS and to develop some first generation tools in Arc/Info to facilitate data entry, display,and use of geologic maps in this GIS. We will first present the relational model as the more specific andmore familiar form. Then the conceptual model that provides the most general foundation of the datamodel will be presented.
Design ObjectivesA number of design criteria have been identified that guide the development of the data model.
Those criteria are the following:• The data model should be easy to implement and place minimal requirements on the person or
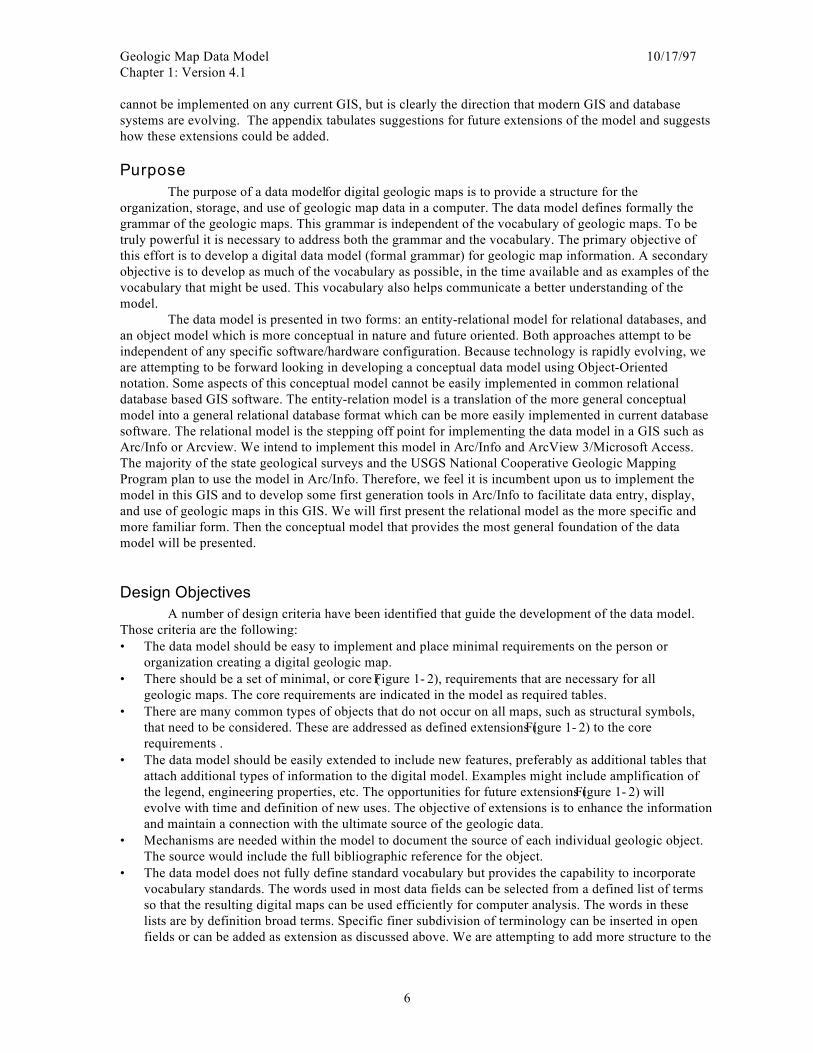
organization creating a digital geologic map.• There should be a set of minimal, or core (Figure 1- 2), requirements that are necessary for all
geologic maps. The core requirements are indicated in the model as required tables.• There are many common types of objects that do not occur on all maps, such as structural symbols,
that need to be considered. These are addressed as defined extensions (Figure 1- 2) to the corerequirements .
• The data model should be easily extended to include new features, preferably as additional tables thatattach additional types of information to the digital model. Examples might include amplification ofthe legend, engineering properties, etc. The opportunities for future extensions (Figure 1- 2) willevolve with time and definition of new uses. The objective of extensions is to enhance the informationand maintain a connection with the ultimate source of the geologic data.
• Mechanisms are needed within the model to document the source of each individual geologic object.The source would include the full bibliographic reference for the object.
• The data model does not fully define standard vocabulary but provides the capability to incorporatevocabulary standards. The words used in most data fields can be selected from a defined list of termsso that the resulting digital maps can be used efficiently for computer analysis. The words in theselists are by definition broad terms. Specific finer subdivision of terminology can be inserted in openfields or can be added as extension as discussed above. We are attempting to add more structure to the
Geologic Map Data Model 10/17/97Chapter 1: Version 4.1
7
communication of information to minimize ambiguity.• The model should avoid explicit use of code dictionaries for translation of geologic vocabulary. The
use of codes where needed, however, can be facilitated through software tools.• Geologic maps have, as a fundamental characteristic, attributes of geologic objects that are
interrelated. Thus a fault may separate two polygons and continue internally into a third polygon.Spatial attributes of such lines need to be stored with the polygon data in order to do structuralanalyses, for example, to select individual polygons on the upper plate of a thrust.
• A mechanism for identifying individual geologic occurrences should be included. This mechanismprovides for uses such as outcrop mapping, describing the lithology of a specific polygon within alarger map unit, or a specific segment of a fault.
Defined Extensions
Future Extensions
Core
Figure 1- 2: Diagrammatic representation of the scope of the data model. The Core is the required minimumthat is common to all geologic maps. The Defined Extensions are things that are common to many maps andare used as needed. Future extensions includes things that are complex or unusual, but have to be considered sothe model can be extended. These Future Extensions may then become part of the Core or Defined Extensions.
Core• Polygon, line, and point attributes• Map Legend• Symbolization
Defined Extensions• Structural measurements, such as
strike and dip.• Individual polygon and line
attributes• Overlay polygons• Other lines
Future Extensions• Cross sections• Engineering properties• Relation of topographic base for
such things as 3-point problems.• Field data
Geologic Map Data Model DRAFT - DRAFT - DRAFT 10/16/97Chapter 2: version 4.1
8
CHAPTER 2 : The Relational Model
ContentsCHAPTER 2 : The Relational Model............................................................................................................... 8
Contents........................................................................................................................................................ 8Figures.......................................................................................................................................................... 9Tables........................................................................................................................................................... 9Geologic Maps ........................................................................................................................................... 11Digital Geologic Map Consistency............................................................................................................. 11Fundamentals of the Model......................................................................................................................... 12
General Relational Database Considerations ......................................................................................... 17The Relational Geologic Map Data Model................................................................................................. 18
Typing Conventions................................................................................................................................ 18Metadata, Legend and Related Tables .................................................................................................... 23
Metadata............................................................................................................................................. 23Legend................................................................................................................................................ 24Legend Correlation Tables ................................................................................................................. 25
Spatial Object Archive ........................................................................................................................... 25Spatial Object Archive Correlation Tables........................................................................................ 26
Singular Object Archive ......................................................................................................................... 26Compound Object Archive ..................................................................................................................... 27
Rock Units.......................................................................................................................................... 29Structural Features.............................................................................................................................. 31Metamorphic Overlay Units................................................................................................................ 31
Tools........................................................................................................................................................... 32Descriptions of Individual Tables .............................................................................................................. 32
Metadata and Related Tables.................................................................................................................. 32Map Table .......................................................................................................................................... 32Source Table ...................................................................................................................................... 33Map/Source Correlation Table........................................................................................................... 34Classification Scheme Table .............................................................................................................. 34Classification Name Table ................................................................................................................. 35
Legend and Related Tables..................................................................................................................... 35Classification Object Table................................................................................................................ 35Cartographic Object Table ................................................................................................................. 36Area Symbol Table............................................................................................................................. 37Line Symbol Table ............................................................................................................................. 37Point Symbol Table ............................................................................................................................ 37Color Table ........................................................................................................................................ 38Data Classification Table................................................................................................................... 38
Spatial Object Archive and Related Tables............................................................................................ 39Geology Polygons Table: An Example GIS Polygon Coverage.......................................................... 39Geology Lines: An Example GIS Line Coverage................................................................................ 39Miscellaneous Lines: An Example GIS Line Coverage...................................................................... 40Points: An Example GIS Point Coverage............................................................................................ 40Spatial Classification Table ............................................................................................................... 40
Singular Object Archive Tables ............................................................................................................. 41Spatial Object Name Table ................................................................................................................ 41Spatial Object Composition Table ..................................................................................................... 41Structural Detail Table ....................................................................................................................... 42Fossil Detail Table............................................................................................................................. 43
Compound Object Archive and Related Tables...................................................................................... 43Compound Object Archive (COA) Table........................................................................................... 44
Geologic Map Data Model 10/16/97Chapter 2: version 4.1
9
Formal Unit Table .............................................................................................................................. 44COA Relation Table........................................................................................................................... 45COA Tree Table................................................................................................................................. 46
Rock Units and Related Tables............................................................................................................... 46Rock Unit Table.................................................................................................................................. 46Rock Unit Rank Table......................................................................................................................... 47Rock Composition Table.................................................................................................................... 48Lithology Table.................................................................................................................................. 49Lithology Tree Table.......................................................................................................................... 58Radiometric Age Table ...................................................................................................................... 58Stratigraphic Age Table...................................................................................................................... 59Stratigraphic Time Scale Table.......................................................................................................... 59Stratigraphic Tree Table..................................................................................................................... 63Stratigraphic Rank Table.................................................................................................................... 64
Structural Correlation Table................................................................................................................... 65Structural Type Table......................................................................................................................... 65
Metamorphic Overlay Table................................................................................................................... 67References Cited......................................................................................................................................... 69
Appendix A: A Common GIS Data Model...................................................................................................... 70Appendix B: Hierarchical Coding Schemes ................................................................................................... 72Appendix C: Implementation Issues................................................................................................................ 74
Point features .............................................................................................................................................. 74Linear features ............................................................................................................................................ 74Polygonal features....................................................................................................................................... 74
FiguresFigure 2-1. Fundamentals of the relational geologic map data model. .......................................................................... 13Figure 2-2. Geometric shapes of geologic objects. ....................................................................................................... 14Figure 2-3. Two categories of geologic objects............................................................................................................ 15Figure 2-4. Generalized diagram of the relational geologic map data model. ............................................................... 16Figure 2-5. Diagram of relational notation used for entities (tables) and relations between entities............................. 17Figure 2-6. Legend and Metadata portions of the relational model. .............................................................................. 19Figure 2-7. Singular Object Archive and the Spatial Object Archive (GIS) portions of the model............................... 20Figure 2-8. Compound Object Archive portion of the data model................................................................................. 21Figure 2-9. Rock Unit and related tables portion of the Compound Object Archive. .................................................... 22Figure 2-10. Standard look-up tables which are used with the Compound Object Archive. ......................................... 23Figure 2-11. The implementation in a GIS of a typical digital geologic map model. .................................................... 70
TablesTable 2-1: Definition of the attributes in the Map Table............................................................................................... 33Table 2-2: Definition of the attributes in the Source Table. .......................................................................................... 34Table 2-3: Definition of the attributes in the Map/Source Correlation Table................................................................ 34Table 2-4: Definition of the attributes in the Classification Scheme Table................................................................... 35Table 2-5: Definition of the attributes in the Classification Name Table...................................................................... 35Table 2-6: Definition of the attributes in the Classification Object Table..................................................................... 36Table 2-7: Examples of words that could be used for the class_type attibute in the Classification Object Table. ....... 36Table 2-8: Definition of the attributes in the Cartographic Object Table...................................................................... 37Table 2-9: Definition of the attributes in the Area Symbol Table. ................................................................................ 37Table 2-10: Definition of the attributes in the Line Symbol Table. ............................................................................... 37Table 2-11: Definition of the attributes in the Point Symbol Table............................................................................... 38Table 2-12: Definition of the attributes in the Color Table........................................................................................... 38Table 2-13: Definition of the attributes in the Data Classification Table...................................................................... 39
Geologic Map Data Model 10/16/97Chapter 2: version 4.1
10
Table 2-14: Definition of the attributes in the Geology Polygons Table. ...................................................................... 39Table 2-15: Definition of the attributes in the Geology Lines Table. ............................................................................ 40Table 2-16: Definition of the attributes in the Miscellaneous Lines Table.................................................................... 40Table 2-17: Definition of the attributes in the Points Table. ......................................................................................... 40Table 2-18: Definition of the attributes in the Spatial Classification Table.................................................................. 41Table 2-19: Definition of the attributes in the Spatial Object Name Table. .................................................................. 41Table 2-20: Definition of the attributes in the Spatial Object Composition Table. ....................................................... 42Table 2-21: Definition of the attributes in the Structural Detail Table.......................................................................... 43Table 2-22: Definition of the attributes in the Fossil Detail Table................................................................................ 43Table 2-23: Definition of the attributes in the COA Table............................................................................................ 44Table 2-24: Word list for the coa_type attribute in the COA Table.............................................................................. 44Table 2-25: Definition of the attributes in the Formal Unit Table. ................................................................................ 45Table 2-26: Definition of the attributes in the COA Relation Table.............................................................................. 45Table 2-27: Example word list for the relation attribute in the COA Relation Table. .................................................. 46Table 2-28: Definition of the attributes in the COA Tree Table.................................................................................... 46Table 2-29: Definition of the attributes in the Rock Unit Table. ................................................................................... 47Table 2-30: Example word list for the rock_rank attribute in the Rock Unit Table...................................................... 47Table 2-31: Definition of the attributes in the Rock Unit Rank Table. .......................................................................... 47Table 2-32: Examples of the rock_rank and rock_level# values for the Rock Unit Rank Table. ................................. 48Table 2-33: Definition of the attributes in the Rock Composition Table....................................................................... 49Table 2-34: Definition of the attributes in the Lithology Table. .................................................................................... 49Table 2-35: Sample hierarchical classification for the lith_class attribute in the Lithology Table............................... 50Table 2-36: Definition of the attributes in the Lithology Tree Table............................................................................. 58Table 2-37: Example of the data in the Lithology Tree Table....................................................................................... 58Table 2-38: Definition of the attributes in the Radiometric Age Table. ........................................................................ 59Table 2-39: Definition of the attributes in the Stratigraphic Age Table. ....................................................................... 59Table 2-40: Definition of the attributes in the Stratigraphic Time Scale Table............................................................. 60Table 2-41: Sample entries in the Stratigraphic Age Table. ......................................................................................... 60Table 2-42: Definition of the attributes in the Stratigraphic Tree Table. ...................................................................... 64Table 2-43: Example of the data in the Stratigraphic Tree Table.................................................................................. 64Table 2-44: Definition of the attributes in the Stratigraphic Rank Table....................................................................... 64Table 2-45: Values for strat_level in the Stratigraphic Rank Table.............................................................................. 65Table 2-46: Definition of the attributes in the Structural Correlation Table.................................................................. 65Table 2-47: Definition of the attributes in the Structural Type Table............................................................................ 66Table 2-48: A sample of proposed values for the attributes in the Structural Type Table. ........................................... 67Table 2-49: Definition of the attributes in the Metamorphic Overlay Table. ................................................................ 68
Geologic Map Data Model 10/16/97Chapter 2: version 4.1
11
Geologic MapsGeologic maps can be extremely complex with many different types of information displayed. Most geologic
maps include a background of polygonal areas which represent geologic units or materials which cover the geologicunits such as water, ice, etc. The lines which separate the polygons also have significance where they representdiffering types of geological boundaries such as contacts. Overlaying this background, there are usually numerouslinear features such as faults, folds, dikes, veins, etc. and several different types of point features such a structuralsymbols and sample location symbols.
Additional complexity is introduced by the lack of universal standards for the symbolization of geologicmaps. Although some general colors are often used for the same general types of rock units, there is no standard incommon use for assigning a particular rock unit the same color or pattern on all maps. The same is true to a lesserdegree for line patterns and point symbols. Although there are standard patterns for the common types of faults, apattern which represents a dike on one map may be used to represent an unusual type of fault or a vein on an adjacentmap. On two-dimensional geologic maps, geologic features can be geometrically represented as points, lines, orpolygons. It is these features, in all of their complexity, that must be included in a digital geologic map data model.
Digital Geologic Map ConsistencyConsistency from one map to the next is not a primary concern when users are focused on local problems or
when using digital geologic maps only for cartographic purposes. It’s certainly better if adjacent maps use similarstyles to depict similar features, but users are adept at compensating for differing map styles across map boundaries.As geologic maps are used for larger, regional studies, consistency of data representation becomes more important.Often it’s much easier to accomplish regional modeling or synthesis programs if the geologic maps are in a digitalformat. When combining digital geologic maps to create regional data sets, there are three levels of consistency whichmust be considered.
The first level is the consistency of the original mapping. Were the maps to be combined created for the samepurpose? Do they use the same (or at least similar) units? Many kinds of geologic inconsistencies can be ignored. Forexample, one map may show all Tertiary volcanic rocks as a single unit while the adjacent map splits the Tertiaryvolcanic rocks into several units. As long as the two maps are in reasonable agreement on what constitutes a Tertiaryvolcanic rock, the maps can be successfully combined. There would certainly be more detail on one portion of thecombined map than on the rest, but if that level of detail was not important to subsequent users, the combined mapwould be entirely satisfactory.
If, however, the two adjacent maps had been originally created for different purposes, the combinationbecomes more difficult and less useful. As an extreme example, suppose one of the two adjacent maps had beencreated to depict bedrock geology only, and the other had been created specifically to depict surficial deposits. In thiscase, there might be little, if any overlap in the units depicted and not much point in attempting to combine the maps.Consideration of this first type of geologic consistency becomes important for creating regional digital data archivescomposed of many individual maps. If maps which were originally created for several different purposes are to bearchived, they should be kept in separate archives or in separate data layers within a single archive.
The second level of consistency that is required for successfully combining adjacent maps into regional datalayers is consistency of descriptive information. This level assumes geologic consistency is sufficient to makecombining the maps a reasonable task. Before the maps can be combined, the descriptive information (attributes)assigned to each feature on each map must be made consistent. If one map includes a polygon attribute for age of rockunit and an adjacent map does not, the maps can be combined, but the results of any attempt to analyze areas by age ofrock unit will be misleading. In this case, the rock unit age information should be added where it is missing.
A more usual occurrence, however, is two adjacent maps which both contain age information, but theinformation is formatted differently. One map may have a single attribute for stratigraphic age for each polygonrepresenting the “best” or central age of the unit. The single attribute for each polygon in the digital map might have acode representing the time-stratigraphic unit during which the unit was deposited. An adjacent map might have twoattributes to represent stratigraphic age, a minimum age and a maximum age. Each attribute would still contain a time-stratigraphic unit, but they would represent the extremes of the formation of the unit as opposed to the central age. Athird map in the region might also have two attributes for stratigraphic age, but the attributes might contain radiometric
Geologic Map Data Model 10/16/97Chapter 2: version 4.1
12
ages for the minimum and maximum age of formation of the unit. Although each of these techniques of attributingstratigraphic age might be useful for a single map, it’s clear that a great deal of work would be required to combine allof these maps into a regional synthesis with consistent age attributes. The answer to this dilemma, of course, is tocreate the digital maps with a consistent set of attributes from the beginning. That is one of the goals of creating aconsistent data model.
A third level of consistency that is required for successfully combining digital geologic maps is consistencyof coding. It’s often more convenient and less storage intensive to substitute codes for descriptive attributes. Tocontinue the example of stratigraphic age attributes, time-stratigraphic units could be entered in the database ascomplete words (Mississippian, Paleozoic, etc.), as shortened abbreviations (M, Pz, etc.), or as numeric codes (1, 10,etc.). If the user of the final regional geologic map wanted to find all areas of Mississippian rocks, it would be easierto search for one of the representations than to have to search for all three. Fortunately, as long as the representationused for each map is internally consistent and all of the maps meet the requirements of the first two levels ofconsistency, it is usually an easy task to automate the process of converting all attributes to a common representation.
Independent of the consistency required for combining digital maps into regional data sets, another aspectwhich must be considered is consistency over time. If the digital maps are going to achieve their maximum usefulness,long-term consistency of the underlying data model is important. Careful thought must be given at the beginning of alllarge-scale attempts to create regional, digital geologic maps to the expected (and unexpected) uses of the maps in thefuture. Because it is difficult, if not impossible, to foresee how the data will be used in the future, flexibility becomesa primary requirement of all data models. To increase flexibility, all data models should be open-ended so that it isalways possible to respond to needs for new types of information to be attached to each feature.
As well as consistency through time, digital map designers should also consider consistency across aspectrum of users. Usually, when the decision is made to acquire digital geology, there is a specific goal that is drivingthe acquisition. The specific goal may not require a complete set of attributes for each map. It is certainly lessexpensive initially to collect just the information needed for the immediate goal. However, it is usually moreexpensive to collect additional data at a later time than to collect the additional data initially. The designer of the datacollection scheme should carefully consider other possible uses of the information both within and outside of thecollecting organization.
Fundamentals of the ModelThe goal of this relational geologic map data model is to build, in the digital world, the equivalent to a
geologic map library, or warehouse. From a well indexed library of paper geologic maps, one could retrieve variousmaps from a specified geographic area. If the library were well staffed with eager assistants, one could also generatecomposite regional geologic maps by trimming and pasting existing maps into larger sheets. If the existing maps wereoriginally created at different scales, it would take an extraordinary staff of assistants to perform this task. However,the shift to digital geologic maps alleviates this process, as it allows one to more readily generate composite mapsfrom existing maps created at different scales and projections. It also allows one to create derivative maps at theindividual map feature level instead of at the entire map level. For instance, with digital maps, one can selectindividual units to display, create new units by re-combining original map units, create units based on other features ofthe existing units such as lithology, etc. Once the existing mapping is stored in the digital library, only the imaginationlimits further uses of the data.

Geologic Map Data Model 10/16/97Chapter 2: version 4.1
13
Geologic Object
(Data Archive)
Legend
Map
Geologic Object
(Real World)
Figure 2-1. Fundamentals of the relational geologic map data model.The core of the data model is an archive of digital geologic objects from which one can create geologic maps.The archive consists of a database of geologic features, including areas of particular rock type, structures, datasites, etc. The archive may include a geographic description of each entity as well as its attribute (descriptive)information and a source reference. The map legend filters the archive for specific geologic objects andsymbolizes them for depiction on the map. To create a map from existing data, a new legend is defined and thenapplied to the archive.
The core of the relational geologic map data model is an archive of digital geologic objects from which onecan create geologic maps (figure 2-1). Although the model is designed to be easily extended to include three-dimensional objects, the data model presented here is confined to two-dimensional objects. These objects are two-dimensional representations of three-dimensional geologic objects which are themselves interpretations of the realworld. The digital archive consists of a database representing occurrences of geologic features such as areas ofparticular rock types, structures, field sites, etc. The archive may include a geographic description of each feature aswell as its attribute (descriptive) information and a source reference. The geologic objects in the archive may comefrom many different sources, including published maps as well as new, unpublished mapping.
The digital archive of geologic features is connected to a geologic map legend facility (figure 2-1). Thislegend facility can be viewed as a filter which selects specific geologic features from the archive and symbolizes themfor presentation on a map. Thus, the process of creating a new, or derivative, map from existing data within thearchive, becomes a natural process of defining the new map’s legend and then applying it to the archive.
In summary, real world geology is interpreted by the geologist and those interpretations are recorded on maps(or photos) as geographic objects (points, lines, areas, etc.) with descriptive information. The geographicrepresentations of the geologic objects as well as the descriptive information are then stored in the archive. To createa map from the archive, a user formalizes the desired content and symbolization of the map by defining a map legend.The map legend is then applied to the archive to generate the new map or retrieve a previous map.
Geologic Map Data Model 10/16/97Chapter 2: version 4.1
14
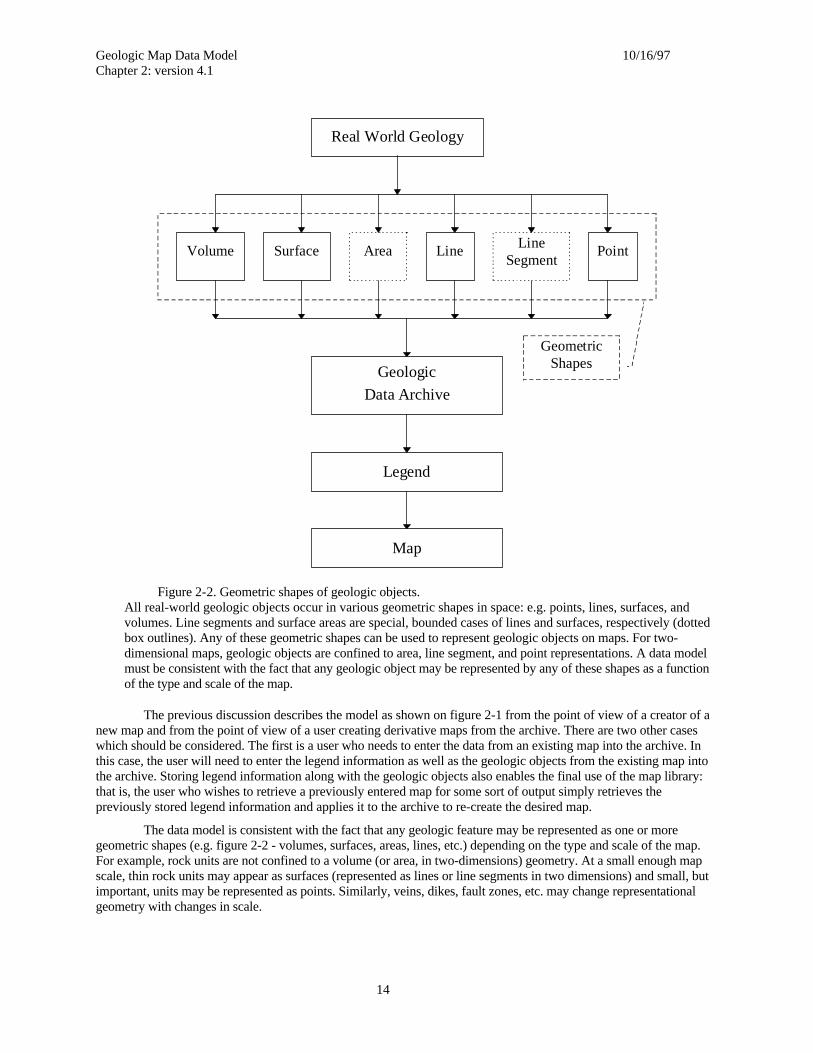
All real-world geologic objects occur in various geometric shapes in space: e.g. points, lines, surfaces, andvolumes. Line segments and surface areas are special, bounded cases of lines and surfaces, respectively (dottedbox outlines). Any of these geometric shapes can be used to represent geologic objects on maps. For two-dimensional maps, geologic objects are confined to area, line segment, and point representations. A data modelmust be consistent with the fact that any geologic object may be represented by any of these shapes as a functionof the type and scale of the map.
The previous discussion describes the model as shown on figure 2-1 from the point of view of a creator of anew map and from the point of view of a user creating derivative maps from the archive. There are two other caseswhich should be considered. The first is a user who needs to enter the data from an existing map into the archive. Inthis case, the user will need to enter the legend information as well as the geologic objects from the existing map intothe archive. Storing legend information along with the geologic objects also enables the final use of the map library:that is, the user who wishes to retrieve a previously entered map for some sort of output simply retrieves thepreviously stored legend information and applies it to the archive to re-create the desired map.
The data model is consistent with the fact that any geologic feature may be represented as one or moregeometric shapes (e.g. figure 2-2 - volumes, surfaces, areas, lines, etc.) depending on the type and scale of the map.For example, rock units are not confined to a volume (or area, in two-dimensions) geometry. At a small enough mapscale, thin rock units may appear as surfaces (represented as lines or line segments in two dimensions) and small, butimportant, units may be represented as points. Similarly, veins, dikes, fault zones, etc. may change representationalgeometry with changes in scale.
Real World Geology
Geologic
Data Archive
Legend
Map
Volume Line PointArea LineSegment
Surface
GeometricShapes
Figure 2-2. Geometric shapes of geologic objects.
Geologic Map Data Model 10/16/97Chapter 2: version 4.1
15
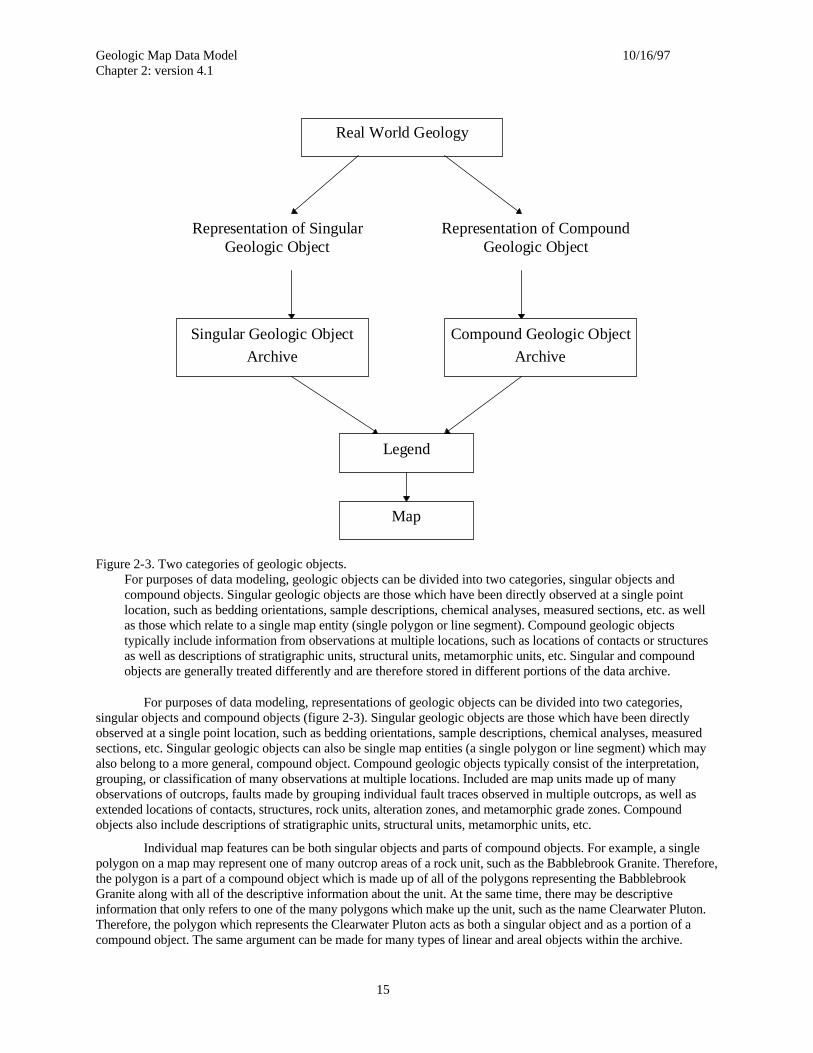
Figure 2-3. Two categories of geologic objects.For purposes of data modeling, geologic objects can be divided into two categories, singular objects andcompound objects. Singular geologic objects are those which have been directly observed at a single pointlocation, such as bedding orientations, sample descriptions, chemical analyses, measured sections, etc. as wellas those which relate to a single map entity (single polygon or line segment). Compound geologic objectstypically include information from observations at multiple locations, such as locations of contacts or structuresas well as descriptions of stratigraphic units, structural units, metamorphic units, etc. Singular and compoundobjects are generally treated differently and are therefore stored in different portions of the data archive.
For purposes of data modeling, representations of geologic objects can be divided into two categories,singular objects and compound objects (figure 2-3). Singular geologic objects are those which have been directlyobserved at a single point location, such as bedding orientations, sample descriptions, chemical analyses, measuredsections, etc. Singular geologic objects can also be single map entities (a single polygon or line segment) which mayalso belong to a more general, compound object. Compound geologic objects typically consist of the interpretation,grouping, or classification of many observations at multiple locations. Included are map units made up of manyobservations of outcrops, faults made by grouping individual fault traces observed in multiple outcrops, as well asextended locations of contacts, structures, rock units, alteration zones, and metamorphic grade zones. Compoundobjects also include descriptions of stratigraphic units, structural units, metamorphic units, etc.
Individual map features can be both singular objects and parts of compound objects. For example, a singlepolygon on a map may represent one of many outcrop areas of a rock unit, such as the Babblebrook Granite. Therefore,the polygon is a part of a compound object which is made up of all of the polygons representing the BabblebrookGranite along with all of the descriptive information about the unit. At the same time, there may be descriptiveinformation that only refers to one of the many polygons which make up the unit, such as the name Clearwater Pluton.Therefore, the polygon which represents the Clearwater Pluton acts as both a singular object and as a portion of acompound object. The same argument can be made for many types of linear and areal objects within the archive.
Representation of SingularGeologic Object
Representation of CompoundGeologic Object
Singular Geologic Object
Archive
Legend
Map
Real World Geology
Compound Geologic Object
Archive
Geologic Map Data Model 10/16/97Chapter 2: version 4.1
16
Singular and compound objects are generally treated differently in the process of creating maps from the archive andare therefore stored in different portions of the data archive.
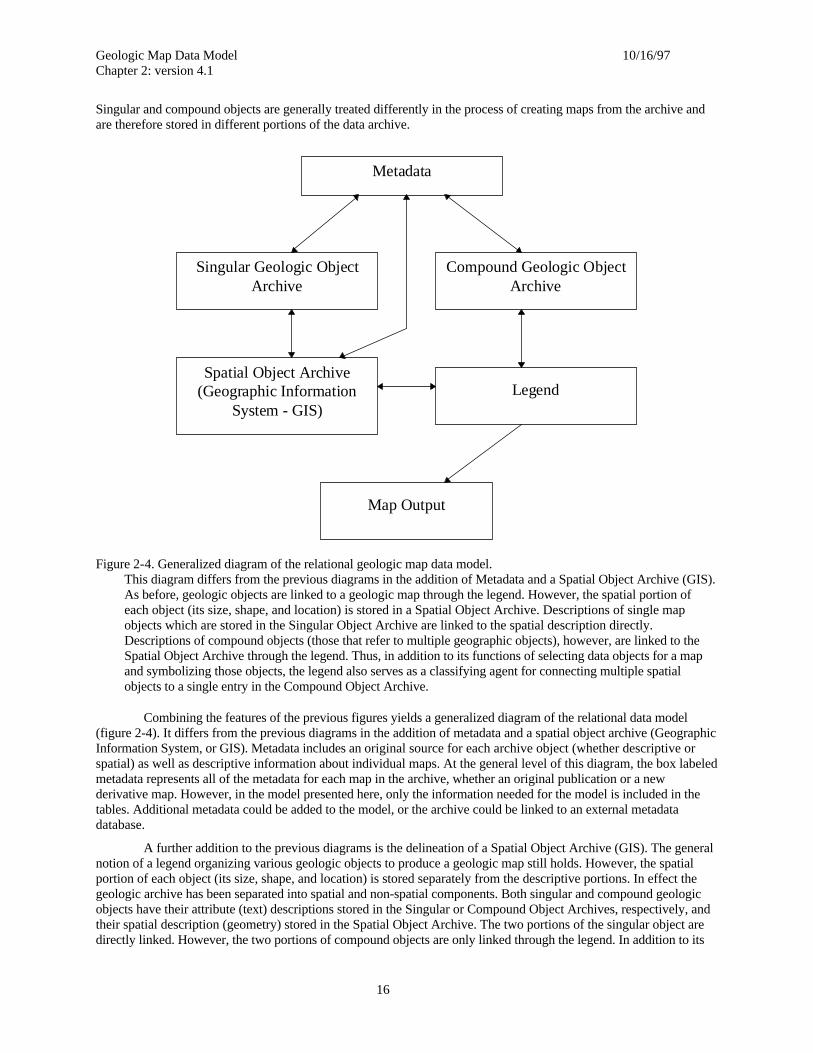
Figure 2-4. Generalized diagram of the relational geologic map data model.This diagram differs from the previous diagrams in the addition of Metadata and a Spatial Object Archive (GIS).As before, geologic objects are linked to a geologic map through the legend. However, the spatial portion ofeach object (its size, shape, and location) is stored in a Spatial Object Archive. Descriptions of single mapobjects which are stored in the Singular Object Archive are linked to the spatial description directly.Descriptions of compound objects (those that refer to multiple geographic objects), however, are linked to theSpatial Object Archive through the legend. Thus, in addition to its functions of selecting data objects for a mapand symbolizing those objects, the legend also serves as a classifying agent for connecting multiple spatialobjects to a single entry in the Compound Object Archive.
Combining the features of the previous figures yields a generalized diagram of the relational data model(figure 2-4). It differs from the previous diagrams in the addition of metadata and a spatial object archive (GeographicInformation System, or GIS). Metadata includes an original source for each archive object (whether descriptive orspatial) as well as descriptive information about individual maps. At the general level of this diagram, the box labeledmetadata represents all of the metadata for each map in the archive, whether an original publication or a newderivative map. However, in the model presented here, only the information needed for the model is included in thetables. Additional metadata could be added to the model, or the archive could be linked to an external metadatadatabase.
A further addition to the previous diagrams is the delineation of a Spatial Object Archive (GIS). The generalnotion of a legend organizing various geologic objects to produce a geologic map still holds. However, the spatialportion of each object (its size, shape, and location) is stored separately from the descriptive portions. In effect thegeologic archive has been separated into spatial and non-spatial components. Both singular and compound geologicobjects have their attribute (text) descriptions stored in the Singular or Compound Object Archives, respectively, andtheir spatial description (geometry) stored in the Spatial Object Archive. The two portions of the singular object aredirectly linked. However, the two portions of compound objects are only linked through the legend. In addition to its
Singular Geologic ObjectArchive
Compound Geologic ObjectArchive
Spatial Object Archive(Geographic Information
System - GIS)
Map Output
Metadata
Legend
Geologic Map Data Model 10/16/97Chapter 2: version 4.1
17
functions of selecting data objects to display on a map and symbolizing those objects, the legend also serves as aclassifying agent for connecting multiple spatial objects in the Spatial Object Archive to a single description in theCompound Object Archive.
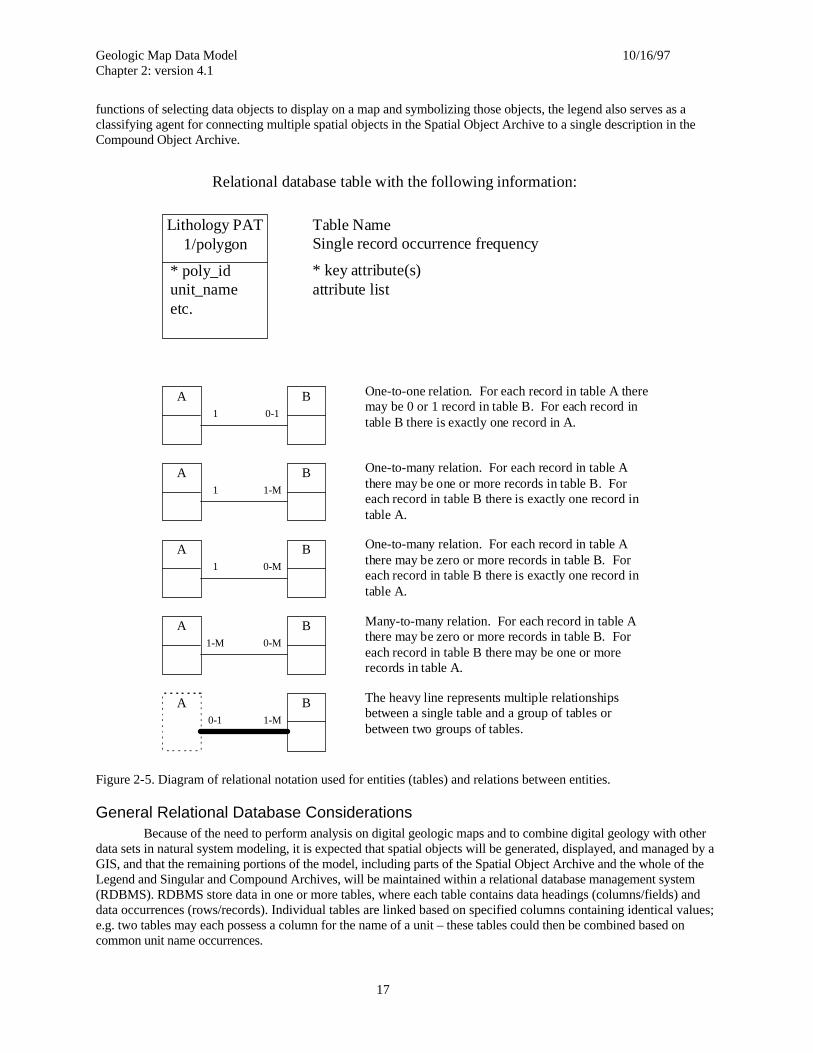
Figure 2-5. Diagram of relational notation used for entities (tables) and relations between entities.
General Relational Database ConsiderationsBecause of the need to perform analysis on digital geologic maps and to combine digital geology with other
data sets in natural system modeling, it is expected that spatial objects will be generated, displayed, and managed by aGIS, and that the remaining portions of the model, including parts of the Spatial Object Archive and the whole of theLegend and Singular and Compound Archives, will be maintained within a relational database management system(RDBMS). RDBMS store data in one or more tables, where each table contains data headings (columns/fields) anddata occurrences (rows/records). Individual tables are linked based on specified columns containing identical values;e.g. two tables may each possess a column for the name of a unit – these tables could then be combined based oncommon unit name occurrences.
Table NameSingle record occurrence frequency
* key attribute(s)attribute list
Lithology PAT1/polygon
* poly_idunit_nameetc.
A0-11
B One-to-one relation. For each record in table A theremay be 0 or 1 record in table B. For each record intable B there is exactly one record in A.
A1-M1
B One-to-many relation. For each record in table Athere may be one or more records in table B. Foreach record in table B there is exactly one record intable A.
A0-M1
B
A0-M1-M
B
One-to-many relation. For each record in table Athere may be zero or more records in table B. Foreach record in table B there is exactly one record intable A.
Many-to-many relation. For each record in table Athere may be zero or more records in table B. Foreach record in table B there may be one or morerecords in table A.
A1-M0-1
B The heavy line represents multiple relationshipsbetween a single table and a group of tables orbetween two groups of tables.
Relational database table with the following information:
Geologic Map Data Model 10/16/97Chapter 2: version 4.1
18
The techniques that are used to design the tables which are linked to the GIS are all variations on the generalrelational model of database design (cf. Wiederhold, 1983). There are numerous mathematical representations andmanipulations which can be pursued to achieve the most efficient database design (normalization processes), but thegoal of each of these systems is to reduce redundancy in the database. The normalization process was used throughoutthe design of the data model to reduce this type of redundancy. In the following sections, the remainder of the datamodel is described as a series of linked tables. These tables implement the strategy outlined in the previous text.
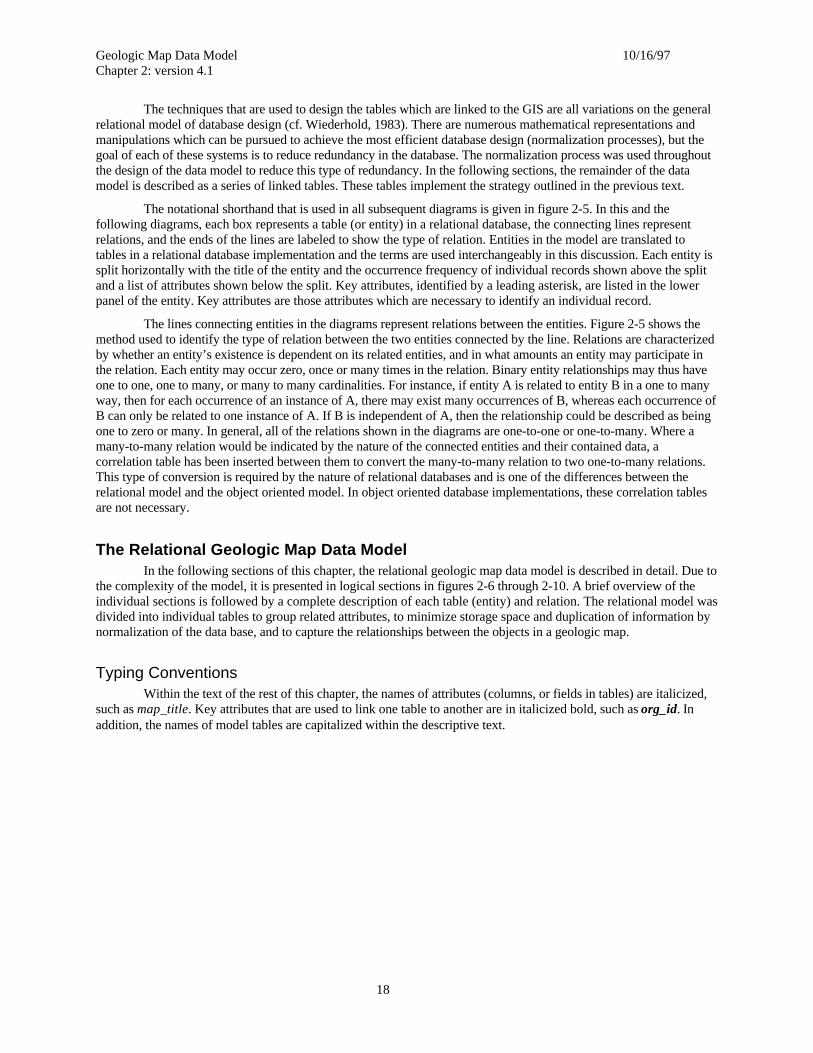
The notational shorthand that is used in all subsequent diagrams is given in figure 2-5. In this and thefollowing diagrams, each box represents a table (or entity) in a relational database, the connecting lines representrelations, and the ends of the lines are labeled to show the type of relation. Entities in the model are translated totables in a relational database implementation and the terms are used interchangeably in this discussion. Each entity issplit horizontally with the title of the entity and the occurrence frequency of individual records shown above the splitand a list of attributes shown below the split. Key attributes, identified by a leading asterisk, are listed in the lowerpanel of the entity. Key attributes are those attributes which are necessary to identify an individual record.
The lines connecting entities in the diagrams represent relations between the entities. Figure 2-5 shows themethod used to identify the type of relation between the two entities connected by the line. Relations are characterizedby whether an entity’s existence is dependent on its related entities, and in what amounts an entity may participate inthe relation. Each entity may occur zero, once or many times in the relation. Binary entity relationships may thus haveone to one, one to many, or many to many cardinalities. For instance, if entity A is related to entity B in a one to manyway, then for each occurrence of an instance of A, there may exist many occurrences of B, whereas each occurrence ofB can only be related to one instance of A. If B is independent of A, then the relationship could be described as beingone to zero or many. In general, all of the relations shown in the diagrams are one-to-one or one-to-many. Where amany-to-many relation would be indicated by the nature of the connected entities and their contained data, acorrelation table has been inserted between them to convert the many-to-many relation to two one-to-many relations.This type of conversion is required by the nature of relational databases and is one of the differences between therelational model and the object oriented model. In object oriented database implementations, these correlation tablesare not necessary.
The Relational Geologic Map Data ModelIn the following sections of this chapter, the relational geologic map data model is described in detail. Due to
the complexity of the model, it is presented in logical sections in figures 2-6 through 2-10. A brief overview of theindividual sections is followed by a complete description of each table (entity) and relation. The relational model wasdivided into individual tables to group related attributes, to minimize storage space and duplication of information bynormalization of the data base, and to capture the relationships between the objects in a geologic map.
Typing ConventionsWithin the text of the rest of this chapter, the names of attributes (columns, or fields in tables) are italicized,
such as map_title. Key attributes that are used to link one table to another are in italicized bold, such as org_id. Inaddition, the names of model tables are capitalized within the descriptive text.
Geologic Map Data Model 10/16/97Chapter 2: version 4.1
19
Metadata, Legend and Related Tables
SpatialClassification
(fig. 2-7,Spatial Object
Archive)
1
0-M
Area Symbol1/symbol
* cart_sym#desc
Line Symbol1/symbol
* cart_sym#desc
Point Symbol1/symbol
* cart_sym#desc
Color1/color
* cart_color#CMYKRGBetc.
0-1Cartographic Object
1/cart. object
* class_obj_idcart_desccart_sym_tablecart_sym#cart_color_tablecart_color#
0-1 0-M
1-M
0-1 0-M
0-M
0-10-M
COA Table(fig. 2-8)
1
Data Classification1/ class subunit
* class _obj_id* coa_idpercentqualitydata_seq#
0-M
0-M
Compound ObjectArchive
Source Table1/source
* source_org* source_idsource _authorsource_datesource _titlesource_refsource _scalesource _resolution
0-M
Map/SourceCorrelation Table
1/correlation
* org_id* map_id* source_org* source_idprecedence
1-M 1
Map Table1/map
* org_id* map_idmap_titlemap_authormap_datemap_descmap_resolutionmap_projectionmap_xmaxmap_xminmap_ymaxmap_ymin
1
ClassificationName Table
1/class
* class_scheme_idclass_namesource_orgsource_id
1-M
0-1
ClassificationScheme Table1/correlation
* org_id* map_id* class_obj_idclass_scheme_idclass_seq#disp_priority
1
1
1
Classification Object
1/class obj.
* class_obj_idclass _typeclass _labelclass _desc
0-M
Metadata
Legend
0-11-M
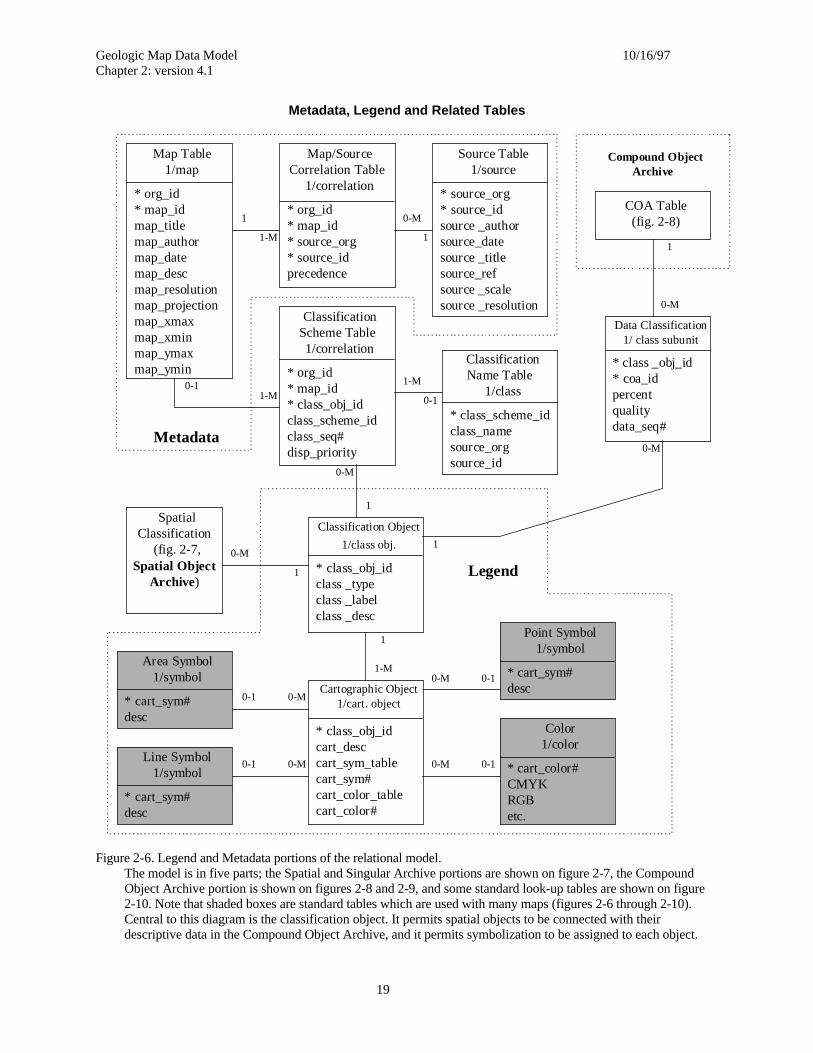
Figure 2-6. Legend and Metadata portions of the relational model.The model is in five parts; the Spatial and Singular Archive portions are shown on figure 2-7, the CompoundObject Archive portion is shown on figures 2-8 and 2-9, and some standard look-up tables are shown on figure2-10. Note that shaded boxes are standard tables which are used with many maps (figures 2-6 through 2-10).Central to this diagram is the classification object. It permits spatial objects to be connected with theirdescriptive data in the Compound Object Archive, and it permits symbolization to be assigned to each object.
Geologic Map Data Model 10/16/97Chapter 2: version 4.1
20
Spatial and Singular Object Archives and Related Tables
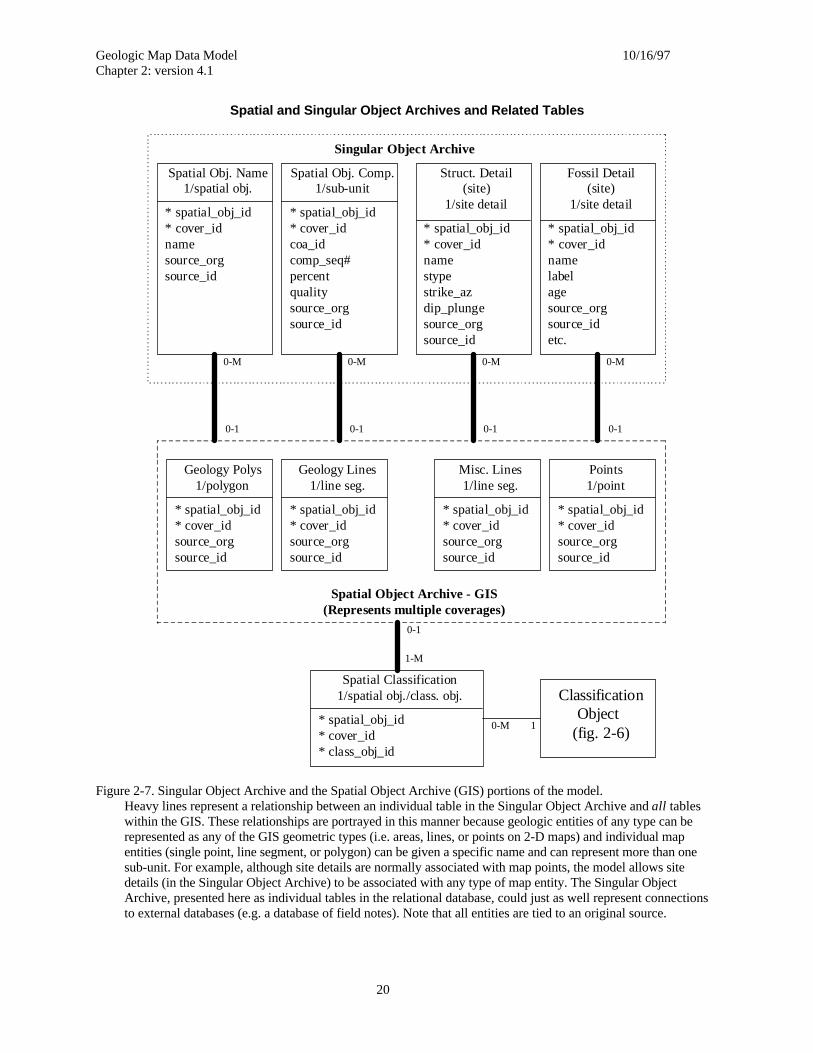
Figure 2-7. Singular Object Archive and the Spatial Object Archive (GIS) portions of the model.Heavy lines represent a relationship between an individual table in the Singular Object Archive and all tableswithin the GIS. These relationships are portrayed in this manner because geologic entities of any type can berepresented as any of the GIS geometric types (i.e. areas, lines, or points on 2-D maps) and individual mapentities (single point, line segment, or polygon) can be given a specific name and can represent more than onesub-unit. For example, although site details are normally associated with map points, the model allows sitedetails (in the Singular Object Archive) to be associated with any type of map entity. The Singular ObjectArchive, presented here as individual tables in the relational database, could just as well represent connectionsto external databases (e.g. a database of field notes). Note that all entities are tied to an original source.
Spatial Obj. Name1/spatial obj.
* spatial_obj_id* cover_idnamesource_orgsource_id
Spatial Obj. Comp.1/sub-unit
* spatial_obj_id* cover_idcoa_idcomp_seq#percentqualitysource_orgsource_id
Struct. Detail(site)
1/site detail
* spatial_obj_id* cover_idnamestypestrike_azdip_plungesource_orgsource_id
Fossil Detail(site)
1/site detail
* spatial_obj_id* cover_idnamelabelagesource_orgsource_idetc.
Singular Object Archive
Geology Polys1/polygon
* spatial_obj_id* cover_idsource_orgsource_id
Geology Lines1/line seg.
* spatial_obj_id* cover_idsource_orgsource_id
Misc. Lines1/line seg.
* spatial_obj_id* cover_idsource_orgsource_id
Points1/point
* spatial_obj_id* cover_idsource_orgsource_id
0-10-10-10-1
0-M0-M0-M0-M
Spatial Object Archive - GIS(Represents multiple coverages)
Spatial Classification1/spatial obj./class. obj.
* spatial_obj_id* cover_id* class_obj_id
ClassificationObject
(fig. 2-6)
0-1
1-M
10-M
Geologic Map Data Model 10/16/97Chapter 2: version 4.1
21
Compound Object Archive and Related Tables
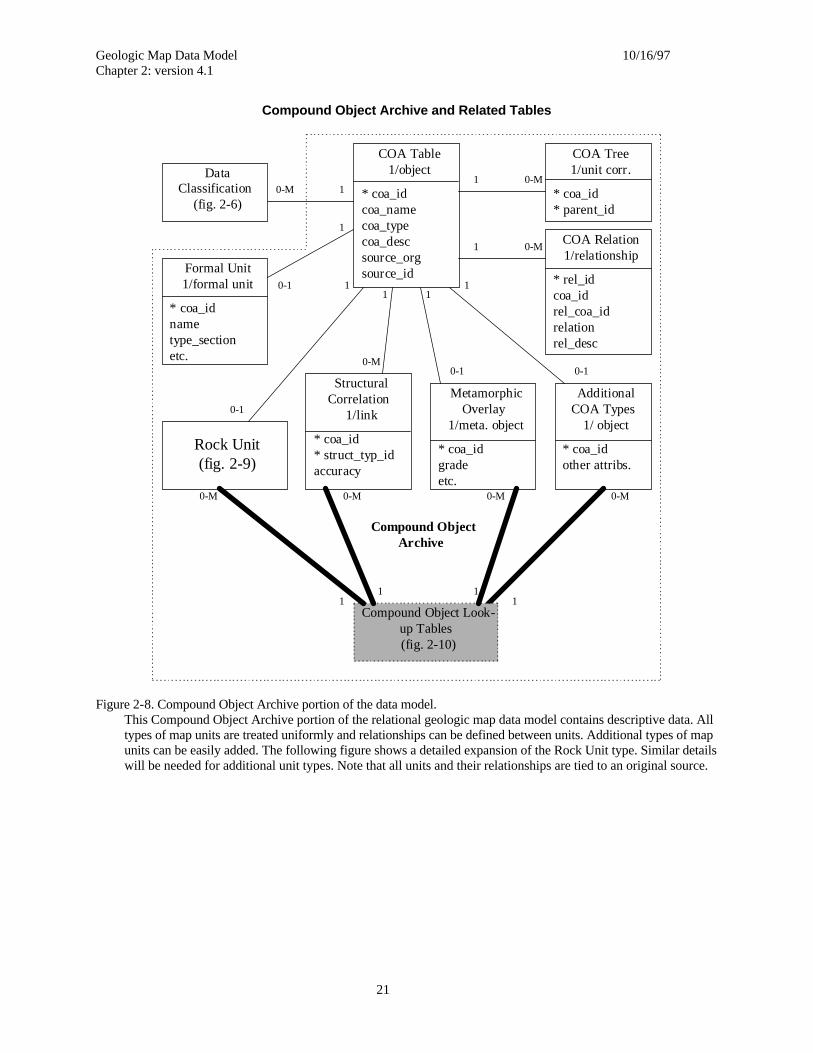
Figure 2-8. Compound Object Archive portion of the data model.This Compound Object Archive portion of the relational geologic map data model contains descriptive data. Alltypes of map units are treated uniformly and relationships can be defined between units. Additional types of mapunits can be easily added. The following figure shows a detailed expansion of the Rock Unit type. Similar detailswill be needed for additional unit types. Note that all units and their relationships are tied to an original source.
Formal Unit1/formal unit
* coa_idnametype_sectionetc.
0-1
MetamorphicOverlay
1/meta. object
* coa_idgradeetc.
0-1
COA Relation1/relationship
* rel_idcoa_idrel_coa_idrelationrel_desc
0-M
DataClassification
(fig. 2-6)0-M
Rock Unit(fig. 2-9)
0-1
StructuralCorrelation
1/link
* coa_id* struct_typ_idaccuracy
0-M
Compound ObjectArchive
Compound Object Look-up Tables(fig. 2-10)
COA Table1/object
* coa_idcoa_namecoa_typecoa_descsource_orgsource_id
1
1
1
11 1
1
AdditionalCOA Types
1/ object
* coa_idother attribs.
0-1
0-M 0-M 0-M 0-M
11 1
1
COA Tree1/unit corr.
* coa_id* parent_id
0-M
1
Geologic Map Data Model 10/16/97Chapter 2: version 4.1
22
Rock Units and Related Tables
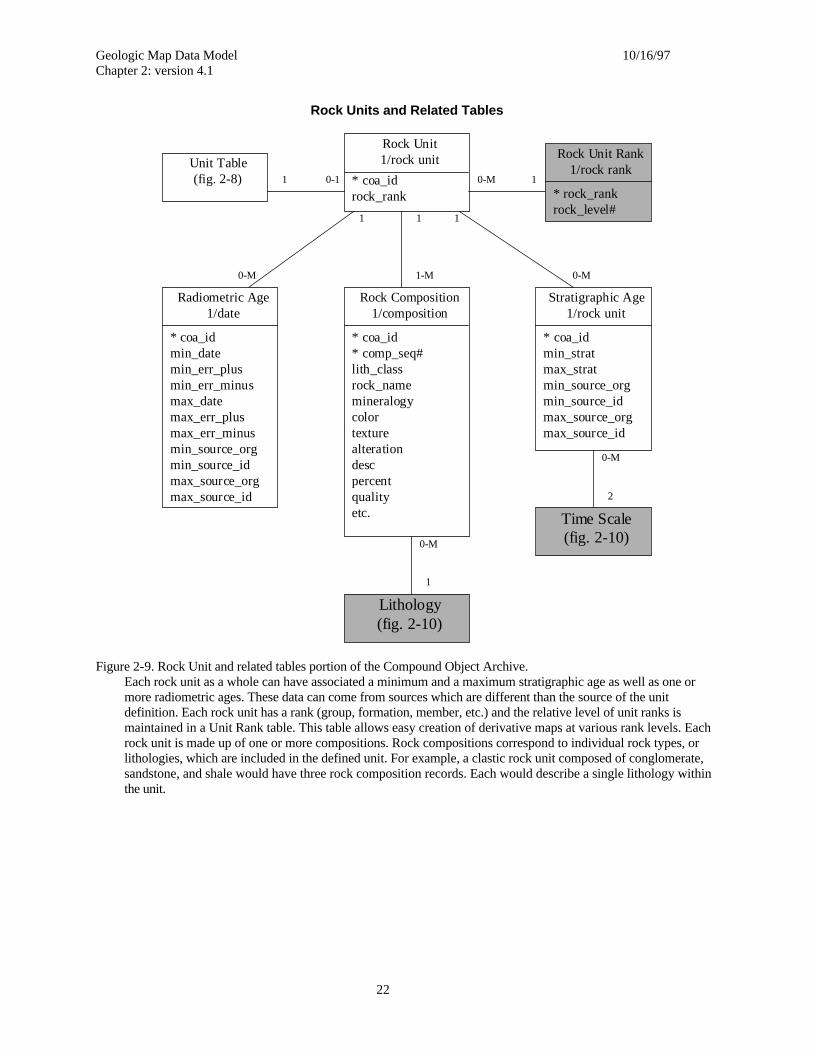
Figure 2-9. Rock Unit and related tables portion of the Compound Object Archive.Each rock unit as a whole can have associated a minimum and a maximum stratigraphic age as well as one ormore radiometric ages. These data can come from sources which are different than the source of the unitdefinition. Each rock unit has a rank (group, formation, member, etc.) and the relative level of unit ranks ismaintained in a Unit Rank table. This table allows easy creation of derivative maps at various rank levels. Eachrock unit is made up of one or more compositions. Rock compositions correspond to individual rock types, orlithologies, which are included in the defined unit. For example, a clastic rock unit composed of conglomerate,sandstone, and shale would have three rock composition records. Each would describe a single lithology withinthe unit.
Unit Table(fig. 2-8)
Rock Unit1/rock unit
* coa_idrock_rank
0-1
1
Rock Composition1/composition
* coa_id* comp_seq#lith_classrock_namemineralogycolortexturealterationdescpercentqualityetc.
1-M0-M
1
Rock Unit Rank1/rock rank
* rock_rankrock_level#
Stratigraphic Age1/rock unit
* coa_idmin_stratmax_stratmin_source_orgmin_source_idmax_source_orgmax_source_id
0-M
1 1
0-M
Time Scale(fig. 2-10)
2
Lithology(fig. 2-10)
1
0-M
Radiometric Age1/date
* coa_idmin_datemin_err_plusmin_err_minusmax_datemax_err_plusmax_err_minusmin_source_orgmin_source_idmax_source_orgmax_source_id
10-M
Geologic Map Data Model 10/16/97Chapter 2: version 4.1
23
Compound Object Archive Look-up Tables
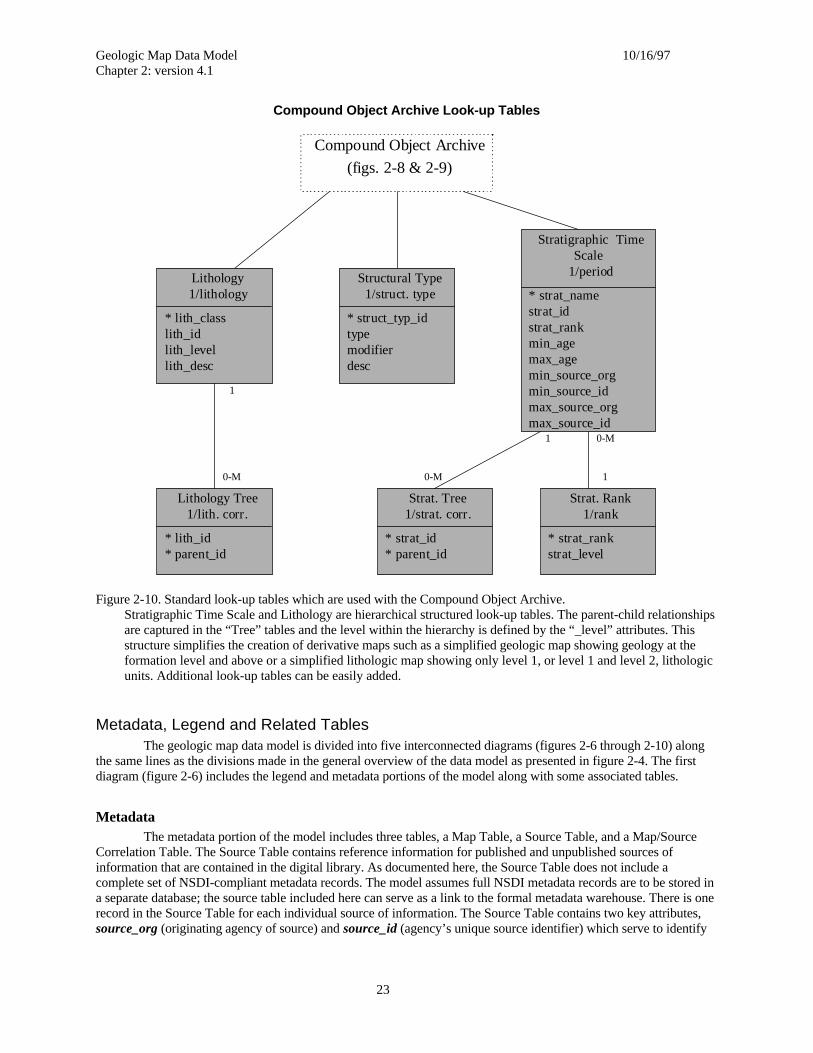
Figure 2-10. Standard look-up tables which are used with the Compound Object Archive.Stratigraphic Time Scale and Lithology are hierarchical structured look-up tables. The parent-child relationshipsare captured in the “Tree” tables and the level within the hierarchy is defined by the “_level” attributes. Thisstructure simplifies the creation of derivative maps such as a simplified geologic map showing geology at theformation level and above or a simplified lithologic map showing only level 1, or level 1 and level 2, lithologicunits. Additional look-up tables can be easily added.
Metadata, Legend and Related TablesThe geologic map data model is divided into five interconnected diagrams (figures 2-6 through 2-10) along
the same lines as the divisions made in the general overview of the data model as presented in figure 2-4. The firstdiagram (figure 2-6) includes the legend and metadata portions of the model along with some associated tables.
MetadataThe metadata portion of the model includes three tables, a Map Table, a Source Table, and a Map/Source
Correlation Table. The Source Table contains reference information for published and unpublished sources ofinformation that are contained in the digital library. As documented here, the Source Table does not include acomplete set of NSDI-compliant metadata records. The model assumes full NSDI metadata records are to be stored ina separate database; the source table included here can serve as a link to the formal metadata warehouse. There is onerecord in the Source Table for each individual source of information. The Source Table contains two key attributes,source_org (originating agency of source) and source_id (agency’s unique source identifier) which serve to identify
Structural Type1/struct. type
* struct_typ_idtypemodifierdesc
Stratigraphic TimeScale
1/period
* strat_namestrat_idstrat_rankmin_agemax_agemin_source_orgmin_source_idmax_source_orgmax_source_id
Compound Object Archive
(figs. 2-8 & 2-9)
Lithology1/lithology
* lith_classlith_idlith_levellith_desc
1
0-M
Lithology Tree1/lith. corr.
* lith_id* parent_id
Strat. Rank1/rank
* strat_rankstrat_level
Strat. Tree1/strat. corr.
* strat_id* parent_id
1
10-M
0-M
Geologic Map Data Model 10/16/97Chapter 2: version 4.1
24
individual records; these same two attributes will be found throughout the model wherever it is necessary to preservethe source of a map feature or description.
The Map Table contains information pertaining to each map in the archive. It also has two key attributes,org_id (agency identifier) and map_id (map identifier) which identify individual records. Two key attributes are usedwithin these two tables so that individual organizations can maintain their own map and source identification codingschemes and still be able to share data sets. So, for each map or source record, there is an attribute which refers to theorganization, org_id and source_org, and an attribute which distinguishes individual items within the organization,map_id and source_id. The remainder of the attributes in the Map Table are used to describe and to plot a particularmap.
For a new map that is being added to the system, a record will be created in both the Source Table and theMap Table with some of the information duplicated between the tables. However, for a derivative map that is createdfrom the archive, there will be one new record created in the Map Table which is related to one or more records in theSource Table, depending on how many maps are used as sources of features for the new map. A source map couldpotentially be used to create any number of derivative maps. Therefore, there is potentially a many-to-manyrelationship between the Map Table and the Source Table. To create that type of relation in a relational databasemodel, one must insert a correlation table. The Map/Source Correlation Table is the first of several correlation tablesin the model that will be discussed.
Correlation tables contain all of the key attributes from each of the tables being correlated, in this case, twokey attributes from each table. For every record in the Map Table (each has a unique combination of org_id andmap_id) there may be any number of records in the correlation table (each having the same org_id and map_id, but adifferent source_org and/or source_id), but for each record in the correlation table, there may be only onecorresponding record in the Map Table. Similarly, for each record in the Source Table there may be any number ofrecords in the correlation table, but for each record in the correlation table, there may be only one correspondingrecord in the Source Table. Therefore, the correlation table converts the many-to-many relation between the MapTable and the Source Table into two many-to-one relations between the correlation table and the other two tables.This technique is used throughout the relational model. An additional use of this correlation table is to allow amechanism for assigning precedence to the sources of maps derived from multiple sources. Thus, the user may directthe system to use several overlapping sources for a derivative map, but specify the order in which the maps are to beused in areas of overlap.
LegendThe second major portion of the model that is diagrammed on figure 2-6 is the legend. The legend consists of
two data tables and a number of standard look-up tables. The functions of the legend portion of the model are to recordthe objects to be included on a particular map, to record the descriptions of those objects for the purposes of that map,to specify how the selected objects are to be symbolized for a particular map, and to link the spatial descriptions ofobjects in the Spatial Object Archive to attribute descriptions in the Compound Object Archive. It’s clear from itsconnections to all other portions of the model that the legend is the heart of the data model and the ClassificationObject Table is the heart of the legend.
The Classification Object Table defines objects that are to appear on a map and also, on the map legend. Thetable can be used to define individual objects such as named faults, it can be used to define classes of singular objectswhich share symbolization such as all normal faults or all foliation symbols, and it can be used to define compoundobjects such as rock units or alteration zones. Each of these objects is assigned a unique class_obj_id which forms thekey to the table. The table also defines the labeling that is used for each object and the type of each object. Theattribute class_type is used to group similar objects on a map legend, for example all intrusive rock units or allstructural symbols.
The Cartographic Object Table is used to symbolize objects that are defined in the Classification ObjectTable. Each object in the Classification Object Table can be represented by one or more records in the CartographicObject Table, allowing the symbolization of each feature on the resulting map to be composed of multiple layers. Eachof these layers is defined by pointing to a symbol table and a specific symbol within the table and by pointing to acolor table and a specific color within the table. The type of symbol to be used is determined by which symbol table isreferenced. Point symbols are defined in standardized Point Symbol Tables, line patterns in Line Symbol Tables, etc.There can be multiple standard tables for each type of symbol, if necessary. Thus, point symbols for a single map
Geologic Map Data Model 10/16/97Chapter 2: version 4.1
25
could be drawn from several Point Symbol Tables. This arrangement allows maximum flexibility of cartographicdesign. As an example of the flexibility available, consider a polygon, or group of polygons on the map for which theuser would like to have a uniform base color overlain by two cross-hatches of different colors. Instead of having todesign a special symbol for this combination, the user simply defines three cartographic objects for the classification.The first includes the symbol number and symbol table needed to specify a solid area fill and the color desired for thefill. The other two include the symbol numbers and symbol tables for the appropriate cross-hatching patterns and thedesired color numbers and color tables to color the cross-hatching.
Legend Correlation TablesThe Classification Object Table, and therefore the legend, is connected to the rest of the model through three
correlation tables. These correlation tables interact with the adjacent portions of the model in the same way that theMap/Source Correlation Table interacts with the Map and Source Tables; they convert many-to-many relations to one-to-many relations. The Classification Scheme Table provides the correlation between the Map Table and the legend’sClassification Object Table:—i.e. it associates a set of classification objects with a particular map. It also allows theuser to designate this set of classification objects as a particular classification scheme and save it for further use. Inaddition, the Classification Scheme Table includes a classification sequence number and a display priority. Theclassification sequence number, class_seq#, is used to sequence the objects in a map legend according to the user’sneeds. Display priority, disp_priority, allows the user to specify the order in which objects are drawn when the mapis created. If a map includes a pattern overlay showing metamorphic grade or, perhaps, alteration, it is important thatthe output device draw the underlying polygons and lines before drawing the overlay pattern if the underlying geologyis to be seen through the pattern. Display priority is used to assure the display occurs in the desired order.
There is a Classification Name Table related to the Classification Scheme Table so that classificationschemes can be named and tied back to an original source. This allows the user to recall classification schemes byname or by their original source.
The Classification Object Table is also linked to the Compound Object Archive and the Spatial ObjectArchive through correlation tables. The Data Classification Table links the Classification Object Table to theCompound Object Archive. As a correlation table, it forms the same sort of link between the legend and the CompoundObject Archive as described above; it converts a many-to-many relation to two many-to-one relations. Including acorrelation table here provides for the possibility of linking a single classification object (legend object) to multipleobjects in the Compound Object Archive. For example, legend objects which refer to more than one rock unit from thearchive can be created. Therefore, new maps can be created which combine units from previous maps just by definingnew legend objects or re-using existing legend objects. In addition to the required key attributes, the DataClassification Table includes three attributes which increase its utility: percent, quality, and data_seq#. Theattributes, percent and quality, are used when a single classification object is composed of multiple objects from theCompound Object Archive. These attributes are used primarily with rock units from the Compound Object Archive.They allow the user to record the estimated proportion, in volume percent, of each rock unit that is part of the legendobject and the quality of the proportion estimate. The final attribute, data_seq#, is also used with legend objects thatare composed of multiple objects from the Compound Object Archive. It provides a sequence number which controlsthe order of display of descriptive information from the Compound Object Archive.
The final correlation table that is connected to the Classification Object Table is the Spatial ClassificationTable (figure 2-7) which connects the legend to the Spatial Archive. The Spatial Classification Table has noadditional attributes and simply functions as a correlation table to convert the many-to-many relation between theClassification Object Table and the various Spatial Object Archive tables to several many-to-one relations. Thismany-to-many relation between the spatial object and its classification implies that a spatial object may be classifiedin more than way: i.e. if its appearance varies on different maps, or if it is classified as more than one type of objectsuch as a fault which is also a contact.
Spatial Object ArchiveThe Spatial Object Archive (figure 2-7) is the storage location for the spatial (geographic and geometric)
description of all objects within the map library. All information concerning the shape, size, location, etc. of each mapfeature is stored in this archive. It is expected the archive will be implemented in a Geographic Information System(GIS). Most GIS provide separate repositories for each geometric type supported. For example, points, line and
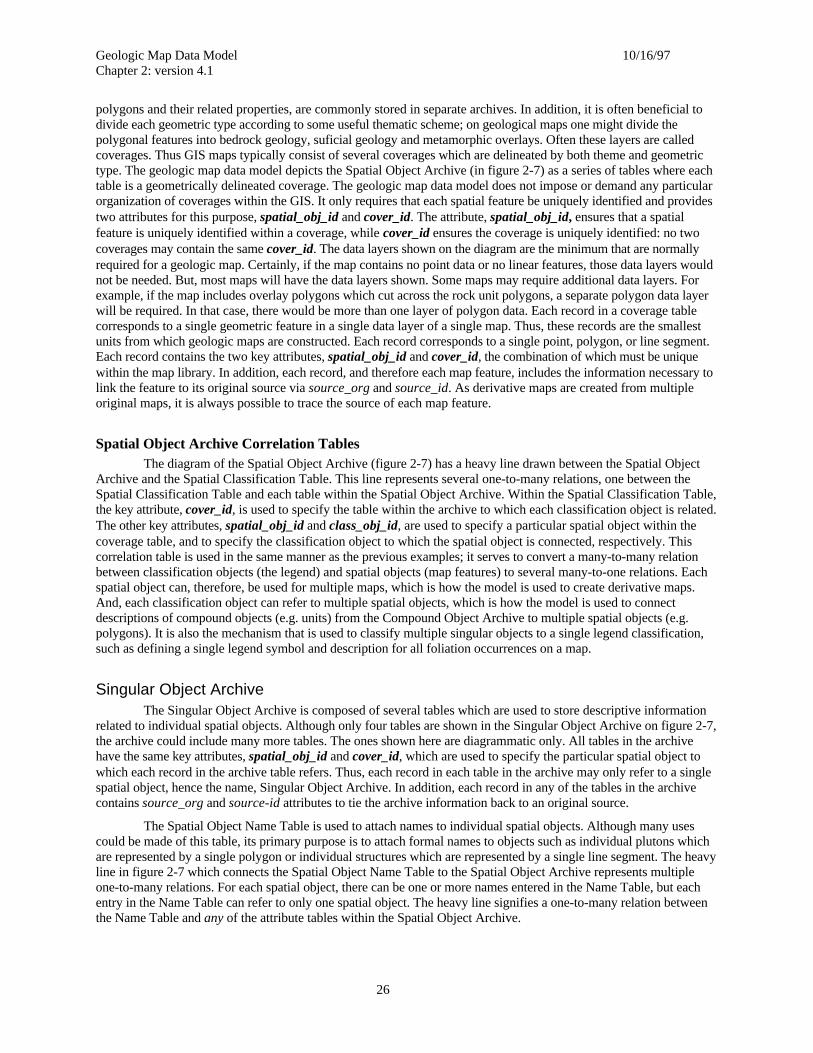
Geologic Map Data Model 10/16/97Chapter 2: version 4.1
26
polygons and their related properties, are commonly stored in separate archives. In addition, it is often beneficial todivide each geometric type according to some useful thematic scheme; on geological maps one might divide thepolygonal features into bedrock geology, suficial geology and metamorphic overlays. Often these layers are calledcoverages. Thus GIS maps typically consist of several coverages which are delineated by both theme and geometrictype. The geologic map data model depicts the Spatial Object Archive (in figure 2-7) as a series of tables where eachtable is a geometrically delineated coverage. The geologic map data model does not impose or demand any particularorganization of coverages within the GIS. It only requires that each spatial feature be uniquely identified and providestwo attributes for this purpose, spatial_obj_id and cover_id. The attribute, spatial_obj_id, ensures that a spatialfeature is uniquely identified within a coverage, while cover_id ensures the coverage is uniquely identified: no twocoverages may contain the same cover_id. The data layers shown on the diagram are the minimum that are normallyrequired for a geologic map. Certainly, if the map contains no point data or no linear features, those data layers wouldnot be needed. But, most maps will have the data layers shown. Some maps may require additional data layers. Forexample, if the map includes overlay polygons which cut across the rock unit polygons, a separate polygon data layerwill be required. In that case, there would be more than one layer of polygon data. Each record in a coverage tablecorresponds to a single geometric feature in a single data layer of a single map. Thus, these records are the smallestunits from which geologic maps are constructed. Each record corresponds to a single point, polygon, or line segment.Each record contains the two key attributes, spatial_obj_id and cover_id, the combination of which must be uniquewithin the map library. In addition, each record, and therefore each map feature, includes the information necessary tolink the feature to its original source via source_org and source_id. As derivative maps are created from multipleoriginal maps, it is always possible to trace the source of each map feature.
Spatial Object Archive Correlation TablesThe diagram of the Spatial Object Archive (figure 2-7) has a heavy line drawn between the Spatial Object
Archive and the Spatial Classification Table. This line represents several one-to-many relations, one between theSpatial Classification Table and each table within the Spatial Object Archive. Within the Spatial Classification Table,the key attribute, cover_id, is used to specify the table within the archive to which each classification object is related.The other key attributes, spatial_obj_id and class_obj_id, are used to specify a particular spatial object within thecoverage table, and to specify the classification object to which the spatial object is connected, respectively. Thiscorrelation table is used in the same manner as the previous examples; it serves to convert a many-to-many relationbetween classification objects (the legend) and spatial objects (map features) to several many-to-one relations. Eachspatial object can, therefore, be used for multiple maps, which is how the model is used to create derivative maps.And, each classification object can refer to multiple spatial objects, which is how the model is used to connectdescriptions of compound objects (e.g. units) from the Compound Object Archive to multiple spatial objects (e.g.polygons). It is also the mechanism that is used to classify multiple singular objects to a single legend classification,such as defining a single legend symbol and description for all foliation occurrences on a map.
Singular Object ArchiveThe Singular Object Archive is composed of several tables which are used to store descriptive information
related to individual spatial objects. Although only four tables are shown in the Singular Object Archive on figure 2-7,the archive could include many more tables. The ones shown here are diagrammatic only. All tables in the archivehave the same key attributes, spatial_obj_id and cover_id, which are used to specify the particular spatial object towhich each record in the archive table refers. Thus, each record in each table in the archive may only refer to a singlespatial object, hence the name, Singular Object Archive. In addition, each record in any of the tables in the archivecontains source_org and source-id attributes to tie the archive information back to an original source.
The Spatial Object Name Table is used to attach names to individual spatial objects. Although many usescould be made of this table, its primary purpose is to attach formal names to objects such as individual plutons whichare represented by a single polygon or individual structures which are represented by a single line segment. The heavyline in figure 2-7 which connects the Spatial Object Name Table to the Spatial Object Archive represents multipleone-to-many relations. For each spatial object, there can be one or more names entered in the Name Table, but eachentry in the Name Table can refer to only one spatial object. The heavy line signifies a one-to-many relation betweenthe Name Table and any of the attribute tables within the Spatial Object Archive.
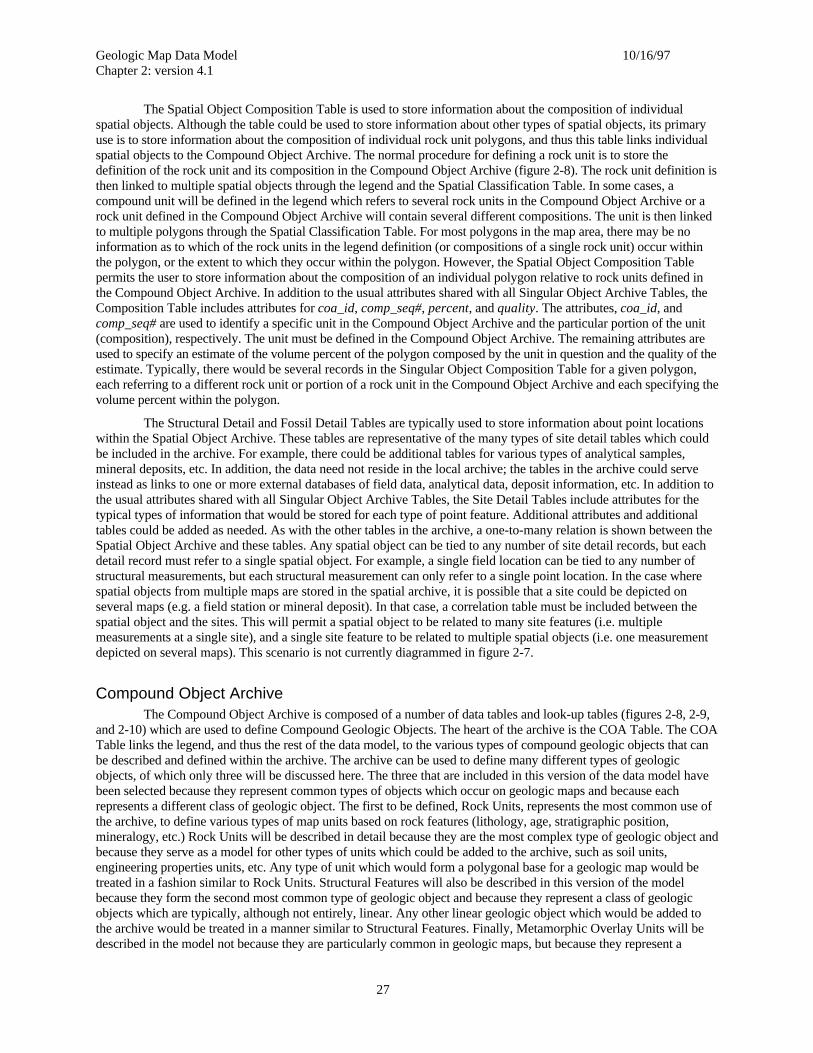
Geologic Map Data Model 10/16/97Chapter 2: version 4.1
27
The Spatial Object Composition Table is used to store information about the composition of individualspatial objects. Although the table could be used to store information about other types of spatial objects, its primaryuse is to store information about the composition of individual rock unit polygons, and thus this table links individualspatial objects to the Compound Object Archive. The normal procedure for defining a rock unit is to store thedefinition of the rock unit and its composition in the Compound Object Archive (figure 2-8). The rock unit definition isthen linked to multiple spatial objects through the legend and the Spatial Classification Table. In some cases, acompound unit will be defined in the legend which refers to several rock units in the Compound Object Archive or arock unit defined in the Compound Object Archive will contain several different compositions. The unit is then linkedto multiple polygons through the Spatial Classification Table. For most polygons in the map area, there may be noinformation as to which of the rock units in the legend definition (or compositions of a single rock unit) occur withinthe polygon, or the extent to which they occur within the polygon. However, the Spatial Object Composition Tablepermits the user to store information about the composition of an individual polygon relative to rock units defined inthe Compound Object Archive. In addition to the usual attributes shared with all Singular Object Archive Tables, theComposition Table includes attributes for coa_id, comp_seq#, percent, and quality. The attributes, coa_id, andcomp_seq# are used to identify a specific unit in the Compound Object Archive and the particular portion of the unit(composition), respectively. The unit must be defined in the Compound Object Archive. The remaining attributes areused to specify an estimate of the volume percent of the polygon composed by the unit in question and the quality of theestimate. Typically, there would be several records in the Singular Object Composition Table for a given polygon,each referring to a different rock unit or portion of a rock unit in the Compound Object Archive and each specifying thevolume percent within the polygon.
The Structural Detail and Fossil Detail Tables are typically used to store information about point locationswithin the Spatial Object Archive. These tables are representative of the many types of site detail tables which couldbe included in the archive. For example, there could be additional tables for various types of analytical samples,mineral deposits, etc. In addition, the data need not reside in the local archive; the tables in the archive could serveinstead as links to one or more external databases of field data, analytical data, deposit information, etc. In addition tothe usual attributes shared with all Singular Object Archive Tables, the Site Detail Tables include attributes for thetypical types of information that would be stored for each type of point feature. Additional attributes and additionaltables could be added as needed. As with the other tables in the archive, a one-to-many relation is shown between theSpatial Object Archive and these tables. Any spatial object can be tied to any number of site detail records, but eachdetail record must refer to a single spatial object. For example, a single field location can be tied to any number ofstructural measurements, but each structural measurement can only refer to a single point location. In the case wherespatial objects from multiple maps are stored in the spatial archive, it is possible that a site could be depicted onseveral maps (e.g. a field station or mineral deposit). In that case, a correlation table must be included between thespatial object and the sites. This will permit a spatial object to be related to many site features (i.e. multiplemeasurements at a single site), and a single site feature to be related to multiple spatial objects (i.e. one measurementdepicted on several maps). This scenario is not currently diagrammed in figure 2-7.
Compound Object ArchiveThe Compound Object Archive is composed of a number of data tables and look-up tables (figures 2-8, 2-9,
and 2-10) which are used to define Compound Geologic Objects. The heart of the archive is the COA Table. The COATable links the legend, and thus the rest of the data model, to the various types of compound geologic objects that canbe described and defined within the archive. The archive can be used to define many different types of geologicobjects, of which only three will be discussed here. The three that are included in this version of the data model havebeen selected because they represent common types of objects which occur on geologic maps and because eachrepresents a different class of geologic object. The first to be defined, Rock Units, represents the most common use ofthe archive, to define various types of map units based on rock features (lithology, age, stratigraphic position,mineralogy, etc.) Rock Units will be described in detail because they are the most complex type of geologic object andbecause they serve as a model for other types of units which could be added to the archive, such as soil units,engineering properties units, etc. Any type of unit which would form a polygonal base for a geologic map would betreated in a fashion similar to Rock Units. Structural Features will also be described in this version of the modelbecause they form the second most common type of geologic object and because they represent a class of geologicobjects which are typically, although not entirely, linear. Any other linear geologic object which would be added tothe archive would be treated in a manner similar to Structural Features. Finally, Metamorphic Overlay Units will bedescribed in the model not because they are particularly common in geologic maps, but because they represent a
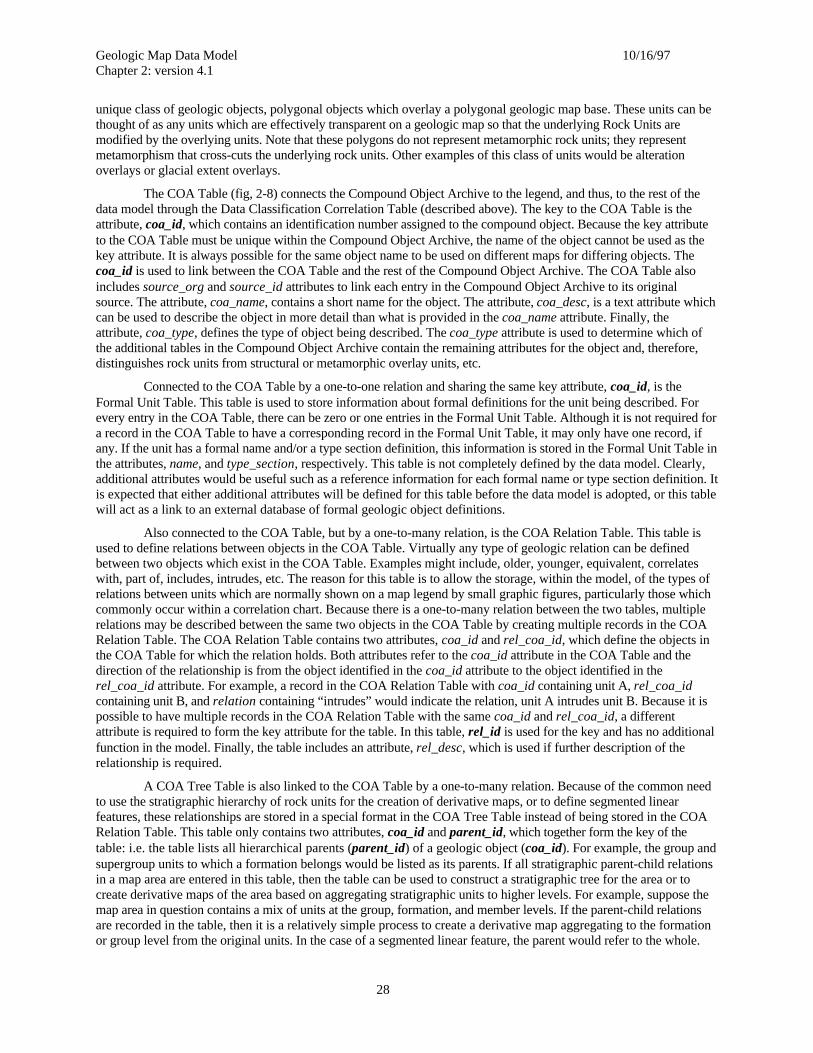
Geologic Map Data Model 10/16/97Chapter 2: version 4.1
28
unique class of geologic objects, polygonal objects which overlay a polygonal geologic map base. These units can bethought of as any units which are effectively transparent on a geologic map so that the underlying Rock Units aremodified by the overlying units. Note that these polygons do not represent metamorphic rock units; they representmetamorphism that cross-cuts the underlying rock units. Other examples of this class of units would be alterationoverlays or glacial extent overlays.
The COA Table (fig, 2-8) connects the Compound Object Archive to the legend, and thus, to the rest of thedata model through the Data Classification Correlation Table (described above). The key to the COA Table is theattribute, coa_id, which contains an identification number assigned to the compound object. Because the key attributeto the COA Table must be unique within the Compound Object Archive, the name of the object cannot be used as thekey attribute. It is always possible for the same object name to be used on different maps for differing objects. Thecoa_id is used to link between the COA Table and the rest of the Compound Object Archive. The COA Table alsoincludes source_org and source_id attributes to link each entry in the Compound Object Archive to its originalsource. The attribute, coa_name, contains a short name for the object. The attribute, coa_desc, is a text attribute whichcan be used to describe the object in more detail than what is provided in the coa_name attribute. Finally, theattribute, coa_type, defines the type of object being described. The coa_type attribute is used to determine which ofthe additional tables in the Compound Object Archive contain the remaining attributes for the object and, therefore,distinguishes rock units from structural or metamorphic overlay units, etc.
Connected to the COA Table by a one-to-one relation and sharing the same key attribute, coa_id, is theFormal Unit Table. This table is used to store information about formal definitions for the unit being described. Forevery entry in the COA Table, there can be zero or one entries in the Formal Unit Table. Although it is not required fora record in the COA Table to have a corresponding record in the Formal Unit Table, it may only have one record, ifany. If the unit has a formal name and/or a type section definition, this information is stored in the Formal Unit Table inthe attributes, name, and type_section, respectively. This table is not completely defined by the data model. Clearly,additional attributes would be useful such as a reference information for each formal name or type section definition. Itis expected that either additional attributes will be defined for this table before the data model is adopted, or this tablewill act as a link to an external database of formal geologic object definitions.
Also connected to the COA Table, but by a one-to-many relation, is the COA Relation Table. This table isused to define relations between objects in the COA Table. Virtually any type of geologic relation can be definedbetween two objects which exist in the COA Table. Examples might include, older, younger, equivalent, correlateswith, part of, includes, intrudes, etc. The reason for this table is to allow the storage, within the model, of the types ofrelations between units which are normally shown on a map legend by small graphic figures, particularly those whichcommonly occur within a correlation chart. Because there is a one-to-many relation between the two tables, multiplerelations may be described between the same two objects in the COA Table by creating multiple records in the COARelation Table. The COA Relation Table contains two attributes, coa_id and rel_coa_id, which define the objects inthe COA Table for which the relation holds. Both attributes refer to the coa_id attribute in the COA Table and thedirection of the relationship is from the object identified in the coa_id attribute to the object identified in therel_coa_id attribute. For example, a record in the COA Relation Table with coa_id containing unit A, rel_coa_idcontaining unit B, and relation containing “intrudes” would indicate the relation, unit A intrudes unit B. Because it ispossible to have multiple records in the COA Relation Table with the same coa_id and rel_coa_id, a differentattribute is required to form the key attribute for the table. In this table, rel_id is used for the key and has no additionalfunction in the model. Finally, the table includes an attribute, rel_desc, which is used if further description of therelationship is required.
A COA Tree Table is also linked to the COA Table by a one-to-many relation. Because of the common needto use the stratigraphic hierarchy of rock units for the creation of derivative maps, or to define segmented linearfeatures, these relationships are stored in a special format in the COA Tree Table instead of being stored in the COARelation Table. This table only contains two attributes, coa_id and parent_id, which together form the key of thetable: i.e. the table lists all hierarchical parents (parent_id) of a geologic object (coa_id). For example, the group andsupergroup units to which a formation belongs would be listed as its parents. If all stratigraphic parent-child relationsin a map area are entered in this table, then the table can be used to construct a stratigraphic tree for the area or tocreate derivative maps of the area based on aggregating stratigraphic units to higher levels. For example, suppose themap area in question contains a mix of units at the group, formation, and member levels. If the parent-child relationsare recorded in the table, then it is a relatively simple process to create a derivative map aggregating to the formationor group level from the original units. In the case of a segmented linear feature, the parent would refer to the whole.
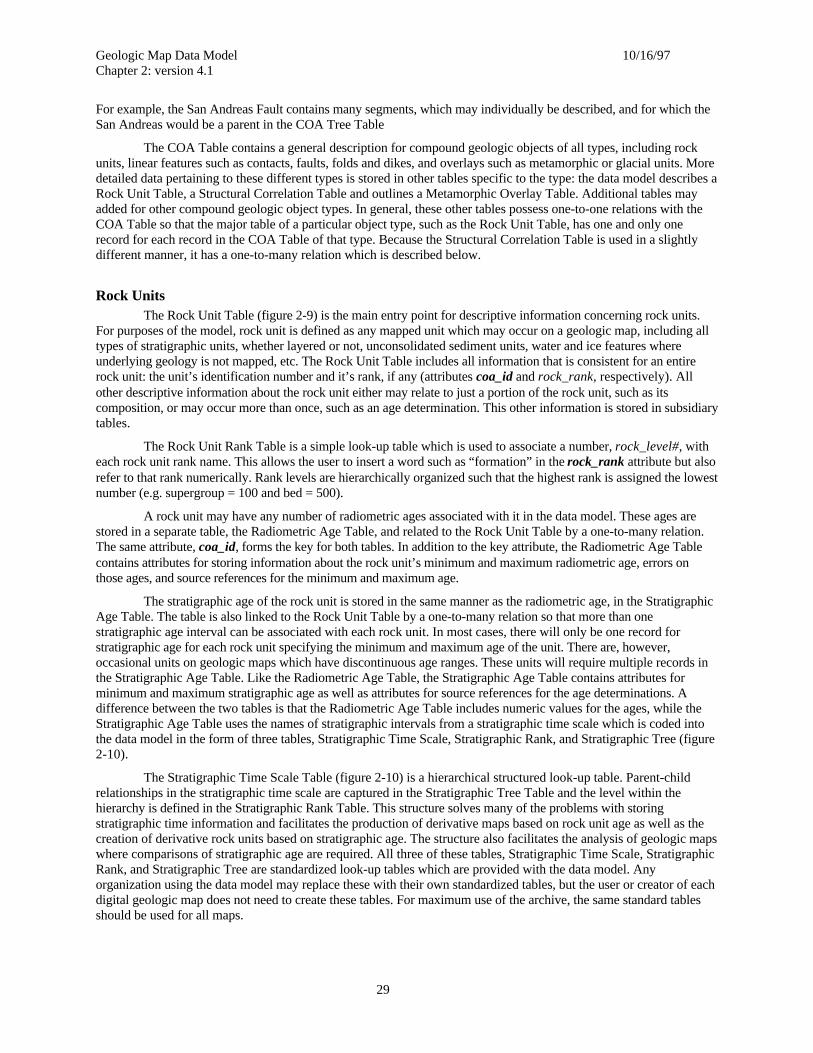
Geologic Map Data Model 10/16/97Chapter 2: version 4.1
29
For example, the San Andreas Fault contains many segments, which may individually be described, and for which theSan Andreas would be a parent in the COA Tree Table
The COA Table contains a general description for compound geologic objects of all types, including rockunits, linear features such as contacts, faults, folds and dikes, and overlays such as metamorphic or glacial units. Moredetailed data pertaining to these different types is stored in other tables specific to the type: the data model describes aRock Unit Table, a Structural Correlation Table and outlines a Metamorphic Overlay Table. Additional tables mayadded for other compound geologic object types. In general, these other tables possess one-to-one relations with theCOA Table so that the major table of a particular object type, such as the Rock Unit Table, has one and only onerecord for each record in the COA Table of that type. Because the Structural Correlation Table is used in a slightlydifferent manner, it has a one-to-many relation which is described below.
Rock UnitsThe Rock Unit Table (figure 2-9) is the main entry point for descriptive information concerning rock units.
For purposes of the model, rock unit is defined as any mapped unit which may occur on a geologic map, including alltypes of stratigraphic units, whether layered or not, unconsolidated sediment units, water and ice features whereunderlying geology is not mapped, etc. The Rock Unit Table includes all information that is consistent for an entirerock unit: the unit’s identification number and it’s rank, if any (attributes coa_id and rock_rank, respectively). Allother descriptive information about the rock unit either may relate to just a portion of the rock unit, such as itscomposition, or may occur more than once, such as an age determination. This other information is stored in subsidiarytables.
The Rock Unit Rank Table is a simple look-up table which is used to associate a number, rock_level#, witheach rock unit rank name. This allows the user to insert a word such as “formation” in the rock_rank attribute but alsorefer to that rank numerically. Rank levels are hierarchically organized such that the highest rank is assigned the lowestnumber (e.g. supergroup = 100 and bed = 500).
A rock unit may have any number of radiometric ages associated with it in the data model. These ages arestored in a separate table, the Radiometric Age Table, and related to the Rock Unit Table by a one-to-many relation.The same attribute, coa_id, forms the key for both tables. In addition to the key attribute, the Radiometric Age Tablecontains attributes for storing information about the rock unit’s minimum and maximum radiometric age, errors onthose ages, and source references for the minimum and maximum age.
The stratigraphic age of the rock unit is stored in the same manner as the radiometric age, in the StratigraphicAge Table. The table is also linked to the Rock Unit Table by a one-to-many relation so that more than onestratigraphic age interval can be associated with each rock unit. In most cases, there will only be one record forstratigraphic age for each rock unit specifying the minimum and maximum age of the unit. There are, however,occasional units on geologic maps which have discontinuous age ranges. These units will require multiple records inthe Stratigraphic Age Table. Like the Radiometric Age Table, the Stratigraphic Age Table contains attributes forminimum and maximum stratigraphic age as well as attributes for source references for the age determinations. Adifference between the two tables is that the Radiometric Age Table includes numeric values for the ages, while theStratigraphic Age Table uses the names of stratigraphic intervals from a stratigraphic time scale which is coded intothe data model in the form of three tables, Stratigraphic Time Scale, Stratigraphic Rank, and Stratigraphic Tree (figure2-10).
The Stratigraphic Time Scale Table (figure 2-10) is a hierarchical structured look-up table. Parent-childrelationships in the stratigraphic time scale are captured in the Stratigraphic Tree Table and the level within thehierarchy is defined in the Stratigraphic Rank Table. This structure solves many of the problems with storingstratigraphic time information and facilitates the production of derivative maps based on rock unit age as well as thecreation of derivative rock units based on stratigraphic age. The structure also facilitates the analysis of geologic mapswhere comparisons of stratigraphic age are required. All three of these tables, Stratigraphic Time Scale, StratigraphicRank, and Stratigraphic Tree are standardized look-up tables which are provided with the data model. Anyorganization using the data model may replace these with their own standardized tables, but the user or creator of eachdigital geologic map does not need to create these tables. For maximum use of the archive, the same standard tablesshould be used for all maps.
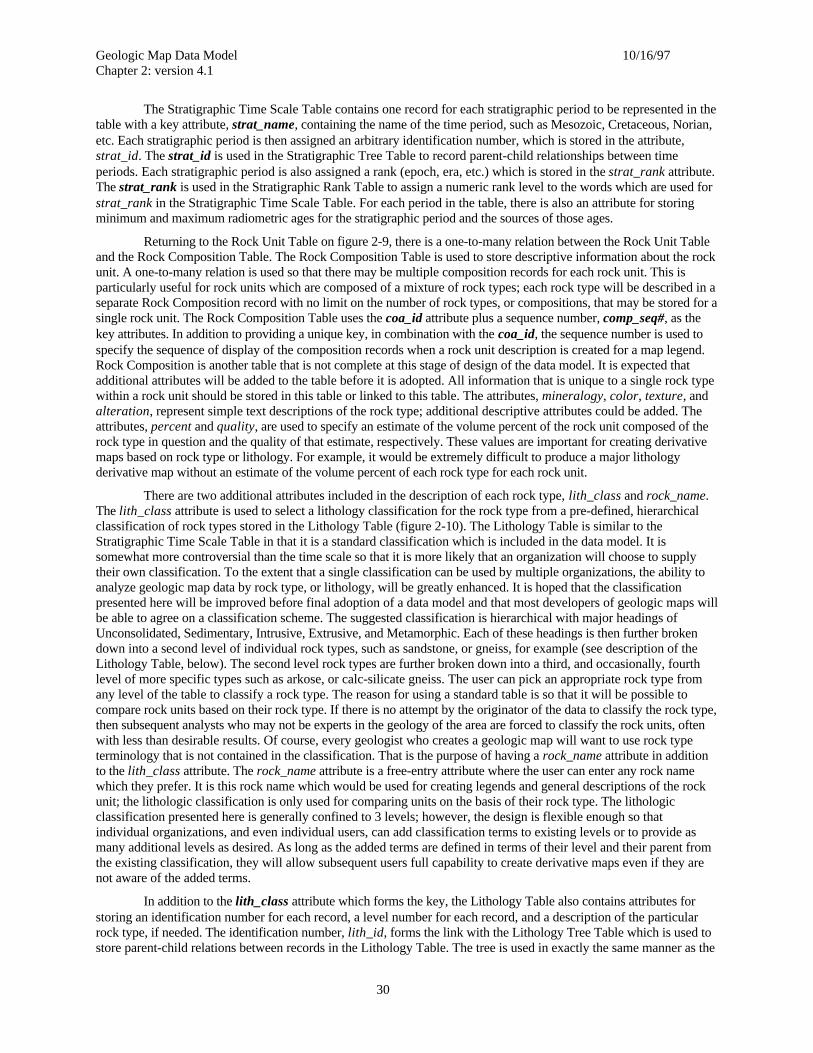
Geologic Map Data Model 10/16/97Chapter 2: version 4.1
30
The Stratigraphic Time Scale Table contains one record for each stratigraphic period to be represented in thetable with a key attribute, strat_name, containing the name of the time period, such as Mesozoic, Cretaceous, Norian,etc. Each stratigraphic period is then assigned an arbitrary identification number, which is stored in the attribute,strat_id. The strat_id is used in the Stratigraphic Tree Table to record parent-child relationships between timeperiods. Each stratigraphic period is also assigned a rank (epoch, era, etc.) which is stored in the strat_rank attribute.The strat_rank is used in the Stratigraphic Rank Table to assign a numeric rank level to the words which are used forstrat_rank in the Stratigraphic Time Scale Table. For each period in the table, there is also an attribute for storingminimum and maximum radiometric ages for the stratigraphic period and the sources of those ages.
Returning to the Rock Unit Table on figure 2-9, there is a one-to-many relation between the Rock Unit Tableand the Rock Composition Table. The Rock Composition Table is used to store descriptive information about the rockunit. A one-to-many relation is used so that there may be multiple composition records for each rock unit. This isparticularly useful for rock units which are composed of a mixture of rock types; each rock type will be described in aseparate Rock Composition record with no limit on the number of rock types, or compositions, that may be stored for asingle rock unit. The Rock Composition Table uses the coa_id attribute plus a sequence number, comp_seq#, as thekey attributes. In addition to providing a unique key, in combination with the coa_id, the sequence number is used tospecify the sequence of display of the composition records when a rock unit description is created for a map legend.Rock Composition is another table that is not complete at this stage of design of the data model. It is expected thatadditional attributes will be added to the table before it is adopted. All information that is unique to a single rock typewithin a rock unit should be stored in this table or linked to this table. The attributes, mineralogy, color, texture, andalteration, represent simple text descriptions of the rock type; additional descriptive attributes could be added. Theattributes, percent and quality, are used to specify an estimate of the volume percent of the rock unit composed of therock type in question and the quality of that estimate, respectively. These values are important for creating derivativemaps based on rock type or lithology. For example, it would be extremely difficult to produce a major lithologyderivative map without an estimate of the volume percent of each rock type for each rock unit.
There are two additional attributes included in the description of each rock type, lith_class and rock_name.The lith_class attribute is used to select a lithology classification for the rock type from a pre-defined, hierarchicalclassification of rock types stored in the Lithology Table (figure 2-10). The Lithology Table is similar to theStratigraphic Time Scale Table in that it is a standard classification which is included in the data model. It issomewhat more controversial than the time scale so that it is more likely that an organization will choose to supplytheir own classification. To the extent that a single classification can be used by multiple organizations, the ability toanalyze geologic map data by rock type, or lithology, will be greatly enhanced. It is hoped that the classificationpresented here will be improved before final adoption of a data model and that most developers of geologic maps willbe able to agree on a classification scheme. The suggested classification is hierarchical with major headings ofUnconsolidated, Sedimentary, Intrusive, Extrusive, and Metamorphic. Each of these headings is then further brokendown into a second level of individual rock types, such as sandstone, or gneiss, for example (see description of theLithology Table, below). The second level rock types are further broken down into a third, and occasionally, fourthlevel of more specific types such as arkose, or calc-silicate gneiss. The user can pick an appropriate rock type fromany level of the table to classify a rock type. The reason for using a standard table is so that it will be possible tocompare rock units based on their rock type. If there is no attempt by the originator of the data to classify the rock type,then subsequent analysts who may not be experts in the geology of the area are forced to classify the rock units, oftenwith less than desirable results. Of course, every geologist who creates a geologic map will want to use rock typeterminology that is not contained in the classification. That is the purpose of having a rock_name attribute in additionto the lith_class attribute. The rock_name attribute is a free-entry attribute where the user can enter any rock namewhich they prefer. It is this rock name which would be used for creating legends and general descriptions of the rockunit; the lithologic classification is only used for comparing units on the basis of their rock type. The lithologicclassification presented here is generally confined to 3 levels; however, the design is flexible enough so thatindividual organizations, and even individual users, can add classification terms to existing levels or to provide asmany additional levels as desired. As long as the added terms are defined in terms of their level and their parent fromthe existing classification, they will allow subsequent users full capability to create derivative maps even if they arenot aware of the added terms.
In addition to the lith_class attribute which forms the key, the Lithology Table also contains attributes forstoring an identification number for each record, a level number for each record, and a description of the particularrock type, if needed. The identification number, lith_id, forms the link with the Lithology Tree Table which is used tostore parent-child relations between records in the Lithology Table. The tree is used in exactly the same manner as the
Geologic Map Data Model 10/16/97Chapter 2: version 4.1
31
Stratigraphic Tree Table. There is no Lithology Rank Table because the ranks (or levels in the case of lithology) arestored in the Lithology Table as numeric values. Therefore, there is no need for a look-up table to translate levelnames to level numbers.
Structural FeaturesAs with all other objects in the Compound Object Archive, structural features are represented in the COA
Table (figure 2-8) with an object identification number, a name, a description, source information, and a type codewhich identifies the object as a structural feature. There are two different types of structural features which can berepresented in the Compound Object Archive, individual structures, such as named faults, and generic structures, suchas all normal faults. Normally, there would be a single record in the COA Table for each generic type of structure, onefor all approximately located normal faults, one for all anticlines, one for all queried contacts, etc. For each type ofstructure which has an individual symbol or description on the map legend, there would be a generic record in theCOA Table. In addition, there would be a record in the COA Table for each individual structure which is uniquelyidentified on the map, usually by a name. Thus, although the San Andreas Fault might be a dextral, strike-slip fault on aparticular map, it would have its own individual record in the COA Table so that the name San Andreas Fault couldbe associated with the entire structure. For records that are identified in the COA Table as structures, there is a one-to-many relation between the COA Table and the Structural Correlation Table.
The Structural Correlation Table is used in much the same manner as other correlation tables in the datamodel. It serves to convert a many-to-many relation between the COA Table and the Structural Type Table (figure 2-10) into two one-to-many relations. The many-to-many relation between the two tables, and thus the StructuralCorrelation Table, is required because many structures have multiple aspects. For example, many faults have bothstrike-slip and dip-slip aspects. To avoid having to create records in the Structural Type Table for all of the possiblecombinations of structural aspects, the data model allows each structural unit in the COA Table to be related to one ormore records in the Structural Type Table. The Structural Correlation Table mediates the many-to-many relation andcontains the two key attributes from the COA Table and the Structural Type Table, coa_id and struct_typ_id. Inaddition, the Structural Correlation Table contains the attribute, accuracy, which is used to specify the degree ofaccuracy with which the structure has been mapped. It might contain words such as approximate, inferred, orconcealed.
The Structure Type Table contains, in addition to the key attribute, struct_typ_id, attributes for the type ofstructure, a modifier for the type of structure, and a general description of the structure type. The type of structureattribute, type, is used to specify whether the structure is a fault, fold, shear zone, etc. The attribute, modifier, is usedto specify the type of fault or fold, etc. For example, if the structure is a fault, the modifier might be normal, strike-slip,thrust, etc. If it is a fold, the modifier might be anticline, syncline, doubly-plunging syncline, etc. The attribute, desc, isused for a text description of the structure specified in the record. It might contain a text string such as, “dextral strike-slip fault”. The Structural Type Table is another of the standard tables which will be provided with the data model. Ifit does not contain sufficient records to describe all structures needed, additional records can be added by individualorganizations.
Metamorphic Overlay UnitsMetamorphic overlay units are included in the data model to demonstrate the model’s capacity to incorporate
various types of map units. Any type of polygonal unit which overlies a base polygonal unit can be treated in a similarmanner. In the case of the metamorphic overlay units, the overlay represents areas of consistent metamorphic grade.On a geologic map, these polygonal areas would normally be shown as a pattern which overlays the solid colorpolygons of the rock units. Other examples of the use of this type of unit might be to display areas of alteration orextent of glaciation.
Each metamorphic overlay unit has a unique record in the COA Table where the record is identified as ametamorphic overlay unit by the coa_type attribute. The Metamorphic Overlay Table is related to the COA Table byone-to-one relation. That is, if there is a metamorphic overlay object identified in the COA Table, it will have one andonly one record in the Metamorphic Overlay Table. The Metamorphic Overlay Table can be used to specify the gradeof the overlay unit as well as other descriptive aspects of the unit. As with several other tables in the CompoundObject Archive, the description of the Metamorphic Overlay Table is not complete at this time. It is hoped thatadditional attributes will be defined prior to adoption of the data model. The purpose of including the table at this time
Geologic Map Data Model 10/16/97Chapter 2: version 4.1
32
is to provide an example of how this type of geologic object could be modeled and to provide a source of data fortesting the model.
ToolsThe complex relationships between objects that define a geologic map and the concepts of normalized data
structures, which contribute to minimizing the size of data sets and to increase the speed of access, lead to a datamodel with a large number of tables with complex linkages. The complexity of such data structures is best dealt withthrough user interface tools which make the complexity of the data model transparent to the user. The critical toolsneeded are computerized data entry forms, legend preparation forms, standardized query packages, output definitiontools, and data transfer protocols. Some of the required functions of these tools can be achieved by linking to a mapvisualization tool such as ArcView. Prototype tools are being developed to investigate the data model and as thebeginning phase of implementation of the data model. These developments will be released on the Web site,http://ncgmp.usgs.gov/ngmdbproject/, for testing as they become available.
Descriptions of Individual TablesThis section of the report defines the attributes which are included in each of the data model tables. Each
attribute is named, defined, and assigned a format. The formats used are primarily character and integer. Characterformat attributes are used to store text of any kind. Integer formats are used to store numeric values, primarily unique,integer identification numbers used to associate tables with each other. Lengths of attribute fields are not specified asthese may vary between implementations. For attributes which make use of restricted word or term lists, tables of theapplicable words or terms are included. These tables are, in general, neither complete nor final. Comments andimprovements are encouraged. Please contact the authors.
Metadata and Related TablesThe three metadata tables, Map Table, Source Table, and Map/Source Correlation Table, include
information that may be part of the requirements for FGDC standard metadata but are not intended to be completeformal metadata. The information in these tables may be used to link to a database of formal metadata. These tablesare intended to supply reference information for all geologic objects in the archive. In an archive of more than onemap, the attributes, org_id, map_id, source_org, and source_id are carried throughout the archive so that any objectwithin the archive can always be traced back to its original source.
Map TableThe Map Table (table 2-1) contains reference information for each map that is defined in the archive,
whether it is an original map or a map derived from other maps. The information in this table is used to define thegeographic extent and projection of the map as well as to provide descriptive text for the map layout. The Map Tablecan also be used to search the archive for specific maps.
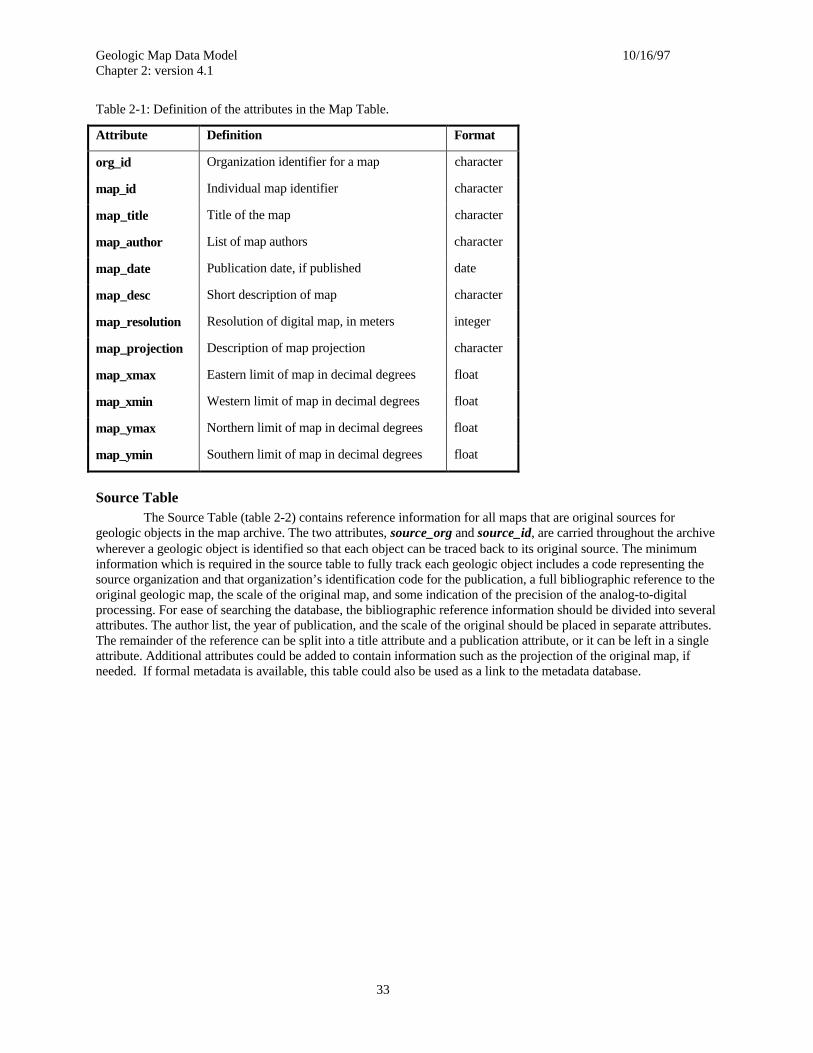
Geologic Map Data Model 10/16/97Chapter 2: version 4.1
33
Table 2-1: Definition of the attributes in the Map Table.
Attribute Definition Format
org_id Organization identifier for a map character
map_id Individual map identifier character
map_title Title of the map character
map_author List of map authors character
map_date Publication date, if published date
map_desc Short description of map character
map_resolution Resolution of digital map, in meters integer
map_projection Description of map projection character
map_xmax Eastern limit of map in decimal degrees float
map_xmin Western limit of map in decimal degrees float
map_ymax Northern limit of map in decimal degrees float
map_ymin Southern limit of map in decimal degrees float
Source TableThe Source Table (table 2-2) contains reference information for all maps that are original sources for
geologic objects in the map archive. The two attributes, source_org and source_id, are carried throughout the archivewherever a geologic object is identified so that each object can be traced back to its original source. The minimuminformation which is required in the source table to fully track each geologic object includes a code representing thesource organization and that organization’s identification code for the publication, a full bibliographic reference to theoriginal geologic map, the scale of the original map, and some indication of the precision of the analog-to-digitalprocessing. For ease of searching the database, the bibliographic reference information should be divided into severalattributes. The author list, the year of publication, and the scale of the original should be placed in separate attributes.The remainder of the reference can be split into a title attribute and a publication attribute, or it can be left in a singleattribute. Additional attributes could be added to contain information such as the projection of the original map, ifneeded. If formal metadata is available, this table could also be used as a link to the metadata database.
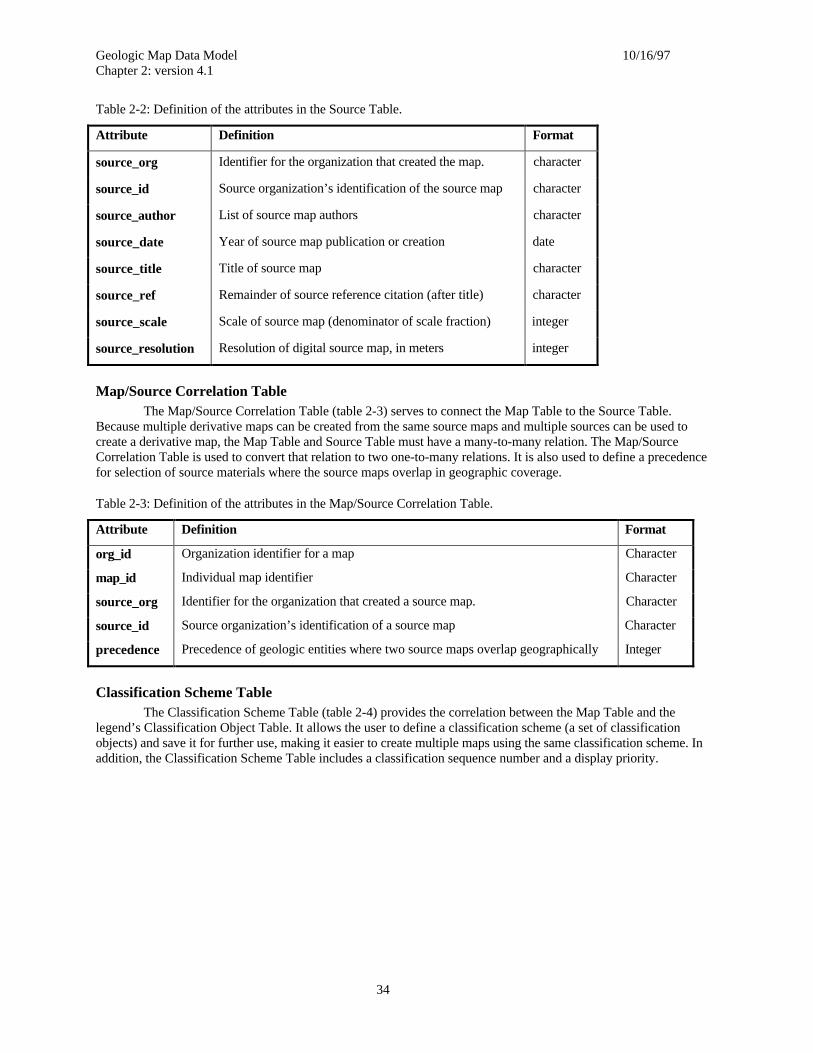
Geologic Map Data Model 10/16/97Chapter 2: version 4.1
34
Table 2-2: Definition of the attributes in the Source Table.
Attribute Definition Fo rmat
source_org Identifier for the organization that created the map. character
source_id Source organization’s identification of the source map character
source_author List of source map authors character
source_date Year of source map publication or creation date
source_title Title of source map character
source_ref Remainder of source reference citation (after title) character
source_scale Scale of source map (denominator of scale fraction) integer
source_resolution Resolution of digital source map, in meters integer
Map/Source Correlation TableThe Map/Source Correlation Table (table 2-3) serves to connect the Map Table to the Source Table.
Because multiple derivative maps can be created from the same source maps and multiple sources can be used tocreate a derivative map, the Map Table and Source Table must have a many-to-many relation. The Map/SourceCorrelation Table is used to convert that relation to two one-to-many relations. It is also used to define a precedencefor selection of source materials where the source maps overlap in geographic coverage.
Table 2-3: Definition of the attributes in the Map/Source Correlation Table.
Attribute Definition Format
org_id Organization identifier for a map Character
map_id Individual map identifier Character
source_org Identifier for the organization that created a source map. Character
source_id Source organization’s identification of a source map Character
precedence Precedence of geologic entities where two source maps overlap geographicallyInteger
Classification Scheme TableThe Classification Scheme Table (table 2-4) provides the correlation between the Map Table and the
legend’s Classification Object Table. It allows the user to define a classification scheme (a set of classificationobjects) and save it for further use, making it easier to create multiple maps using the same classification scheme. Inaddition, the Classification Scheme Table includes a classification sequence number and a display priority.
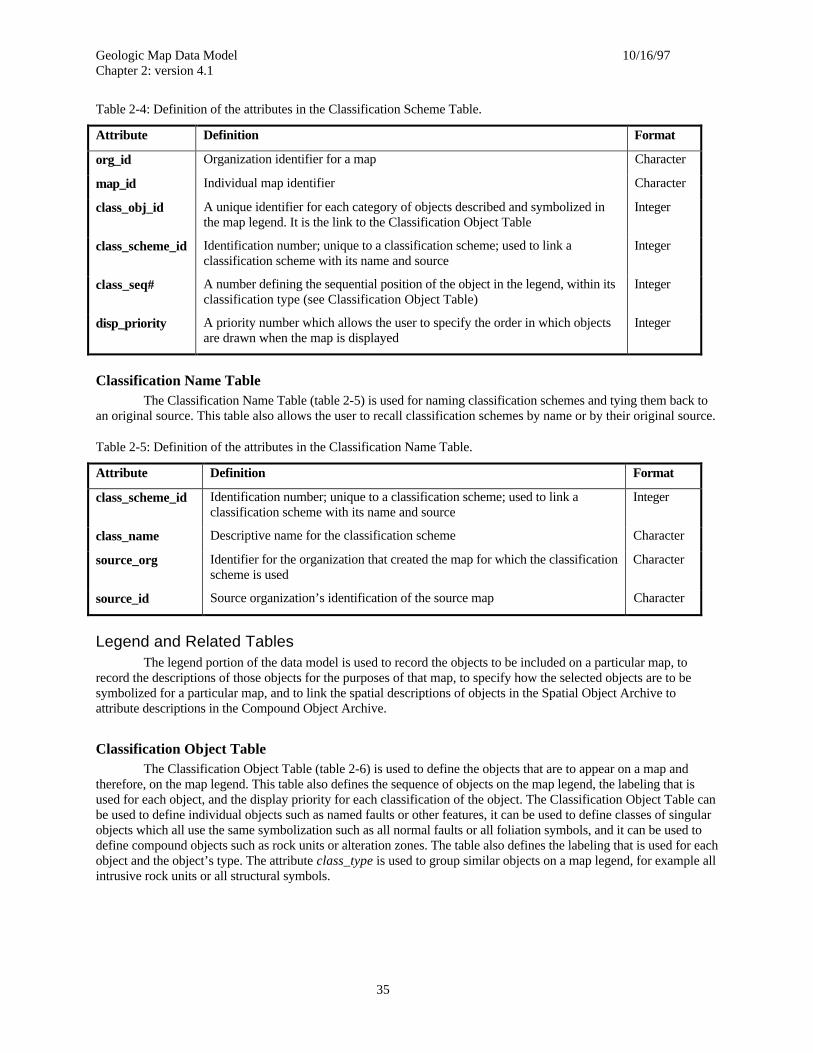
Geologic Map Data Model 10/16/97Chapter 2: version 4.1
35
Table 2-4: Definition of the attributes in the Classification Scheme Table.
Attribute Definition Format
org_id Organization identifier for a map Character
map_id Individual map identifier Character
class_obj_id A unique identifier for each category of objects described and symbolized inthe map legend. It is the link to the Classification Object Table
Integer
class_scheme_id Identification number; unique to a classification scheme; used to link aclassification scheme with its name and source
Integer
class_seq# A number defining the sequential position of the object in the legend, within itsclassification type (see Classification Object Table)
Integer
disp_priority A priority number which allows the user to specify the order in which objectsare drawn when the map is displayed
Integer
Classification Name TableThe Classification Name Table (table 2-5) is used for naming classification schemes and tying them back to
an original source. This table also allows the user to recall classification schemes by name or by their original source.
Table 2-5: Definition of the attributes in the Classification Name Table.
Attribute Definition Fo rmat
class_scheme_id Identification number; unique to a classification scheme; used to link aclassification scheme with its name and source
Integer
class_name Descriptive name for the classification scheme Character
source_org Identifier for the organization that created the map for which the classificationscheme is used
Character
source_id Source organization’s identification of the source map Character
Legend and Related TablesThe legend portion of the data model is used to record the objects to be included on a particular map, to
record the descriptions of those objects for the purposes of that map, to specify how the selected objects are to besymbolized for a particular map, and to link the spatial descriptions of objects in the Spatial Object Archive toattribute descriptions in the Compound Object Archive.
Classification Object TableThe Classification Object Table (table 2-6) is used to define the objects that are to appear on a map and
therefore, on the map legend. This table also defines the sequence of objects on the map legend, the labeling that isused for each object, and the display priority for each classification of the object. The Classification Object Table canbe used to define individual objects such as named faults or other features, it can be used to define classes of singularobjects which all use the same symbolization such as all normal faults or all foliation symbols, and it can be used todefine compound objects such as rock units or alteration zones. The table also defines the labeling that is used for eachobject and the object’s type. The attribute class_type is used to group similar objects on a map legend, for example allintrusive rock units or all structural symbols.
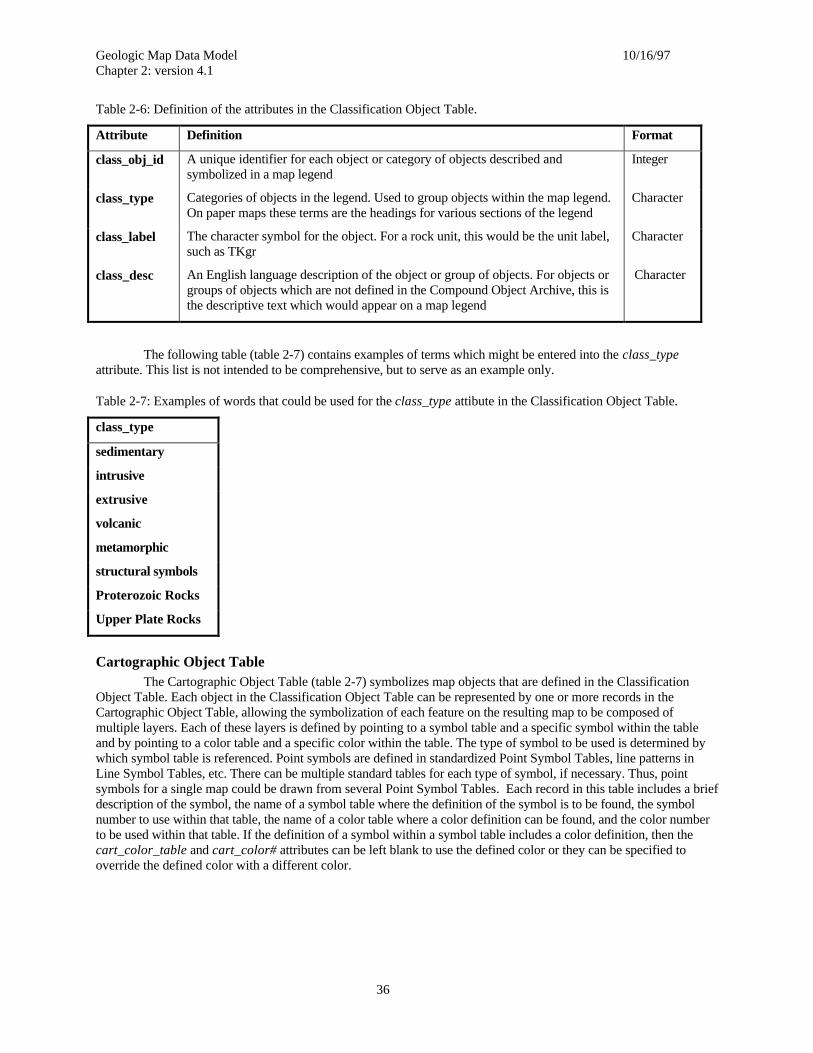
Geologic Map Data Model 10/16/97Chapter 2: version 4.1
36
Table 2-6: Definition of the attributes in the Classification Object Table.
Attribute Definition Format
class_obj_id A unique identifier for each object or category of objects described andsymbolized in a map legend
Integer
class_type Categories of objects in the legend. Used to group objects within the map legend.On paper maps these terms are the headings for various sections of the legend
Character
class_label The character symbol for the object. For a rock unit, this would be the unit label,such as TKgr
Character
class_desc An English language description of the object or group of objects. For objects orgroups of objects which are not defined in the Compound Object Archive, this isthe descriptive text which would appear on a map legend
Character
The following table (table 2-7) contains examples of terms which might be entered into the class_typeattribute. This list is not intended to be comprehensive, but to serve as an example only.
Table 2-7: Examples of words that could be used for the class_type attibute in the Classification Object Table.
class_type
sedimentary
intrusive
extrusive
volcanic
metamorphic
structural symbols
Proterozoic Rocks
Upper Plate Rocks
Cartographic Object TableThe Cartographic Object Table (table 2-7) symbolizes map objects that are defined in the Classification
Object Table. Each object in the Classification Object Table can be represented by one or more records in theCartographic Object Table, allowing the symbolization of each feature on the resulting map to be composed ofmultiple layers. Each of these layers is defined by pointing to a symbol table and a specific symbol within the tableand by pointing to a color table and a specific color within the table. The type of symbol to be used is determined bywhich symbol table is referenced. Point symbols are defined in standardized Point Symbol Tables, line patterns inLine Symbol Tables, etc. There can be multiple standard tables for each type of symbol, if necessary. Thus, pointsymbols for a single map could be drawn from several Point Symbol Tables. Each record in this table includes a briefdescription of the symbol, the name of a symbol table where the definition of the symbol is to be found, the symbolnumber to use within that table, the name of a color table where a color definition can be found, and the color numberto be used within that table. If the definition of a symbol within a symbol table includes a color definition, then thecart_color_table and cart_color# attributes can be left blank to use the defined color or they can be specified tooverride the defined color with a different color.
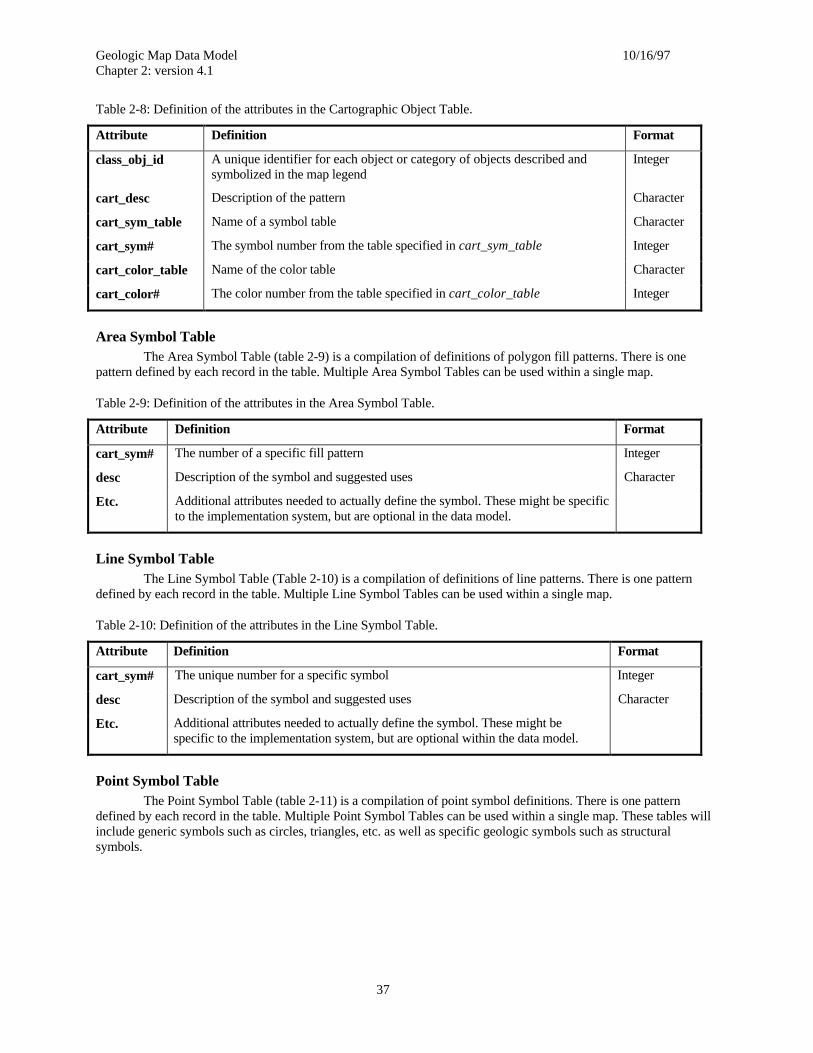
Geologic Map Data Model 10/16/97Chapter 2: version 4.1
37
Table 2-8: Definition of the attributes in the Cartographic Object Table.
Attribute Definition Fo rmat
class_obj_id A unique identifier for each object or category of objects described andsymbolized in the map legend
Integer
cart_desc Description of the pattern Character
cart_sym_table Name of a symbol table Character
cart_sym# The symbol number from the table specified in cart_sym_table Integer
cart_color_table Name of the color table Character
cart_color# The color number from the table specified in cart_color_table Integer
Area Symbol TableThe Area Symbol Table (table 2-9) is a compilation of definitions of polygon fill patterns. There is one
pattern defined by each record in the table. Multiple Area Symbol Tables can be used within a single map.
Table 2-9: Definition of the attributes in the Area Symbol Table.
Attribute Definition Format
cart_sym# The number of a specific fill pattern Integer
desc Description of the symbol and suggested uses Character
Etc. Additional attributes needed to actually define the symbol. These might be specificto the implementation system, but are optional in the data model.
Line Symbol TableThe Line Symbol Table (Table 2-10) is a compilation of definitions of line patterns. There is one pattern
defined by each record in the table. Multiple Line Symbol Tables can be used within a single map.
Table 2-10: Definition of the attributes in the Line Symbol Table.
Attribute Definition Format
cart_sym# The unique number for a specific symbol Integer
desc Description of the symbol and suggested uses Character
Etc. Additional attributes needed to actually define the symbol. These might bespecific to the implementation system, but are optional within the data model.
Point Symbol TableThe Point Symbol Table (table 2-11) is a compilation of point symbol definitions. There is one pattern
defined by each record in the table. Multiple Point Symbol Tables can be used within a single map. These tables willinclude generic symbols such as circles, triangles, etc. as well as specific geologic symbols such as structuralsymbols.

Geologic Map Data Model 10/16/97Chapter 2: version 4.1
38
Table 2-11: Definition of the attributes in the Point Symbol Table.
Attribute Definition Format
cart_sym# The unique number for a specific symbol Integer
desc Description of the symbol and suggested uses. Character
Etc. Additional attributes needed to actually define the symbol. These might bespecific to the implementation system, but are optional within the data model.
Color TableThe Color Table (table 2-12) is a compilation of definitions of symbol colors. There is one display color
defined by each record in the table. Multiple Color Tables can be used within a single map.
Table 2-12: Definition of the attributes in the Color Table.
Attribute Definition Fo rmat
cart_color# The unique number for a specific color Integer
CMYK Definition of color in cyan-magenta-yellow-black coordinates Character
RGB Definition of color in red-green-blue coordinates Character
Etc. Additional attributes needed to define the color. These might be specific to theimplementation system. But are optional within the data model.
Data Classification TableThe Data Classification Table (table 2-13) is a correlation table that joins the Classification Object Table to
the Compound Object Archive (COA Table). Because there is a many-to-many relationship between the ClassificationObject Table and the COA Table, an intermediate table is required to correlate the entries in one table to the entries inthe other. For example, a single entry in the Classification Object Table (map legend), such as a rock unit, may refer tomore than one unit in the COA Table. This would be the case where a single rock unit on the current map is defined asincluding several units from the archive. Similarly, a single unit record in the COA Table may be included in morethan one Classification Object. For example, a single fault may be represented on more than one map. In addition to itscorrelation function, which is handled by the two key attributes, class_obj_id and coa_id, this table has two additionalfunctions: sequencing multiple units within a Classification Object and indicating the relative abundance of multipleunits. If a map legend item (Classification Object) includes more than one object from the COA Table, the sequence inwhich those units appear in the legend description may be defined using the data_seq# attribute. In addition, therelative volume importance of those units may be defined by the percent and quality attributes. The percent attributeis used to specify the volume percent of the combined legend item that is represented by each individual unit makingup the item and the quality attribute is used to specify the quality of the volume estimate. The percent and qualityattributes are discussed more fully in the COA Tables from which they are derived.
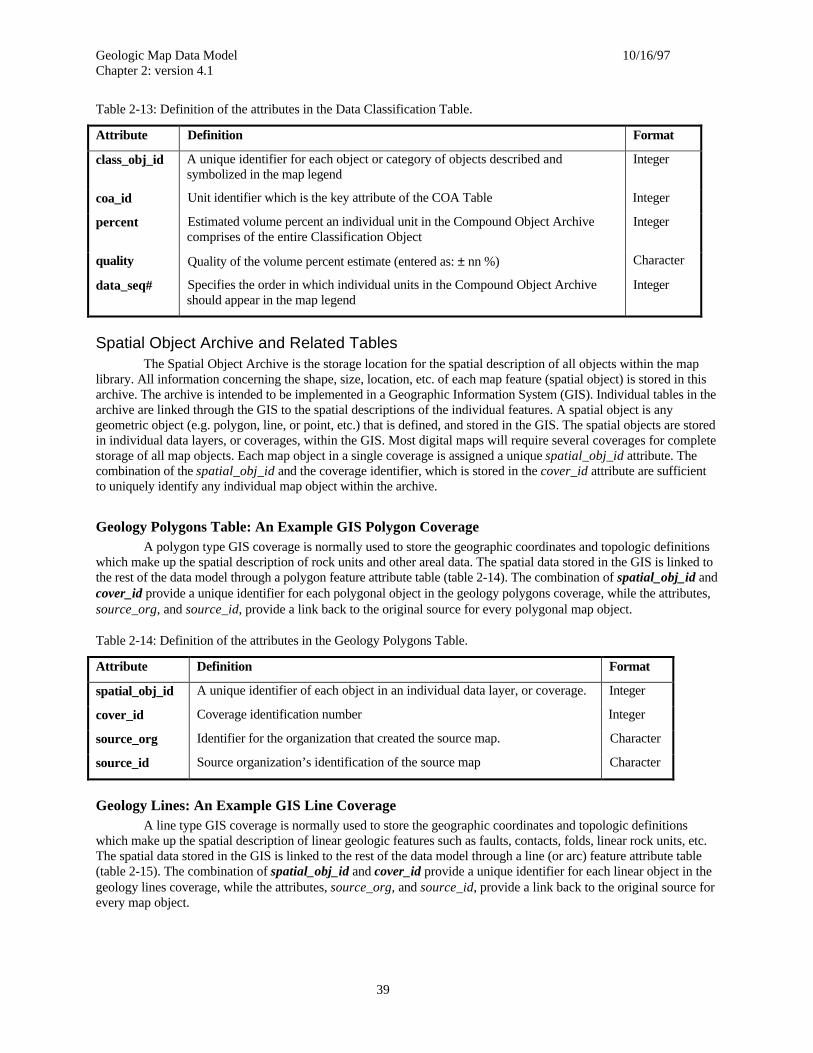
Geologic Map Data Model 10/16/97Chapter 2: version 4.1
39
Table 2-13: Definition of the attributes in the Data Classification Table.
Attribute Definition Fo rmat
class_obj_id A unique identifier for each object or category of objects described andsymbolized in the map legend
Integer
coa_id Unit identifier which is the key attribute of the COA Table Integer
percent Estimated volume percent an individual unit in the Compound Object Archivecomprises of the entire Classification Object
Integer
quality Quality of the volume percent estimate (entered as: ± nn %) Character
data_seq# Specifies the order in which individual units in the Compound Object Archiveshould appear in the map legend
Integer
Spatial Object Archive and Related TablesThe Spatial Object Archive is the storage location for the spatial description of all objects within the map
library. All information concerning the shape, size, location, etc. of each map feature (spatial object) is stored in thisarchive. The archive is intended to be implemented in a Geographic Information System (GIS). Individual tables in thearchive are linked through the GIS to the spatial descriptions of the individual features. A spatial object is anygeometric object (e.g. polygon, line, or point, etc.) that is defined, and stored in the GIS. The spatial objects are storedin individual data layers, or coverages, within the GIS. Most digital maps will require several coverages for completestorage of all map objects. Each map object in a single coverage is assigned a unique spatial_obj_id attribute. Thecombination of the spatial_obj_id and the coverage identifier, which is stored in the cover_id attribute are sufficientto uniquely identify any individual map object within the archive.
Geology Polygons Table: An Example GIS Polygon CoverageA polygon type GIS coverage is normally used to store the geographic coordinates and topologic definitions
which make up the spatial description of rock units and other areal data. The spatial data stored in the GIS is linked tothe rest of the data model through a polygon feature attribute table (table 2-14). The combination of spatial_obj_id andcover_id provide a unique identifier for each polygonal object in the geology polygons coverage, while the attributes,source_org, and source_id, provide a link back to the original source for every polygonal map object.
Table 2-14: Definition of the attributes in the Geology Polygons Table.
Attribute Definition Format
spatial_obj_id A unique identifier of each object in an individual data layer, or coverage.Integer
cover_id Coverage identification number Integer
source_org Identifier for the organization that created the source map. Character
source_id Source organization’s identification of the source map Character
Geology Lines: An Example GIS Line CoverageA line type GIS coverage is normally used to store the geographic coordinates and topologic definitions
which make up the spatial description of linear geologic features such as faults, contacts, folds, linear rock units, etc.The spatial data stored in the GIS is linked to the rest of the data model through a line (or arc) feature attribute table(table 2-15). The combination of spatial_obj_id and cover_id provide a unique identifier for each linear object in thegeology lines coverage, while the attributes, source_org, and source_id, provide a link back to the original source forevery map object.
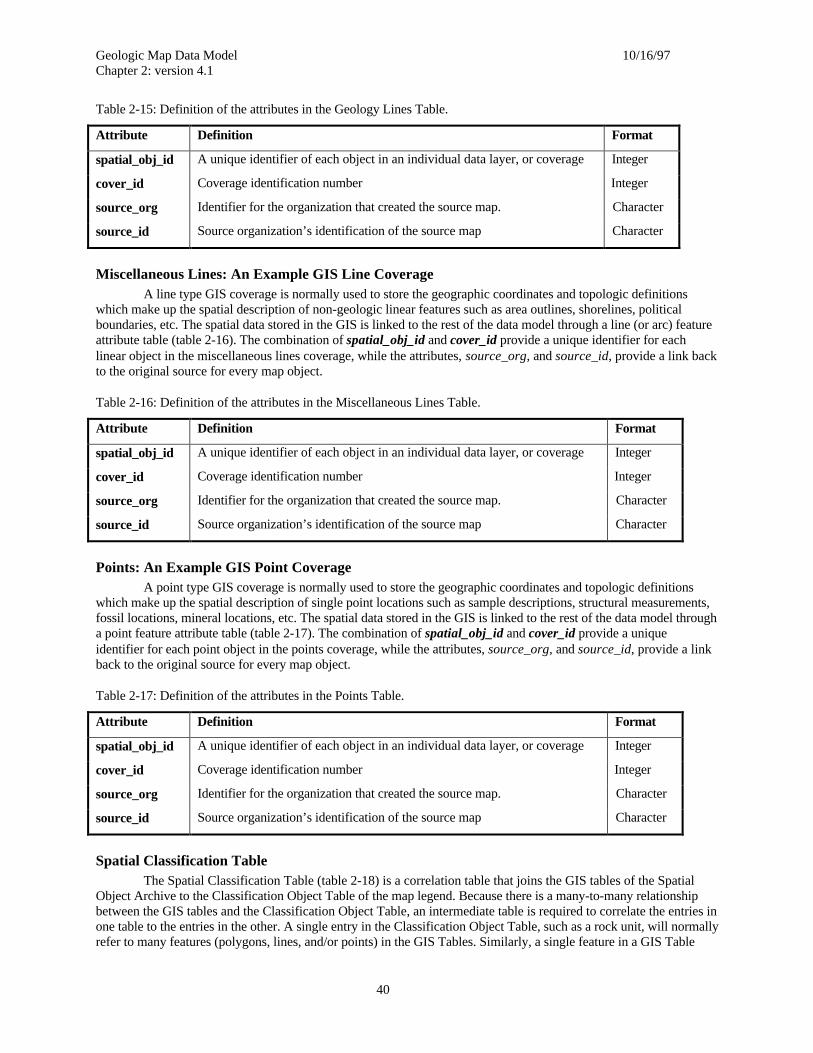
Geologic Map Data Model 10/16/97Chapter 2: version 4.1
40
Table 2-15: Definition of the attributes in the Geology Lines Table.
Attribute Definition Format
spatial_obj_id A unique identifier of each object in an individual data layer, or coverageInteger
cover_id Coverage identification number Integer
source_org Identifier for the organization that created the source map. Character
source_id Source organization’s identification of the source map Character
Miscellaneous Lines: An Example GIS Line CoverageA line type GIS coverage is normally used to store the geographic coordinates and topologic definitions
which make up the spatial description of non-geologic linear features such as area outlines, shorelines, politicalboundaries, etc. The spatial data stored in the GIS is linked to the rest of the data model through a line (or arc) featureattribute table (table 2-16). The combination of spatial_obj_id and cover_id provide a unique identifier for eachlinear object in the miscellaneous lines coverage, while the attributes, source_org, and source_id, provide a link backto the original source for every map object.
Table 2-16: Definition of the attributes in the Miscellaneous Lines Table.
Attribute Definition Format
spatial_obj_id A unique identifier of each object in an individual data layer, or coverageInteger
cover_id Coverage identification number Integer
source_org Identifier for the organization that created the source map. Character
source_id Source organization’s identification of the source map Character
Points: An Example GIS Point CoverageA point type GIS coverage is normally used to store the geographic coordinates and topologic definitions
which make up the spatial description of single point locations such as sample descriptions, structural measurements,fossil locations, mineral locations, etc. The spatial data stored in the GIS is linked to the rest of the data model througha point feature attribute table (table 2-17). The combination of spatial_obj_id and cover_id provide a uniqueidentifier for each point object in the points coverage, while the attributes, source_org, and source_id, provide a linkback to the original source for every map object.
Table 2-17: Definition of the attributes in the Points Table.
Attribute Definition Format
spatial_obj_id A unique identifier of each object in an individual data layer, or coverageInteger
cover_id Coverage identification number Integer
source_org Identifier for the organization that created the source map. Character
source_id Source organization’s identification of the source map Character
Spatial Classification TableThe Spatial Classification Table (table 2-18) is a correlation table that joins the GIS tables of the Spatial
Object Archive to the Classification Object Table of the map legend. Because there is a many-to-many relationshipbetween the GIS tables and the Classification Object Table, an intermediate table is required to correlate the entries inone table to the entries in the other. A single entry in the Classification Object Table, such as a rock unit, will normallyrefer to many features (polygons, lines, and/or points) in the GIS Tables. Similarly, a single feature in a GIS Table
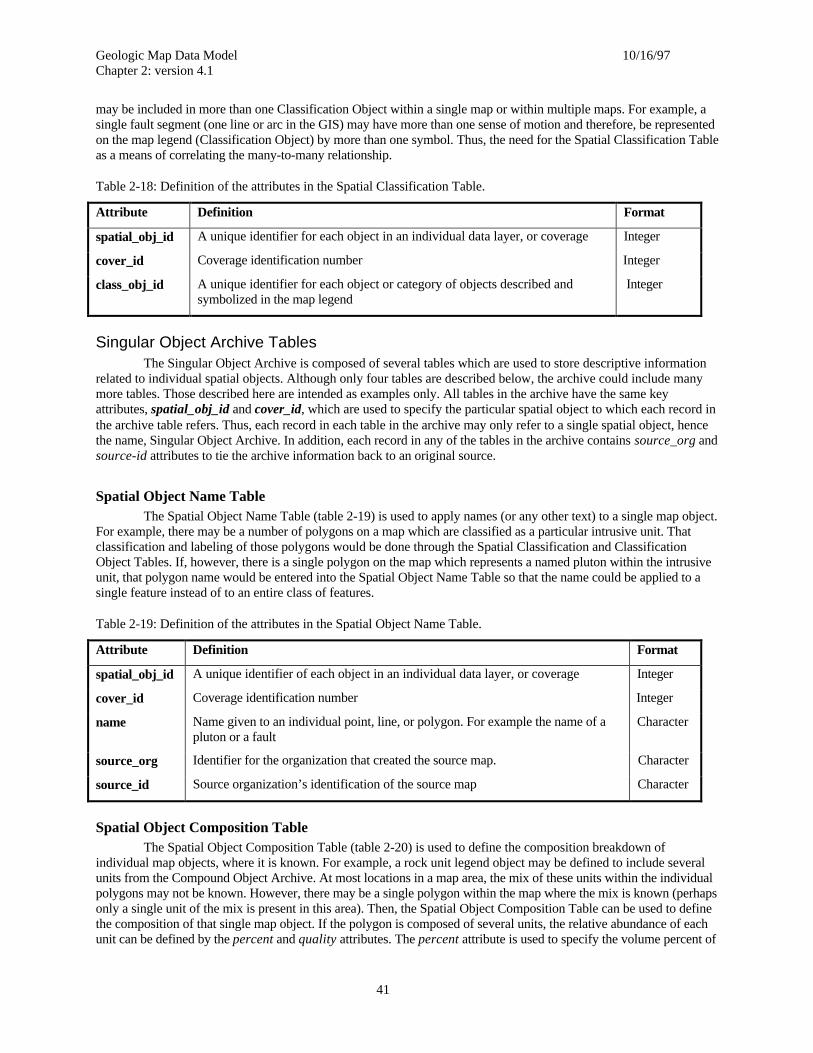
Geologic Map Data Model 10/16/97Chapter 2: version 4.1
41
may be included in more than one Classification Object within a single map or within multiple maps. For example, asingle fault segment (one line or arc in the GIS) may have more than one sense of motion and therefore, be representedon the map legend (Classification Object) by more than one symbol. Thus, the need for the Spatial Classification Tableas a means of correlating the many-to-many relationship.
Table 2-18: Definition of the attributes in the Spatial Classification Table.
Attribute Definition Format
spatial_obj_id A unique identifier for each object in an individual data layer, or coverageInteger
cover_id Coverage identification number Integer
class_obj_id A unique identifier for each object or category of objects described andsymbolized in the map legend
Integer
Singular Object Archive TablesThe Singular Object Archive is composed of several tables which are used to store descriptive information
related to individual spatial objects. Although only four tables are described below, the archive could include manymore tables. Those described here are intended as examples only. All tables in the archive have the same keyattributes, spatial_obj_id and cover_id, which are used to specify the particular spatial object to which each record inthe archive table refers. Thus, each record in each table in the archive may only refer to a single spatial object, hencethe name, Singular Object Archive. In addition, each record in any of the tables in the archive contains source_org andsource-id attributes to tie the archive information back to an original source.
Spatial Object Name TableThe Spatial Object Name Table (table 2-19) is used to apply names (or any other text) to a single map object.
For example, there may be a number of polygons on a map which are classified as a particular intrusive unit. Thatclassification and labeling of those polygons would be done through the Spatial Classification and ClassificationObject Tables. If, however, there is a single polygon on the map which represents a named pluton within the intrusiveunit, that polygon name would be entered into the Spatial Object Name Table so that the name could be applied to asingle feature instead of to an entire class of features.
Table 2-19: Definition of the attributes in the Spatial Object Name Table.
Attribute Definition Format
spatial_obj_id A unique identifier of each object in an individual data layer, or coverage Integer
cover_id Coverage identification number Integer
name Name given to an individual point, line, or polygon. For example the name of apluton or a fault
Character
source_org Identifier for the organization that created the source map. Character
source_id Source organization’s identification of the source map Character
Spatial Object Composition TableThe Spatial Object Composition Table (table 2-20) is used to define the composition breakdown of
individual map objects, where it is known. For example, a rock unit legend object may be defined to include severalunits from the Compound Object Archive. At most locations in a map area, the mix of these units within the individualpolygons may not be known. However, there may be a single polygon within the map where the mix is known (perhapsonly a single unit of the mix is present in this area). Then, the Spatial Object Composition Table can be used to definethe composition of that single map object. If the polygon is composed of several units, the relative abundance of eachunit can be defined by the percent and quality attributes. The percent attribute is used to specify the volume percent of
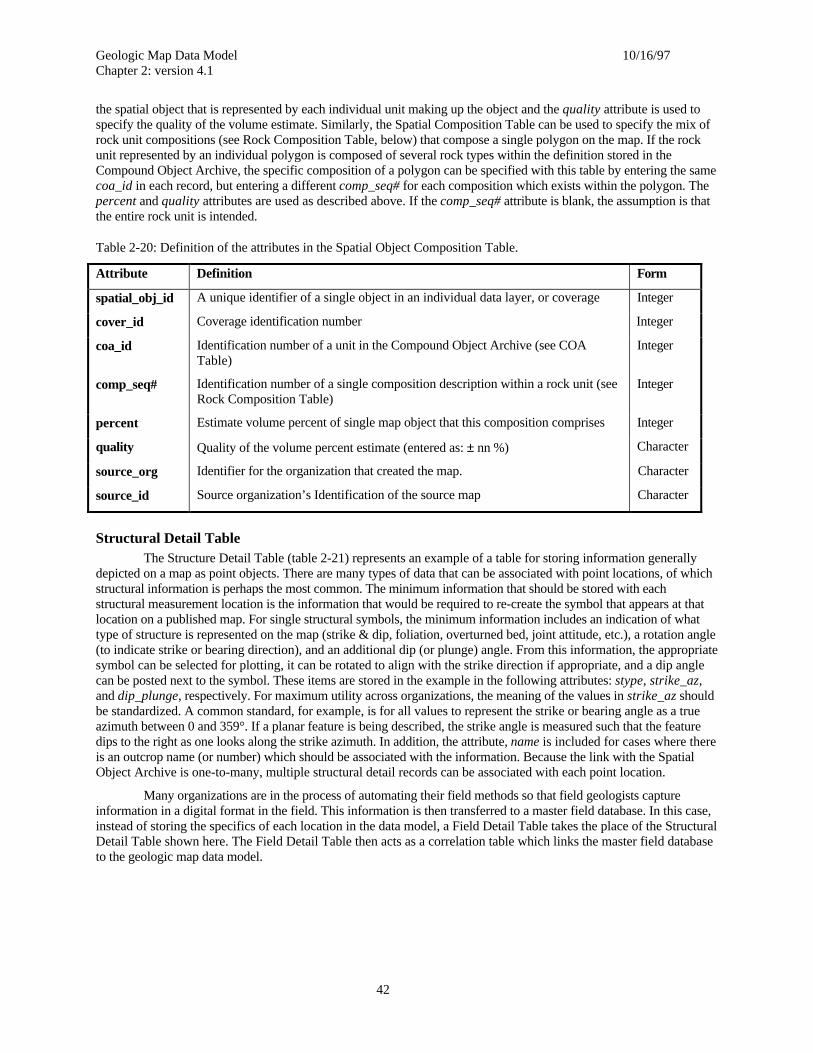
Geologic Map Data Model 10/16/97Chapter 2: version 4.1
42
the spatial object that is represented by each individual unit making up the object and the quality attribute is used tospecify the quality of the volume estimate. Similarly, the Spatial Composition Table can be used to specify the mix ofrock unit compositions (see Rock Composition Table, below) that compose a single polygon on the map. If the rockunit represented by an individual polygon is composed of several rock types within the definition stored in theCompound Object Archive, the specific composition of a polygon can be specified with this table by entering the samecoa_id in each record, but entering a different comp_seq# for each composition which exists within the polygon. Thepercent and quality attributes are used as described above. If the comp_seq# attribute is blank, the assumption is thatthe entire rock unit is intended.
Table 2-20: Definition of the attributes in the Spatial Object Composition Table.
Attribute Definition Form
spatial_obj_id A unique identifier of a single object in an individual data layer, or coverage Integer
cover_id Coverage identification number Integer
coa_id Identification number of a unit in the Compound Object Archive (see COATable)
Integer
comp_seq# Identification number of a single composition description within a rock unit (seeRock Composition Table)
Integer
percent Estimate volume percent of single map object that this composition comprisesInteger
quality Quality of the volume percent estimate (entered as: ± nn %) Character
source_org Identifier for the organization that created the map. Character
source_id Source organization’s Identification of the source map Character
Structural Detail TableThe Structure Detail Table (table 2-21) represents an example of a table for storing information generally
depicted on a map as point objects. There are many types of data that can be associated with point locations, of whichstructural information is perhaps the most common. The minimum information that should be stored with eachstructural measurement location is the information that would be required to re-create the symbol that appears at thatlocation on a published map. For single structural symbols, the minimum information includes an indication of whattype of structure is represented on the map (strike & dip, foliation, overturned bed, joint attitude, etc.), a rotation angle(to indicate strike or bearing direction), and an additional dip (or plunge) angle. From this information, the appropriatesymbol can be selected for plotting, it can be rotated to align with the strike direction if appropriate, and a dip anglecan be posted next to the symbol. These items are stored in the example in the following attributes: stype, strike_az,and dip_plunge, respectively. For maximum utility across organizations, the meaning of the values in strike_az shouldbe standardized. A common standard, for example, is for all values to represent the strike or bearing angle as a trueazimuth between 0 and 359°. If a planar feature is being described, the strike angle is measured such that the featuredips to the right as one looks along the strike azimuth. In addition, the attribute, name is included for cases where thereis an outcrop name (or number) which should be associated with the information. Because the link with the SpatialObject Archive is one-to-many, multiple structural detail records can be associated with each point location.
Many organizations are in the process of automating their field methods so that field geologists captureinformation in a digital format in the field. This information is then transferred to a master field database. In this case,instead of storing the specifics of each location in the data model, a Field Detail Table takes the place of the StructuralDetail Table shown here. The Field Detail Table then acts as a correlation table which links the master field databaseto the geologic map data model.
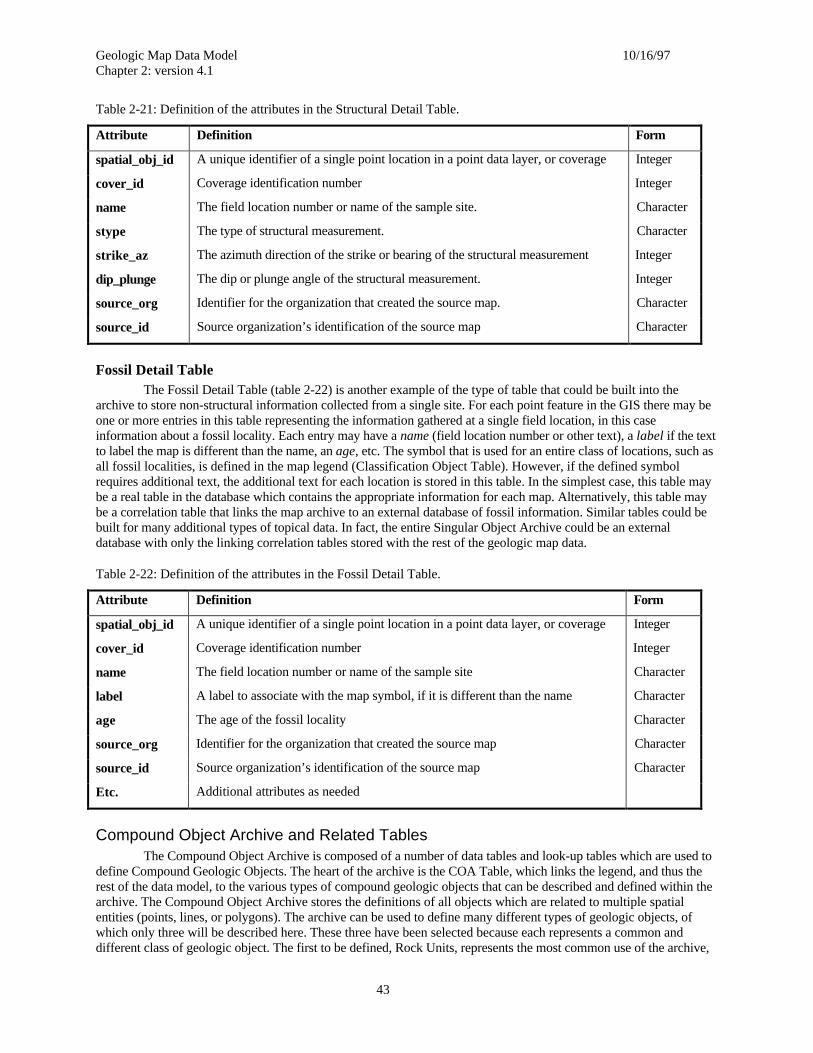
Geologic Map Data Model 10/16/97Chapter 2: version 4.1
43
Table 2-21: Definition of the attributes in the Structural Detail Table.
Attribute Definition Form
spatial_obj_id A unique identifier of a single point location in a point data layer, or coverageInteger
cover_id Coverage identification number Integer
name The field location number or name of the sample site. Character
stype The type of structural measurement. Character
strike_az The azimuth direction of the strike or bearing of the structural measurement Integer
dip_plunge The dip or plunge angle of the structural measurement. Integer
source_org Identifier for the organization that created the source map. Character
source_id Source organization’s identification of the source map Character
Fossil Detail TableThe Fossil Detail Table (table 2-22) is another example of the type of table that could be built into the
archive to store non-structural information collected from a single site. For each point feature in the GIS there may beone or more entries in this table representing the information gathered at a single field location, in this caseinformation about a fossil locality. Each entry may have a name (field location number or other text), a label if the textto label the map is different than the name, an age, etc. The symbol that is used for an entire class of locations, such asall fossil localities, is defined in the map legend (Classification Object Table). However, if the defined symbolrequires additional text, the additional text for each location is stored in this table. In the simplest case, this table maybe a real table in the database which contains the appropriate information for each map. Alternatively, this table maybe a correlation table that links the map archive to an external database of fossil information. Similar tables could bebuilt for many additional types of topical data. In fact, the entire Singular Object Archive could be an externaldatabase with only the linking correlation tables stored with the rest of the geologic map data.
Table 2-22: Definition of the attributes in the Fossil Detail Table.
Attribute Definition Form
spatial_obj_id A unique identifier of a single point location in a point data layer, or coverageInteger
cover_id Coverage identification number Integer
name The field location number or name of the sample site Character
label A label to associate with the map symbol, if it is different than the name Character
age The age of the fossil locality Character
source_org Identifier for the organization that created the source map Character
source_id Source organization’s identification of the source map Character
Etc. Additional attributes as needed
Compound Object Archive and Related TablesThe Compound Object Archive is composed of a number of data tables and look-up tables which are used to
define Compound Geologic Objects. The heart of the archive is the COA Table, which links the legend, and thus therest of the data model, to the various types of compound geologic objects that can be described and defined within thearchive. The Compound Object Archive stores the definitions of all objects which are related to multiple spatialentities (points, lines, or polygons). The archive can be used to define many different types of geologic objects, ofwhich only three will be described here. These three have been selected because each represents a common anddifferent class of geologic object. The first to be defined, Rock Units, represents the most common use of the archive,
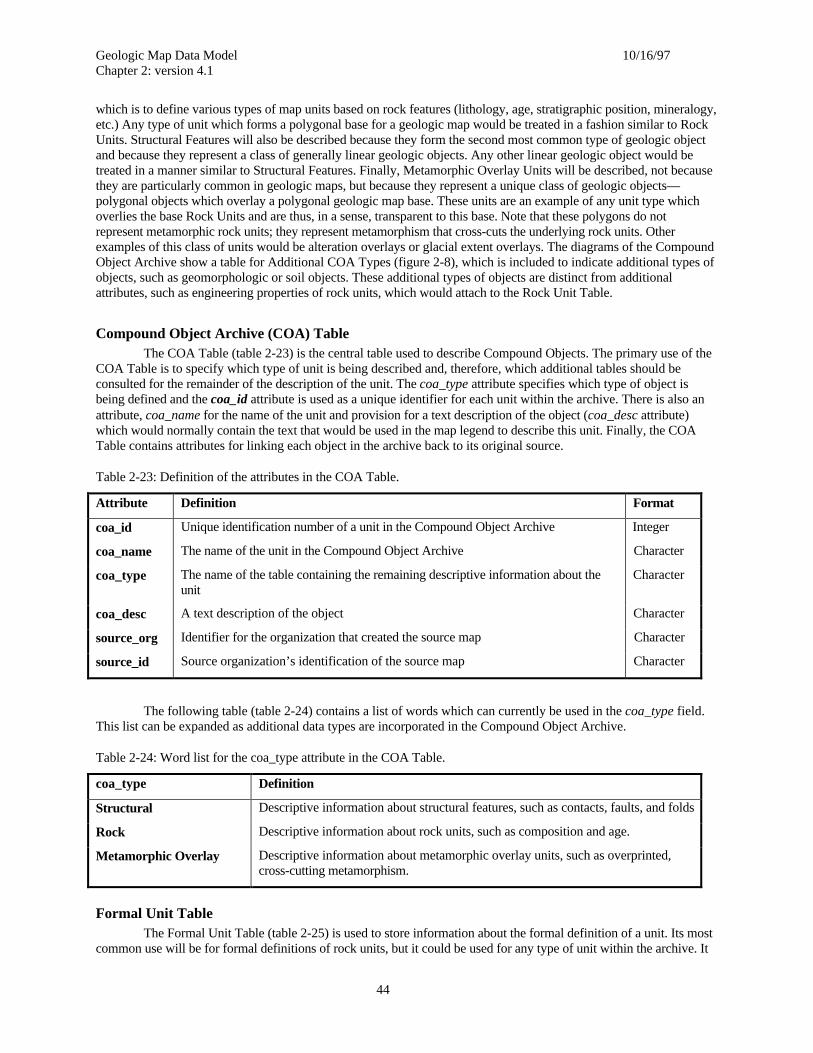
Geologic Map Data Model 10/16/97Chapter 2: version 4.1
44
which is to define various types of map units based on rock features (lithology, age, stratigraphic position, mineralogy,etc.) Any type of unit which forms a polygonal base for a geologic map would be treated in a fashion similar to RockUnits. Structural Features will also be described because they form the second most common type of geologic objectand because they represent a class of generally linear geologic objects. Any other linear geologic object would betreated in a manner similar to Structural Features. Finally, Metamorphic Overlay Units will be described, not becausethey are particularly common in geologic maps, but because they represent a unique class of geologic objects—polygonal objects which overlay a polygonal geologic map base. These units are an example of any unit type whichoverlies the base Rock Units and are thus, in a sense, transparent to this base. Note that these polygons do notrepresent metamorphic rock units; they represent metamorphism that cross-cuts the underlying rock units. Otherexamples of this class of units would be alteration overlays or glacial extent overlays. The diagrams of the CompoundObject Archive show a table for Additional COA Types (figure 2-8), which is included to indicate additional types ofobjects, such as geomorphologic or soil objects. These additional types of objects are distinct from additionalattributes, such as engineering properties of rock units, which would attach to the Rock Unit Table.
Compound Object Archive (COA) TableThe COA Table (table 2-23) is the central table used to describe Compound Objects. The primary use of the
COA Table is to specify which type of unit is being described and, therefore, which additional tables should beconsulted for the remainder of the description of the unit. The coa_type attribute specifies which type of object isbeing defined and the coa_id attribute is used as a unique identifier for each unit within the archive. There is also anattribute, coa_name for the name of the unit and provision for a text description of the object (coa_desc attribute)which would normally contain the text that would be used in the map legend to describe this unit. Finally, the COATable contains attributes for linking each object in the archive back to its original source.
Table 2-23: Definition of the attributes in the COA Table.
Attribute Definition Fo rmat
coa_id Unique identification number of a unit in the Compound Object Archive Integer
coa_name The name of the unit in the Compound Object Archive Character
coa_type The name of the table containing the remaining descriptive information about theunit
Character
coa_desc A text description of the object Character
source_org Identifier for the organization that created the source map Character
source_id Source organization’s identification of the source map Character
The following table (table 2-24) contains a list of words which can currently be used in the coa_type field.This list can be expanded as additional data types are incorporated in the Compound Object Archive.
Table 2-24: Word list for the coa_type attribute in the COA Table.
coa_type Definition
Structural Descriptive information about structural features, such as contacts, faults, and folds
Rock Descriptive information about rock units, such as composition and age.
Metamorphic Overlay Descriptive information about metamorphic overlay units, such as overprinted,cross-cutting metamorphism.
Formal Unit TableThe Formal Unit Table (table 2-25) is used to store information about the formal definition of a unit. Its most
common use will be for formal definitions of rock units, but it could be used for any type of unit within the archive. It
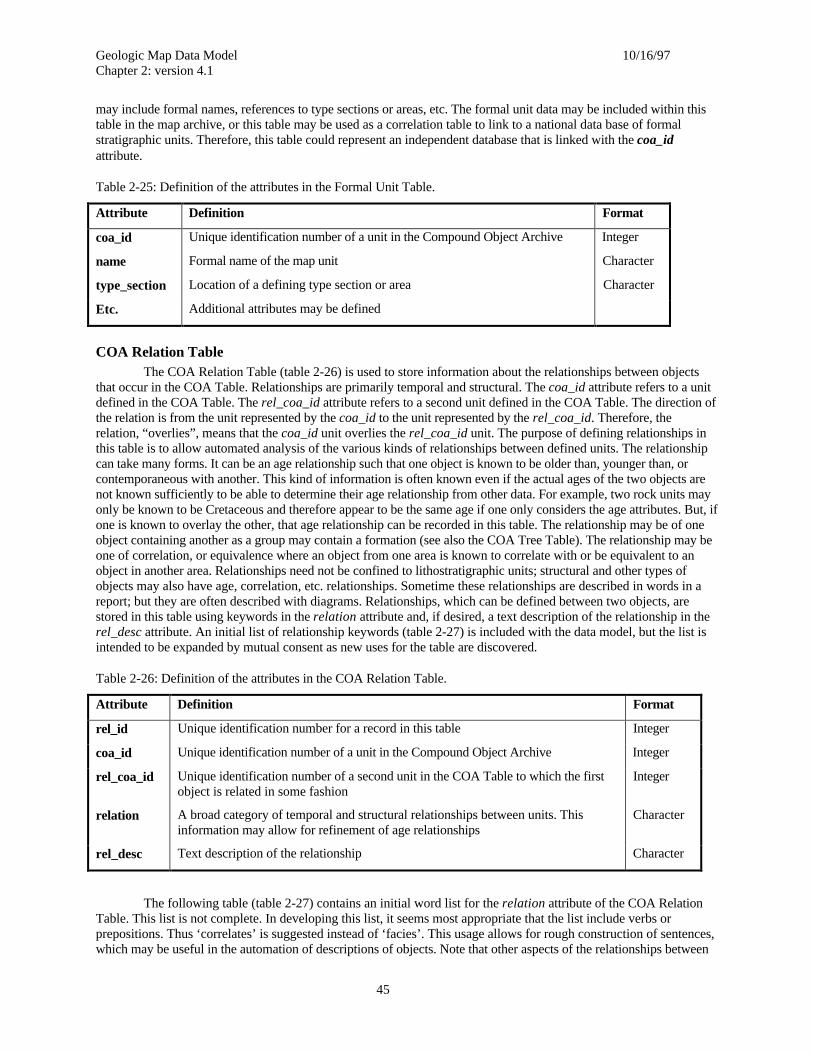
Geologic Map Data Model 10/16/97Chapter 2: version 4.1
45
may include formal names, references to type sections or areas, etc. The formal unit data may be included within thistable in the map archive, or this table may be used as a correlation table to link to a national data base of formalstratigraphic units. Therefore, this table could represent an independent database that is linked with the coa_idattribute.
Table 2-25: Definition of the attributes in the Formal Unit Table.
Attribute Definition Format
coa_id Unique identification number of a unit in the Compound Object Archive Integer
name Formal name of the map unit Character
type_section Location of a defining type section or area Character
Etc. Additional attributes may be defined
COA Relation TableThe COA Relation Table (table 2-26) is used to store information about the relationships between objects
that occur in the COA Table. Relationships are primarily temporal and structural. The coa_id attribute refers to a unitdefined in the COA Table. The rel_coa_id attribute refers to a second unit defined in the COA Table. The direction ofthe relation is from the unit represented by the coa_id to the unit represented by the rel_coa_id. Therefore, therelation, “overlies”, means that the coa_id unit overlies the rel_coa_id unit. The purpose of defining relationships inthis table is to allow automated analysis of the various kinds of relationships between defined units. The relationshipcan take many forms. It can be an age relationship such that one object is known to be older than, younger than, orcontemporaneous with another. This kind of information is often known even if the actual ages of the two objects arenot known sufficiently to be able to determine their age relationship from other data. For example, two rock units mayonly be known to be Cretaceous and therefore appear to be the same age if one only considers the age attributes. But, ifone is known to overlay the other, that age relationship can be recorded in this table. The relationship may be of oneobject containing another as a group may contain a formation (see also the COA Tree Table). The relationship may beone of correlation, or equivalence where an object from one area is known to correlate with or be equivalent to anobject in another area. Relationships need not be confined to lithostratigraphic units; structural and other types ofobjects may also have age, correlation, etc. relationships. Sometime these relationships are described in words in areport; but they are often described with diagrams. Relationships, which can be defined between two objects, arestored in this table using keywords in the relation attribute and, if desired, a text description of the relationship in therel_desc attribute. An initial list of relationship keywords (table 2-27) is included with the data model, but the list isintended to be expanded by mutual consent as new uses for the table are discovered.
Table 2-26: Definition of the attributes in the COA Relation Table.
Attribute Definition Fo rmat
rel_id Unique identification number for a record in this table Integer
coa_id Unique identification number of a unit in the Compound Object Archive Integer
rel_coa_id Unique identification number of a second unit in the COA Table to which the firstobject is related in some fashion
Integer
relation A broad category of temporal and structural relationships between units. Thisinformation may allow for refinement of age relationships
Character
rel_desc Text description of the relationship Character
The following table (table 2-27) contains an initial word list for the relation attribute of the COA RelationTable. This list is not complete. In developing this list, it seems most appropriate that the list include verbs orprepositions. Thus ‘correlates’ is suggested instead of ‘facies’. This usage allows for rough construction of sentences,which may be useful in the automation of descriptions of objects. Note that other aspects of the relationships between
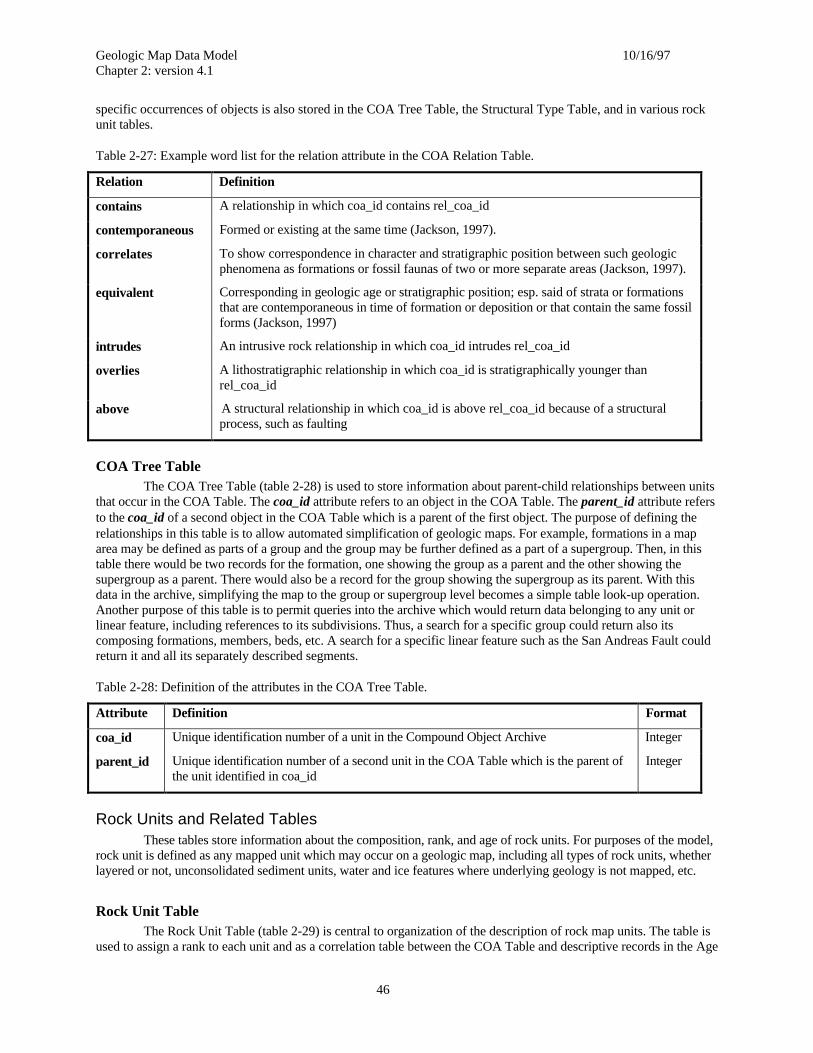
Geologic Map Data Model 10/16/97Chapter 2: version 4.1
46
specific occurrences of objects is also stored in the COA Tree Table, the Structural Type Table, and in various rockunit tables.
Table 2-27: Example word list for the relation attribute in the COA Relation Table.
Relation Definition
contains A relationship in which coa_id contains rel_coa_id
contemporaneous Formed or existing at the same time (Jackson, 1997).
correlates To show correspondence in character and stratigraphic position between such geologicphenomena as formations or fossil faunas of two or more separate areas (Jackson, 1997).
equivalent Corresponding in geologic age or stratigraphic position; esp. said of strata or formationsthat are contemporaneous in time of formation or deposition or that contain the same fossilforms (Jackson, 1997)
intrudes An intrusive rock relationship in which coa_id intrudes rel_coa_id
overlies A lithostratigraphic relationship in which coa_id is stratigraphically younger thanrel_coa_id
above A structural relationship in which coa_id is above rel_coa_id because of a structuralprocess, such as faulting
COA Tree TableThe COA Tree Table (table 2-28) is used to store information about parent-child relationships between units
that occur in the COA Table. The coa_id attribute refers to an object in the COA Table. The parent_id attribute refersto the coa_id of a second object in the COA Table which is a parent of the first object. The purpose of defining therelationships in this table is to allow automated simplification of geologic maps. For example, formations in a maparea may be defined as parts of a group and the group may be further defined as a part of a supergroup. Then, in thistable there would be two records for the formation, one showing the group as a parent and the other showing thesupergroup as a parent. There would also be a record for the group showing the supergroup as its parent. With thisdata in the archive, simplifying the map to the group or supergroup level becomes a simple table look-up operation.Another purpose of this table is to permit queries into the archive which would return data belonging to any unit orlinear feature, including references to its subdivisions. Thus, a search for a specific group could return also itscomposing formations, members, beds, etc. A search for a specific linear feature such as the San Andreas Fault couldreturn it and all its separately described segments.
Table 2-28: Definition of the attributes in the COA Tree Table.
Attribute Definition Format
coa_id Unique identification number of a unit in the Compound Object Archive Integer
parent_id Unique identification number of a second unit in the COA Table which is the parent ofthe unit identified in coa_id
Integer
Rock Units and Related TablesThese tables store information about the composition, rank, and age of rock units. For purposes of the model,
rock unit is defined as any mapped unit which may occur on a geologic map, including all types of rock units, whetherlayered or not, unconsolidated sediment units, water and ice features where underlying geology is not mapped, etc.
Rock Unit TableThe Rock Unit Table (table 2-29) is central to organization of the description of rock map units. The table is
used to assign a rank to each unit and as a correlation table between the COA Table and descriptive records in the Age
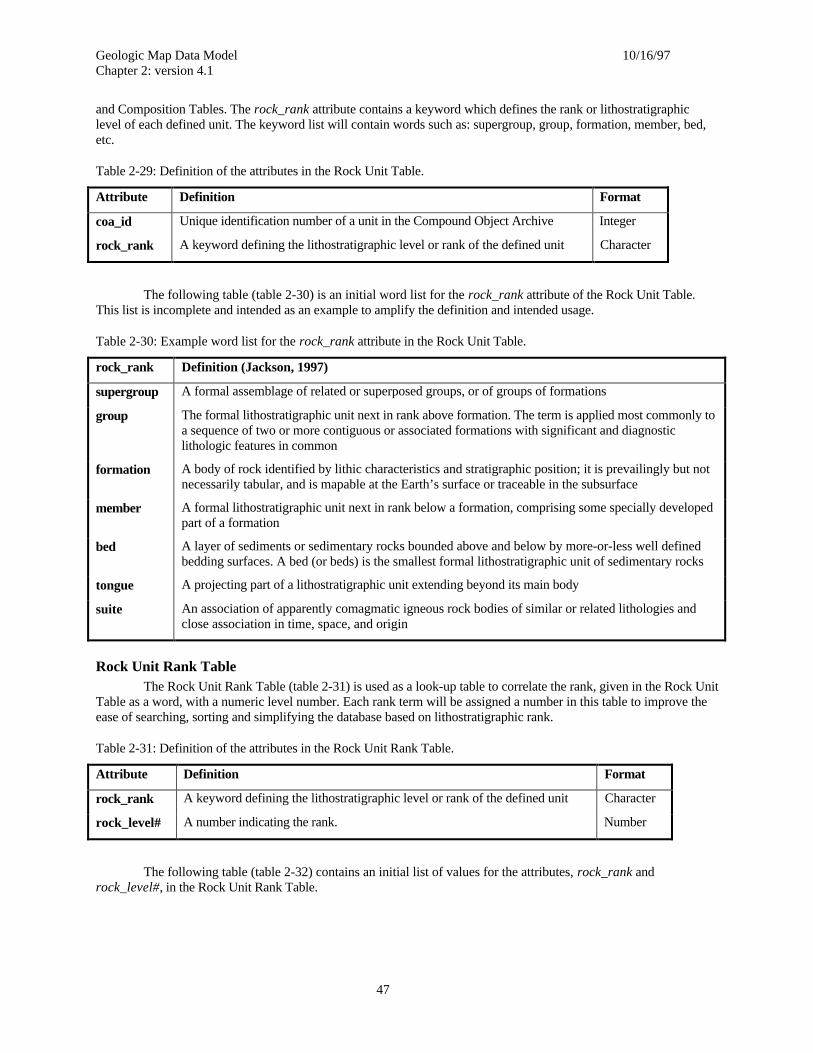
Geologic Map Data Model 10/16/97Chapter 2: version 4.1
47
and Composition Tables. The rock_rank attribute contains a keyword which defines the rank or lithostratigraphiclevel of each defined unit. The keyword list will contain words such as: supergroup, group, formation, member, bed,etc.
Table 2-29: Definition of the attributes in the Rock Unit Table.
Attribute Definition Fo rmat
coa_id Unique identification number of a unit in the Compound Object Archive Integer
rock_rank A keyword defining the lithostratigraphic level or rank of the defined unit Character
The following table (table 2-30) is an initial word list for the rock_rank attribute of the Rock Unit Table.This list is incomplete and intended as an example to amplify the definition and intended usage.
Table 2-30: Example word list for the rock_rank attribute in the Rock Unit Table.
rock_rank Definition (Jackson, 1997)
supergroup A formal assemblage of related or superposed groups, or of groups of formations
group The formal lithostratigraphic unit next in rank above formation. The term is applied most commonly toa sequence of two or more contiguous or associated formations with significant and diagnosticlithologic features in common
formation A body of rock identified by lithic characteristics and stratigraphic position; it is prevailingly but notnecessarily tabular, and is mapable at the Earth’s surface or traceable in the subsurface
member A formal lithostratigraphic unit next in rank below a formation, comprising some specially developedpart of a formation
bed A layer of sediments or sedimentary rocks bounded above and below by more-or-less well definedbedding surfaces. A bed (or beds) is the smallest formal lithostratigraphic unit of sedimentary rocks
tongue A projecting part of a lithostratigraphic unit extending beyond its main body
suite An association of apparently comagmatic igneous rock bodies of similar or related lithologies andclose association in time, space, and origin
Rock Unit Rank TableThe Rock Unit Rank Table (table 2-31) is used as a look-up table to correlate the rank, given in the Rock Unit
Table as a word, with a numeric level number. Each rank term will be assigned a number in this table to improve theease of searching, sorting and simplifying the database based on lithostratigraphic rank.
Table 2-31: Definition of the attributes in the Rock Unit Rank Table.
Attribute Definition Format
rock_rank A keyword defining the lithostratigraphic level or rank of the defined unit Character
rock_level# A number indicating the rank. Number
The following table (table 2-32) contains an initial list of values for the attributes, rock_rank androck_level#, in the Rock Unit Rank Table.
Geologic Map Data Model 10/16/97Chapter 2: version 4.1
48
Table 2-32: Examples of the rock_rank and rock_level# values for the Rock Unit Rank Table.
rock_rank rock_level#
top 0
supergroup 100
group 200
formation 300
suite 300
member 400
bed 500
tongue 500
sub-bed 600
Rock Composition TableThe Rock Composition Table (table 2-33) is used to define a single composition within a rock unit. Each
rock unit may be composed of one or more compositions, or lithologies. Each composition is represented in this tableby a single record. The attributes mineralogy, color, texture, and alteration are text fields used to describe the detailsof the composition represented by the record. The attributes rock_name and lith_class are used to describe the majorlithology of this composition. Rock_name is a free text field in which the author of the original map can use whateverterminology most accurately represents the major lithology of this composition. The lith_class attribute is used to storea lithologic classification term, selected from a hierarchical classification of rock types (see the Lithology Table,below), which best represents the lithology of the composition. Two attributes are used because of the large variety oflithologic terms that are currently in use in the geologic literature. The lith_class attribute is used with a restricted listof terms to make searching and sorting the database on lithology a possibility. The inclusion of this attribute will alsomake it possible to automate the process of making derivative maps based on lithology. The rock_name attribute isincluded so that authors will not be confined to the keyword list when choosing the most accurate lithologic term orterms to describe the composition. The attribute percent contains information that is normally shown diagrammaticallyon maps by means of cross sections or columnar section diagrams. The percent attribute, containing an estimate of thevolume percent of the unit represented by the current composition, is used to explicitly order the compositions within arock unit to answer questions concerning the dominate, or major compositions vs. minor compositions. The qualityattribute is included to indicate how well the percent is known. The intent is to formalize the capture of criticalinformation, such as the dominate lithology, that has often been poorly handled on paper maps. Finally, the descattribute is a long text field where the author can store a complete description of the individual composition. This isthe information that would be displayed on a map legend in the description of rock units.
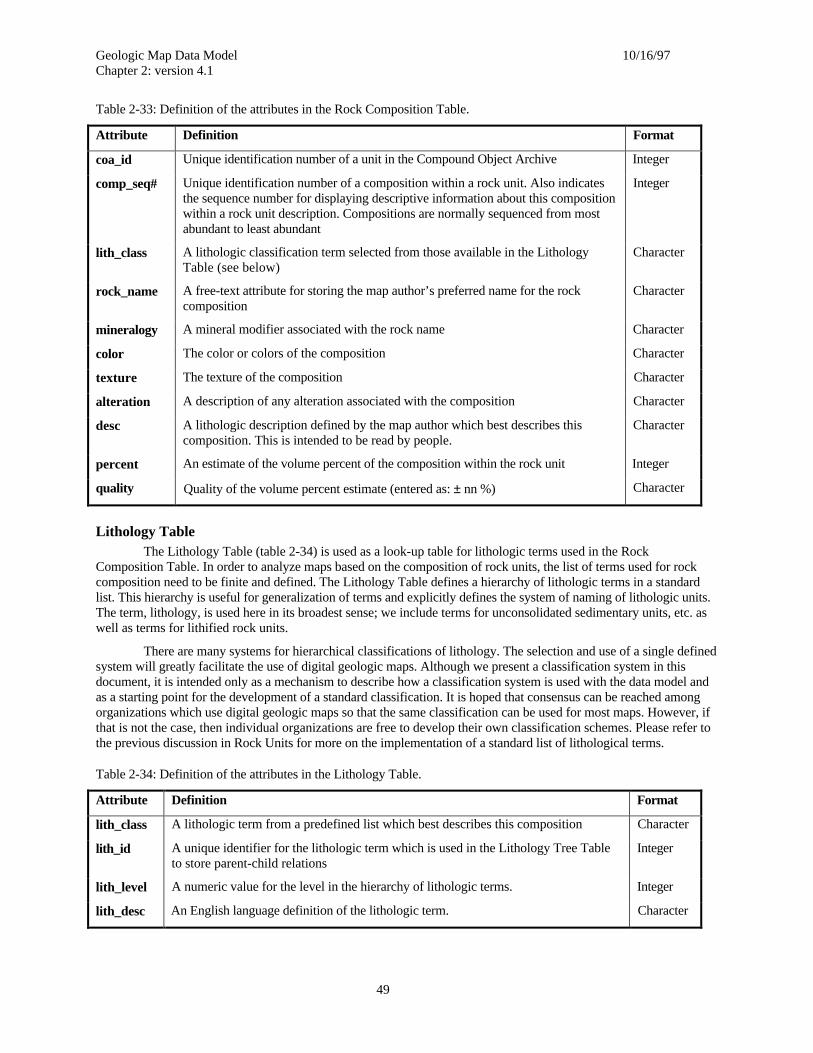
Geologic Map Data Model 10/16/97Chapter 2: version 4.1
49
Table 2-33: Definition of the attributes in the Rock Composition Table.
Attribute Definition Fo rmat
coa_id Unique identification number of a unit in the Compound Object Archive Integer
comp_seq# Unique identification number of a composition within a rock unit. Also indicatesthe sequence number for displaying descriptive information about this compositionwithin a rock unit description. Compositions are normally sequenced from mostabundant to least abundant
Integer
lith_class A lithologic classification term selected from those available in the LithologyTable (see below)
Character
rock_name A free-text attribute for storing the map author’s preferred name for the rockcomposition
Character
mineralogy A mineral modifier associated with the rock name Character
color The color or colors of the composition Character
texture The texture of the composition Character
alteration A description of any alteration associated with the composition Character
desc A lithologic description defined by the map author which best describes thiscomposition. This is intended to be read by people.
Character
percent An estimate of the volume percent of the composition within the rock unit Integer
quality Quality of the volume percent estimate (entered as: ± nn %) Character
Lithology TableThe Lithology Table (table 2-34) is used as a look-up table for lithologic terms used in the Rock
Composition Table. In order to analyze maps based on the composition of rock units, the list of terms used for rockcomposition need to be finite and defined. The Lithology Table defines a hierarchy of lithologic terms in a standardlist. This hierarchy is useful for generalization of terms and explicitly defines the system of naming of lithologic units.The term, lithology, is used here in its broadest sense; we include terms for unconsolidated sedimentary units, etc. aswell as terms for lithified rock units.
There are many systems for hierarchical classifications of lithology. The selection and use of a single definedsystem will greatly facilitate the use of digital geologic maps. Although we present a classification system in thisdocument, it is intended only as a mechanism to describe how a classification system is used with the data model andas a starting point for the development of a standard classification. It is hoped that consensus can be reached amongorganizations which use digital geologic maps so that the same classification can be used for most maps. However, ifthat is not the case, then individual organizations are free to develop their own classification schemes. Please refer tothe previous discussion in Rock Units for more on the implementation of a standard list of lithological terms.
Table 2-34: Definition of the attributes in the Lithology Table.
Attribute Definition Format
lith_class A lithologic term from a predefined list which best describes this composition Character
lith_id A unique identifier for the lithologic term which is used in the Lithology Tree Tableto store parent-child relations
Integer
lith_level A numeric value for the level in the hierarchy of lithologic terms. Integer
lith_desc An English language definition of the lithologic term. Character
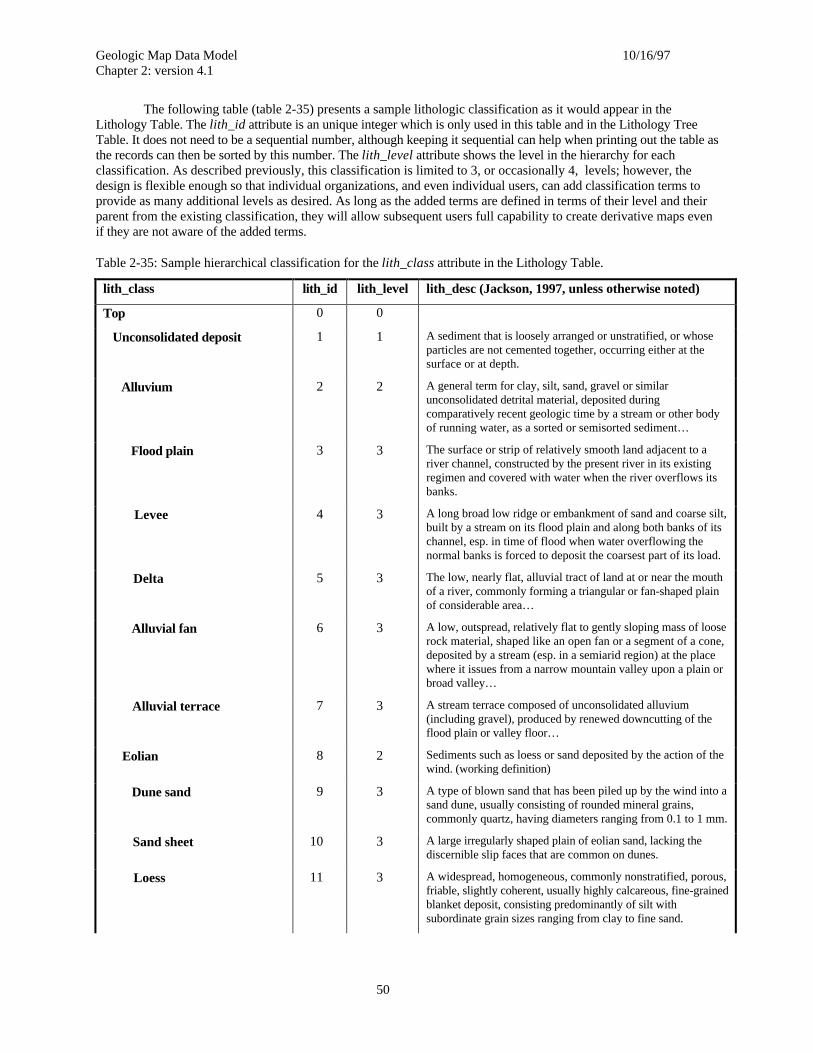
Geologic Map Data Model 10/16/97Chapter 2: version 4.1
50
The following table (table 2-35) presents a sample lithologic classification as it would appear in theLithology Table. The lith_id attribute is an unique integer which is only used in this table and in the Lithology TreeTable. It does not need to be a sequential number, although keeping it sequential can help when printing out the table asthe records can then be sorted by this number. The lith_level attribute shows the level in the hierarchy for eachclassification. As described previously, this classification is limited to 3, or occasionally 4, levels; however, thedesign is flexible enough so that individual organizations, and even individual users, can add classification terms toprovide as many additional levels as desired. As long as the added terms are defined in terms of their level and theirparent from the existing classification, they will allow subsequent users full capability to create derivative maps evenif they are not aware of the added terms.
Table 2-35: Sample hierarchical classification for the lith_class attribute in the Lithology Table.
lith_class lith_id lith_level lith_desc (Jackson, 1997, unless otherwise noted)
Top 0 0
Unconsolidated deposit 1 1 A sediment that is loosely arranged or unstratified, or whoseparticles are not cemented together, occurring either at thesurface or at depth.
Alluvium 2 2 A general term for clay, silt, sand, gravel or similarunconsolidated detrital material, deposited duringcomparatively recent geologic time by a stream or other bodyof running water, as a sorted or semisorted sediment…
Flood plain 3 3 The surface or strip of relatively smooth land adjacent to ariver channel, constructed by the present river in its existingregimen and covered with water when the river overflows itsbanks.
Levee 4 3 A long broad low ridge or embankment of sand and coarse silt,built by a stream on its flood plain and along both banks of itschannel, esp. in time of flood when water overflowing thenormal banks is forced to deposit the coarsest part of its load.
Delta 5 3 The low, nearly flat, alluvial tract of land at or near the mouthof a river, commonly forming a triangular or fan-shaped plainof considerable area…
Alluvial fan 6 3 A low, outspread, relatively flat to gently sloping mass of looserock material, shaped like an open fan or a segment of a cone,deposited by a stream (esp. in a semiarid region) at the placewhere it issues from a narrow mountain valley upon a plain orbroad valley…
Alluvial terrace 7 3 A stream terrace composed of unconsolidated alluvium(including gravel), produced by renewed downcutting of theflood plain or valley floor…
Eolian 8 2 Sediments such as loess or sand deposited by the action of thewind. (working definition)
Dune sand 9 3 A type of blown sand that has been piled up by the wind into asand dune, usually consisting of rounded mineral grains,commonly quartz, having diameters ranging from 0.1 to 1 mm.
Sand sheet 10 3 A large irregularly shaped plain of eolian sand, lacking thediscernible slip faces that are common on dunes.
Loess 11 3 A widespread, homogeneous, commonly nonstratified, porous,friable, slightly coherent, usually highly calcareous, fine-grainedblanket deposit, consisting predominantly of silt withsubordinate grain sizes ranging from clay to fine sand.
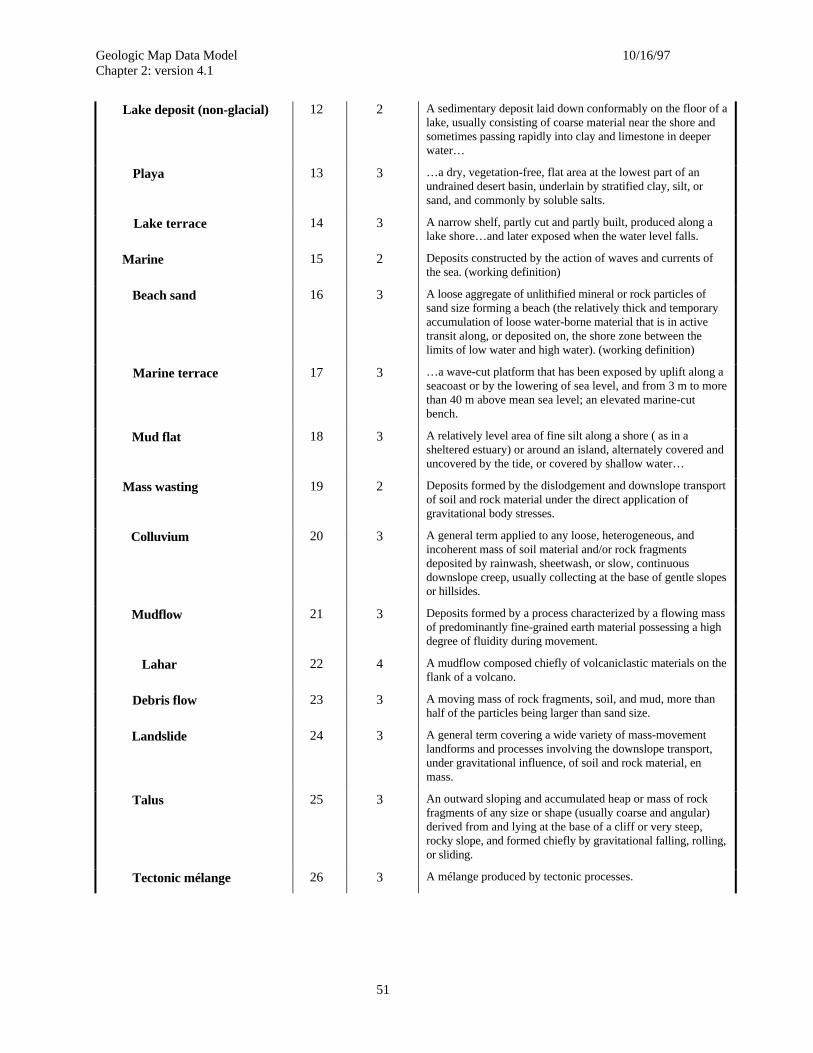
Geologic Map Data Model 10/16/97Chapter 2: version 4.1
51
Lake deposit (non-glacial) 12 2 A sedimentary deposit laid down conformably on the floor of alake, usually consisting of coarse material near the shore andsometimes passing rapidly into clay and limestone in deeperwater…
Playa 13 3 …a dry, vegetation-free, flat area at the lowest part of anundrained desert basin, underlain by stratified clay, silt, orsand, and commonly by soluble salts.
Lake terrace 14 3 A narrow shelf, partly cut and partly built, produced along alake shore…and later exposed when the water level falls.
Marine 15 2 Deposits constructed by the action of waves and currents ofthe sea. (working definition)
Beach sand 16 3 A loose aggregate of unlithified mineral or rock particles ofsand size forming a beach (the relatively thick and temporaryaccumulation of loose water-borne material that is in activetransit along, or deposited on, the shore zone between thelimits of low water and high water). (working definition)
Marine terrace 17 3 …a wave-cut platform that has been exposed by uplift along aseacoast or by the lowering of sea level, and from 3 m to morethan 40 m above mean sea level; an elevated marine-cutbench.
Mud flat 18 3 A relatively level area of fine silt along a shore ( as in asheltered estuary) or around an island, alternately covered anduncovered by the tide, or covered by shallow water…
Mass wasting 19 2 Deposits formed by the dislodgement and downslope transportof soil and rock material under the direct application ofgravitational body stresses.
Colluvium 20 3 A general term applied to any loose, heterogeneous, andincoherent mass of soil material and/or rock fragmentsdeposited by rainwash, sheetwash, or slow, continuousdownslope creep, usually collecting at the base of gentle slopesor hillsides.
Mudflow 21 3 Deposits formed by a process characterized by a flowing massof predominantly fine-grained earth material possessing a highdegree of fluidity during movement.
Lahar 22 4 A mudflow composed chiefly of volcaniclastic materials on theflank of a volcano.
Debris flow 23 3 A moving mass of rock fragments, soil, and mud, more thanhalf of the particles being larger than sand size.
Landslide 24 3 A general term covering a wide variety of mass-movementlandforms and processes involving the downslope transport,under gravitational influence, of soil and rock material, enmass.
Talus 25 3 An outward sloping and accumulated heap or mass of rockfragments of any size or shape (usually coarse and angular)derived from and lying at the base of a cliff or very steep,rocky slope, and formed chiefly by gravitational falling, rolling,or sliding.
Tectonic mélange 26 3 A mélange produced by tectonic processes.
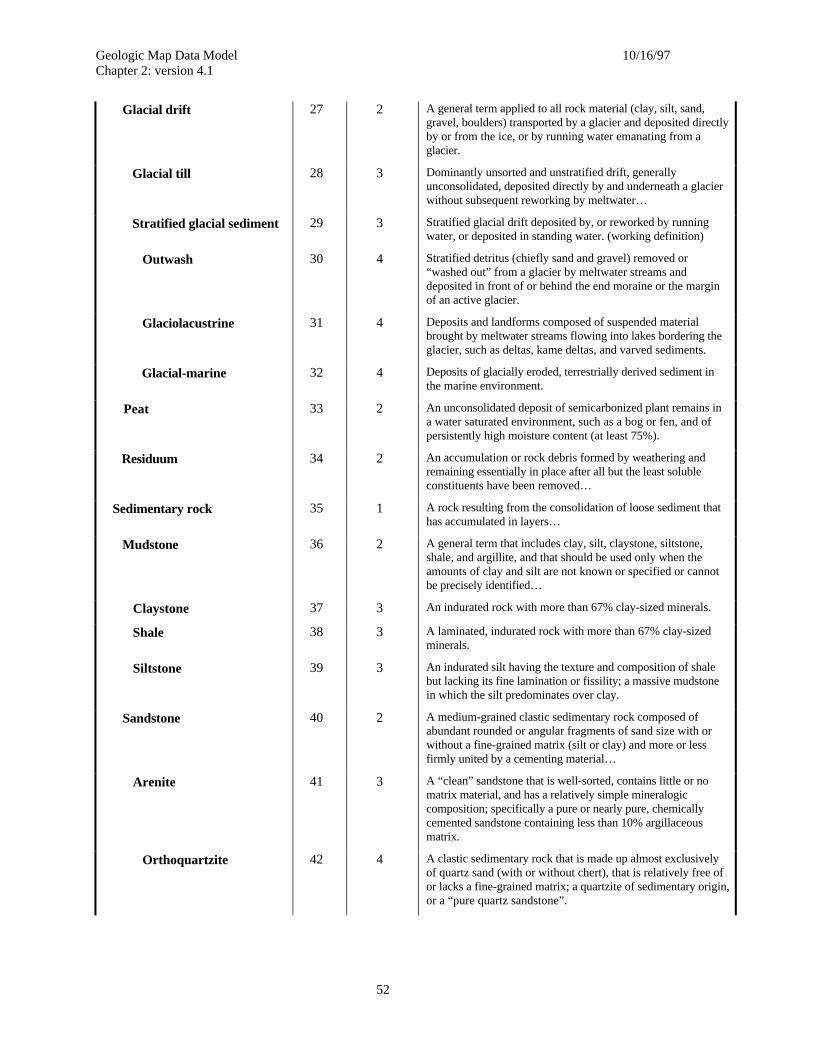
Geologic Map Data Model 10/16/97Chapter 2: version 4.1
52
Glacial drift 27 2 A general term applied to all rock material (clay, silt, sand,gravel, boulders) transported by a glacier and deposited directlyby or from the ice, or by running water emanating from aglacier.
Glacial till 28 3 Dominantly unsorted and unstratified drift, generallyunconsolidated, deposited directly by and underneath a glacierwithout subsequent reworking by meltwater…
Stratified glacial sediment 29 3 Stratified glacial drift deposited by, or reworked by runningwater, or deposited in standing water. (working definition)
Outwash 30 4 Stratified detritus (chiefly sand and gravel) removed or“washed out” from a glacier by meltwater streams anddeposited in front of or behind the end moraine or the marginof an active glacier.
Glaciolacustrine 31 4 Deposits and landforms composed of suspended materialbrought by meltwater streams flowing into lakes bordering theglacier, such as deltas, kame deltas, and varved sediments.
Glacial-marine 32 4 Deposits of glacially eroded, terrestrially derived sediment inthe marine environment.
Peat 33 2 An unconsolidated deposit of semicarbonized plant remains ina water saturated environment, such as a bog or fen, and ofpersistently high moisture content (at least 75%).
Residuum 34 2 An accumulation or rock debris formed by weathering andremaining essentially in place after all but the least solubleconstituents have been removed…
Sedimentary rock 35 1 A rock resulting from the consolidation of loose sediment thathas accumulated in layers…
Mudstone 36 2 A general term that includes clay, silt, claystone, siltstone,shale, and argillite, and that should be used only when theamounts of clay and silt are not known or specified or cannotbe precisely identified…
Claystone 37 3 An indurated rock with more than 67% clay-sized minerals.
Shale 38 3 A laminated, indurated rock with more than 67% clay-sizedminerals.
Siltstone 39 3 An indurated silt having the texture and composition of shalebut lacking its fine lamination or fissility; a massive mudstonein which the silt predominates over clay.
Sandstone 40 2 A medium-grained clastic sedimentary rock composed ofabundant rounded or angular fragments of sand size with orwithout a fine-grained matrix (silt or clay) and more or lessfirmly united by a cementing material…
Arenite 41 3 A “clean” sandstone that is well-sorted, contains little or nomatrix material, and has a relatively simple mineralogiccomposition; specifically a pure or nearly pure, chemicallycemented sandstone containing less than 10% argillaceousmatrix.
Orthoquartzite 42 4 A clastic sedimentary rock that is made up almost exclusivelyof quartz sand (with or without chert), that is relatively free ofor lacks a fine-grained matrix; a quartzite of sedimentary origin,or a “pure quartz sandstone”.
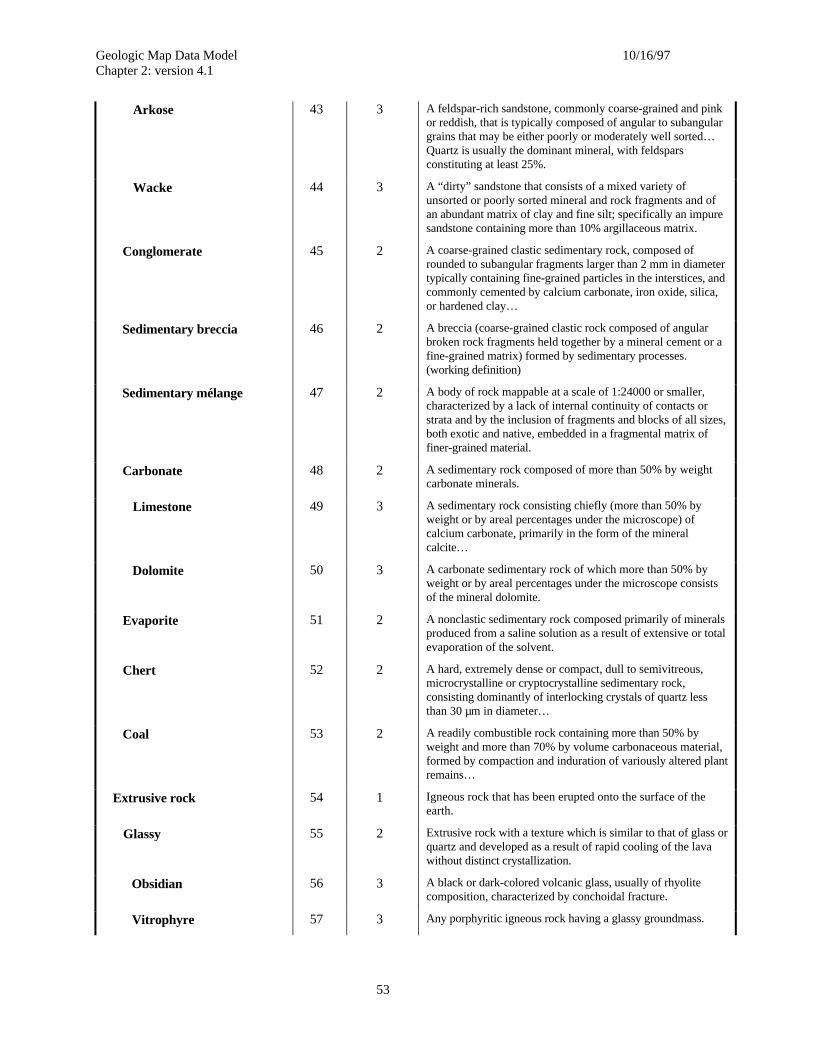
Geologic Map Data Model 10/16/97Chapter 2: version 4.1
53
Arkose 43 3 A feldspar-rich sandstone, commonly coarse-grained and pinkor reddish, that is typically composed of angular to subangulargrains that may be either poorly or moderately well sorted…Quartz is usually the dominant mineral, with feldsparsconstituting at least 25%.
Wacke 44 3 A “dirty” sandstone that consists of a mixed variety ofunsorted or poorly sorted mineral and rock fragments and ofan abundant matrix of clay and fine silt; specifically an impuresandstone containing more than 10% argillaceous matrix.
Conglomerate 45 2 A coarse-grained clastic sedimentary rock, composed ofrounded to subangular fragments larger than 2 mm in diametertypically containing fine-grained particles in the interstices, andcommonly cemented by calcium carbonate, iron oxide, silica,or hardened clay…
Sedimentary breccia 46 2 A breccia (coarse-grained clastic rock composed of angularbroken rock fragments held together by a mineral cement or afine-grained matrix) formed by sedimentary processes.(working definition)
Sedimentary mélange 47 2 A body of rock mappable at a scale of 1:24000 or smaller,characterized by a lack of internal continuity of contacts orstrata and by the inclusion of fragments and blocks of all sizes,both exotic and native, embedded in a fragmental matrix offiner-grained material.
Carbonate 48 2 A sedimentary rock composed of more than 50% by weightcarbonate minerals.
Limestone 49 3 A sedimentary rock consisting chiefly (more than 50% byweight or by areal percentages under the microscope) ofcalcium carbonate, primarily in the form of the mineralcalcite…
Dolomite 50 3 A carbonate sedimentary rock of which more than 50% byweight or by areal percentages under the microscope consistsof the mineral dolomite.
Evaporite 51 2 A nonclastic sedimentary rock composed primarily of mineralsproduced from a saline solution as a result of extensive or totalevaporation of the solvent.
Chert 52 2 A hard, extremely dense or compact, dull to semivitreous,microcrystalline or cryptocrystalline sedimentary rock,consisting dominantly of interlocking crystals of quartz lessthan 30 µm in diameter…
Coal 53 2 A readily combustible rock containing more than 50% byweight and more than 70% by volume carbonaceous material,formed by compaction and induration of variously altered plantremains…
Extrusive rock 54 1 Igneous rock that has been erupted onto the surface of theearth.
Glassy 55 2 Extrusive rock with a texture which is similar to that of glass orquartz and developed as a result of rapid cooling of the lavawithout distinct crystallization.
Obsidian 56 3 A black or dark-colored volcanic glass, usually of rhyolitecomposition, characterized by conchoidal fracture.
Vitrophyre 57 3 Any porphyritic igneous rock having a glassy groundmass.
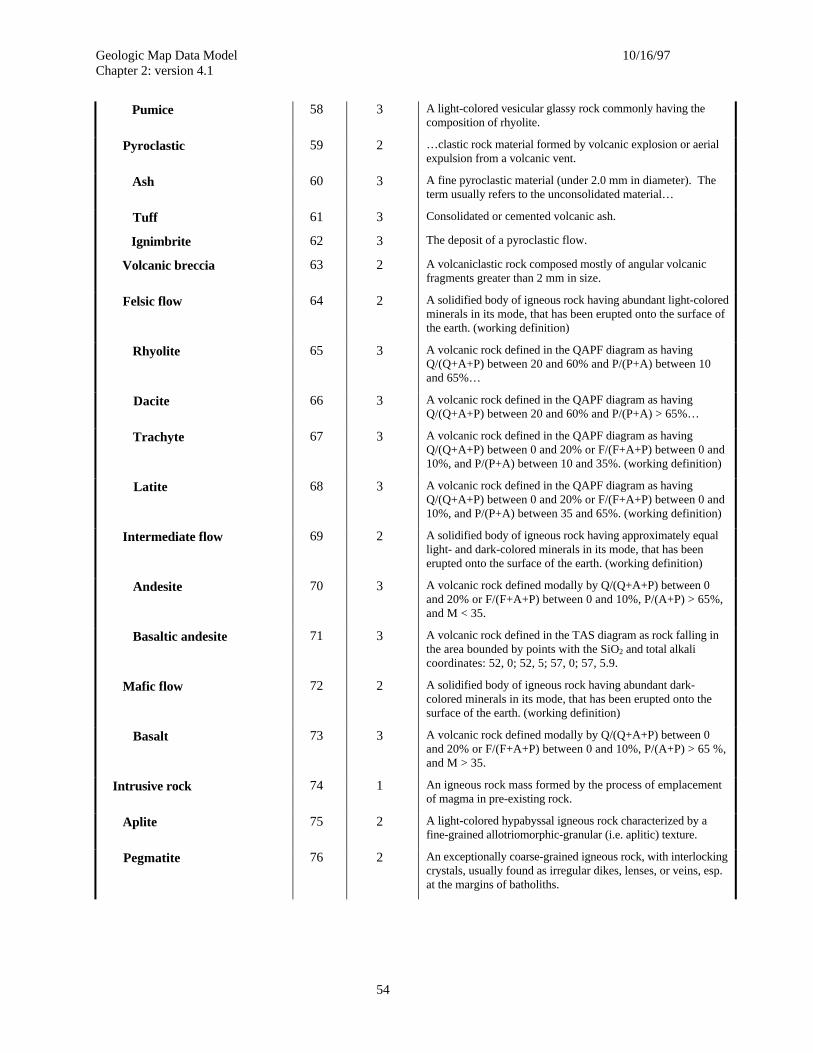
Geologic Map Data Model 10/16/97Chapter 2: version 4.1
54
Pumice 58 3 A light-colored vesicular glassy rock commonly having thecomposition of rhyolite.
Pyroclastic 59 2 …clastic rock material formed by volcanic explosion or aerialexpulsion from a volcanic vent.
Ash 60 3 A fine pyroclastic material (under 2.0 mm in diameter). Theterm usually refers to the unconsolidated material…
Tuff 61 3 Consolidated or cemented volcanic ash.
Ignimbrite 62 3 The deposit of a pyroclastic flow.
Volcanic breccia 63 2 A volcaniclastic rock composed mostly of angular volcanicfragments greater than 2 mm in size.
Felsic flow 64 2 A solidified body of igneous rock having abundant light-coloredminerals in its mode, that has been erupted onto the surface ofthe earth. (working definition)
Rhyolite 65 3 A volcanic rock defined in the QAPF diagram as havingQ/(Q+A+P) between 20 and 60% and P/(P+A) between 10and 65%…
Dacite 66 3 A volcanic rock defined in the QAPF diagram as havingQ/(Q+A+P) between 20 and 60% and P/(P+A) > 65%…
Trachyte 67 3 A volcanic rock defined in the QAPF diagram as havingQ/(Q+A+P) between 0 and 20% or F/(F+A+P) between 0 and10%, and P/(P+A) between 10 and 35%. (working definition)
Latite 68 3 A volcanic rock defined in the QAPF diagram as havingQ/(Q+A+P) between 0 and 20% or F/(F+A+P) between 0 and10%, and P/(P+A) between 35 and 65%. (working definition)
Intermediate flow 69 2 A solidified body of igneous rock having approximately equallight- and dark-colored minerals in its mode, that has beenerupted onto the surface of the earth. (working definition)
Andesite 70 3 A volcanic rock defined modally by Q/(Q+A+P) between 0and 20% or F/(F+A+P) between 0 and 10%, P/(A+P) > 65%,and M < 35.
Basaltic andesite 71 3 A volcanic rock defined in the TAS diagram as rock falling inthe area bounded by points with the SiO2 and total alkalicoordinates: 52, 0; 52, 5; 57, 0; 57, 5.9.
Mafic flow 72 2 A solidified body of igneous rock having abundant dark-colored minerals in its mode, that has been erupted onto thesurface of the earth. (working definition)
Basalt 73 3 A volcanic rock defined modally by Q/(Q+A+P) between 0and 20% or F/(F+A+P) between 0 and 10%, P/(A+P) > 65 %,and M > 35.
Intrusive rock 74 1 An igneous rock mass formed by the process of emplacementof magma in pre-existing rock.
Aplite 75 2 A light-colored hypabyssal igneous rock characterized by afine-grained allotriomorphic-granular (i.e. aplitic) texture.
Pegmatite 76 2 An exceptionally coarse-grained igneous rock, with interlockingcrystals, usually found as irregular dikes, lenses, or veins, esp.at the margins of batholiths.
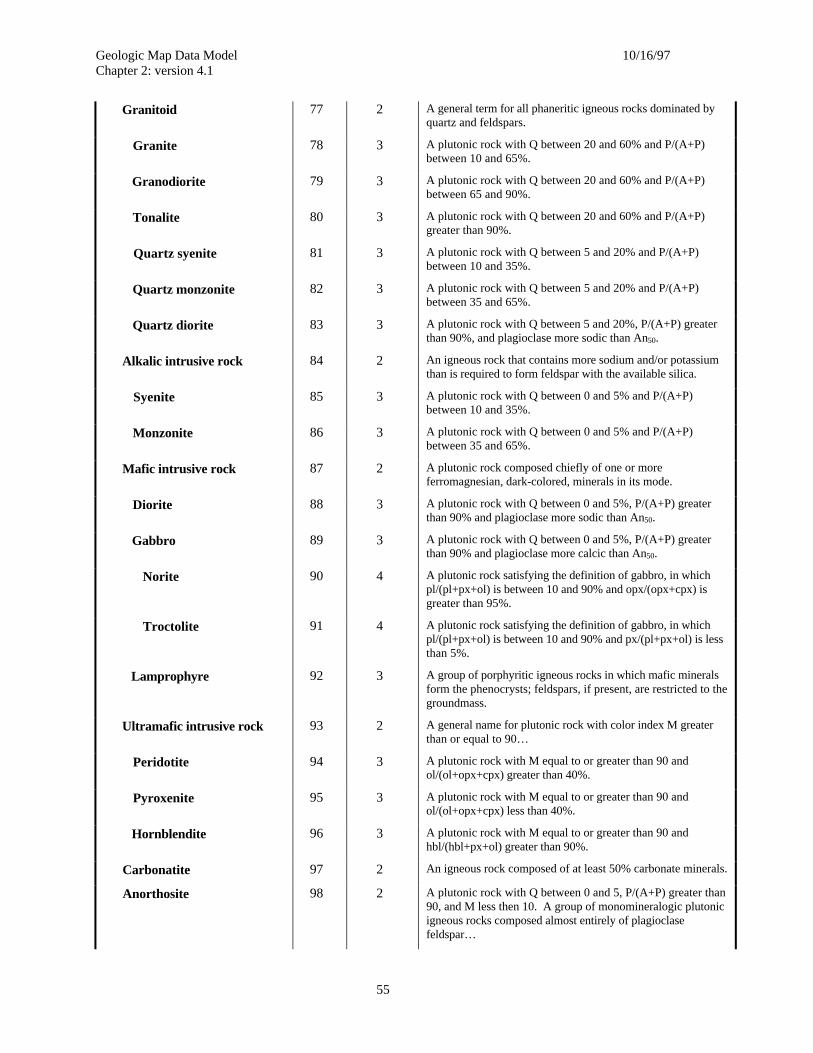
Geologic Map Data Model 10/16/97Chapter 2: version 4.1
55
Granitoid 77 2 A general term for all phaneritic igneous rocks dominated byquartz and feldspars.
Granite 78 3 A plutonic rock with Q between 20 and 60% and P/(A+P)between 10 and 65%.
Granodiorite 79 3 A plutonic rock with Q between 20 and 60% and P/(A+P)between 65 and 90%.
Tonalite 80 3 A plutonic rock with Q between 20 and 60% and P/(A+P)greater than 90%.
Quartz syenite 81 3 A plutonic rock with Q between 5 and 20% and P/(A+P)between 10 and 35%.
Quartz monzonite 82 3 A plutonic rock with Q between 5 and 20% and P/(A+P)between 35 and 65%.
Quartz diorite 83 3 A plutonic rock with Q between 5 and 20%, P/(A+P) greaterthan 90%, and plagioclase more sodic than An50.
Alkalic intrusive rock 84 2 An igneous rock that contains more sodium and/or potassiumthan is required to form feldspar with the available silica.
Syenite 85 3 A plutonic rock with Q between 0 and 5% and P/(A+P)between 10 and 35%.
Monzonite 86 3 A plutonic rock with Q between 0 and 5% and P/(A+P)between 35 and 65%.
Mafic intrusive rock 87 2 A plutonic rock composed chiefly of one or moreferromagnesian, dark-colored, minerals in its mode.
Diorite 88 3 A plutonic rock with Q between 0 and 5%, P/(A+P) greaterthan 90% and plagioclase more sodic than An50.
Gabbro 89 3 A plutonic rock with Q between 0 and 5%, P/(A+P) greaterthan 90% and plagioclase more calcic than An50.
Norite 90 4 A plutonic rock satisfying the definition of gabbro, in whichpl/(pl+px+ol) is between 10 and 90% and opx/(opx+cpx) isgreater than 95%.
Troctolite 91 4 A plutonic rock satisfying the definition of gabbro, in whichpl/(pl+px+ol) is between 10 and 90% and px/(pl+px+ol) is lessthan 5%.
Lamprophyre 92 3 A group of porphyritic igneous rocks in which mafic mineralsform the phenocrysts; feldspars, if present, are restricted to thegroundmass.
Ultramafic intrusive rock 93 2 A general name for plutonic rock with color index M greaterthan or equal to 90…
Peridotite 94 3 A plutonic rock with M equal to or greater than 90 andol/(ol+opx+cpx) greater than 40%.
Pyroxenite 95 3 A plutonic rock with M equal to or greater than 90 andol/(ol+opx+cpx) less than 40%.
Hornblendite 96 3 A plutonic rock with M equal to or greater than 90 andhbl/(hbl+px+ol) greater than 90%.
Carbonatite 97 2 An igneous rock composed of at least 50% carbonate minerals.
Anorthosite 98 2 A plutonic rock with Q between 0 and 5, P/(A+P) greater than90, and M less then 10. A group of monomineralogic plutonicigneous rocks composed almost entirely of plagioclasefeldspar…
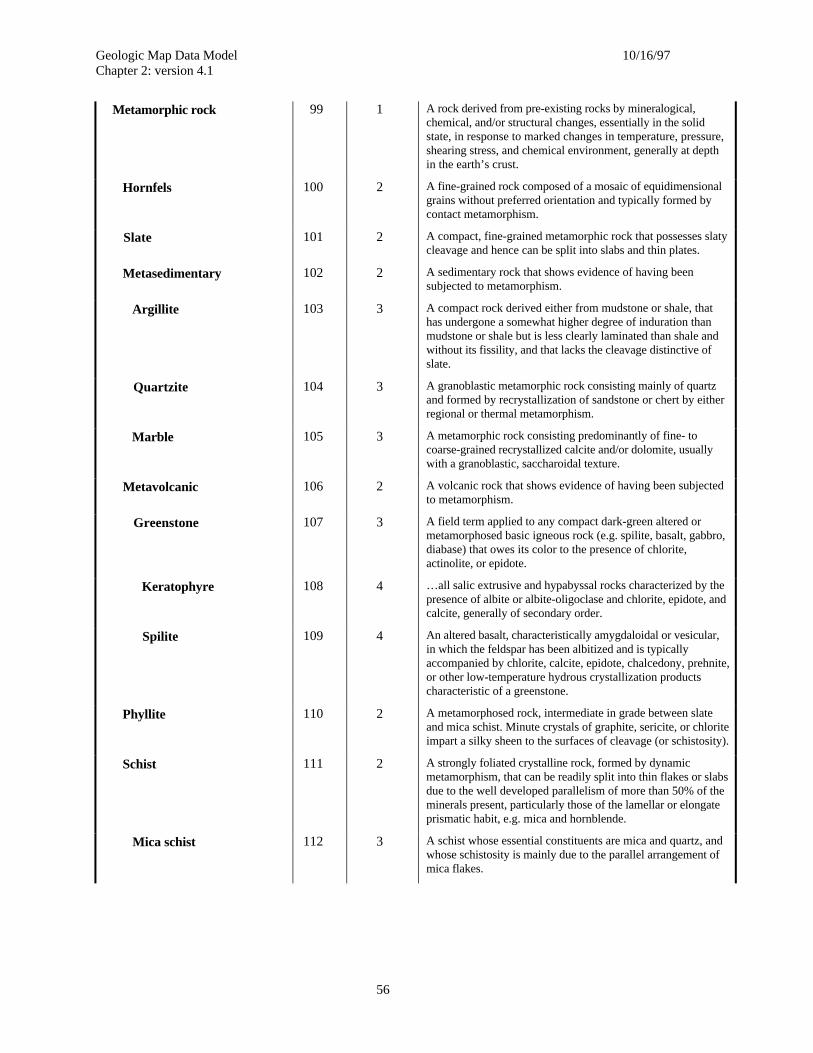
Geologic Map Data Model 10/16/97Chapter 2: version 4.1
56
Metamorphic rock 99 1 A rock derived from pre-existing rocks by mineralogical,chemical, and/or structural changes, essentially in the solidstate, in response to marked changes in temperature, pressure,shearing stress, and chemical environment, generally at depthin the earth’s crust.
Hornfels 100 2 A fine-grained rock composed of a mosaic of equidimensionalgrains without preferred orientation and typically formed bycontact metamorphism.
Slate 101 2 A compact, fine-grained metamorphic rock that possesses slatycleavage and hence can be split into slabs and thin plates.
Metasedimentary 102 2 A sedimentary rock that shows evidence of having beensubjected to metamorphism.
Argillite 103 3 A compact rock derived either from mudstone or shale, thathas undergone a somewhat higher degree of induration thanmudstone or shale but is less clearly laminated than shale andwithout its fissility, and that lacks the cleavage distinctive ofslate.
Quartzite 104 3 A granoblastic metamorphic rock consisting mainly of quartzand formed by recrystallization of sandstone or chert by eitherregional or thermal metamorphism.
Marble 105 3 A metamorphic rock consisting predominantly of fine- tocoarse-grained recrystallized calcite and/or dolomite, usuallywith a granoblastic, saccharoidal texture.
Metavolcanic 106 2 A volcanic rock that shows evidence of having been subjectedto metamorphism.
Greenstone 107 3 A field term applied to any compact dark-green altered ormetamorphosed basic igneous rock (e.g. spilite, basalt, gabbro,diabase) that owes its color to the presence of chlorite,actinolite, or epidote.
Keratophyre 108 4 …all salic extrusive and hypabyssal rocks characterized by thepresence of albite or albite-oligoclase and chlorite, epidote, andcalcite, generally of secondary order.
Spilite 109 4 An altered basalt, characteristically amygdaloidal or vesicular,in which the feldspar has been albitized and is typicallyaccompanied by chlorite, calcite, epidote, chalcedony, prehnite,or other low-temperature hydrous crystallization productscharacteristic of a greenstone.
Phyllite 110 2 A metamorphosed rock, intermediate in grade between slateand mica schist. Minute crystals of graphite, sericite, or chloriteimpart a silky sheen to the surfaces of cleavage (or schistosity).
Schist 111 2 A strongly foliated crystalline rock, formed by dynamicmetamorphism, that can be readily split into thin flakes or slabsdue to the well developed parallelism of more than 50% of theminerals present, particularly those of the lamellar or elongateprismatic habit, e.g. mica and hornblende.
Mica schist 112 3 A schist whose essential constituents are mica and quartz, andwhose schistosity is mainly due to the parallel arrangement ofmica flakes.
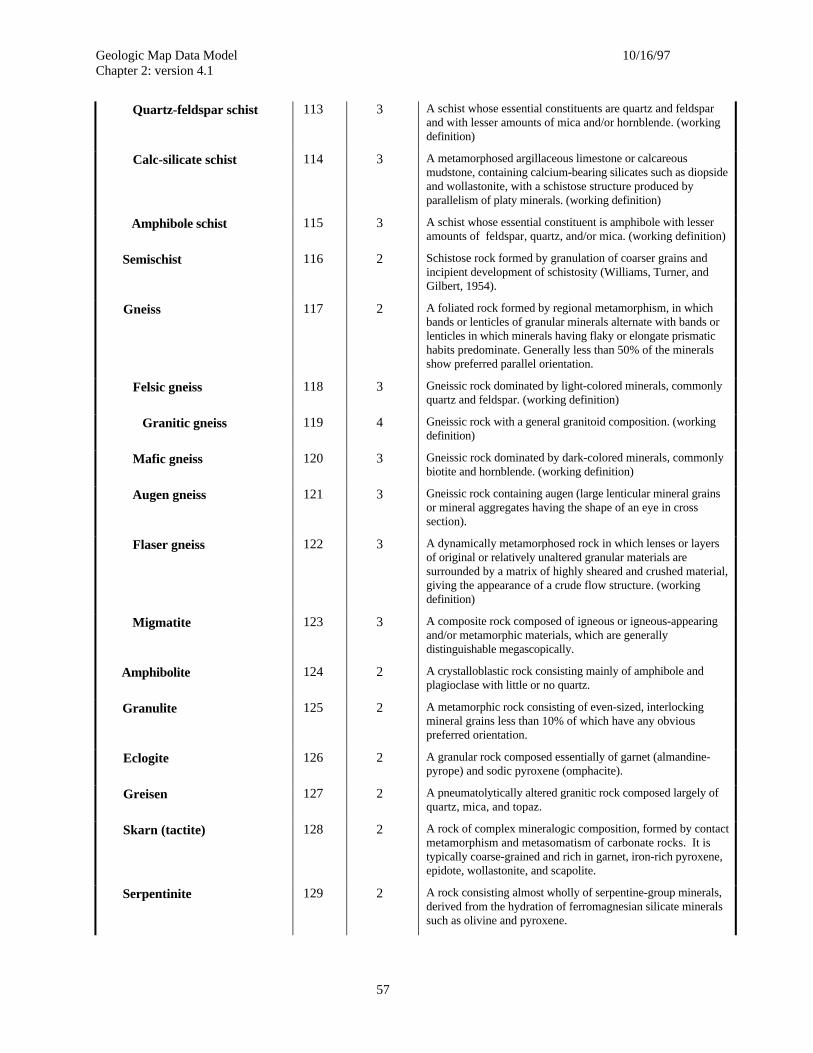
Geologic Map Data Model 10/16/97Chapter 2: version 4.1
57
Quartz-feldspar schist 113 3 A schist whose essential constituents are quartz and feldsparand with lesser amounts of mica and/or hornblende. (workingdefinition)
Calc-silicate schist 114 3 A metamorphosed argillaceous limestone or calcareousmudstone, containing calcium-bearing silicates such as diopsideand wollastonite, with a schistose structure produced byparallelism of platy minerals. (working definition)
Amphibole schist 115 3 A schist whose essential constituent is amphibole with lesseramounts of feldspar, quartz, and/or mica. (working definition)
Semischist 116 2 Schistose rock formed by granulation of coarser grains andincipient development of schistosity (Williams, Turner, andGilbert, 1954).
Gneiss 117 2 A foliated rock formed by regional metamorphism, in whichbands or lenticles of granular minerals alternate with bands orlenticles in which minerals having flaky or elongate prismatichabits predominate. Generally less than 50% of the mineralsshow preferred parallel orientation.
Felsic gneiss 118 3 Gneissic rock dominated by light-colored minerals, commonlyquartz and feldspar. (working definition)
Granitic gneiss 119 4 Gneissic rock with a general granitoid composition. (workingdefinition)
Mafic gneiss 120 3 Gneissic rock dominated by dark-colored minerals, commonlybiotite and hornblende. (working definition)
Augen gneiss 121 3 Gneissic rock containing augen (large lenticular mineral grainsor mineral aggregates having the shape of an eye in crosssection).
Flaser gneiss 122 3 A dynamically metamorphosed rock in which lenses or layersof original or relatively unaltered granular materials aresurrounded by a matrix of highly sheared and crushed material,giving the appearance of a crude flow structure. (workingdefinition)
Migmatite 123 3 A composite rock composed of igneous or igneous-appearingand/or metamorphic materials, which are generallydistinguishable megascopically.
Amphibolite 124 2 A crystalloblastic rock consisting mainly of amphibole andplagioclase with little or no quartz.
Granulite 125 2 A metamorphic rock consisting of even-sized, interlockingmineral grains less than 10% of which have any obviouspreferred orientation.
Eclogite 126 2 A granular rock composed essentially of garnet (almandine-pyrope) and sodic pyroxene (omphacite).
Greisen 127 2 A pneumatolytically altered granitic rock composed largely ofquartz, mica, and topaz.
Skarn (tactite) 128 2 A rock of complex mineralogic composition, formed by contactmetamorphism and metasomatism of carbonate rocks. It istypically coarse-grained and rich in garnet, iron-rich pyroxene,epidote, wollastonite, and scapolite.
Serpentinite 129 2 A rock consisting almost wholly of serpentine-group minerals,derived from the hydration of ferromagnesian silicate mineralssuch as olivine and pyroxene.
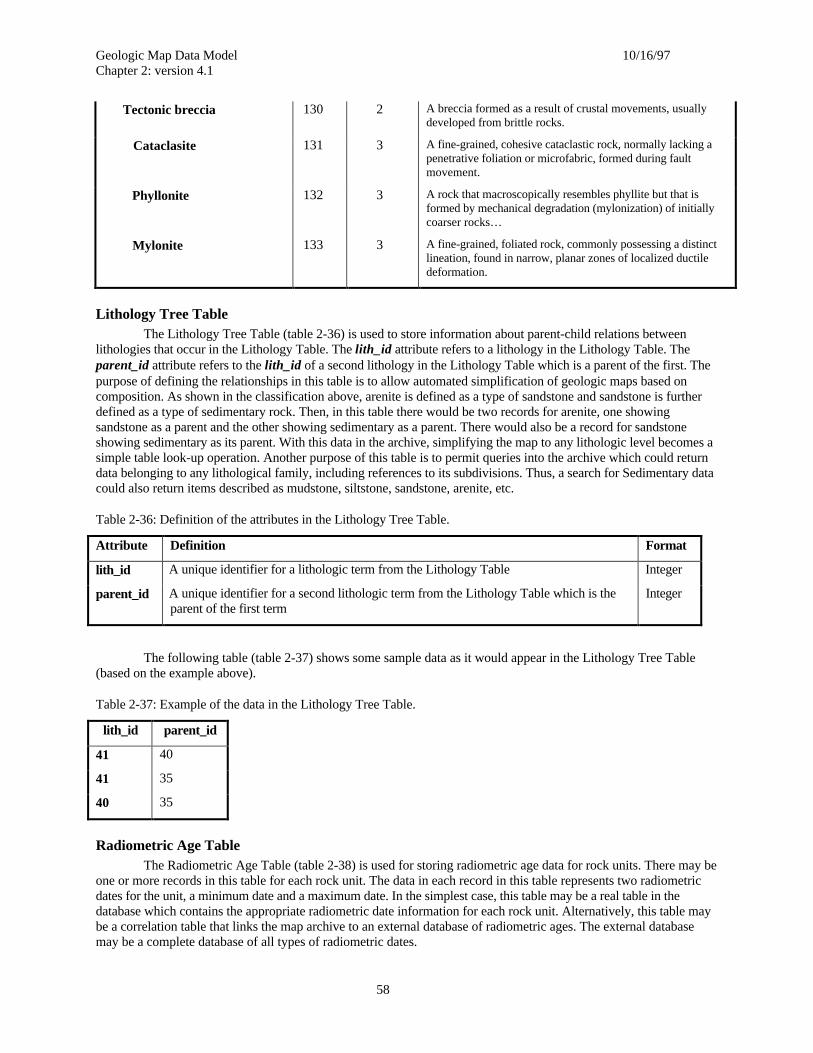
Geologic Map Data Model 10/16/97Chapter 2: version 4.1
58
Tectonic breccia 130 2 A breccia formed as a result of crustal movements, usuallydeveloped from brittle rocks.
Cataclasite 131 3 A fine-grained, cohesive cataclastic rock, normally lacking apenetrative foliation or microfabric, formed during faultmovement.
Phyllonite 132 3 A rock that macroscopically resembles phyllite but that isformed by mechanical degradation (mylonization) of initiallycoarser rocks…
Mylonite 133 3 A fine-grained, foliated rock, commonly possessing a distinctlineation, found in narrow, planar zones of localized ductiledeformation.
Lithology Tree TableThe Lithology Tree Table (table 2-36) is used to store information about parent-child relations between
lithologies that occur in the Lithology Table. The lith_id attribute refers to a lithology in the Lithology Table. Theparent_id attribute refers to the lith_id of a second lithology in the Lithology Table which is a parent of the first. Thepurpose of defining the relationships in this table is to allow automated simplification of geologic maps based oncomposition. As shown in the classification above, arenite is defined as a type of sandstone and sandstone is furtherdefined as a type of sedimentary rock. Then, in this table there would be two records for arenite, one showingsandstone as a parent and the other showing sedimentary as a parent. There would also be a record for sandstoneshowing sedimentary as its parent. With this data in the archive, simplifying the map to any lithologic level becomes asimple table look-up operation. Another purpose of this table is to permit queries into the archive which could returndata belonging to any lithological family, including references to its subdivisions. Thus, a search for Sedimentary datacould also return items described as mudstone, siltstone, sandstone, arenite, etc.
Table 2-36: Definition of the attributes in the Lithology Tree Table.
Attribute Definition Format
lith_id A unique identifier for a lithologic term from the Lithology Table Integer
parent_id A unique identifier for a second lithologic term from the Lithology Table which is theparent of the first term
Integer
The following table (table 2-37) shows some sample data as it would appear in the Lithology Tree Table(based on the example above).
Table 2-37: Example of the data in the Lithology Tree Table.
lith_id parent_id
41 40
41 35
40 35
Radiometric Age TableThe Radiometric Age Table (table 2-38) is used for storing radiometric age data for rock units. There may be
one or more records in this table for each rock unit. The data in each record in this table represents two radiometricdates for the unit, a minimum date and a maximum date. In the simplest case, this table may be a real table in thedatabase which contains the appropriate radiometric date information for each rock unit. Alternatively, this table maybe a correlation table that links the map archive to an external database of radiometric ages. The external databasemay be a complete database of all types of radiometric dates.
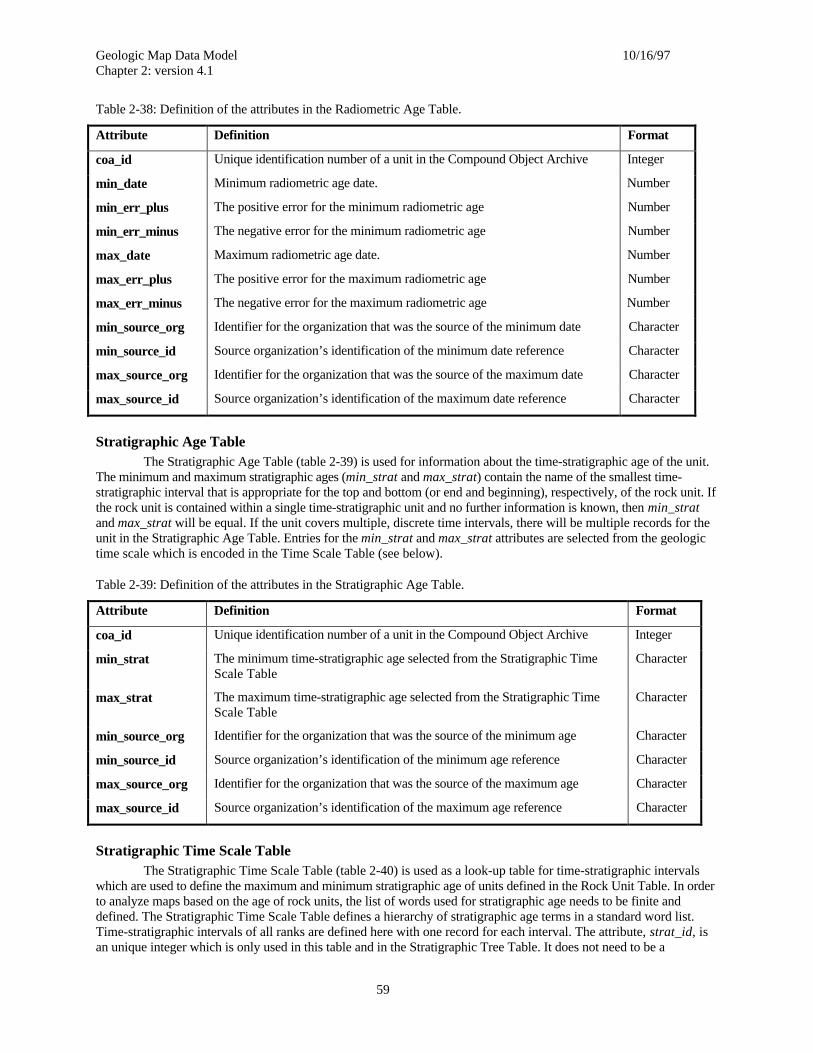
Geologic Map Data Model 10/16/97Chapter 2: version 4.1
59
Table 2-38: Definition of the attributes in the Radiometric Age Table.
Attribute Definition Format
coa_id Unique identification number of a unit in the Compound Object Archive Integer
min_date Minimum radiometric age date. Number
min_err_plus The positive error for the minimum radiometric age Number
min_err_minus The negative error for the minimum radiometric age Number
max_date Maximum radiometric age date. Number
max_err_plus The positive error for the maximum radiometric age Number
max_err_minus The negative error for the maximum radiometric age Number
min_source_org Identifier for the organization that was the source of the minimum date Character
min_source_id Source organization’s identification of the minimum date reference Character
max_source_org Identifier for the organization that was the source of the maximum date Character
max_source_id Source organization’s identification of the maximum date reference Character
Stratigraphic Age TableThe Stratigraphic Age Table (table 2-39) is used for information about the time-stratigraphic age of the unit.
The minimum and maximum stratigraphic ages (min_strat and max_strat) contain the name of the smallest time-stratigraphic interval that is appropriate for the top and bottom (or end and beginning), respectively, of the rock unit. Ifthe rock unit is contained within a single time-stratigraphic unit and no further information is known, then min_stratand max_strat will be equal. If the unit covers multiple, discrete time intervals, there will be multiple records for theunit in the Stratigraphic Age Table. Entries for the min_strat and max_strat attributes are selected from the geologictime scale which is encoded in the Time Scale Table (see below).
Table 2-39: Definition of the attributes in the Stratigraphic Age Table.
Attribute Definition Format
coa_id Unique identification number of a unit in the Compound Object Archive Integer
min_strat The minimum time-stratigraphic age selected from the Stratigraphic TimeScale Table
Character
max_strat The maximum time-stratigraphic age selected from the Stratigraphic TimeScale Table
Character
min_source_org Identifier for the organization that was the source of the minimum age Character
min_source_id Source organization’s identification of the minimum age reference Character
max_source_org Identifier for the organization that was the source of the maximum age Character
max_source_id Source organization’s identification of the maximum age reference Character
Stratigraphic Time Scale TableThe Stratigraphic Time Scale Table (table 2-40) is used as a look-up table for time-stratigraphic intervals
which are used to define the maximum and minimum stratigraphic age of units defined in the Rock Unit Table. In orderto analyze maps based on the age of rock units, the list of words used for stratigraphic age needs to be finite anddefined. The Stratigraphic Time Scale Table defines a hierarchy of stratigraphic age terms in a standard word list.Time-stratigraphic intervals of all ranks are defined here with one record for each interval. The attribute, strat_id, isan unique integer which is only used in this table and in the Stratigraphic Tree Table. It does not need to be a
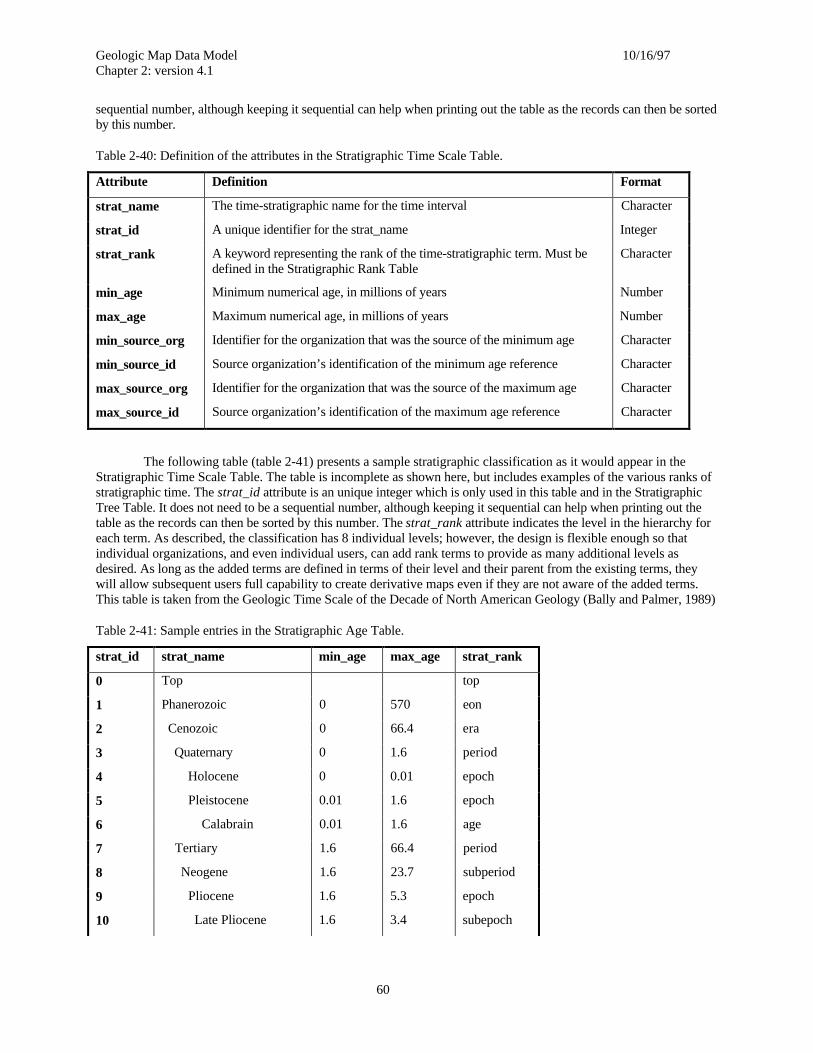
Geologic Map Data Model 10/16/97Chapter 2: version 4.1
60
sequential number, although keeping it sequential can help when printing out the table as the records can then be sortedby this number.
Table 2-40: Definition of the attributes in the Stratigraphic Time Scale Table.
Attribute Definition Format
strat_name The time-stratigraphic name for the time interval Character
strat_id A unique identifier for the strat_name Integer
strat_rank A keyword representing the rank of the time-stratigraphic term. Must bedefined in the Stratigraphic Rank Table
Character
min_age Minimum numerical age, in millions of years Number
max_age Maximum numerical age, in millions of years Number
min_source_org Identifier for the organization that was the source of the minimum age Character
min_source_id Source organization’s identification of the minimum age reference Character
max_source_org Identifier for the organization that was the source of the maximum age Character
max_source_id Source organization’s identification of the maximum age reference Character
The following table (table 2-41) presents a sample stratigraphic classification as it would appear in theStratigraphic Time Scale Table. The table is incomplete as shown here, but includes examples of the various ranks ofstratigraphic time. The strat_id attribute is an unique integer which is only used in this table and in the StratigraphicTree Table. It does not need to be a sequential number, although keeping it sequential can help when printing out thetable as the records can then be sorted by this number. The strat_rank attribute indicates the level in the hierarchy foreach term. As described, the classification has 8 individual levels; however, the design is flexible enough so thatindividual organizations, and even individual users, can add rank terms to provide as many additional levels asdesired. As long as the added terms are defined in terms of their level and their parent from the existing terms, theywill allow subsequent users full capability to create derivative maps even if they are not aware of the added terms.This table is taken from the Geologic Time Scale of the Decade of North American Geology (Bally and Palmer, 1989)
Table 2-41: Sample entries in the Stratigraphic Age Table.
strat_id strat_name min_age max_age strat_rank
0 Top top
1 Phanerozoic 0 570 eon
2 Cenozoic 0 66.4 era
3 Quaternary 0 1.6 period
4 Holocene 0 0.01 epoch
5 Pleistocene 0.01 1.6 epoch
6 Calabrain 0.01 1.6 age
7 Tertiary 1.6 66.4 period
8 Neogene 1.6 23.7 subperiod
9 Pliocene 1.6 5.3 epoch
10 Late Pliocene 1.6 3.4 subepoch
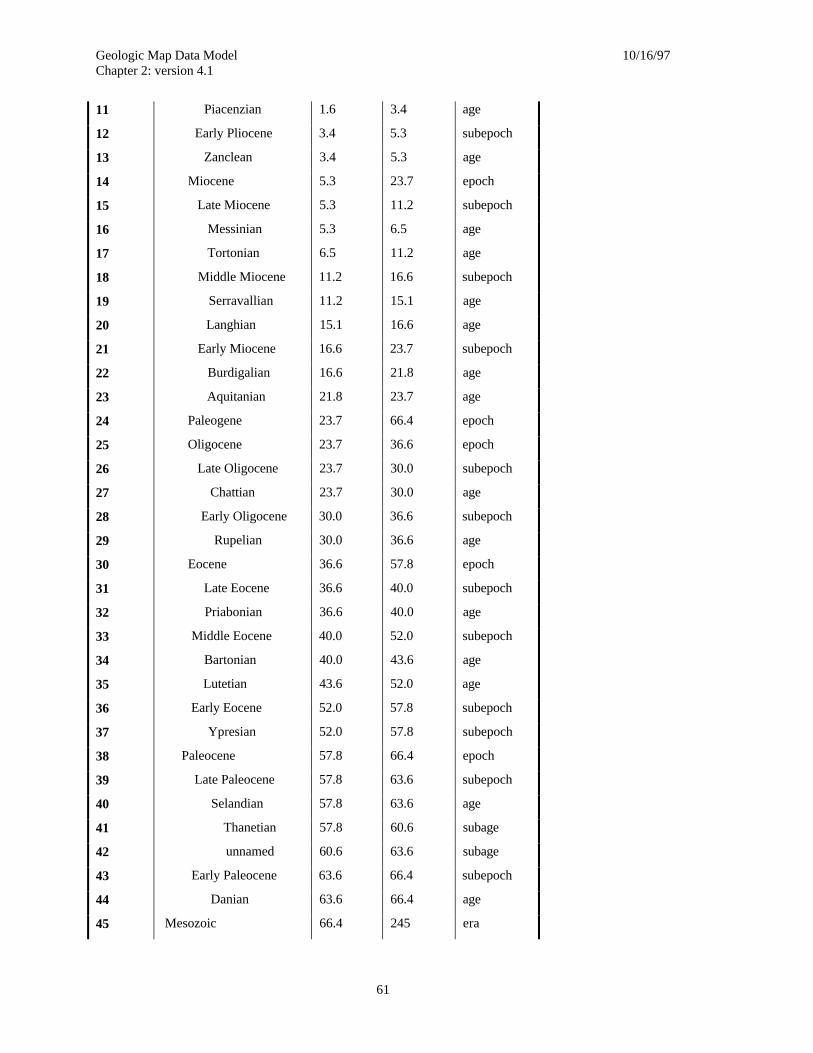
Geologic Map Data Model 10/16/97Chapter 2: version 4.1
61
11 Piacenzian 1.6 3.4 age
12 Early Pliocene 3.4 5.3 subepoch
13 Zanclean 3.4 5.3 age
14 Miocene 5.3 23.7 epoch
15 Late Miocene 5.3 11.2 subepoch
16 Messinian 5.3 6.5 age
17 Tortonian 6.5 11.2 age
18 Middle Miocene 11.2 16.6 subepoch
19 Serravallian 11.2 15.1 age
20 Langhian 15.1 16.6 age
21 Early Miocene 16.6 23.7 subepoch
22 Burdigalian 16.6 21.8 age
23 Aquitanian 21.8 23.7 age
24 Paleogene 23.7 66.4 epoch
25 Oligocene 23.7 36.6 epoch
26 Late Oligocene 23.7 30.0 subepoch
27 Chattian 23.7 30.0 age
28 Early Oligocene 30.0 36.6 subepoch
29 Rupelian 30.0 36.6 age
30 Eocene 36.6 57.8 epoch
31 Late Eocene 36.6 40.0 subepoch
32 Priabonian 36.6 40.0 age
33 Middle Eocene 40.0 52.0 subepoch
34 Bartonian 40.0 43.6 age
35 Lutetian 43.6 52.0 age
36 Early Eocene 52.0 57.8 subepoch
37 Ypresian 52.0 57.8 subepoch
38 Paleocene 57.8 66.4 epoch
39 Late Paleocene 57.8 63.6 subepoch
40 Selandian 57.8 63.6 age
41 Thanetian 57.8 60.6 subage
42 unnamed 60.6 63.6 subage
43 Early Paleocene 63.6 66.4 subepoch
44 Danian 63.6 66.4 age
45 Mesozoic 66.4 245 era
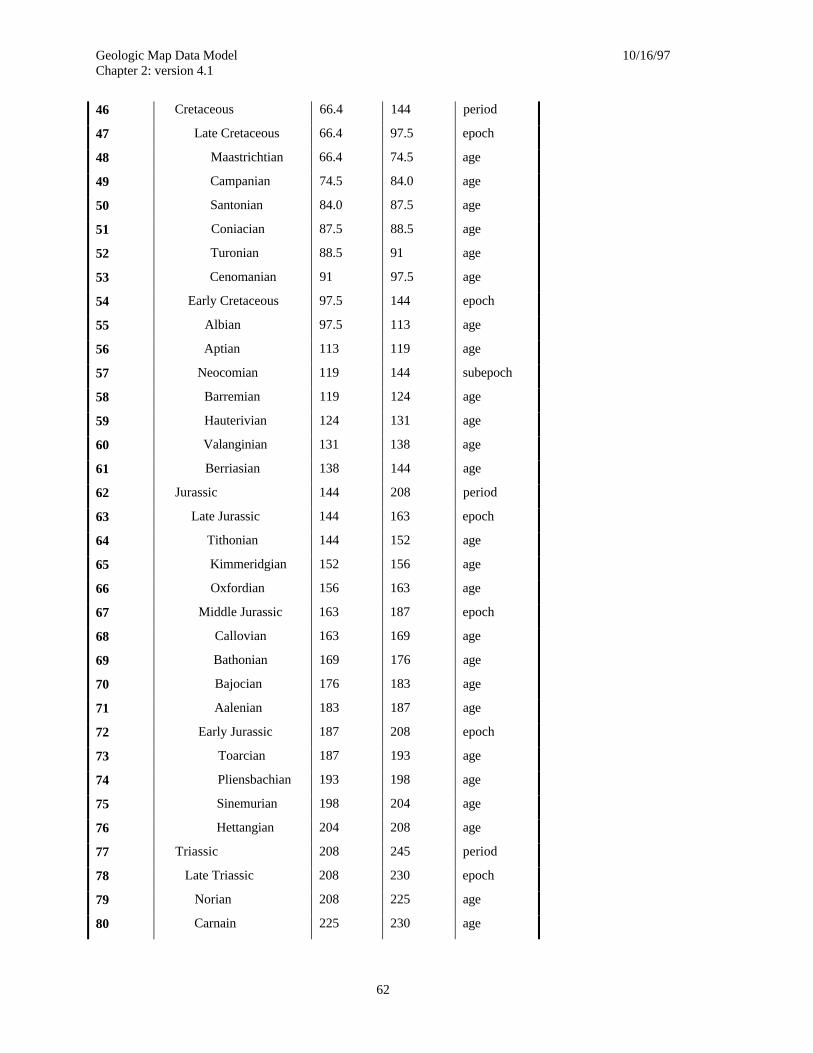
Geologic Map Data Model 10/16/97Chapter 2: version 4.1
62
46 Cretaceous 66.4 144 period
47 Late Cretaceous 66.4 97.5 epoch
48 Maastrichtian 66.4 74.5 age
49 Campanian 74.5 84.0 age
50 Santonian 84.0 87.5 age
51 Coniacian 87.5 88.5 age
52 Turonian 88.5 91 age
53 Cenomanian 91 97.5 age
54 Early Cretaceous 97.5 144 epoch
55 Albian 97.5 113 age
56 Aptian 113 119 age
57 Neocomian 119 144 subepoch
58 Barremian 119 124 age
59 Hauterivian 124 131 age
60 Valanginian 131 138 age
61 Berriasian 138 144 age
62 Jurassic 144 208 period
63 Late Jurassic 144 163 epoch
64 Tithonian 144 152 age
65 Kimmeridgian 152 156 age
66 Oxfordian 156 163 age
67 Middle Jurassic 163 187 epoch
68 Callovian 163 169 age
69 Bathonian 169 176 age
70 Bajocian 176 183 age
71 Aalenian 183 187 age
72 Early Jurassic 187 208 epoch
73 Toarcian 187 193 age
74 Pliensbachian 193 198 age
75 Sinemurian 198 204 age
76 Hettangian 204 208 age
77 Triassic 208 245 period
78 Late Triassic 208 230 epoch
79 Norian 208 225 age
80 Carnain 225 230 age
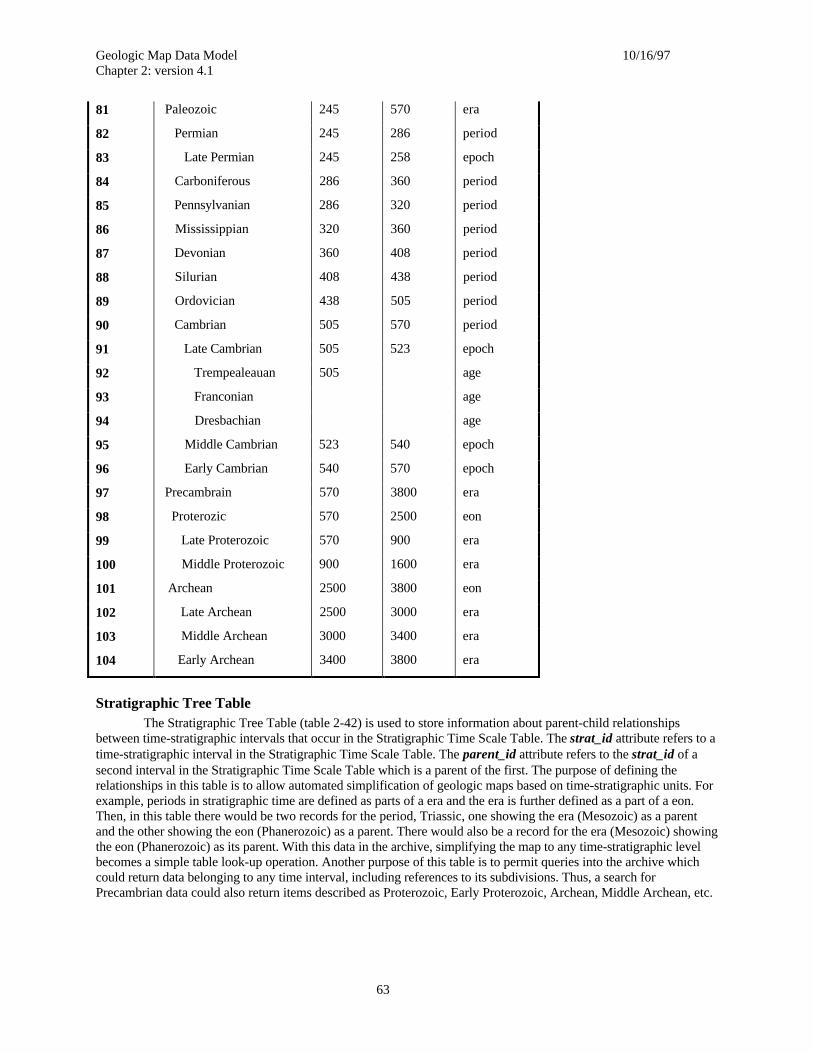
Geologic Map Data Model 10/16/97Chapter 2: version 4.1
63
81 Paleozoic 245 570 era
82 Permian 245 286 period
83 Late Permian 245 258 epoch
84 Carboniferous 286 360 period
85 Pennsylvanian 286 320 period
86 Mississippian 320 360 period
87 Devonian 360 408 period
88 Silurian 408 438 period
89 Ordovician 438 505 period
90 Cambrian 505 570 period
91 Late Cambrian 505 523 epoch
92 Trempealeauan 505 age
93 Franconian age
94 Dresbachian age
95 Middle Cambrian 523 540 epoch
96 Early Cambrian 540 570 epoch
97 Precambrain 570 3800 era
98 Proterozic 570 2500 eon
99 Late Proterozoic 570 900 era
100 Middle Proterozoic 900 1600 era
101 Archean 2500 3800 eon
102 Late Archean 2500 3000 era
103 Middle Archean 3000 3400 era
104 Early Archean 3400 3800 era
Stratigraphic Tree TableThe Stratigraphic Tree Table (table 2-42) is used to store information about parent-child relationships
between time-stratigraphic intervals that occur in the Stratigraphic Time Scale Table. The strat_id attribute refers to atime-stratigraphic interval in the Stratigraphic Time Scale Table. The parent_id attribute refers to the strat_id of asecond interval in the Stratigraphic Time Scale Table which is a parent of the first. The purpose of defining therelationships in this table is to allow automated simplification of geologic maps based on time-stratigraphic units. Forexample, periods in stratigraphic time are defined as parts of a era and the era is further defined as a part of a eon.Then, in this table there would be two records for the period, Triassic, one showing the era (Mesozoic) as a parentand the other showing the eon (Phanerozoic) as a parent. There would also be a record for the era (Mesozoic) showingthe eon (Phanerozoic) as its parent. With this data in the archive, simplifying the map to any time-stratigraphic levelbecomes a simple table look-up operation. Another purpose of this table is to permit queries into the archive whichcould return data belonging to any time interval, including references to its subdivisions. Thus, a search forPrecambrian data could also return items described as Proterozoic, Early Proterozoic, Archean, Middle Archean, etc.
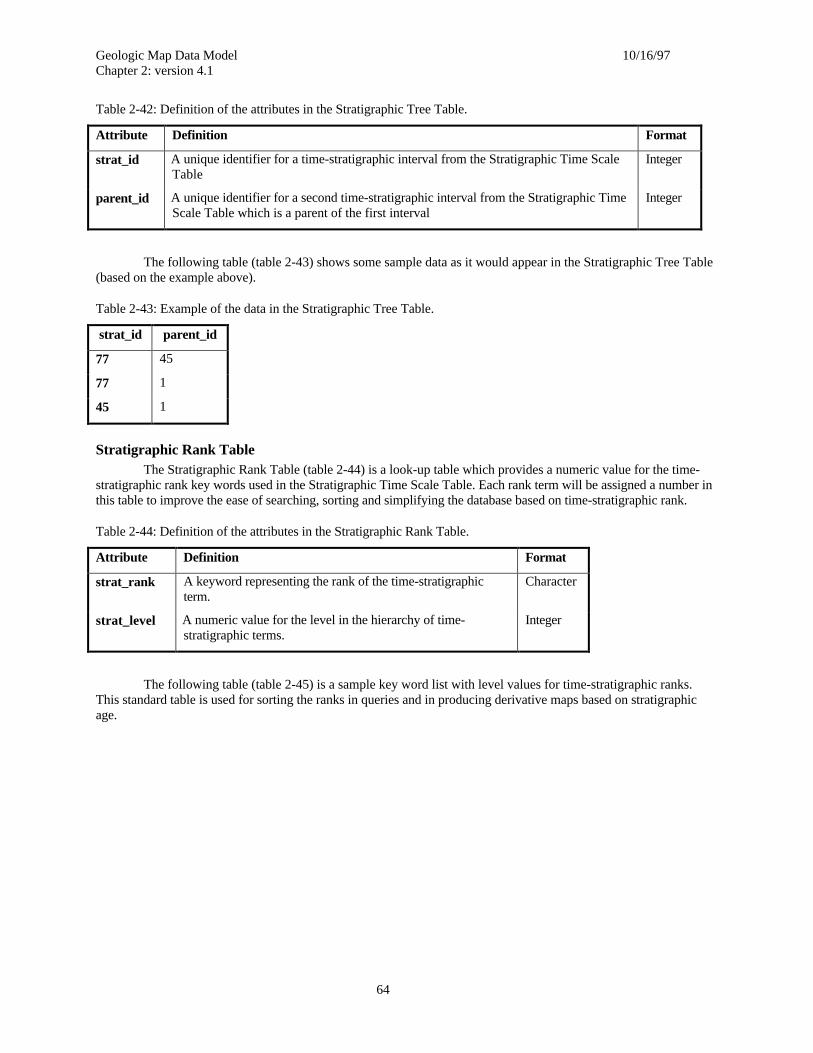
Geologic Map Data Model 10/16/97Chapter 2: version 4.1
64
Table 2-42: Definition of the attributes in the Stratigraphic Tree Table.
Attribute Definition Format
strat_id A unique identifier for a time-stratigraphic interval from the Stratigraphic Time ScaleTable
Integer
parent_id A unique identifier for a second time-stratigraphic interval from the Stratigraphic TimeScale Table which is a parent of the first interval
Integer
The following table (table 2-43) shows some sample data as it would appear in the Stratigraphic Tree Table(based on the example above).
Table 2-43: Example of the data in the Stratigraphic Tree Table.
strat_id parent_id
77 45
77 1
45 1
Stratigraphic Rank TableThe Stratigraphic Rank Table (table 2-44) is a look-up table which provides a numeric value for the time-
stratigraphic rank key words used in the Stratigraphic Time Scale Table. Each rank term will be assigned a number inthis table to improve the ease of searching, sorting and simplifying the database based on time-stratigraphic rank.
Table 2-44: Definition of the attributes in the Stratigraphic Rank Table.
Attribute Definition Format
strat_rank A keyword representing the rank of the time-stratigraphicterm.
Character
strat_level A numeric value for the level in the hierarchy of time-stratigraphic terms.
Integer
The following table (table 2-45) is a sample key word list with level values for time-stratigraphic ranks.This standard table is used for sorting the ranks in queries and in producing derivative maps based on stratigraphicage.
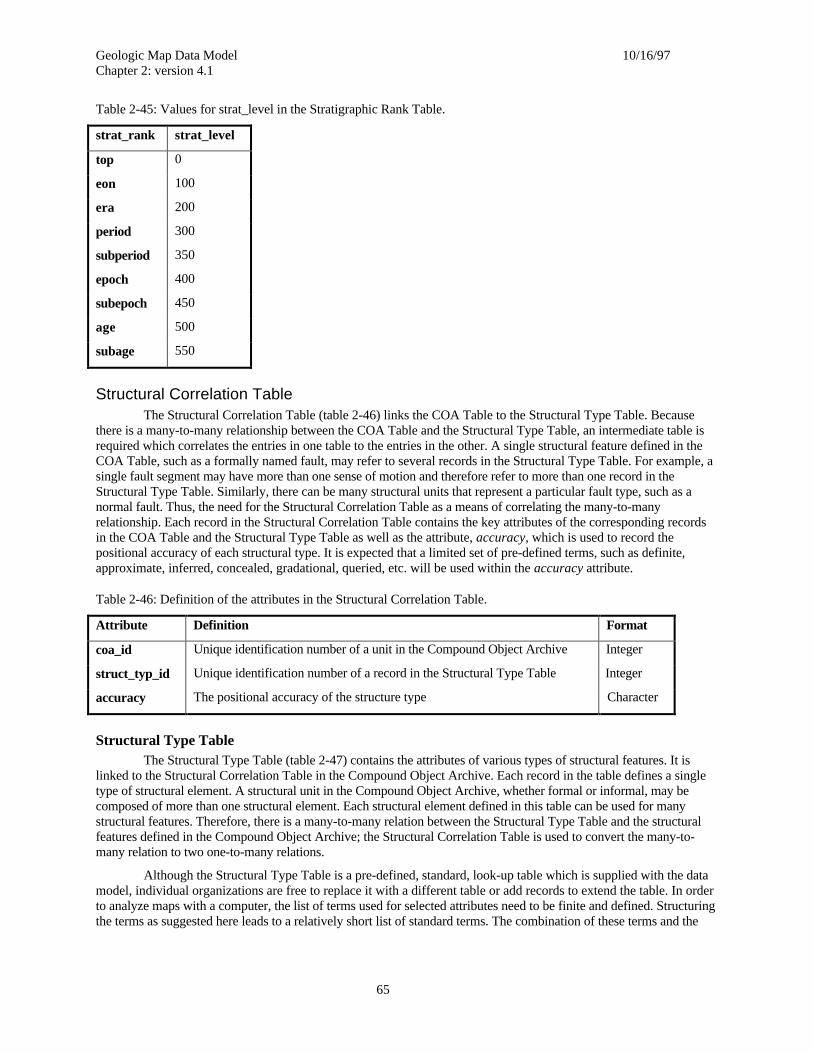
Geologic Map Data Model 10/16/97Chapter 2: version 4.1
65
Table 2-45: Values for strat_level in the Stratigraphic Rank Table.
strat_rank strat_level
top 0
eon 100
era 200
period 300
subperiod 350
epoch 400
subepoch 450
age 500
subage 550
Structural Correlation TableThe Structural Correlation Table (table 2-46) links the COA Table to the Structural Type Table. Because
there is a many-to-many relationship between the COA Table and the Structural Type Table, an intermediate table isrequired which correlates the entries in one table to the entries in the other. A single structural feature defined in theCOA Table, such as a formally named fault, may refer to several records in the Structural Type Table. For example, asingle fault segment may have more than one sense of motion and therefore refer to more than one record in theStructural Type Table. Similarly, there can be many structural units that represent a particular fault type, such as anormal fault. Thus, the need for the Structural Correlation Table as a means of correlating the many-to-manyrelationship. Each record in the Structural Correlation Table contains the key attributes of the corresponding recordsin the COA Table and the Structural Type Table as well as the attribute, accuracy, which is used to record thepositional accuracy of each structural type. It is expected that a limited set of pre-defined terms, such as definite,approximate, inferred, concealed, gradational, queried, etc. will be used within the accuracy attribute.
Table 2-46: Definition of the attributes in the Structural Correlation Table.
Attribute Definition Fo rmat
coa_id Unique identification number of a unit in the Compound Object Archive Integer
struct_typ_id Unique identification number of a record in the Structural Type Table Integer
accuracy The positional accuracy of the structure type Character
Structural Type TableThe Structural Type Table (table 2-47) contains the attributes of various types of structural features. It is
linked to the Structural Correlation Table in the Compound Object Archive. Each record in the table defines a singletype of structural element. A structural unit in the Compound Object Archive, whether formal or informal, may becomposed of more than one structural element. Each structural element defined in this table can be used for manystructural features. Therefore, there is a many-to-many relation between the Structural Type Table and the structuralfeatures defined in the Compound Object Archive; the Structural Correlation Table is used to convert the many-to-many relation to two one-to-many relations.
Although the Structural Type Table is a pre-defined, standard, look-up table which is supplied with the datamodel, individual organizations are free to replace it with a different table or add records to extend the table. In orderto analyze maps with a computer, the list of terms used for selected attributes need to be finite and defined. Structuringthe terms as suggested here leads to a relatively short list of standard terms. The combination of these terms and the
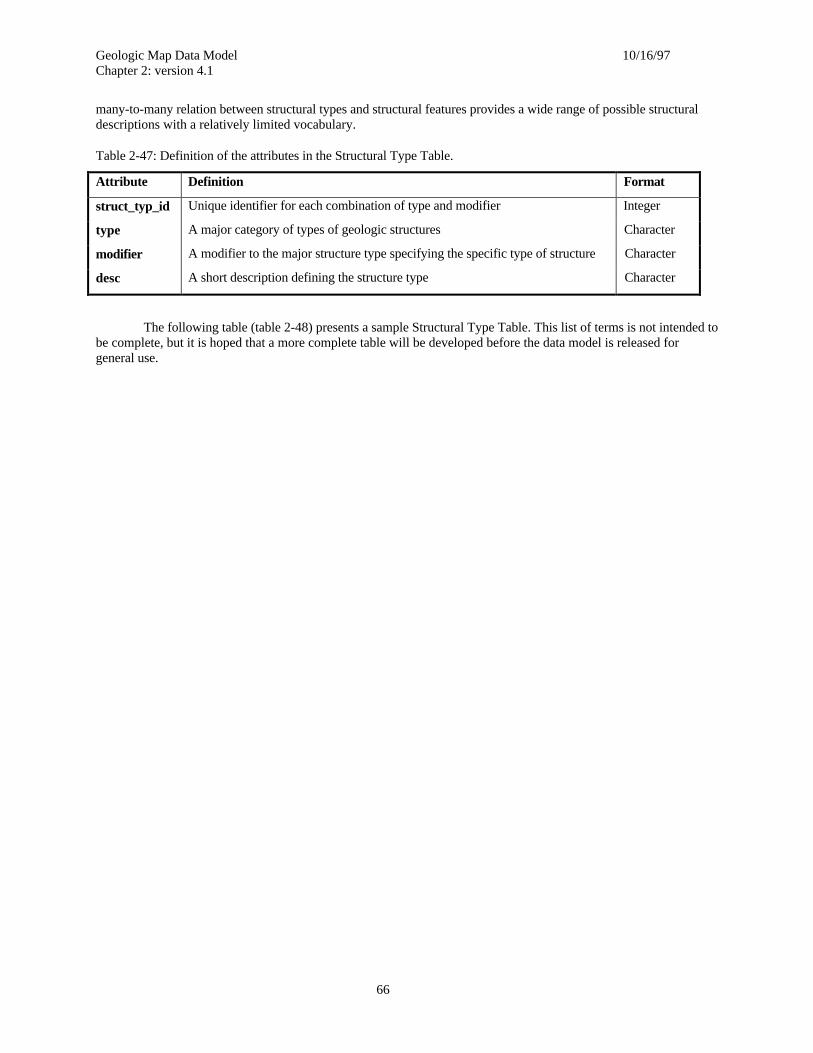
Geologic Map Data Model 10/16/97Chapter 2: version 4.1
66
many-to-many relation between structural types and structural features provides a wide range of possible structuraldescriptions with a relatively limited vocabulary.
Table 2-47: Definition of the attributes in the Structural Type Table.
Attribute Definition Format
struct_typ_id Unique identifier for each combination of type and modifier Integer
type A major category of types of geologic structures Character
modifier A modifier to the major structure type specifying the specific type of structure Character
desc A short description defining the structure type Character
The following table (table 2-48) presents a sample Structural Type Table. This list of terms is not intended tobe complete, but it is hoped that a more complete table will be developed before the data model is released forgeneral use.

Geologic Map Data Model 10/16/97Chapter 2: version 4.1
67
Table 2-48: A sample of proposed values for the attributes in the Structural Type Table.Definitions for the terms are taken from Jackson (1997). The list is incomplete.
struct_typ_id type modifier desc
1 contact unknown A contact of unknown type
2 contact conformable A conformable contact
3 contact unconformable An unconformable contact
4 contact facies A facies boundary between two map units
5 contact intrusive
6 contact scratch
7 fault unknown
8 fault normal
9 fault detachment
10 fault reverse
11 fault thrust
12 fault low-angle thrust
13 fault strike-slip
14 fault strike-slip dextral
15 fault strike-slip sinistral
16 fold anticline
17 fold anticline, plunging
18 fold anticline, plunging in
19 fold anticline, plunging out
20 fold anticline, overturned
21 fold syncline
22 fold syncline, plunging
23 fold syncline, plunging in
24 fold syncline, plunging out
25 fold syncline, overturned
26 fold monocline
Metamorphic Overlay TableThe Metamorphic Overlay Table (table 2-49), used to store information about metamorphic overlay units, is
included as an example of other types of unit description tables which could be added to the data model. Note thedifference between rock units that happen to be metamorphic in character (described in the Rock Unit Table) andmetamorphic overlays. This table is used to describe units of a metamorphic character which overlie or aresuperimposed on pre-existing rock units. These units are different in that they are represented on a map as polygonalshapes which are superimposed on and crosscut the underlying rock units. Examples would include metamorphicgradient zones, metamorphic aureoles, etc. Similar additional types of units could be defined for alteration zones or
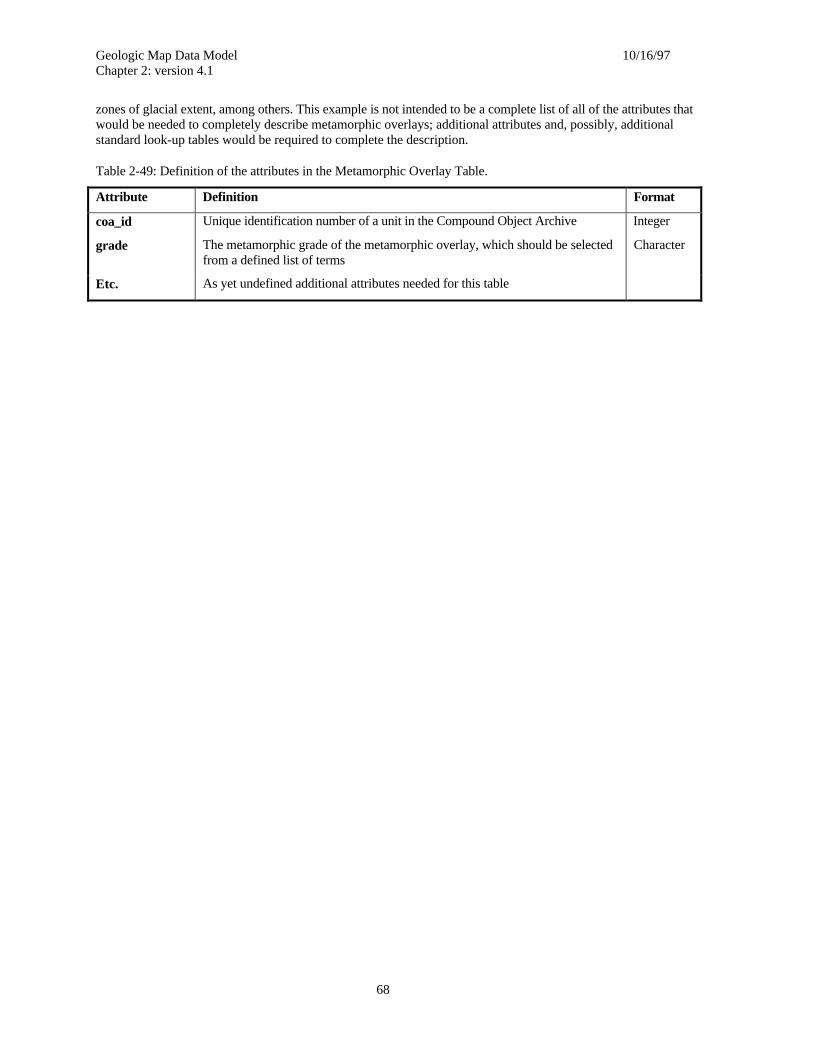
Geologic Map Data Model 10/16/97Chapter 2: version 4.1
68
zones of glacial extent, among others. This example is not intended to be a complete list of all of the attributes thatwould be needed to completely describe metamorphic overlays; additional attributes and, possibly, additionalstandard look-up tables would be required to complete the description.
Table 2-49: Definition of the attributes in the Metamorphic Overlay Table.
Attribute Definition Format
coa_id Unique identification number of a unit in the Compound Object Archive Integer
grade The metamorphic grade of the metamorphic overlay, which should be selectedfrom a defined list of terms
Character
Etc. As yet undefined additional attributes needed for this table
Geologic Map Data Model 10/16/97Chapter 2: version 4.1
69
References CitedBally, A. W. and Palmer, A. R., 1989, Decade of North American Geology Geologic Time Scale: Geologic Society of
America, The Geology of North America, vol. A, p. 601.
Jackson, J. A., ed., 1997, Glossary of Geology, fourth ed.: American Geological Institute, Alexandria, Virginia,769 pp.
Wiederhold, Gio, 1983, Database Design, second ed.: McGraw-Hill, New York, 751 pp.
Williams, H., Turner, f. J., and Gilbert, C. M., 1954, Petrography: an introduction to the study of rocks in thin sections:Freeman, San Francisco, 406 pp.
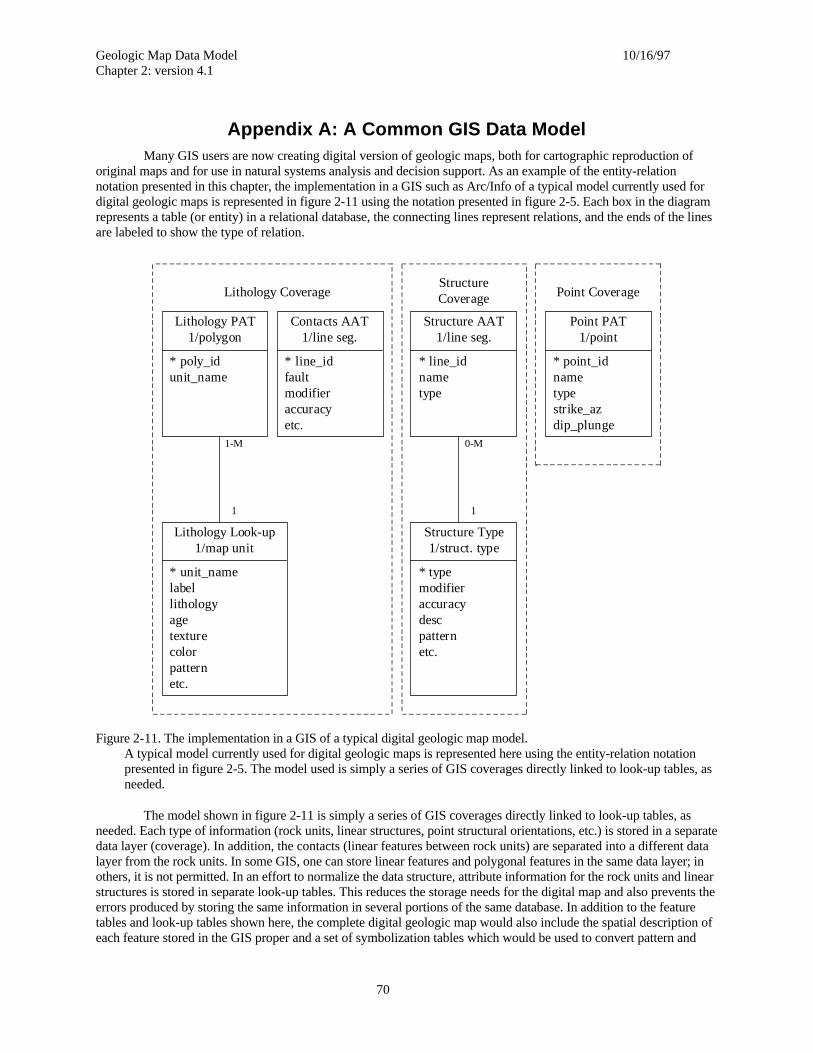
Geologic Map Data Model 10/16/97Chapter 2: version 4.1
70
Appendix A: A Common GIS Data ModelMany GIS users are now creating digital version of geologic maps, both for cartographic reproduction of
original maps and for use in natural systems analysis and decision support. As an example of the entity-relationnotation presented in this chapter, the implementation in a GIS such as Arc/Info of a typical model currently used fordigital geologic maps is represented in figure 2-11 using the notation presented in figure 2-5. Each box in the diagramrepresents a table (or entity) in a relational database, the connecting lines represent relations, and the ends of the linesare labeled to show the type of relation.
Figure 2-11. The implementation in a GIS of a typical digital geologic map model.A typical model currently used for digital geologic maps is represented here using the entity-relation notationpresented in figure 2-5. The model used is simply a series of GIS coverages directly linked to look-up tables, asneeded.
The model shown in figure 2-11 is simply a series of GIS coverages directly linked to look-up tables, asneeded. Each type of information (rock units, linear structures, point structural orientations, etc.) is stored in a separatedata layer (coverage). In addition, the contacts (linear features between rock units) are separated into a different datalayer from the rock units. In some GIS, one can store linear features and polygonal features in the same data layer; inothers, it is not permitted. In an effort to normalize the data structure, attribute information for the rock units and linearstructures is stored in separate look-up tables. This reduces the storage needs for the digital map and also prevents theerrors produced by storing the same information in several portions of the same database. In addition to the featuretables and look-up tables shown here, the complete digital geologic map would also include the spatial description ofeach feature stored in the GIS proper and a set of symbolization tables which would be used to convert pattern and
Structure AAT1/line seg.
* line_idnametype
Point PAT1/point
* point_idnametypestrike_azdip_plunge
Lithology CoverageStructureCoverage
Lithology PAT1/polygon
* poly_idunit_name
Contacts AAT1/line seg.
* line_idfaultmodifieraccuracyetc.
Lithology Look-up1/map unit
* unit_namelabellithologyagetexturecolorpatternetc.
Structure Type1/struct. type
* typemodifieraccuracydescpatternetc.
11
1-M 0-M
Point Coverage
Geologic Map Data Model 10/16/97Chapter 2: version 4.1
71
symbol names in the feature attribute tables to actual display symbolization. The simple model, although extensivelyused, has serious drawbacks when attempting to combine maps or to develop derivative maps. To achieve these goals,more information must be included in the model.
Of the many possible examples of data required for spatial analysis of digital geologic maps not provided bythe simple model, only a few will be noted here. It is often desirable to be able to select areas that are underlain byrocks within a certain age span or to select all areas with rocks which fit a general lithologic class. For example,suppose the user needs to separate all areas underlain by Tertiary rocks from all areas underlain by older rocks.Although the simple model (figure 2-11) includes an age attribute for all polygons, the system doesn’t include anyinformation about which age categories are within the Tertiary. To select all polygons representing Tertiary rocks, theuser would have to select all polygons with any of the possible Tertiary age attributes (Pliocene, Cenozoic, etc.) plusall possible abbreviations. More importantly, the user would have to know of all of the possibilities ahead of time. Itis more efficient and less error prone to include the geologic time hierarchy in the data model.
If the user needed to separate all areas underlain by volcanic rock, a similar problem would occur. Without alithologic hierarchy built into the model, the user would have to know all of the possible lithologic terms that could beused for volcanic rock units. If the user was interested in all areas underlain by Tertiary volcanic rocks, then thecomplexity of the search would increase. Similar examples could be used to demonstrate the need for additionalmodel complexity for all polygon data as well as for lines and points. The trade-off for additional model complexity isthe increased time required to build the model and to enter data for each individual map. In the sections above whichdescribe a relational data model for digital geologic maps, a compromise has been attempted which balances theinformation commonly needed for modeling and analysis with the need for flexibility and efficiency.
There is an additional attribute, not shown in the simple model in figure 2-11, which should be attached toevery feature on every data layer. That is the source of the feature. At the time that a geologic map is first created in adigital format, it often seems wasteful to attach a source attribute to every feature on every data layer. In allprobability, every feature on the map will have the same source, the original map (whether published or not).However, as the original digital geologic map is used it will be periodically updated and modified. Each time achange is made to the digital version of the map, the new source of the changes should be attached to every featurewhich is changed. As the map is then used in analytical procedures, the source of each feature will be carried alongwith the feature. At any subsequent stage of any analysis, it will then be possible to identify any individual feature andtrace it back to its original source. The same is true of any derivative map which is created from features from severaloriginal maps. This is the only way that the chain of responsibility for a particular analytical result can be traced backto its origins.
Geologic Map Data Model 10/16/97Chapter 2: version 4.1
72
Appendix B: Hierarchical Coding SchemesThere is a tendency, when designing digital geologic data models, to develop extensive coding schemes for
some attributes. There are advantages and disadvantages to most coding schemes. The usual advantage is to savestorage space. In the extreme, the designer could assign numeric values to all attributes and force the user to eitherremember an entire array of numeric codes or use charts to look up the codes every time a query was made of thedatabase. Although this approach minimizes the storage space required for the database, it places an unreasonableburden on the user. The goal of all digital geologic maps, after all, is to make the user’s job easier and more efficient.The discussion above on the use of look-up tables demonstrates one method of achieving similar storage space savingswithout adding the burden of looking up codes to the user.
The other extreme of not coding any attributes also has its disadvantages. Many attributes are difficult tomanipulate if left as descriptive text. As an example of the difficulties which can be encountered, consider encodingrock units so that their stratigraphic sequence can be analyzed. The goal is to be able to search the database for allrock units which are older than a given unit (or younger than, or the same age as, or some more complex combination).Furthermore, the search is to be based on a coding attached to the unit name, not on an attribute which represents theunit’s stratigraphic age. The reason for not using the unit’s age is because in many areas ages are only poorly knownand an entire sequence of rock units may be assigned the same, broad age. However, the stratigraphic sequence ofunits may be known so that relative ages are more useful than absolute ages.
The first attempt may be to simply assign a number to each rock unit based on its position in the stratigraphiccolumn. As long as the project is confined to a single map with no rock units which crosscut time horizons, thisapproach works well. Relative age can be determined simply by comparing a sequence of numbers; if the numbers runfrom oldest to youngest, then unit 5 is always older than unit 6. There are some obvious problems with this approach.First, there is no allowance made for units with poorly constrained relative ages. What number would be assigned toan intrusive unit if the intrusive age was unknown within the resolution of the rest of the rock units? There are alsoproblems caused by attempting to expand the system to adjacent maps. Every time a new unit is added to the totalstratigraphic column, a complete renumbering is required. A similar problem occurs whenever the map is updated. Ifnew units are created or the relative ages of units are changed, a complete renumbering is required. Another problemmay occur within a single map or when adjacent maps are joined. That is the problem of a single unit on one portion ofthe map being equivalent in age to several units on another portion of the map. If a single unit, A, is equivalent to units5, 6, and 7, what number is assigned to A? This coding scheme is only workable for local problems where there is nointent to expand to adjacent areas.
Usually, these coding attempts lead to the development of some sort of hierarchical coding scheme. One suchcoding scheme goes something like this: assign large numbers to the major divisions, assign intermediate numbers tosmaller divisions, and assign smaller intermediate numbers to even small divisions. For example, let 1000 representthe Cenozoic, 2000 represent Mesozoic, 3000 represent Paleozoic, and 4000 represent Precambrian. Within theMesozoic, 2100 might represent Cretaceous, 2200 Jurassic, and 2300 Triassic. Within the Triassic, 2310 mightrepresent upper Triassic, 2320 middle Triassic, and 2330 lower Triassic. For those who use such things, 2311 mightrepresent Rhaetian, 2312 Norian, etc.
This scheme solves some of the problems with the preceding attempt. In particular, if a rock unit representsthe entire Triassic on one portion of the map, it would be assigned a code of 2300. If the Triassic on another portion ofthe map was divided into upper, middle, and lower portions, they would be assigned codes of 2310, 2320, and 2330.Re-coding would not be required. If existing units were later subdivided, or new units were added by combiningadjacent maps, no re-coding would be required. The problem of poorly constrained ages has not been completelysolved. The system will work well for rock units which are only known to be Mesozoic, for example, but what codecan be assigned to a rock unit that is known to be either Permian or Triassic? What about a rock unit that is known tospan the Permian-Triassic boundary? Another problem occurs if the area includes several rock units of upper Triassicage. It may not be possible to fit any of the units into the individual stages of the upper Triassic, but the relative ages ofthe rock units may be known. How would these units be coded? If they are coded 2311, 2312, and 2313, theimplication is that the stage is known for each unit; if they are all coded as 2310, the information about their relativeages is lost. Finally, what code would be assigned to several units for which their relative age is known, but which areall within the Norian? There is not a fine enough subdivision to accommodate these units in the current scheme.Although this scheme is more useful than the previous example, it still falls short of being universally applicable.
Geologic Map Data Model 10/16/97Chapter 2: version 4.1
73
The scheme of the previous example can be improved by providing two codes for each rock unit,representing a maximum age and a minimum age. This will solve the problems of the Permo-Triassic rock units andtheir relatives. It can also be extended by allowing fractional codes. These can be used to code multiple units whichall fall within the smallest subdivision. For example, three Norian units could be coded 2312.1, 2312.2, and 2312.3. Asimilar trick could then be used to code the three units which are known to be upper Triassic with stage unknown as2310.1, 2310.2, and 2310.3. This scheme comes close to meeting the original objectives at the cost of somecomplication. It still does not solve all of the problems of joining adjacent maps. Unit 2310.1 on one map may not be atime equivalent to unit 2310.1 on an adjacent map. The solution proposed in the current relational data model is to useupper and lower age attributes for each unit as described here, and to also include knowledge of the geologic timescale in the model so that actual time scale names can be used instead of numeric codes. In addition, a separate table isused to show relationships between units. The user can then specify the exact relationship between any two units in thearchive, whether on the same map sheet or not.
The lesson to be learned from these hierarchical coding examples is that it is easy to code oneself into acorner. The best coding schemes are always open-ended. No matter how many slots are set aside for future growth, ifthe number is fixed it will eventually be found to be insufficient. Coding schemes offer the potential for greatlyenhancing the utility of digital data, but they must be devised with care and concern for future expansion andflexibility.
Geologic Map Data Model 10/16/97Chapter 2: version 4.1
74
Appendix C: Implementation Issues
Point featuresA restriction of many GIS’s (including ARC/INFO) is that point data and polygon data can not be stored in
the same data layer. The reason for this restriction is that polygons use label points to link the graphic description ofthe polygon with the polygon attribute table. The polygon attribute data is stored in the same format as point attributedata. To avoid confusing the topological structure of the data layer, data points and polygon label points must bestored in separate attribute tables. Therefore, points and polygons are stored in separate data layers. Points and arcscan be stored on the same layer, but it is not recommended for digital geologic maps. When combining digital geologywith other types of data, the point data is often not needed. It is much more common to use the line or polygon data, orboth, than it is to use the point data. Point data is more commonly used for cartographic purposes to create a hard copyof the digital map than in analytical work.
Linear featuresLinear features are in many ways more complicated than point features. There are more types of linear
features that are likely to be found on typical geologic maps and they interact in complicated patterns. The firstquestion that arises in implementing the linear features portion of the Spatial Object Archive is whether the linearfeatures should be combined with the polygon features. The lines which make up the borders of polygons are alsolinear features; they are nearly all contacts, faults, or area boundaries. If the linear features are placed on a separatedata layer, nearly all of the lines on the polygon data layer will also appear on the linear features data layers. Thisduplication of data increases both the storage space required for the digital map and the potential for creatingproblems by modifying one data layer without making identical changes to the other data layer. In addition, all lines onthe map are generally entered into the GIS at the same time. Thus, to make two data layers out of the original raw data,the lines have to be separated, or copied from one layer to the other.
Unfortunately, there are some problems with combining all linear features with all polygons on the same datalayer. Most of these problems have to do with the way the GIS stores data and structures the data topologically. Linesare broken into segments at every line intersection. The same is true of polygons. Every line which crosses an areadivides that area into two polygons. Even though the two resulting polygons may represent the same geologic unit andmay have identical attributes, if they are separated by a line, they are topologically two distinct polygons. Ordinarily,this does not cause any problems; the GIS keeps track of all the polygons and their attributes so that whenever a userqueries polygons with the appropriate attribute, both polygons would appear. A problem does appear, however, if thepolygons are plotted with some types of area-filling patterns. Some area-filling patterns use the edge of the polygon asthe beginning of the pattern for each line of the pattern. If an area representing a single rock unit is crossed by a linearfeature (a fault, for example), the GIS stores the area as two polygons with the fault making up part of the boundary ofeach polygon. If the map is plotted with an area-filling pattern, the patterns will be mis-aligned between the twopolygons, even if the fault is not plotted. If area-filling patterns are not used, or the cartographic display of the map isnot important, this problem may not affect the design of the digital map.
There is another aspect of the multiple polygon problem which may not be initially recognized. If users of thedigital map will be doing any analysis using areas of polygonal features, the multiple polygon per area problem causedby storing the linear features with the polygons will give erroneous results that are often overlooked. For each digitalmap design, the choice must be made whether it’s more important to reduce the size of the data files and improve theease of updating by leaving all linear feature and polygons in a single data layer or to achieve maximum flexibility ofthe digital map for unknown future uses by separating the two data types. For presentation of the data model, the twodata types are shown as separate coverages. They may, however, be combined into a single coverage if the userprefers.
Polygonal featuresPolygonal features form the most basic information supplied on a geologic map and the background for most
of the remaining features. There are two different types of polygonal features. The first type includes all geologic unitswhich are large enough to be shown in two dimensions at the original map scale and other features such as water and

Geologic Map Data Model 10/16/97Chapter 2: version 4.1
75
ice through which the rock units have not been mapped. The second type of polygonal feature includes all types ofoverlays which are large enough to be depicted in two dimensions on the original map. The difference between thesetwo classes of features is that the first set always forms a complete, non-overlapping, data layer while the second setoverlaps the first, is usually not complete, and occasionally has internal overlaps. The current state of GIS technologymakes it difficult to work with a topological structure of overlapping polygonal areas. Most GIS’s require overlappingpolygons to be kept on separate data layers. Until this restriction is relaxed for most common GIS’s, multiple polygondata layers will be required in any map area which contains overlays. All geologic units which do not overlap, such asrock units and water bodies can be stored on one data layer, and overlays will be stored on additional data layers, asnecessary.
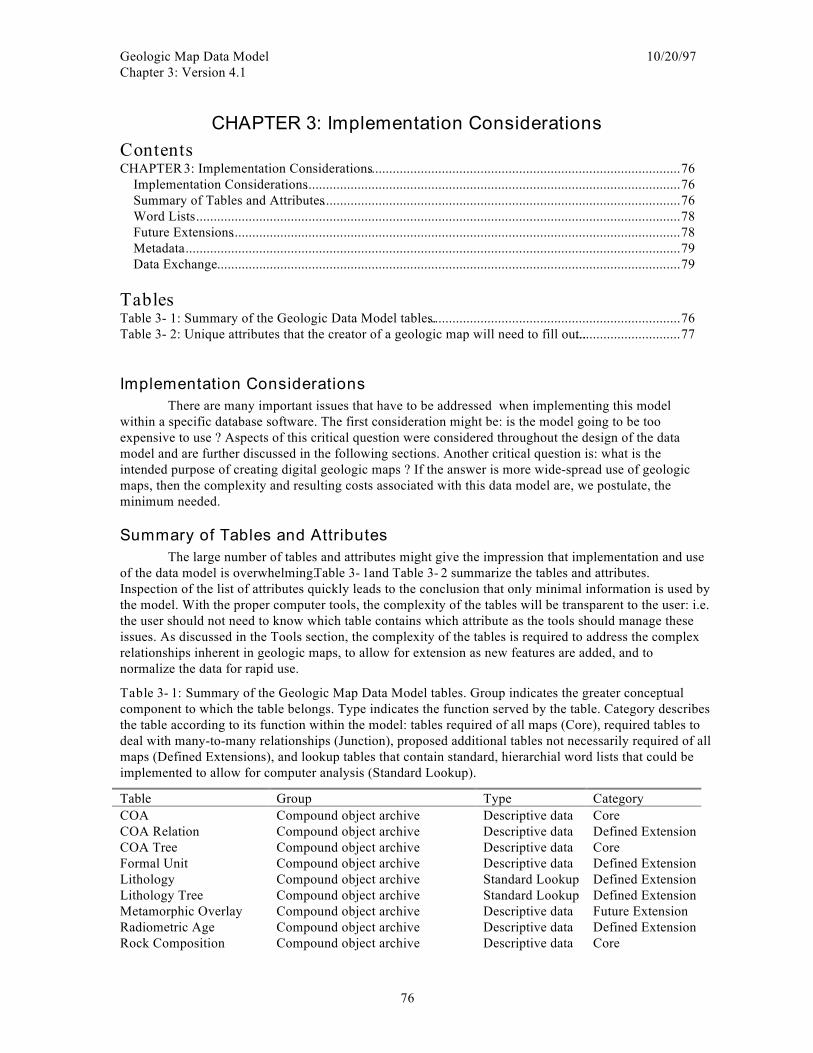
Geologic Map Data Model 10/20/97Chapter 3: Version 4.1
76
CHAPTER 3: Implementation ConsiderationsContentsCHAPTER 3: Implementation Considerations.........................................................................................76
Implementation Considerations...........................................................................................................76Summary of Tables and Attributes.......................................................................................................76Word Lists..........................................................................................................................................78Future Extensions................................................................................................................................78Metadata.............................................................................................................................................79Data Exchange....................................................................................................................................79
TablesTable 3- 1: Summary of the Geologic Data Model tables.........................................................................76Table 3- 2: Unique attributes that the creator of a geologic map will need to fill out................................77
Implementation ConsiderationsThere are many important issues that have to be addressed when implementing this model
within a specific database software. The first consideration might be: is the model going to be tooexpensive to use ? Aspects of this critical question were considered throughout the design of the datamodel and are further discussed in the following sections. Another critical question is: what is theintended purpose of creating digital geologic maps ? If the answer is more wide-spread use of geologicmaps, then the complexity and resulting costs associated with this data model are, we postulate, theminimum needed.
Summary of Tables and AttributesThe large number of tables and attributes might give the impression that implementation and use
of the data model is overwhelming. Table 3- 1and Table 3- 2 summarize the tables and attributes.Inspection of the list of attributes quickly leads to the conclusion that only minimal information is used bythe model. With the proper computer tools, the complexity of the tables will be transparent to the user: i.e.the user should not need to know which table contains which attribute as the tools should manage theseissues. As discussed in the Tools section, the complexity of the tables is required to address the complexrelationships inherent in geologic maps, to allow for extension as new features are added, and tonormalize the data for rapid use.
Table 3- 1: Summary of the Geologic Map Data Model tables. Group indicates the greater conceptualcomponent to which the table belongs. Type indicates the function served by the table. Category describesthe table according to its function within the model: tables required of all maps (Core), required tables todeal with many-to-many relationships (Junction), proposed additional tables not necessarily required of allmaps (Defined Extensions), and lookup tables that contain standard, hierarchial word lists that could beimplemented to allow for computer analysis (Standard Lookup).
Table Group Type CategoryCOA Compound object archive Descriptive data CoreCOA Relation Compound object archive Descriptive data Defined ExtensionCOA Tree Compound object archive Descriptive data CoreFormal Unit Compound object archive Descriptive data Defined ExtensionLithology Compound object archive Standard Lookup Defined ExtensionLithology Tree Compound object archive Standard Lookup Defined ExtensionMetamorphic Overlay Compound object archive Descriptive data Future ExtensionRadiometric Age Compound object archive Descriptive data Defined ExtensionRock Composition Compound object archive Descriptive data Core
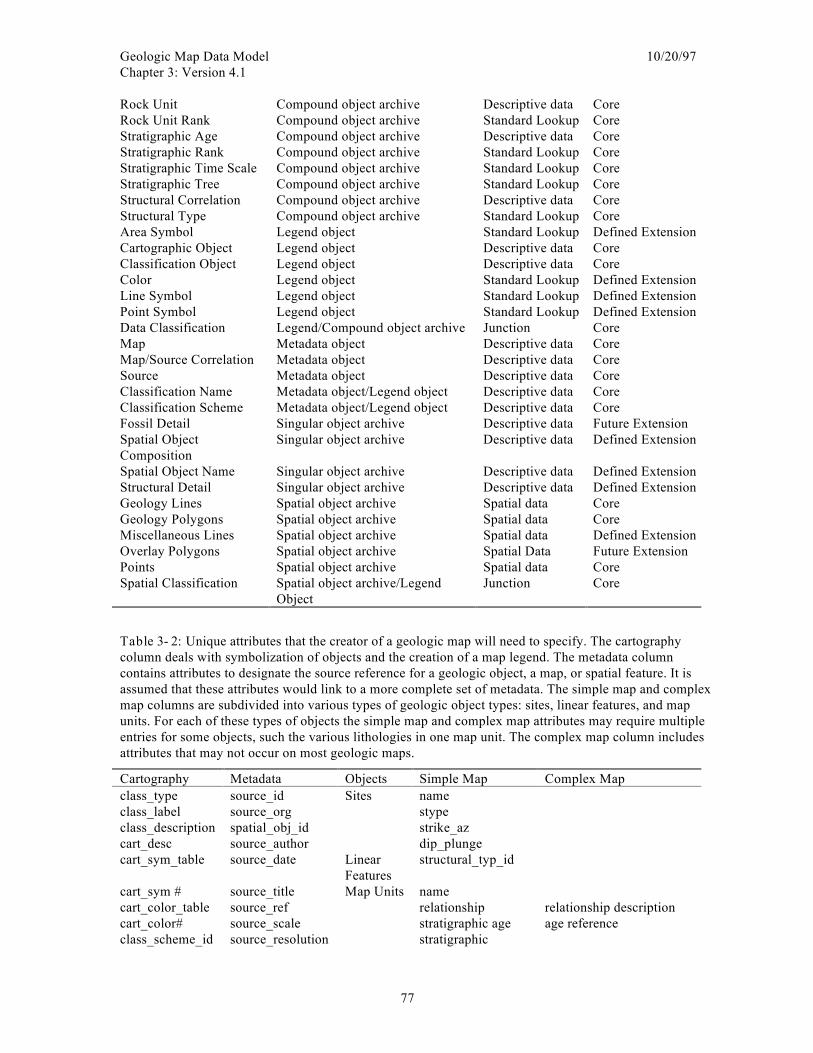
Geologic Map Data Model 10/20/97Chapter 3: Version 4.1
77
Rock Unit Compound object archive Descriptive data CoreRock Unit Rank Compound object archive Standard Lookup CoreStratigraphic Age Compound object archive Descriptive data CoreStratigraphic Rank Compound object archive Standard Lookup CoreStratigraphic Time Scale Compound object archive Standard Lookup CoreStratigraphic Tree Compound object archive Standard Lookup CoreStructural Correlation Compound object archive Descriptive data CoreStructural Type Compound object archive Standard Lookup CoreArea Symbol Legend object Standard Lookup Defined ExtensionCartographic Object Legend object Descriptive data CoreClassification Object Legend object Descriptive data CoreColor Legend object Standard Lookup Defined ExtensionLine Symbol Legend object Standard Lookup Defined ExtensionPoint Symbol Legend object Standard Lookup Defined ExtensionData Classification Legend/Compound object archive Junction CoreMap Metadata object Descriptive data CoreMap/Source Correlation Metadata object Descriptive data CoreSource Metadata object Descriptive data CoreClassification Name Metadata object/Legend object Descriptive data CoreClassification Scheme Metadata object/Legend object Descriptive data CoreFossil Detail Singular object archive Descriptive data Future ExtensionSpatial ObjectComposition
Singular object archive Descriptive data Defined Extension
Spatial Object Name Singular object archive Descriptive data Defined ExtensionStructural Detail Singular object archive Descriptive data Defined ExtensionGeology Lines Spatial object archive Spatial data CoreGeology Polygons Spatial object archive Spatial data CoreMiscellaneous Lines Spatial object archive Spatial data Defined ExtensionOverlay Polygons Spatial object archive Spatial Data Future ExtensionPoints Spatial object archive Spatial data CoreSpatial Classification Spatial object archive/Legend
ObjectJunction Core
Table 3- 2: Unique attributes that the creator of a geologic map will need to specify. The cartographycolumn deals with symbolization of objects and the creation of a map legend. The metadata columncontains attributes to designate the source reference for a geologic object, a map, or spatial feature. It isassumed that these attributes would link to a more complete set of metadata. The simple map and complexmap columns are subdivided into various types of geologic object types: sites, linear features, and mapunits. For each of these types of objects the simple map and complex map attributes may require multipleentries for some objects, such the various lithologies in one map unit. The complex map column includesattributes that may not occur on most geologic maps.
Cartography Metadata Objects Simple Map Complex Mapclass_type source_id Sites nameclass_label source_org stypeclass_description spatial_obj_id strike_azcart_desc source_author dip_plungecart_sym_table source_date Linear
Featuresstructural_typ_id
cart_sym # source_title Map Units namecart_color_table source_ref relationship relationship descriptioncart_color# source_scale stratigraphic age age referenceclass_scheme_id source_resolution stratigraphic
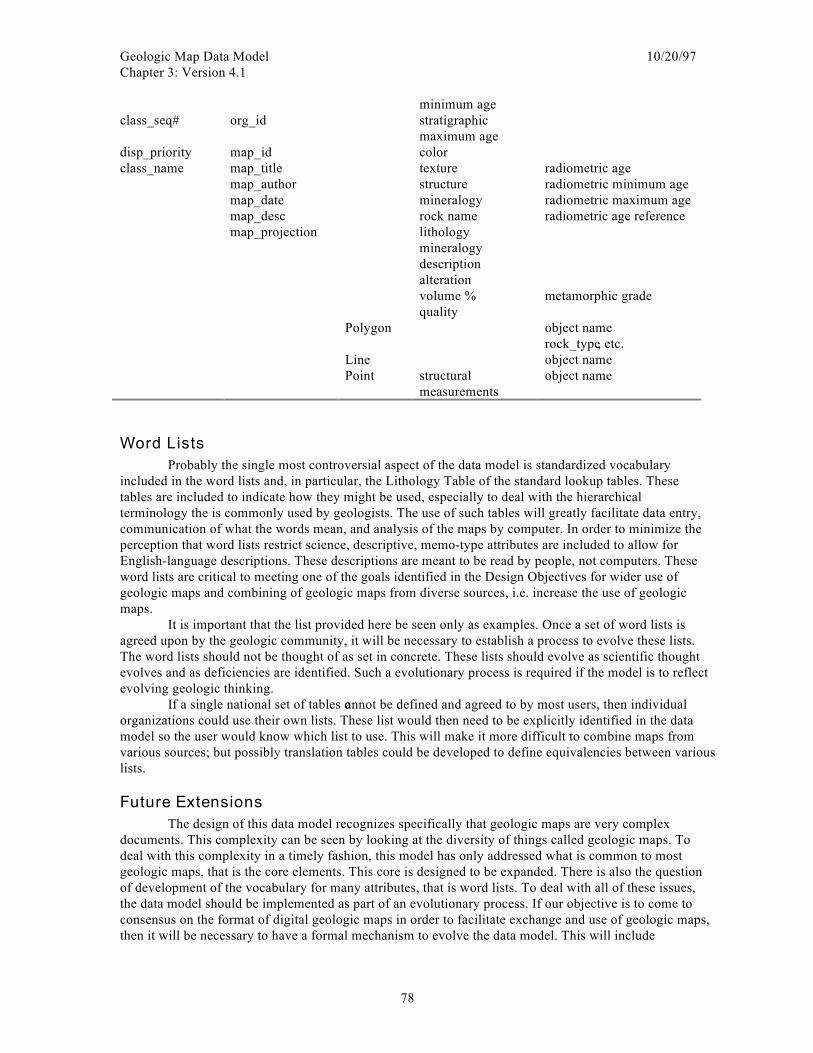
Geologic Map Data Model 10/20/97Chapter 3: Version 4.1
78
minimum ageclass_seq# org_id stratigraphic
maximum agedisp_priority map_id colorclass_name map_title texture radiometric age
map_author structure radiometric minimum agemap_date mineralogy radiometric maximum agemap_desc rock name radiometric age referencemap_projection lithology
mineralogydescriptionalterationvolume % metamorphic gradequality
Polygon object namerock_type, etc.
Line object namePoint structural
measurementsobject name
Word ListsProbably the single most controversial aspect of the data model is standardized vocabulary
included in the word lists and, in particular, the Lithology Table of the standard lookup tables. Thesetables are included to indicate how they might be used, especially to deal with the hierarchicalterminology the is commonly used by geologists. The use of such tables will greatly facilitate data entry,communication of what the words mean, and analysis of the maps by computer. In order to minimize theperception that word lists restrict science, descriptive, memo-type attributes are included to allow forEnglish-language descriptions. These descriptions are meant to be read by people, not computers. Theseword lists are critical to meeting one of the goals identified in the Design Objectives for wider use ofgeologic maps and combining of geologic maps from diverse sources, i.e. increase the use of geologicmaps.
It is important that the list provided here be seen only as examples. Once a set of word lists isagreed upon by the geologic community, it will be necessary to establish a process to evolve these lists.The word lists should not be thought of as set in concrete. These lists should evolve as scientific thoughtevolves and as deficiencies are identified. Such a evolutionary process is required if the model is to reflectevolving geologic thinking.
If a single national set of tables cannot be defined and agreed to by most users, then individualorganizations could use their own lists. These list would then need to be explicitly identified in the datamodel so the user would know which list to use. This will make it more difficult to combine maps fromvarious sources; but possibly translation tables could be developed to define equivalencies between variouslists.
Future ExtensionsThe design of this data model recognizes specifically that geologic maps are very complex
documents. This complexity can be seen by looking at the diversity of things called geologic maps. Todeal with this complexity in a timely fashion, this model has only addressed what is common to mostgeologic maps, that is the core elements. This core is designed to be expanded. There is also the questionof development of the vocabulary for many attributes, that is word lists. To deal with all of these issues,the data model should be implemented as part of an evolutionary process. If our objective is to come toconsensus on the format of digital geologic maps in order to facilitate exchange and use of geologic maps,then it will be necessary to have a formal mechanism to evolve the data model. This will include

Geologic Map Data Model 10/20/97Chapter 3: Version 4.1
79
approving extensions and refinements to the model, sharing the cost of tool development for use of themodel with different GIS, and refinement of approved word lists. This refinement of word lists might alsoinclude, for example, addition of new terms to the list or development of standard translators betweenvarious ways of classifying rocks. Thus, some sort of standing, formal organization or mechanism will beneeded to deal with this evolution. Extensions and additional attributes have already been proposed andare listed in Appendix A.
MetadataThe implementation of metadata standards are rapidly evolving. We have identified several
attributes of geologic maps, Map and Source tables that are needed by the data model. Some of thismetadata needs to be computer accessible for the implementation of the data model. However, broadermetadata issues for geologic maps are the subject of another committee. Eventually the standards formetadata and geologic maps must come together.
Data ExchangeBecause of the separation of the spatial objects and their attributes, the diversity of spatial objects,
and the multi-map concepts in the design of the data model, the exchange of digital data files is notsimple. Exchange will require the transfer of several different types of files including GIS coverages,attribute tables, and files associated with map symbolization and the map legend. This diversity of filesand the complexity of the relations and connections of these files will require careful consideration in theimplementation of export procedures.
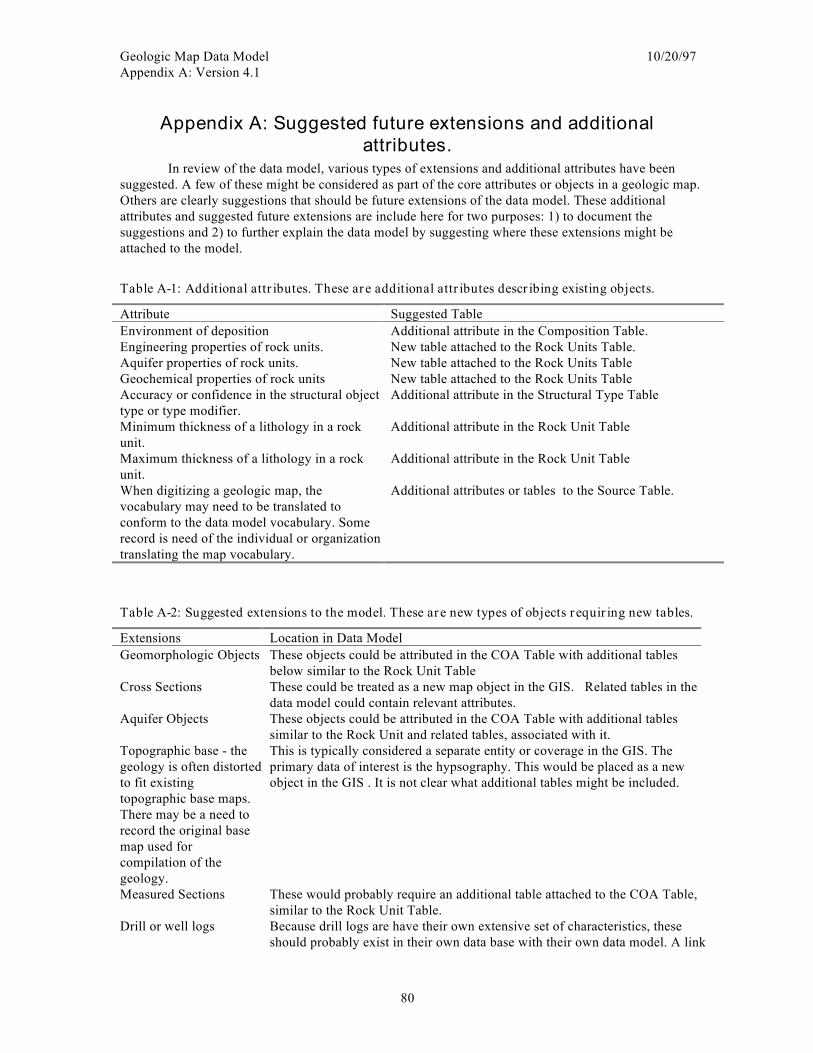
Geologic Map Data Model 10/20/97Appendix A: Version 4.1
80
Appendix A: Suggested future extensions and additionalattributes.
In review of the data model, various types of extensions and additional attributes have beensuggested. A few of these might be considered as part of the core attributes or objects in a geologic map.Others are clearly suggestions that should be future extensions of the data model. These additionalattributes and suggested future extensions are include here for two purposes: 1) to document thesuggestions and 2) to further explain the data model by suggesting where these extensions might beattached to the model.
Table A-1: Additional attributes. These are additional attributes describing existing objects.
Attribute Suggested TableEnvironment of deposition Additional attribute in the Composition Table.Engineering properties of rock units. New table attached to the Rock Units Table.Aquifer properties of rock units. New table attached to the Rock Units TableGeochemical properties of rock units New table attached to the Rock Units TableAccuracy or confidence in the structural objecttype or type modifier.
Additional attribute in the Structural Type Table
Minimum thickness of a lithology in a rockunit.
Additional attribute in the Rock Unit Table
Maximum thickness of a lithology in a rockunit.
Additional attribute in the Rock Unit Table
When digitizing a geologic map, thevocabulary may need to be translated toconform to the data model vocabulary. Somerecord is need of the individual or organizationtranslating the map vocabulary.
Additional attributes or tables to the Source Table.
Table A-2: Suggested extensions to the model. These are new types of objects requiring new tables.
Extensions Location in Data ModelGeomorphologic Objects These objects could be attributed in the COA Table with additional tables
below similar to the Rock Unit TableCross Sections These could be treated as a new map object in the GIS. Related tables in the
data model could contain relevant attributes.Aquifer Objects These objects could be attributed in the COA Table with additional tables
similar to the Rock Unit and related tables, associated with it.Topographic base - thegeology is often distortedto fit existingtopographic base maps.There may be a need torecord the original basemap used forcompilation of thegeology.
This is typically considered a separate entity or coverage in the GIS. Theprimary data of interest is the hypsography. This would be placed as a newobject in the GIS . It is not clear what additional tables might be included.
Measured Sections These would probably require an additional table attached to the COA Table,similar to the Rock Unit Table.
Drill or well logs Because drill logs are have their own extensive set of characteristics, theseshould probably exist in their own data base with their own data model. A link
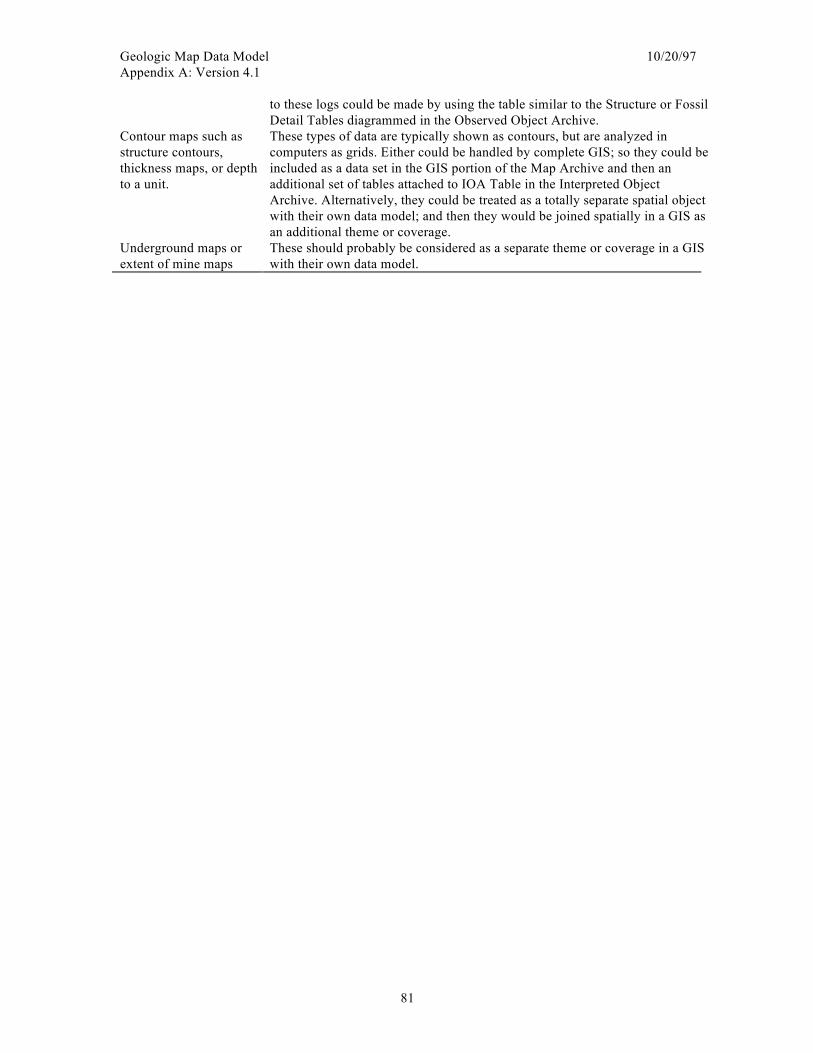
Geologic Map Data Model 10/20/97Appendix A: Version 4.1
81
to these logs could be made by using the table similar to the Structure or FossilDetail Tables diagrammed in the Observed Object Archive.
Contour maps such asstructure contours,thickness maps, or depthto a unit.
These types of data are typically shown as contours, but are analyzed incomputers as grids. Either could be handled by complete GIS; so they could beincluded as a data set in the GIS portion of the Map Archive and then anadditional set of tables attached to IOA Table in the Interpreted ObjectArchive. Alternatively, they could be treated as a totally separate spatial objectwith their own data model; and then they would be joined spatially in a GIS asan additional theme or coverage.
Underground maps orextent of mine maps
These should probably be considered as a separate theme or coverage in a GISwith their own data model.