Digital Advertising Billboards and Driver...
99
Digital Advertising Billboards and Driver Distraction Contract # DTRT12GUTC12 with USDOT Office of the Assistant Secretary for Research and Technology (OST-R) Final Report April 2015 Principal Investigator: Virginia Sisiopiku, Ph.D. National Center for Transportation Systems Productivity and Management O. Lamar Allen Sustainable Education Building 788 Atlantic Drive, Atlanta, GA 30332-0355 P: 404-894-2236 F: 404-894-2278 [email protected] nctspm.gatech.edu
-
Upload
duongkhanh -
Category
Documents
-
view
231 -
download
4
Transcript of Digital Advertising Billboards and Driver...
Digital Advertising Billboards and Driver
Distraction
Contract # DTRT12GUTC12 with USDOT Office of the Assistant Secretary for Research and Technology (OST-R)
Final Report
April 2015
Principal Investigator: Virginia Sisiopiku, Ph.D. National Center for Transportation Systems Productivity and Management O. Lamar Allen Sustainable Education Building 788 Atlantic Drive, Atlanta, GA 30332-0355 P: 404-894-2236 F: 404-894-2278 [email protected] nctspm.gatech.edu
DISCLAIMER
The contents of this report reflect the views of the authors, who are responsible for the facts and the accuracy of the information presented herein. This document is disseminated under the sponsorship of the U.S. Department of Transportation’s University Transportation Centers Program, in the interest of information exchange. The U.S. Government assumes no liability for the contents or use thereof.
iii
DIGITAL ADVERTISING BILLBOARDS
AND DRIVER DISTRACTION
Dr. Virginia P. Sisiopiku
Dr. Despina Stavrinos
Andrew Sullivan
Md Mozahidul Islam
Shannon Wittig
UNIVERSITY OF ALABAMA AT BIRMINGHAM
BIRMINGHAM, AL
AND
Dr. Kirolos Haleem
Dr. Albert Gan
Dr. Priyanka Alluri
FLORIDA INTERNATIONAL UNIVERSITY
MIAMI, FL
National Center for Transportation Systems Productivity and Management
Atlanta, GA
April 1, 2015
iv
U.S. DOT DISCLAIMER
The contents of this report reflect the views of the authors, who are responsible for the facts and
the accuracy of the information presented herein. This document is disseminated under the
sponsorship of the U.S. Department of Transportation’s University Transportation Centers
Program, in the interest of information exchange. The U.S. Government assumes no liability for
the contents or use thereof.
ACKNOWLEDGMENT OF SPONSORSHIP
This work was sponsored by a grant from the National Center for Transportation Systems
Productivity and Management at the Georgia Institute of Technology. The NCTSPM center is
funded through the U.S. Department of Transportation’s University Transportation Centers
Program. Additional funding in support of this project was provided by the Alabama Department
of Transportation (ALDOT) and the Florida Department of Transportation (FDOT).
v
TABLE OF CONTENTS
TABLE OF CONTENTS ……………………….………………………………………. V
LIST OF TABLES ………………………………………………………………………. VIII
LIST OF FIGURES ……………………………………………………………………... IX
ABSTRACT ……………………………………………………………………………... XI
CHAPTER 1: INTRODUCTION
1.1 Project Objective ……………………………………………………………….… 1
1.2 Approach ………………………………………..……………………………….. 2
1.3 References ………………………………………………...……………………… 3
CHAPTER 2: LITERATURE REVIEW
2.1 Introduction ……………………………………………………………………… 4
2.2 Roadside Advertising Options …………………………………………………… 4
2.3 Guidelines and Regulations ……………………………………………………… 5
2.4 Digital Advertising Billboards and Traffic Safety ……………….……………… 6
2.4.1 Literature Reviews ………………………………………………………… 6
2.4.2 Crash Studies ……………………………………………………………… 8
2.4.3 Laboratory Studies ………………………………………………………… 9
2.4.4 Naturalistic Studies ………………………………...……………………… 10
2.5 Conclusions and Recommendations ……………………...……………………… 11
2.6 References ………………………………………………...……………………… 12
CHAPTER 3: SAFETY ASSESSMENT OF DIGITAL BILLBOARDS IN
FLORIDA
3.1 Identification of Study Locations ……………………...………………………… 15
3.2 Methodological Approach ………………………………..……………………… 15
3.3 Determination of Segment Lengths ……………………………………………… 17
3.4 Final Determination of Digital Billboard Locations ……………………..……… 21
3.5 Safety Assessment Procedure ……………………………….…………………… 26
3.6 Review of Police Reports …………………………………………...…………… 27
3.7 Safety Analysis Results ………………………………………………..………… 28
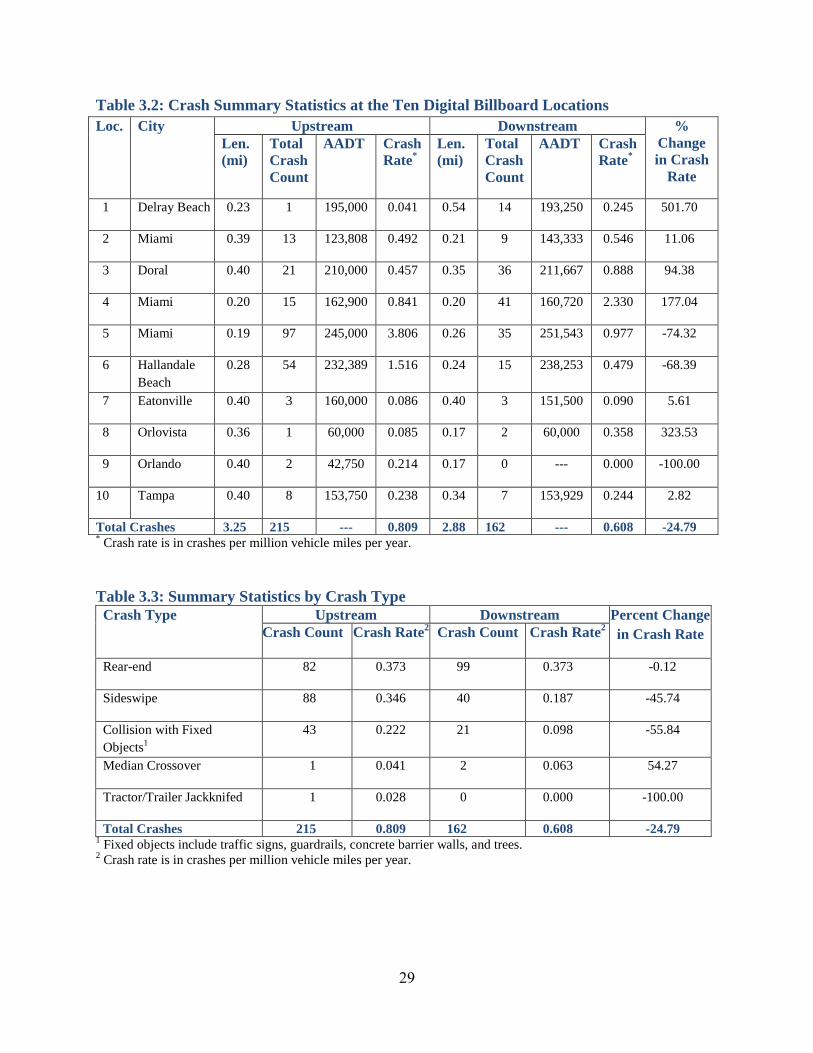
3.7.1 Crash Summary by Location ………….………….………….…………. 28
3.7.2 Summary by Crash Type …………………………………………..……… 28
3.7.3 Summary by Crash Injury Severity …………………………………..…… 30
3.8 Summary and Conclusions ………………………………………………….…… 30
CHAPTER 4: SAFETY ASSESSMENT OF DIGITAL BILLBOARDS IN
ALABAMA
4.1 Research Methodology ……………………..…………………………………… 32
4.2 Data Analysis Procedure ………………………………………………………… 36
vi
4.3 Results …………………………………………………………………………… 38
4.3.1 Analysis of Crash Records Trends …………………………………..…… 38
4.3.1.1 Crash frequency by year …………………………………………… 38
4.3.1.2 Crash frequency by month of the year ……………………..……… 39
4.3.1.3 Crash frequency by day of the week ……………………….……… 40
4.3.1.4 Crash frequency by time of the day …………………………..…… 40
4.3.2 Crash Analysis Results …………………………………………………… 41
4.3.2.1 Crash summary by location and paired t-Test for significance ……. 41
4.3.2.2 Summary by crash type ……………………………………….…… 42
4.3.2.3 Summary by crash injury severity ……………………………….… 43
4.4 Discussion …………………………………………………………………..…… 43
CHAPTER 5: SURVEY OF DRIVERS’ PERCEPTIONS
5.1 Methods ………………………………………………………………….……… 44
5.2 Analysis ……………………………………………………………….………… 44
5.3 Results …………………………………………………………...……………… 44
5.3.1 Alabama Drivers ………………………………………….……………… 44
5.3.2 Florida Drivers …………………………………………………………… 53
5.4 Discussion ………………………………………………………….…………… 61
5.4.1 Discussion on Analysis Result of Alabama Drivers ………………...…… 61
5.4.2 Discussion on Analysis Result of Florida Drivers …………………….… 61
CHAPTER 6: DRIVING SIMULATOR STUDY
6.1 Background ……………………………………………………...……………… 63
6.2 Approach …………………………………………………...…………………… 65
6.2.1 Participants ………………………………………………….…………… 65
6.2.2 Procedure ………………………………………………………………… 66
6.2.3 Measures …………………………………………………………….…… 67
6.3 Data Analytic Technique …………………………………………..…………… 72
6.3.1 Preliminary Analyses ………………………………………….………… 72
6.3.2 Primary Analyses ………………………………………………...……… 72
6.4 Results …………………………………………………………………..……… 72
6.4.1 Visual Distraction …………………………………………..…………… 73
6.4.2 Cognitive Distraction ………………………….………………………… 74
6.4.3 Simulated Driving Performance ………………………………………… 76
6.4.4 Perception of Billboards by Age Group ………………………..…….…. 77
6.4.5 Report of Distracted Driving by Age Group ……….…………………… 79
6.5 Discussion …………………………………………………….………...……… 81
6.6 Limitations ……………….………………………………………..…………… 82
6.7 References ……………………….…………………………………...………… 84
CHAPTER 7: CONCLUSIONS AND RECOMMENDATIONS
7.1 Conclusions ……………………….……………………………………………. 87
7.1.1 Crash Analysis Conclusions …….……………………………………….. 87
7.1.2 Survey of Motorists Conclusions ….…………………………………….. 87
vii
7.1.3 Driving Simulator Study Conclusions ….………………………….…….. 87
7.2 Implications for Practice ……….……………………………………………….. 88
7.3 Limitations and Future Research ….……………………………………...…….. 88
viii
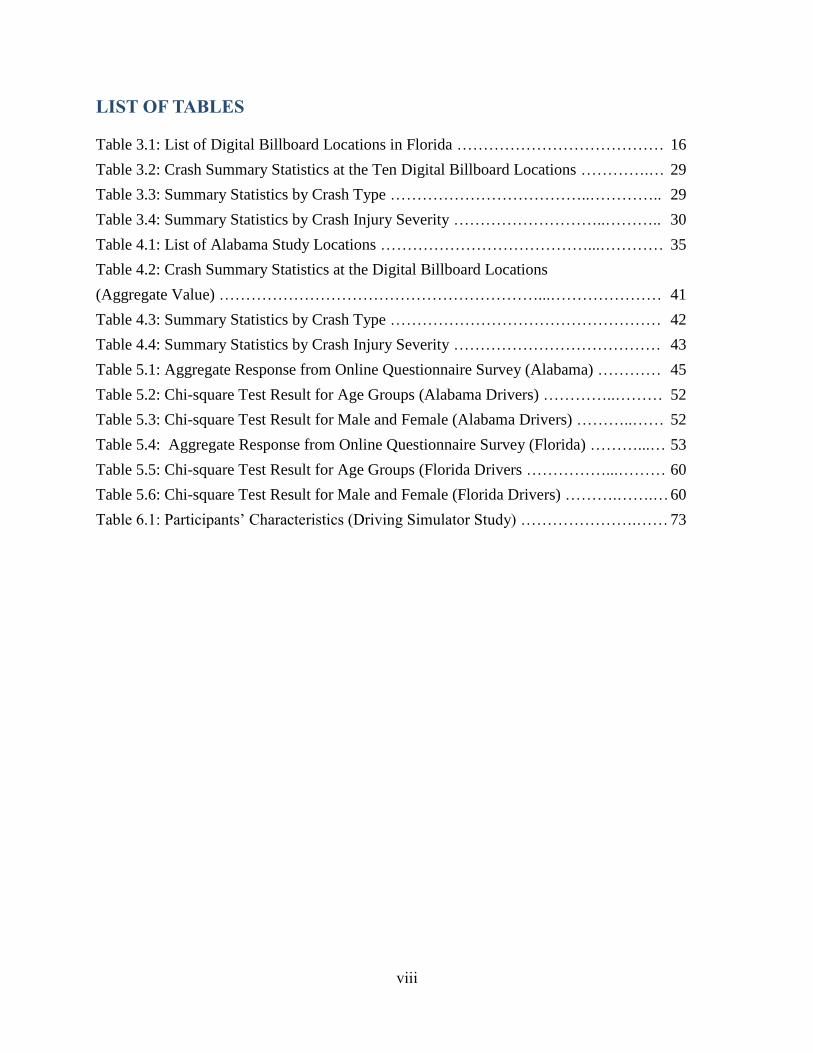
LIST OF TABLES
Table 3.1: List of Digital Billboard Locations in Florida ………………………………… 16
Table 3.2: Crash Summary Statistics at the Ten Digital Billboard Locations ………….… 29
Table 3.3: Summary Statistics by Crash Type ………………………………..………….. 29
Table 3.4: Summary Statistics by Crash Injury Severity ………………………..……….. 30
Table 4.1: List of Alabama Study Locations …………………………………...………… 35
Table 4.2: Crash Summary Statistics at the Digital Billboard Locations
(Aggregate Value) ……………………………………………………...………………… 41
Table 4.3: Summary Statistics by Crash Type …………………………………………… 42
Table 4.4: Summary Statistics by Crash Injury Severity ………………………………… 43
Table 5.1: Aggregate Response from Online Questionnaire Survey (Alabama) ………… 45
Table 5.2: Chi-square Test Result for Age Groups (Alabama Drivers) …………..……… 52
Table 5.3: Chi-square Test Result for Male and Female (Alabama Drivers) ………..…… 52
Table 5.4: Aggregate Response from Online Questionnaire Survey (Florida) ………...… 53
Table 5.5: Chi-square Test Result for Age Groups (Florida Drivers ……………...……… 60
Table 5.6: Chi-square Test Result for Male and Female (Florida Drivers) ……….…….… 60
Table 6.1: Participants’ Characteristics (Driving Simulator Study) ………………….…… 73
ix
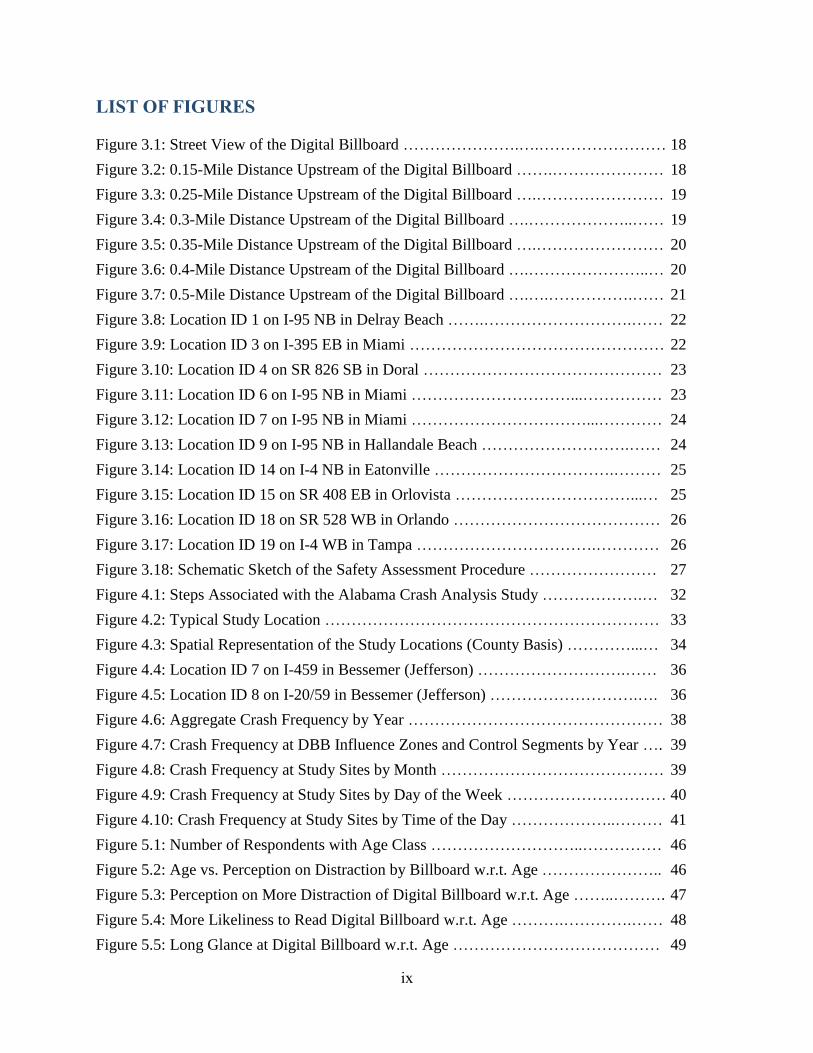
LIST OF FIGURES
Figure 3.1: Street View of the Digital Billboard ………………….….…………………… 18
Figure 3.2: 0.15-Mile Distance Upstream of the Digital Billboard …….………………… 18
Figure 3.3: 0.25-Mile Distance Upstream of the Digital Billboard ….…………………… 19
Figure 3.4: 0.3-Mile Distance Upstream of the Digital Billboard ….………………..…… 19
Figure 3.5: 0.35-Mile Distance Upstream of the Digital Billboard ….…………………… 20
Figure 3.6: 0.4-Mile Distance Upstream of the Digital Billboard ….…………………..… 20
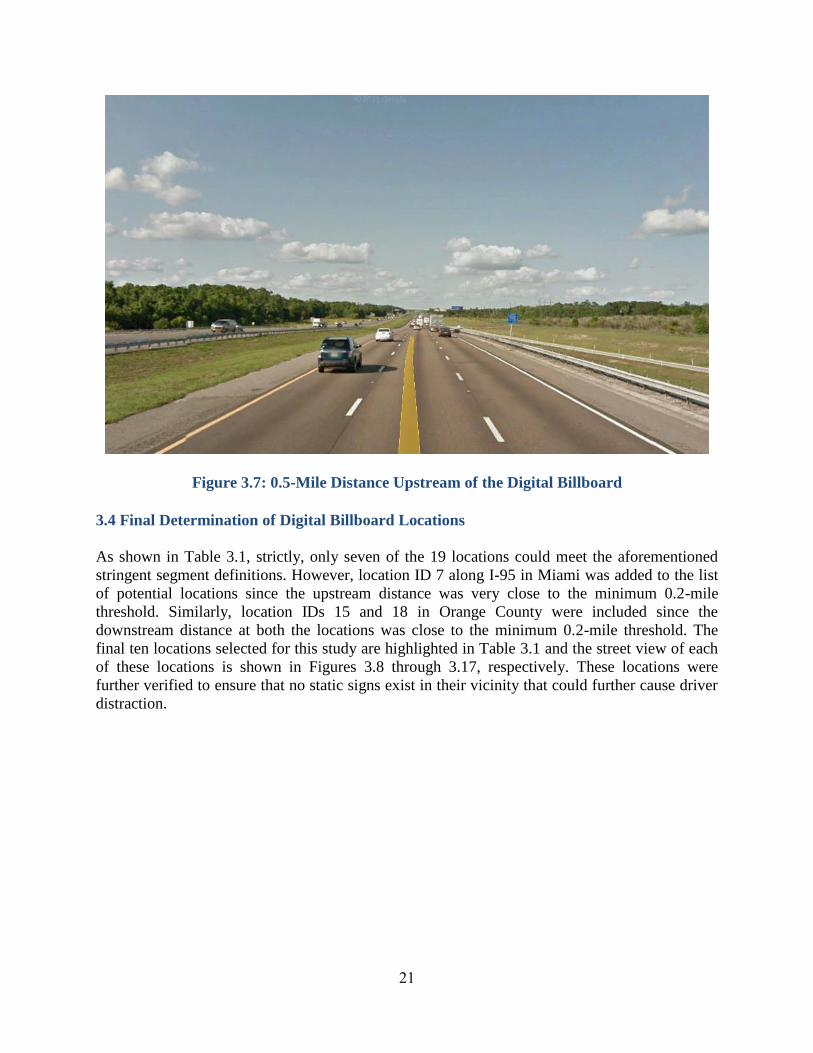
Figure 3.7: 0.5-Mile Distance Upstream of the Digital Billboard ….….…………….…… 21
Figure 3.8: Location ID 1 on I-95 NB in Delray Beach …….……………………….…… 22
Figure 3.9: Location ID 3 on I-395 EB in Miami ………………………………………… 22
Figure 3.10: Location ID 4 on SR 826 SB in Doral ……………………………………… 23
Figure 3.11: Location ID 6 on I-95 NB in Miami …………………………...…………… 23
Figure 3.12: Location ID 7 on I-95 NB in Miami ……………………………...………… 24
Figure 3.13: Location ID 9 on I-95 NB in Hallandale Beach ……………………….…… 24
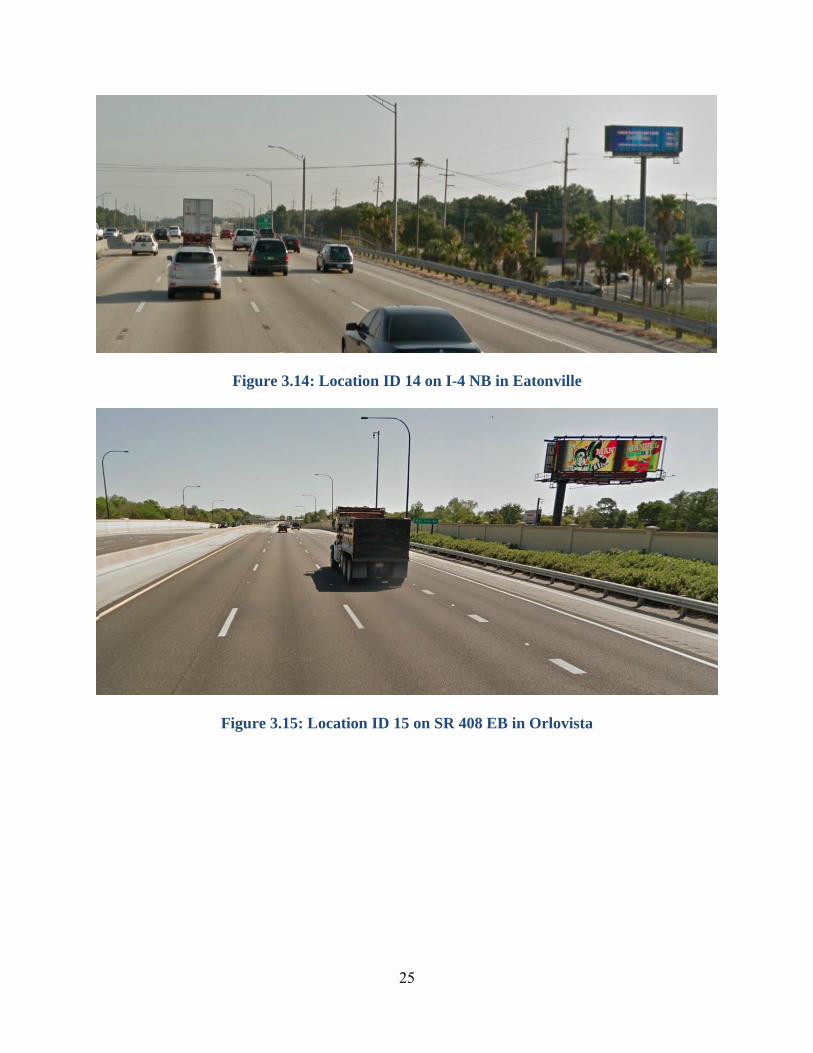
Figure 3.14: Location ID 14 on I-4 NB in Eatonville …………………………….……… 25
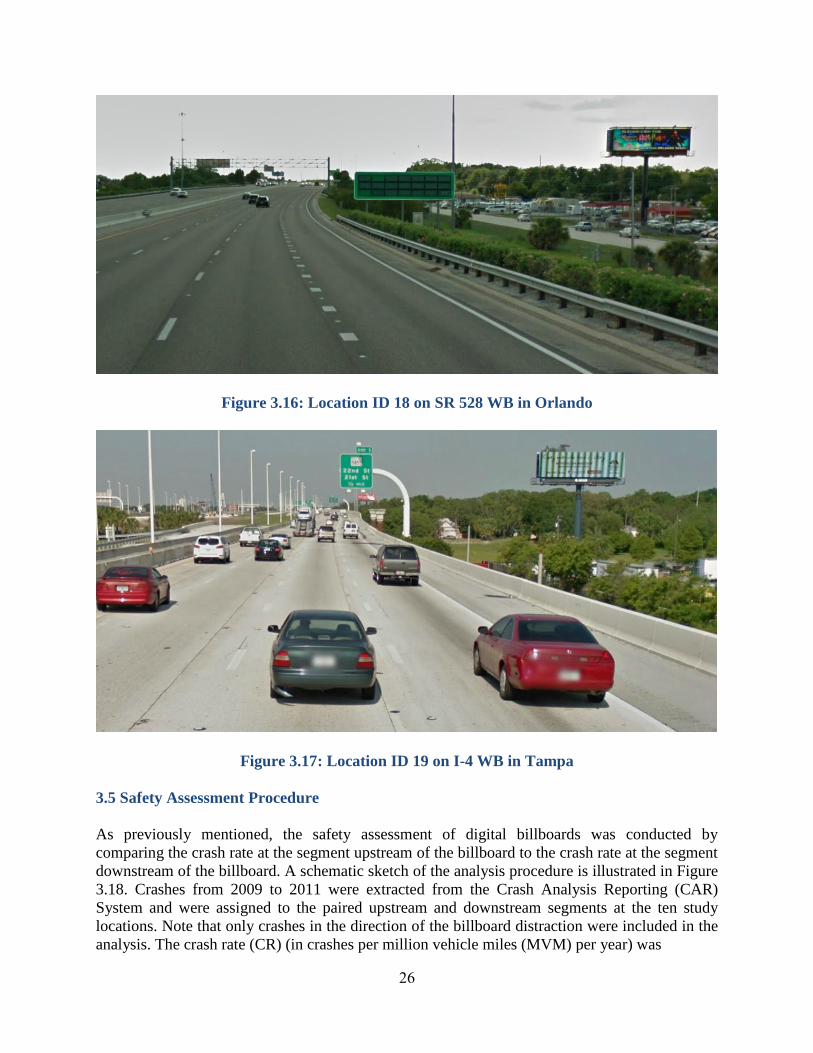
Figure 3.15: Location ID 15 on SR 408 EB in Orlovista ……………………………...… 25
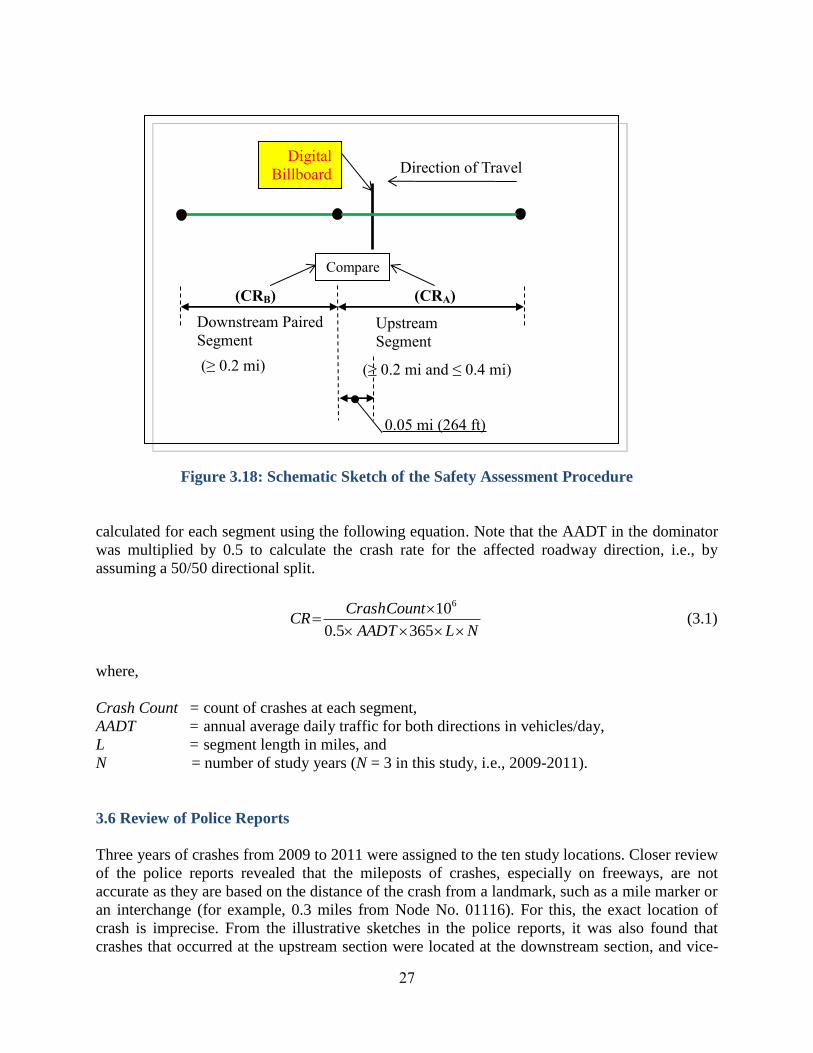
Figure 3.16: Location ID 18 on SR 528 WB in Orlando ………………………………… 26
Figure 3.17: Location ID 19 on I-4 WB in Tampa …………………………….………… 26
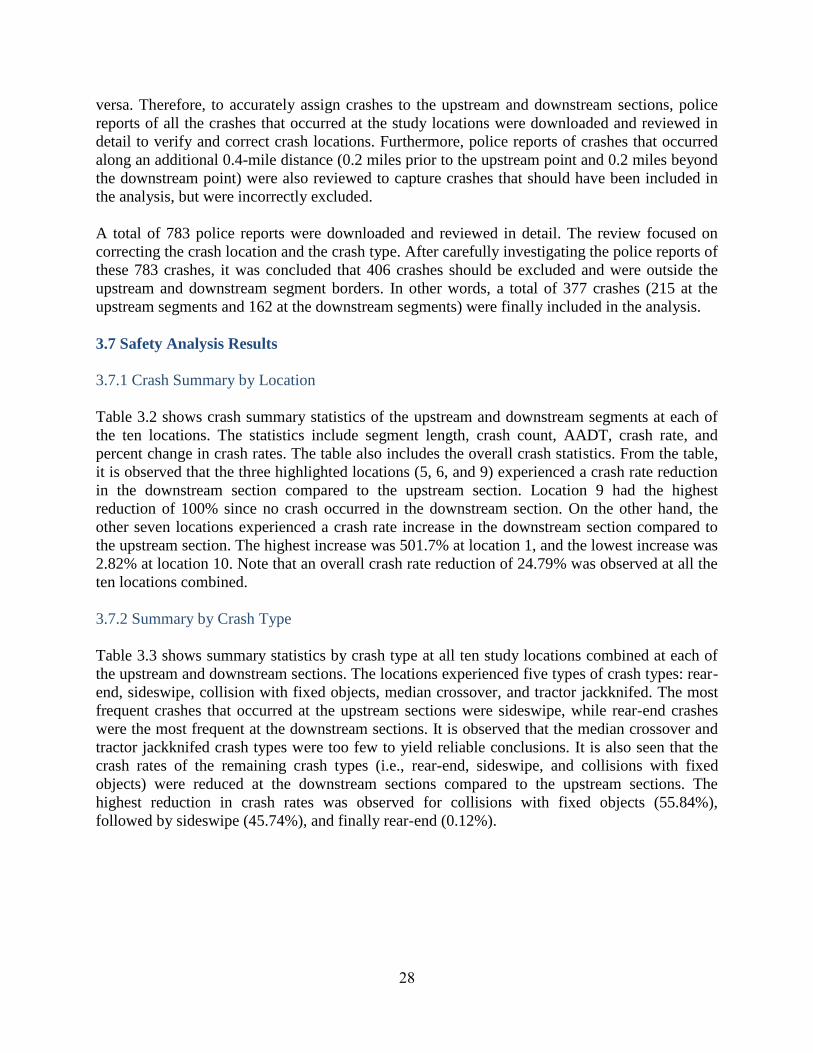
Figure 3.18: Schematic Sketch of the Safety Assessment Procedure …………………… 27
Figure 4.1: Steps Associated with the Alabama Crash Analysis Study ……………….… 32
Figure 4.2: Typical Study Location ……………………………………………………… 33
Figure 4.3: Spatial Representation of the Study Locations (County Basis) …………...… 34
Figure 4.4: Location ID 7 on I-459 in Bessemer (Jefferson) ……………………….…… 36
Figure 4.5: Location ID 8 on I-20/59 in Bessemer (Jefferson) ……………………….…. 36
Figure 4.6: Aggregate Crash Frequency by Year ………………………………………… 38
Figure 4.7: Crash Frequency at DBB Influence Zones and Control Segments by Year …. 39
Figure 4.8: Crash Frequency at Study Sites by Month …………………………………… 39
Figure 4.9: Crash Frequency at Study Sites by Day of the Week ………………………… 40
Figure 4.10: Crash Frequency at Study Sites by Time of the Day ………………..……… 41
Figure 5.1: Number of Respondents with Age Class ………………………..…………… 46
Figure 5.2: Age vs. Perception on Distraction by Billboard w.r.t. Age ………………….. 46
Figure 5.3: Perception on More Distraction of Digital Billboard w.r.t. Age ……..………. 47
Figure 5.4: More Likeliness to Read Digital Billboard w.r.t. Age ……….………….…… 48
Figure 5.5: Long Glance at Digital Billboard w.r.t. Age ………………………………… 49
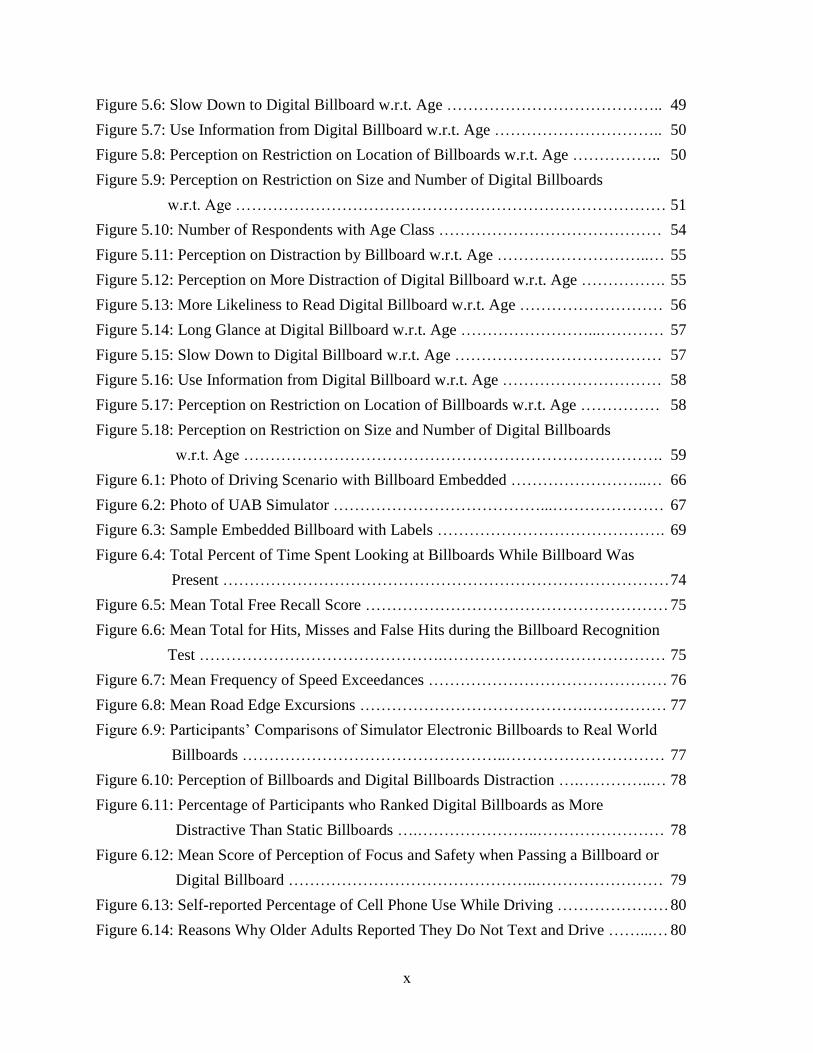
x
Figure 5.6: Slow Down to Digital Billboard w.r.t. Age ………………………………….. 49
Figure 5.7: Use Information from Digital Billboard w.r.t. Age ………………………….. 50
Figure 5.8: Perception on Restriction on Location of Billboards w.r.t. Age …………….. 50
Figure 5.9: Perception on Restriction on Size and Number of Digital Billboards
w.r.t. Age ……………………………………………………………………… 51
Figure 5.10: Number of Respondents with Age Class …………………………………… 54
Figure 5.11: Perception on Distraction by Billboard w.r.t. Age ………………………..… 55
Figure 5.12: Perception on More Distraction of Digital Billboard w.r.t. Age ……………. 55
Figure 5.13: More Likeliness to Read Digital Billboard w.r.t. Age ……………………… 56
Figure 5.14: Long Glance at Digital Billboard w.r.t. Age ……………………...………… 57
Figure 5.15: Slow Down to Digital Billboard w.r.t. Age ………………………………… 57
Figure 5.16: Use Information from Digital Billboard w.r.t. Age ………………………… 58
Figure 5.17: Perception on Restriction on Location of Billboards w.r.t. Age …………… 58
Figure 5.18: Perception on Restriction on Size and Number of Digital Billboards
w.r.t. Age ……………………………………………………………………. 59
Figure 6.1: Photo of Driving Scenario with Billboard Embedded ……………………..… 66
Figure 6.2: Photo of UAB Simulator …………………………………...………………… 67
Figure 6.3: Sample Embedded Billboard with Labels ……………………………………. 69
Figure 6.4: Total Percent of Time Spent Looking at Billboards While Billboard Was
Present ………………………………………………………………………… 74
Figure 6.5: Mean Total Free Recall Score ………………………………………………… 75
Figure 6.6: Mean Total for Hits, Misses and False Hits during the Billboard Recognition
Test ……………………………………….…………………………………… 75
Figure 6.7: Mean Frequency of Speed Exceedances ……………………………………… 76
Figure 6.8: Mean Road Edge Excursions …………………………………….…………… 77
Figure 6.9: Participants’ Comparisons of Simulator Electronic Billboards to Real World
Billboards …………………………………………..………………………… 77
Figure 6.10: Perception of Billboards and Digital Billboards Distraction ….…………..… 78
Figure 6.11: Percentage of Participants who Ranked Digital Billboards as More
Distractive Than Static Billboards ….…………………..…………………… 78
Figure 6.12: Mean Score of Perception of Focus and Safety when Passing a Billboard or
Digital Billboard ………………………………………..…………………… 79
Figure 6.13: Self-reported Percentage of Cell Phone Use While Driving ………………… 80
Figure 6.14: Reasons Why Older Adults Reported They Do Not Text and Drive ……...… 80
xi
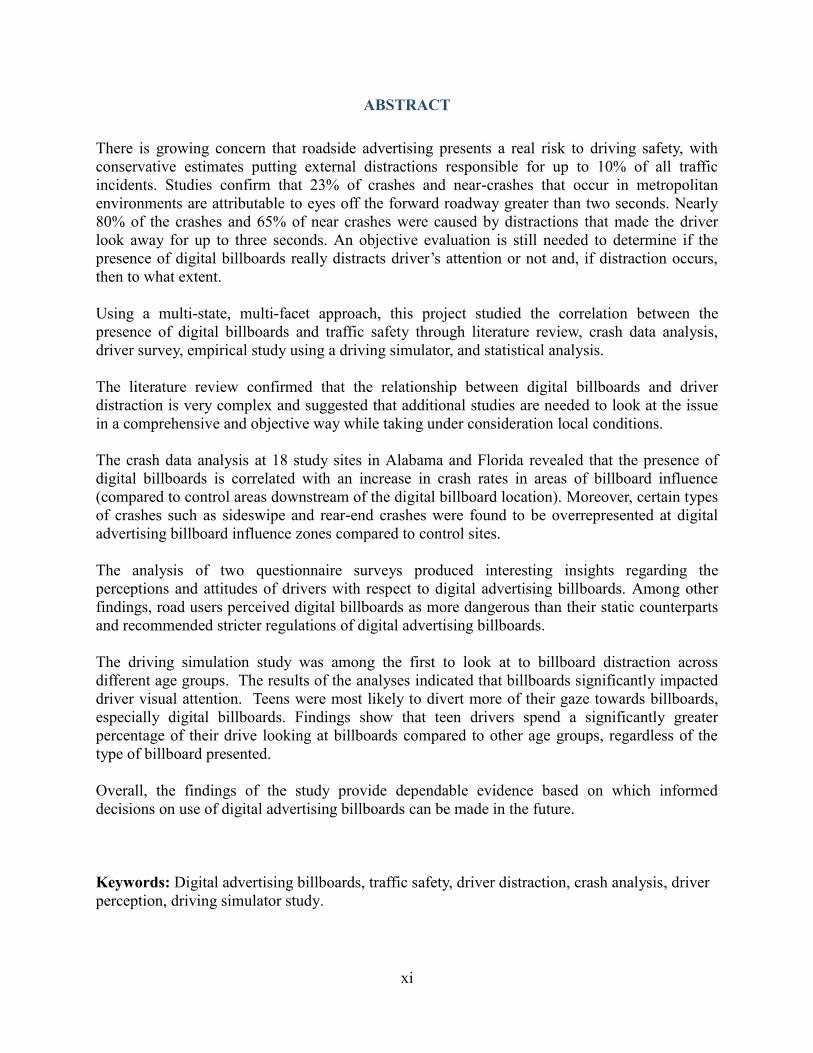
ABSTRACT
There is growing concern that roadside advertising presents a real risk to driving safety, with
conservative estimates putting external distractions responsible for up to 10% of all traffic
incidents. Studies confirm that 23% of crashes and near-crashes that occur in metropolitan
environments are attributable to eyes off the forward roadway greater than two seconds. Nearly
80% of the crashes and 65% of near crashes were caused by distractions that made the driver
look away for up to three seconds. An objective evaluation is still needed to determine if the
presence of digital billboards really distracts driver’s attention or not and, if distraction occurs,
then to what extent.
Using a multi-state, multi-facet approach, this project studied the correlation between the
presence of digital billboards and traffic safety through literature review, crash data analysis,
driver survey, empirical study using a driving simulator, and statistical analysis.
The literature review confirmed that the relationship between digital billboards and driver
distraction is very complex and suggested that additional studies are needed to look at the issue
in a comprehensive and objective way while taking under consideration local conditions.
The crash data analysis at 18 study sites in Alabama and Florida revealed that the presence of
digital billboards is correlated with an increase in crash rates in areas of billboard influence
(compared to control areas downstream of the digital billboard location). Moreover, certain types
of crashes such as sideswipe and rear-end crashes were found to be overrepresented at digital
advertising billboard influence zones compared to control sites.
The analysis of two questionnaire surveys produced interesting insights regarding the
perceptions and attitudes of drivers with respect to digital advertising billboards. Among other
findings, road users perceived digital billboards as more dangerous than their static counterparts
and recommended stricter regulations of digital advertising billboards.
The driving simulation study was among the first to look at to billboard distraction across
different age groups. The results of the analyses indicated that billboards significantly impacted
driver visual attention. Teens were most likely to divert more of their gaze towards billboards,
especially digital billboards. Findings show that teen drivers spend a significantly greater
percentage of their drive looking at billboards compared to other age groups, regardless of the
type of billboard presented.
Overall, the findings of the study provide dependable evidence based on which informed
decisions on use of digital advertising billboards can be made in the future.
Keywords: Digital advertising billboards, traffic safety, driver distraction, crash analysis, driver
perception, driving simulator study.
1
CHAPTER 1
INTRODUCTION
Roadside advertising billboards are used for advertisement of various products and services and
are meant to attract drivers’ attention to the message or information conveyed by the billboards.
According to the Outdoor Advertising Association of America (OAAA), there were over 365,000
unique billboard faces in the United States in 2013 (Outdoor Advertising Association of America
[OAAA], 2013).
Roadside advertising billboards can be either static or digital. Static billboards show the same
message for an extended period of time (typically days). They are the traditional type of outdoor
advertising and the most commonly used type of advertising billboards in the United States. The
digital billboards (DBBs) were introduced in the recent years and utilize light-emitting diode
(LED) technology to show multiple messages one after another that are updated using computer
input. Because DBBs flash images every four to ten seconds (Copeland, 2010), a single board
can advertise to far more clients than a traditional board, making them an attractive
advertisement option. Thus, despite the fact that DBBs are initially more expensive to build
compared to their static counterparts, over time they prove to be cost-effective. While static
billboards are still dominant, digital billboards are a fast growing sector of the outdoor
advertising market (OAAA, 2013).
The increased number and sophistication of DBBs raises questions about their potential impact
on traffic safety. As an advertising medium, DBBs purposely encouraging drivers to shift their
attention away from the driving task. Moreover, DBBs brightness may be especially problematic
at night and may affect the driver’s ability to observe changes in the surrounding environment
such as brake lights or signal changes. Also, frequently changing images may compel more
glances, and sequential messages may hold drivers’ gazes longer until the entire message is read.
Lastly, targeted messages that promote interactivity with the driver are particularly troublesome
as they are hypothesized to be distracting to the driver (Sisiopiku et al., 2013).
Earlier studies sponsored by billboard advertising companies stated that the presence of digital
billboards does not cause a change in driver behavior in terms of visual behavior, speed
maintenance, or lane keeping (Lee et al., 2007). In the past, attempts have been made to show
that driver's diminished attention could result in more crashes in the vicinity of such billboards,
but because of the methodological problems of these studies this has never been done in a
sufficiently reliable manner (Institute for Road Safety Research, Roadside Advertising and
Information, 2013). Due to the growing debate on this issue, an objective evaluation is needed to
determine if the presence of digital billboards really distracts driver’s attention or not and, if
distraction occurs then to what extent.
1.1 Project Objective
The objective of the project is to provide an objective and thorough examination of the
2
relationship between the presence of digital advertising billboards and traffic safety. The goal is
to provide dependable evidence based on which informed decisions on use of digital advertising
billboards can be made in the future.
1.2 Approach
To meet the project objectives, the project team performed: a. State-of-Practice-Synthesis, b.
Epidemiological Study, c. Survey of Road Users, and d. Driving Simulator Study all of which
looked at the question of digital advertising billboards and traffic safety in a distinct, yet
interconnected way.
The state-of-practice synthesis involved an in depth literature review and synthesis of findings
from existing studies on digital advertising billboards, driver distraction and traffic safety.
The epidemiological study focused on the analysis of historical crash records from the states of
Alabama and Florida and utilized appropriate statistical methods to examine the correlation
between crash location occurrence and proximity to billboards. First, the research team obtained
information on the location of digital advertising billboards along major transportation facilities
in Alabama and Florida and identified appropriate sites for analysis. Then, historical crash data
were retrieved and crash rates were calculated for digital advertising billboards influence zones
and control sites. Statistical analysis was employed to determine if correlations can be
established between crash occurrence and digital billboard presence.
The survey of road users involved the development of a questionnaire survey that was used to
document perceived impacts of digital advertising billboards. In the present research, an online
questionnaire instrument was developed and used to gather and analyze data from Alabama and
Florida road user’s perceptions and attitudes related to roadside advertising billboards. The
questionnaire assessed several variables of interest including demographic information (e.g., age,
ethnicity, and gender), exposure (driving patterns and experience, frequency of billboard
encounters), driver’s behaviors, attitudes, and perceptions toward billboards with respect to
safety and efficiency, and respondents’ stated preferences regarding placement, frequency and
regulation of roadway advertising billboard.
The driving simulator study involved the design and conduct of an experiment using a driving
simulator with representative driver samples in various roadway settings with and without the
presence of digital billboards. Drivers from the greater Birmingham area were recruited to
participate in a driving simulator study. Visual distraction was assessed through eye tracking
equipment (i.e., percent of time participants spend looking at billboards while driving). Cognitive
distraction was assessed through post-drive memory recall of information presented on
billboards. Additional driving performance variables of interest were electronically coded by the
simulator (i.e., crashes, lane deviations, reaction time, etc). Statistical analysis was performed to
test whether digital billboards present visual and/or cognitive distraction as well as driving
performance decrements.
Overall, the study presented a comprehensive approach for establishing potential correlations
between electronic sign presence and traffic safety. This work presents a contribution to the
3
traffic safety research as it provides some insights that can help inform future public policy
relating to driver distraction and billboards, especially in regards to regulations for billboard use.
1.3 References
Copeland, L. (2010). More Communities Banning ‘Television on a Stick.’ USA Today; 23 Mar
2010.
Institute for Road Safety Research, Roadside Advertising and Information. (2013). Available at:
http://www.swov.nl/rapport/Factsheets/UK/FS_Advertising.pdf
Lee S., McElheny, M., and Gibbons, R. (2007). Driving Performance and Digital Billboards,
Prepared for Foundation for Outdoor Advertising Research and Education by the Virginia Tech
Transportation Institute (VTTI), Center for Automotive Safety Research.
Outdoor Advertising Association of America [OAAA]. (2013). Out of home media formats:
Number of out of home displays (2013), October 14, 2013, from
http://www.oaaa.org/OutofHomeAdvertising/OOHMediaFormats/OOHMediaFormats.aspx
Sisiopiku, V.P., Hester, D., Gan, A., Stavrinos, D., and Sullivan, A. (2013). “Roadside
Advertising and Traffic Safety”, 3rdAnnual International Conference on Civil Engineering,
Athens, Greece.
4
CHAPTER 2
LITERATURE REVIEW
This chapter presents a comprehensive synthesis of findings from an extensive review of national
and international literature on the topic of digital billboards and traffic safety. First, it discusses
digital advertising billboard technology and industry regulation practices. Emphasis is then
placed on studies that investigate links between driver distraction associated with roadside
advertising and traffic safety. Crash studies focusing on statistical analysis of historical data as
well as behavioral studies (both naturalistic and driving simulator based) are discussed and
contrasted. The chapter concludes with a summary of findings and recommendations for future
research.
2.1 Introduction
Since the passing of the Highway Beautification Act (HBA) in 1965, federal, regional, and local
authorities in the US have attempted to control outdoor advertising through the introduction of
standards and restrictions on size, placement, content, and durability. Naturally, as new
technologies emerge in the outdoor advertising industry, authorities must develop new restraints
to maintain safe and sustainable industry practice. The digital billboard (DBB) is one such new
technology that has appeared in the late twentieth century and flourished in recent years.
According to the Outdoor Advertising Association of America (OAAA), the number of digital
billboards will grow tenfold in the next decade due to their lucrative potential in the out-of-home
advertising market (Dobranski, 2007).
In response to the increase in DBB signs, safety concerns have risen over potential contribution
of DBBs to driver distraction. Various studies, including crash analysis studies, behavioral
studies, and reviews have resulted in somewhat contradictory conclusions, indicating a need for
further research. This synthesis summarizes existing literature on the subject to develop an
objective and comprehensive understanding of the current knowledge base.
2.2 Roadside Advertising Options
Conventional (static) billboards first appeared during the 19th
century and are considered the
oldest form of mass media. Today, there are an estimated 400,000 billboards in the United States
(OAAA, 2012). In terms of industry growth rates, outdoor advertising is second only to internet
advertising (Marketing Week, 2007). Advantages of outdoor advertising include relatively low
entry and operating costs, the ability to appeal to the local market, and the capability to display to
a high frequency of viewers.
While static billboards are still dominant, digital billboards are a fast growing sector of the
outdoor advertising market. DBBs utilize light-emitting diode (LED) technology to provide vivid
displays that can be updated every few seconds using computer input. Because they flash images
every four to ten seconds (Copeland, 2010), a single board can advertise to far more clients than
5
a traditional board. Although DBBs are initially more expensive to build compared to their static
counterparts, over time they prove to be cost-effective. Contrary to static advertising signs that
require a production cycle of one to two weeks for updating, new designs can be updated and
posted on a DBB in a matter of hours, making it easier for clients to update their advertisements
on a frequent basis (Birdsall, 2008).
Another difference between static and digital billboards is that DBBs can expand on customer
interaction and targeted messaging specific to the demographics of travelers driving past them.
Texting, news flashes, countdowns, competitions and real-time snapshots are some of the latest
applications on electronic billboards that are impossible with static billboards (Stilson, 2010).
2.3 Guidelines and Regulations
Regulations for control of outdoor advertising exist at the federal and state level. The first
mandate was signed in the Federal-Aid Highway Act of 1958, based on which states could
voluntarily agree to control outdoor advertising next to interstate highways in accordance with
23 CFR 750, Subpart A in exchange for additional federal aid in highway construction. In 1965,
President Lyndon B. Johnston signed the HBA, Public Law 89-285 which mandates that states
not only comply with the standards, but remove nonconforming signs. The consequence for
noncompliance is a 10% reduction of the state’s annual federal aid for highway apportionment.
The HBA also controls certain aspects of sign placement, size, and content. Signs must be within
660 feet of the roadway, lighting and spacing must meet Federal/State Agreements (FSAs), and
signs have to meet other specified aesthetic standards related to travel centers and landscaping.
The Federal Highway Administration’s (FHWA) Outdoor Advertising Control Manual details
federal regulations, specifically regarding regulations on commercial electronic variable message
signs (CEVMS). Originally, the FHWA considered the prohibition of the signs, and certain states
determined that these signs violate the lighting provision in their FSA. In reaction to this, the
FHWA issued memorandums during 1996 and 2007 which give states a reference to help
determine lighting requirements for signs (FHWA, 2012).The 2007 Memorandum provides
guidance on the placement of CEVMS signs in areas subject to control under the HBA of 1965.
The HBA requires states to maintain effective control of outdoor advertising next to certain
roadways. Signs that meet size, lighting, and spacing standards must be used in agreement with
the state and the Secretary. Most of these agreements were signed in the 1960’s and 1970’s and
though CEVMS signs are not prohibited, this guidance allows states to adopt more stringent
requirements for changeable message signs. The following standards demonstrate the ranges of
acceptability that have been adopted by certain states allowing CEVMS:
Duration of Message: 4-10 sec; 8 sec recommended
Transition Time: 1-4 sec; 1-2 sec recommended
Brightness: Adjust to changes in light levels
Spacing: Specified in FSAs
Locations: Specified in FSAs, except where determined unsafe to drivers
Other standards that states use include a default designed to freeze in one display should a
malfunction occur, a process for changing displays and lighting levels to ensure safety, and the
6
prohibition of dynamic messages such as animation, flashing, scrolling, and video (Shepard,
2007).
2.4 Digital Advertising Billboards and Traffic Safety
While laws and regulations are vital for ensuring uniformity and protecting the public from
unsafe and inappropriate roadside advertising practices, questions still remain about the potential
link between roadside advertising and traffic safety. Roadside advertising billboards by nature
are intended to draw the driver’s attention, thus purposely encouraging drivers to shift their
attention away from the driving task. The DBBs brightness may be especially problematic at
night and may affect the driver’s ability to observe changes in the surrounding environment such
as brake lights or signal changes. Moreover, frequently changing images may compel more
glances and sequential messages may hold drivers’ gazes longer until the entire message is read.
Lastly, targeted messages that promote interactivity with the driver are particularly troublesome
as they are hypothesized to be distracting to the driver.
Several studies have been performed worldwide to document the relationship between roadside
advertising billboards and traffic safety. These include a) crash studies analyzing historical crash
records, b) laboratory studies using driving simulators, c) naturalistic studies observing driver
behaviors on-road using instrumented vehicles, and d) previous literature reviews.
Representative studies and summary findings are presented next. Attention should be paid to the
funding source of each study, as not all backing institutions have a neutral interest.
2.4.1 Literature Reviews
Several literature reviews and meta-analyses exist on the subject of outdoor advertising and
driver distraction. A few of such studies were funded by non-neutral sources, so the results
reported should be considered with discernment.
In 2003, Wallace used meta-analysis to investigate whether or not there is a serious safety risk
caused by features in the external driving environment. After twelve selected studies were
analyzed, Wallace concluded that there seemed to be an association between crash rates and
billboards at intersections. The only one of the twelve studies that showed no relationship
between crashes and signs was performed on a stretch of road that contained no intersections.
Secondly, there was a possible correlation between crash rates, signs, and sharp bends after long
stretches of road. Thirdly, concerning the first two conclusions, the evidence was largely
situation-specific. Wallace also stated that many studies have shown that billboards had little to
no impact on driver safety, but still many indicated outdoor advertising can be a serious threat to
road safety. Wallace concluded that the subject is under-researched and recommended that new
research is needed to combine past knowledge with current practices paving the way for
additional studies in the recent years (Wallace, 2003).
In a parallel effort, Coetzee reviewed and summarized the findings from six previous crash
studies. Among the studies considered was a 1951 study done by the Minnesota Department of
Highways that is known as one of the first advertising billboard-driver safety studies. It reported
that in a sample of 713 crashes, intersections with 4 or more billboards had a crash rate 3 times
7
higher than at intersections with no billboards. The same year, Iowa State University evaluated
crash rates immediately upstream and immediately downstream of billboards and found that
crash rates upstream were double the rates downstream. In 1952, the Michigan State Highway
Department found that billboards had no effect on crash rates, although it was concluded that
illuminated signs exhibited a correlation with crash locations. Crash rates reported in another
study found that the addition of one billboard at a given location resulted in a 12.3% increase in
crashes, while the addition of 5 billboards resulted in a 61.7% increase in crashes (Coetzee,
2003).
A report facilitated by FHWA reviewed the potential concerns of DBBs on driving safety.
Research on driver performance, state regulatory practices, tri-vision signs, literature review,
roadway characteristics’ relationship to driver distraction, driver characteristics’ relationship to
driver safety, and the legibility of Changeable Message Signs (CMSs) were included in the
report. Also included was a section describing research needs on the subject (Farbry et al., 2001).
A similar report released by the FHWA in 2009 described how the recent emergence of DBBs
along U.S. roadways has caused a need for a reevaluation of current legislation and regulation
for controlling outdoor advertising. Driver distraction is a chief concern. This report consisted of
earlier published work, research of applicable research methods and techniques, and
recommendations for future research (Molino et al., 2009).
In 2009, Wachtel issued a report under National Cooperative Highway Research Program
(NCHRP) Project 20-7 (256) to help state and local governments establish guidelines for outdoor
advertising signs. Included in the report is a) an identification of human factors related to digital
outdoor advertising, b) an investigation into existing regulations on outdoor advertising in both
the U.S and abroad, and c) a review of the current literature on the subject. The studies reviewed
in the report were separated into two distinct categories: i.e., neutral research and industry-
funded studies. Because the technology of DBBs is relatively novel, more research on the subject
has transpired in recent years; out of the 150 studies cited in the report, 20 occurred in the last
decade. Wachtel highlighted several successful regulations to serve as models for other entities
to consider. He also concluded that the relationship between DBBs and driver distraction is very
complex. The dynamic nature of field studies in roadway corridors presents many challenges to
achieve objective research, and laboratory studies have a limited relationship with reality. One
suggestion to remedy this problem would be to design a study that combines the validity of a
field study with the control of a laboratory setting. Moreover, the fact that DBBs are quickly
adapting and evolving as technology advances makes offering guidelines on the issue even more
challenging. Adding to the complexity is the fact that industry-funded studies may include biased
conclusions. However, despite the convolution of the issue, Wachtel concludes that that there is
enough of a solid and growing body confirming that roadside advertising attracts drivers’ eyes
away from the road for discernibly unsafe periods of time. It remains to be seen whether or not
the combination of existing, in progress, and future research is sufficient for the alteration of
current industry standards (Wachtel, 2009).
The U.S. Sign Council issued a response to the 2009 Wachtel report that is critical of Wachtel’s
work, claiming that his recommendations were limited in scope, and unnecessarily criticized
studies that use scientific methods. The Council, which is funded by the advertising industry,
also claimed that only a small percentage of the literature reviewed in the report involved field
8
studies, and that the author invited the reader to “take a circuitous path around existing studies”
on digital billboards and driver distraction in order to reach a conclusion that billboards are a
distraction (Crawford, 2010).
In a follow-up report, Wachtel focused on how digital billboards distract U.S. drivers. The report
suggested that DBBs cause drivers to be less observant of stopping cars ahead of them, and
contribute to vehicle drifting into adjacent lanes. The report also offered suggestions on ways to
control the effects of digital advertising, which include controlling the lighting of the signs,
keeping the signs simple, and prohibiting message sequencing (Wachtel, 2011).
2.4.2 Crash Studies
Most crash studies involve statistical analyses of historical crash databases. Such studies can
provide fast and easy-to-obtain results, although often the final conclusions can be limited in
scope and analysis due to the highly variable and confined nature of crash data.
In a 2010 report, Tantala and Tantala examined the statistical relationship between digital
billboards and traffic safety in Albuquerque, New Mexico. Analysis of traffic and crash data was
conducted for a 7-year period on local roads near 17 DBBs. Each billboard contained one digital
plane that was converted from traditional signage between 2006 and 2007. First, the researchers
reviewed the frequency of crashes near the billboards before and after conversion to digital.
Ranges analyzed in the study included 0.2, 0.4, 0.6, 0.8, and 1.0 miles both upstream and
downstream of each sign. Also, time of day and age of driver dynamics were factored into the
study. Secondly, the researchers performed a spatial analysis to investigate the potential
correlation between the locations of billboards and crashes. The results of the study indicated
that the 17 digital billboards in Albuquerque have no significant relationship with auto crashes.
Specifically, crash rates near the digital boards showed a 0.3% decrease in crash rate within 0.6
miles of the signs over a period of six years. Furthermore, the spatial component of the study
found no significant clustering of crashes in the vicinity of billboard sites (Tantala and Tantala,
2010a).
Tantala and Tantala (2010) also examined the statistical correlation between digital billboards
and crash data in Henrico County and Richmond, Virginia. The study analyzed crash data in the
vicinity of 14 digital billboards along routes near 10 locations. Data sources included municipal
police departments, Henrico County, and the Virginia Department of Transportation (VDOT).
The structure of the research was similar to the Albuquerque study; 7 years of accident data of
40,000 crashes were examined at sites near the selected billboards, which were converted from
conventional to digital faces during the time period of 2006 to 2009. Once again, temporal and
spatial components were investigated within ranges of a half mile upstream and downstream of
the billboards. An Empirical Bayes Method (EBM) analysis was utilized to approximate the
number of crashes that could be expected without the presence of signs. Results indicated that
digital billboards in the Richmond area have no statistically significant relationship with crash
occurrence. The evaluation of the EBM analysis indicated that the actual number of accidents in
each location was consistent with what would be expected with or without the institution of
digital billboards (Tantala and Tantala, 2010b).
9
In 2012, Yannis and colleagues conducted a statistical analysis applied on road sites in Athens,
Greece metropolitan area. The goal of the research was to investigate the relationship between
the placement and removal of advertising signs and the related occurrence of road incidents.
Crash data from the test sites were obtained from the Hellenic Statistical Authority database and
analyzed. The analysis showed no correlation between road crashes and advertising signs in any
of the nine sites examined (Yannis et al., 2012).
In another research effort, the city of Toronto requested an investigation of the effects of
billboards and safety on three downtown intersections and one expressway. Five distinct studies
were carried out: a. an eye movement study; b. a conflict study at intersection approaches; c. a
speed study; d. crash analysis, and e. a public questionnaire survey. Results from the first study
indicated that drivers glanced at video signs 50% of the time, with 20% of all glances lasting
more than 0.75 seconds. The conflict study revealed that significantly more braking occurred
near intersections in the presence of video signs. The third study confirmed that driving speed
decreased and speed variance increased after the billboard sign was installed. In the fourth study,
there was no substantial increase in crashes near signed approaches. Lastly, 65% of those
surveyed believed video signs are distracting, around half believed they have a negative impact
on traffic safety, and 86% said there should be restrictions on video advertising (Smiley et al.,
2005).
2.4.3 Laboratory Studies
In addition to crash analysis studies, research on driver behavior in a laboratory experimental
setting is another type of study utilized for driver safety research. Advantages of this approach
include the ability to control variables, the ease of use of simulators, and the avoidance of costs
and complications of road tests. However, laboratory tests have the potential for inaccurate
representation of reality during simulations, which in turn can result in skewed conclusions.
Young and Mahfoud designed a study which utilized a simulator to record driver attention,
mental workload, and performance in urban, roadway, and rural environments. Results indicated
that roadway advertising decreased driver control, increased mental workload, and can draw
attention away from relevant traffic signs. The effects of billboards may be increased when
drivers are in a monotonous section of roadway. As such, discretion is advised when placing
roadside advertising (Young and Mahfoud, 2007).
In Australia, Edquist and colleagues performed a driving simulator experiment that investigated
the effects of billboards on drivers. This study involved 48 participants in three age groups (18-
25, 25-55, and 65+). Data were collected from the brake pedal, accelerator, and steering wheel.
Head and eye movements were tracked using the FaceLab tracking system. The simulated
environment contained three-lane divided arterial roads in commercial and industrial districts.
Billboards presented during the tests displayed logos of enterprises with a large Australian
advertising presence; both static and dynamic boards were presented. The presence of
advertising billboards altered drivers’ attention patterns, increased the reaction time to road
signs, and increased general driving errors. Responses to road signs were delayed by 0.5-1
seconds in the presence of billboards. The results for dynamic signs did not significantly differ
from static signs (Edquist et al., 2011).
10
In another laboratory study, Divekar and his colleagues investigated distractions external to the
vehicle. Because almost one-third of distraction-related crashes are thought to be outside the
vehicle, the group posed two questions: a) why do experienced drivers take long glances at
external distractions when they are not willing to do such in response to internal distractions?,
and b) if experienced drivers are monitoring visible hazards in the road ahead, are they forgoing
their ability to anticipate hidden hazards? To answer the questions, a driving simulator was used
to measure subjects’ eye movements and vehicle position and speed. Both novice and
experienced drivers executed an exterior search task to replicate an external distraction such as a
digital billboard. The conclusion was that long glances of both novice and experienced drivers
inhibited their ability to anticipate unseen roadway hazards (Divekar et al., 2012).
In 2012 Marciano and Yeshurun conducted a study that involved 18 participants in two
experiments in a simulator. One simulation contained billboards and the other was a control
simulation without billboards. Measurements of median speed, mean number of crashes, and
reaction time to events were recorded while road congestion and events were altered. Results
revealed that the presence of billboards increased the time required to respond to a potentially
dangerous event, and speeds were much higher in the signed simulation experiments (Marciano
and Yeshurun, 2012).
Bendak and Al-Saleh used a simulator and a survey to investigate the role that roadside signs
have on driver attention. In the simulation, twelve volunteers traveled on two paths, one with
signs and one without signs. The results indicated that drifting from the lane and the reckless
crossing of dangerous intersections were substantially worse on the billboard signed path. Three
other performance indicators (i.e., number of tailgating times, speeding, and changing lanes
without signaling) were also worse in the signed path, but the difference was negligible. In the
survey, 160 drivers were questioned about safety of billboard signs. Half of the respondents
reported being distracted at least once by roadside advertising signs, and 22% specified that such
signs put drivers in dangerous situations (Bendak and Al-Saleh, 2010).
2.4.4 Naturalistic Studies
Naturalistic studies involve supervised road tests using instrumented vehicles that allow
observation of driver behaviors while on the road. Advantages of such studies include the ability
to test driver behaviors as they utilize the actual road environment. However, naturalistic studies
tend to be expensive, difficult to control, and labor- and time-intensive.
Akagi and colleagues employed naturalistic studies to measure the amount of information from
billboards and the visibility of road signs in Japan, where, due to lack of regulations, roadside
advertising billboards are abundant, often creating roadside clutter. The study confirmed that the
more visual noise from billboards, the more difficulty a driver had recognizing a highway
number sign. There was also a gender study undertaken which found that female drivers were
less affected by visual noise than male drivers, even though their absolute visible distances were
shorter than those of male drivers (Akagi et al., 1996).
A German study highlighted various roadside advertisements that might cause driver
distractions. Using 16 drivers, Kettwich and colleagues performed several naturalistic driving
11
experiments in an urban setting. Eye movement was measured with an eye tracking system that
involved three cameras focused on the eyes of the driver and one camera recording the road. The
number of glances and the duration of glances were recorded in different driving environments,
which included pillar advertisements, video billboards, event posters, and company logo signs.
Results indicated that there was no substantial distraction caused by the signs, and that gaze
duration towards signs decreased as driving complexity increased (Kettwich et al., 2004).
Another study used road tests in Toronto to analyze glance behaviors of 25 drivers in the
presence of advertising signs. The average duration of glances recorded was 0.57s, with a
standard deviation of 0.41. There was an average of 35.6 glances per subject (standard deviation
= 26.4). Active signs (i.e., signs that contained movable displays) accounted for 69% of glances
and 78% of long glances. Moreover, active signs were associated with 1.31 glances per subject
per sign, more than double the 0.64 glances per subject per sign associated with passive signs
(Beijer et al., 2004).
In 2007, the Virginia Tech Transportation Institute, sponsored by the advertising industry,
published a document detailing a study on DBBs and driver distraction. In the study, eye glance
tests revealed that there were no differences in glance patterns between digital billboards,
conventional billboards, comparison events, and baseline events during the day. Drivers took
longer glances at digital billboards and comparison events than the other types. During night,
drivers took longer and more frequent glances at digital billboards and comparison events (Lee et
al., 2007).
2.5 Conclusions and Recommendations
As expressed by Wachtel, there exists no single study approach that can answer all of the many
questions associated with the issue of roadside advertising and traffic safety. A number of studies
were examined as part of this literature review and synthesis effort and, while the list is not all
exhaustive, it provides a good mix of representative studies reporting on digital outdoor
advertising and traffic safety.
Studies in general agreed that the relationship between digital billboards and driver distraction is
very complex. Many research studies provided evidence that roadside advertising attracts
drivers’ eyes away from the road but often disagreed about whether or not the distraction
increases traffic safety risk.
Meta-analysis studies confirmed an association between crash rates and billboards at
intersections, and intersections with 4 or more billboards had significantly higher crash risk than
those without billboards. However, no relationship between crashes and signs was observed on
stretches of road that contained no intersections.
Several crash studies involving statistical analyses of historical data near digital billboard
locations reported no statistically significant relationship with crash occurrence arguing that
billboards have little to no impact on driver safety. However, laboratory studies confirmed that
the presence of advertising billboards decreased driver control, increased mental workload,
increased the time required to respond to a potentially dangerous event and increased driver
12
errors. Specifically, DBBs caused drivers to be less observant of stopping cars ahead of them,
and also contributed to vehicle drifting into adjacent lanes.
Naturalistic studies reported mixed findings. Some studies concluded that there was no
substantial distraction caused by the advertising signs, and that gaze duration towards signs
decreases as driving complexity increased. Others provided evidence of increased number of
glances per sign and longer glazes in the presence of digital advertising billboards compared to
static counterparts.
Overall, the crash analyses, laboratory experiments, naturalistic studies, and literature reviews
suggest that there is evidence for a correlation between advertising billboards and increased
driver distraction. However, local conditions, experimental settings, and other factors may play a
role in the impact that driver distraction due to advertising billboards has on traffic safety.
It should be also noted that existing research on the subject is limited due to a lack of
standardized methods and practices, data reliability, appropriate assumptions, relevant
hypotheses, and objective intentions. Consequently, new research on outdoor advertising options
and driver safety will prove paramount in the near future, especially because of the dynamic state
of the industry and the fact that many related studies are currently outdated.
2.6 References
Akagi, Y., Seo, T., Motoda, Y. (1996). Influence of Visual Environments on Visibility of Traffic
Signs. Transportation Research Record, No. 1553, Transportation Research Board of the
National Academies, Washington, D.C., 1996, pp. 53-58.
Beijer, D., Smiley, A., Eizenman, M. (2004). Observed Driver Glance Behavior at Roadside
Advertising Signs. Transportation Research Record, No. 1899, Transportation Research Board
of the National Academies, Washington, D.C., 2004, pp. 96-103.
Bendak, S., and Al-Saleh, K. (2010). The Role of Roadside Advertising Signs in Distracting
Drivers. International Journal of Industrial Ergonomics; Volume 40, Issue 3, May 2010, pp.
233-236.
Birdsall, M. (2008).The Debate over Digital Billboards: Can New Technology Inform Drivers
without Distracting Them? ITE Journal; Vol. 78, Issue 4; Apr 2008, pp. 22-27.
Coetzee, J. (2003). The Evaluation of Content on Outdoor Advertisements. Presented at the
Southern African Transport Conference, 14-16 July 2003.
Copeland, L. (2010). More Communities Banning ‘Television on a Stick.’ USA Today; 23 Mar
2010.
Crawford, R. (2010). Inside the Wachtel 2009 Digital Display Report: A Commonsense Guide.
United States Sign Council, Version 3.17.10, 2010.
13
Divekar, G., Pradhan, A., Pollatsek, A., Fisher, D. (2012).External Distractions: Evaluation of
Their Effect on Younger Novice and Experienced Drivers’ Behavior and Vehicle Control.
Transportation Research Board, Presented at the TRB 91st Annual Meeting, Washington, D.C.,
Jan 22-26, 2012.
Dobranski, P. (2007). Digital Billboards a Flashpoint in Debate over High-tech Driver
Distractions. McClatchy-Tribune Business News, Washington, 24 Sep 2007.
Edquist, J., Horberry, T., Hosking, S.,Johnston, I. (2011). Effects ofAdvertising Billboards
During Simulated Driving. Applied Ergonomics, Vol. 42 Issue 4, May 2011, pp. 619-626.
Farbry, J., Wochinger, K., Shafer, T., Owens N., Nedzesky, A. (2001). Research Review of
Potential Safety Effects of Electronic Billboards on Driver Attention andDistraction. Publication
FHWA-RD-01-071. FHWA, Office of Safety Research and Development, 11 Sep 2001.
FHWA (2012). A History and Overview of the Federal Outdoor Advertising Control Program.
Federal Highway Administration, Outdoor Advertising Control Manual, 3 Jan 2012.
Kettwich, C., Klinger, K., Lemmer, U. (2008). Do Advertisements at the Roadside Distract the
Driver? Proceedings of International Society for Optical Engineering. Vol. 7003, Article No.
70032J, 2008.
Klauer, S., Dingus, T., Neale, V., Sudweeks, J., Ramsey, D. (2006). The Impact of Driver
Inattention on Near-Crash/Crash Risk: An Analysis using the 100-car Naturalistic Driving Study
Data. Administration Report No. DOT HS 810 594, National Highway Traffic Safety,
Washington, D.C, 2006.
Lee, S., McElheny, M.,Gibbons, R. (2007). Driving Performance and Digital Billboards.
Prepared for Foundation for Outdoor Advertising Research and Education by the Virginia Tech
Transportation Institute (VTTI), Center for Automotive Safety Research.
Marciano, H., and Yeshurun, Y. (2012). Perceptual Load in Central and Peripheral Regions and
Its Effects on Driving Performance: Advertising Billboards. Work, Volume 41, Issue SUPPL.1,
2012, pp. 3181-3188.
Marketing Week (2007). US's Landscape Turns Luminous as Highway Billboards Go Digital.
Marketing Week, 25 Oct2007, pp. 22-23.
Molino, J.,Wachtel, J.,Farbry, J., Hermosillo, M., Granda, T. (2009). The Effects of Commercial
Electronic Variable Message Signs (CEVMS) on Driver Attention and Distraction: An Update.
Publication FHWA-HRT-09-018.FHWA, Feb 2009.
OAAA (2012). Digital Billboards Today. Outdoor Advertising Association of America; Fact
sheet. http://www.oaaa.org/legislativeand regulatory/digital/aboutdigitalbillboardtechnology.asp
14
Shepard, G. (2007). Guidance on Off-Premise Changeable Message Signs. Federal Highway
Administration, Memorandum 25 Sep 2007.
Smiley, A., Persaud, B., Bahar, G., Mollett, C., Lyon, C., Smahel, T., Leslie, A.,Kelman, W.
(2005). Traffic Safety Evaluation of Video Advertising Signs. Transportation Research Record,
No. 1937, Safety and Human Performance, Transportation Research Board of the National
Academies, Washington, D.C., 2005, pp. 105-112.
Stilson, J. (2010). Anti-Static Cling. Brandweek, Vol. 51, Issue 5, 1 Feb 2010, p 11.
Tantala, M. and Tantala, A. (2010a). A Study of the Relationship Between Digital Billboards and
Traffic Safety in Albuquerque, New Mexico. Submitted to the Foundation for Outdoor
Advertising Research and Education (FOARE). 8 Mar, 2010.
Tantala, M. and Tantala, A. (2010b). A Study of the Relationship Between Digital Billboards and
Traffic Safety in Henrico County and Richmond, Virginia. Submitted to the Foundation for
Outdoor Advertising Research and Education (FOARE). 29 Nov, 2010.
Wachtel, J. (2009). Safety Impacts of the Emerging Digital Display Technology for Outdoor
Advertising Signs. Project 20-7 (256), Final Report. NCHRP, Apr 2009.
Wachtel, J. (2011). Digital Billboards, Distracted Drivers. Planning, Vol. 77, Issue 3, Mar 2011,
pp. 25-27.
Wallace, B. (2003). Driver Distraction by Advertising: Genuine Risk or Urban Myth?
Proceedings of the Institution of Civil Engineers: Municipal Engineer, Vol. 156, No. 3, Sept
2003, pp. 185-190.
Yannis, G., Papadimitriou, E., Papantoniou, P., Voulgari, C. (2012). A Statistical Analysis of the
Impact of Advertising Signs on Road Safety. Department of Transportation Planning and
Engineering, School of Civil Engineering, National Technical University of Athens, Athens,
Greece. 16 May 2012.
Young, M., and Mahfoud, J., (2007). Driven to Distraction: The Effects of Roadside Advertising
on Driver Attention. Contemporary Ergonomics, ISBN-13: 9780415436380, 2007, pp. 145- 150.
15
CHAPTER 3
SAFETY ASSESSMENT OF DIGITAL BILLBOARDS IN FLORIDA
This chapter focuses on assessing the traffic safety impact of digital billboards in Florida. It first
describes the method used to identify study locations. It then discusses the methodological
approach used to conduct the safety analysis and the analysis results. Finally, a summary of the
main findings and relevant conclusions are provided.
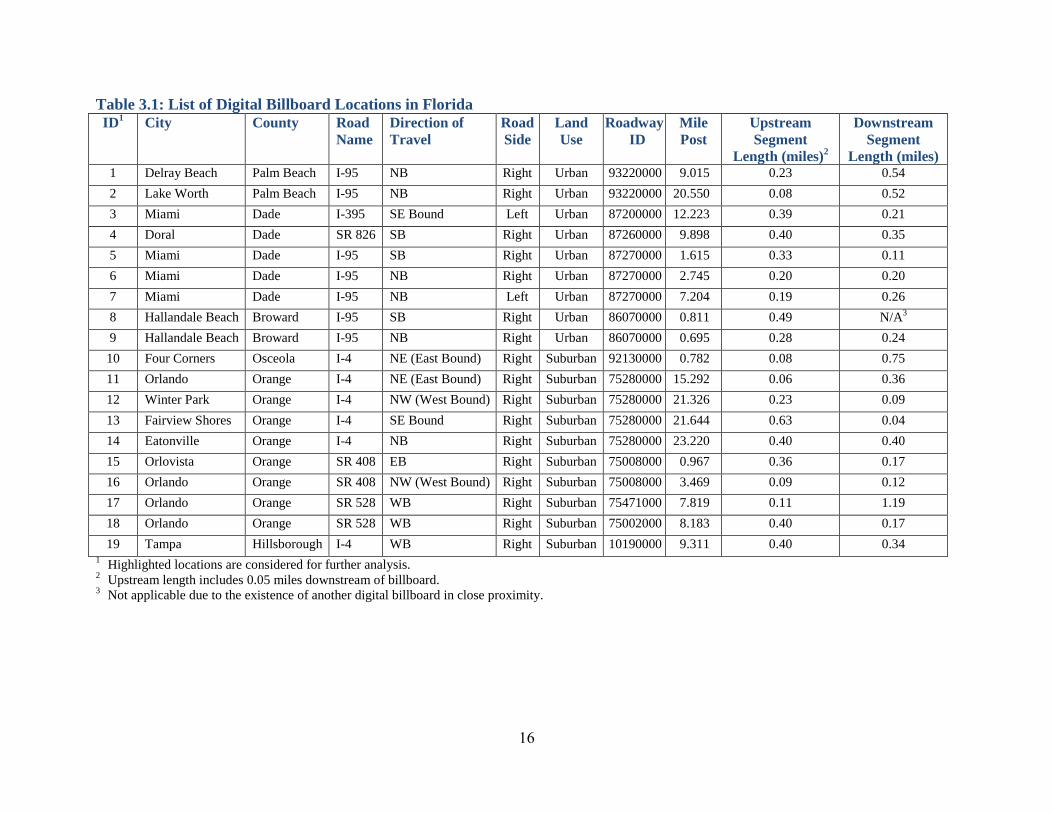
3.1 Identification of Study Locations
Using Google Earth’s Street View, a total of 23 locations with digital billboards were visually
identified by “flying” through all limited access facilities (i.e., freeways and expressways) in
Florida. Given that digital billboards are relatively new, it was determined that the standard
minimum three years of crash data (2009-2011) will be used in the analysis. Accordingly, each
digital billboard location was checked to determine if it has been in existence since 2009. Using
Google Earth’s “Historical Imagery” function, three of the 23 digital billboards were found to
have been installed after 2009 and were thus excluded. In addition, another digital billboard was
excluded since it was very close (about 0.4 miles) to another downstream digital billboard. A
total of 19 locations, as listed in Table 3.1, were finally selected for further assessment.
3.2 Methodological Approach
The general method used to measure the potential safety impact of digital billboards in this study
is evaluated by comparing the crash rate at the freeway segment where the drivers were likely to
be distracted by the presence of a digital billboard with the crash rate at a paired segment where
the drivers were not distracted by the same digital billboard. Ideally, these two segments should
be upstream and downstream of each other so that they experience the same traffic. The two
segments should also have the same geometric conditions to further ensure that the only main
difference between the two segments would be the presence of the digital billboard.
Ideally, the paired segment (i.e., segment with no digital billboard) should be located upstream of
the segment being paired (i.e., segment with a digital billboard) to ensure that the drivers had not
seen the digital billboard; thus, could not possibly have been distracted by it. However, it was
found that a majority of the identified billboard locations were located close to the downstream
section of the interchange. In other words, they do not provide a sufficient length to further
divide into two segments with same traffic and geometric conditions. As a result, it was decided
that the paired segment had to be based on the segment downstream of the digital billboard. This
is considered less desirable as some drivers may continue to be distracted after passing the digital
billboard. However, this would still allow the comparison to capture the key potential distraction,
i.e., when the drivers took their eyes off the roadway to view the digital billboards.
16
Table 3.1: List of Digital Billboard Locations in Florida
ID1 City County Road
Name
Direction of
Travel
Road
Side
Land
Use
Roadway
ID
Mile
Post
Upstream
Segment
Length (miles)2
Downstream
Segment
Length (miles) 1 Delray Beach Palm Beach I-95 NB Right Urban 93220000 9.015 0.23 0.54
2 Lake Worth Palm Beach I-95 NB Right Urban 93220000 20.550 0.08 0.52
3 Miami Dade I-395 SE Bound Left Urban 87200000 12.223 0.39 0.21
4 Doral Dade SR 826 SB Right Urban 87260000 9.898 0.40 0.35
5 Miami Dade I-95 SB Right Urban 87270000 1.615 0.33 0.11
6 Miami Dade I-95 NB Right Urban 87270000 2.745 0.20 0.20
7 Miami Dade I-95 NB Left Urban 87270000 7.204 0.19 0.26
8 Hallandale Beach Broward I-95 SB Right Urban 86070000 0.811 0.49 N/A3
9 Hallandale Beach Broward I-95 NB Right Urban 86070000 0.695 0.28 0.24
10 Four Corners Osceola I-4 NE (East Bound) Right Suburban 92130000 0.782 0.08 0.75
11 Orlando Orange I-4 NE (East Bound) Right Suburban 75280000 15.292 0.06 0.36
12 Winter Park Orange I-4 NW (West Bound) Right Suburban 75280000 21.326 0.23 0.09
13 Fairview Shores Orange I-4 SE Bound Right Suburban 75280000 21.644 0.63 0.04
14 Eatonville Orange I-4 NB Right Suburban 75280000 23.220 0.40 0.40
15 Orlovista Orange SR 408 EB Right Suburban 75008000 0.967 0.36 0.17
16 Orlando Orange SR 408 NW (West Bound) Right Suburban 75008000 3.469 0.09 0.12
17 Orlando Orange SR 528 WB Right Suburban 75471000 7.819 0.11 1.19
18 Orlando Orange SR 528 WB Right Suburban 75002000 8.183 0.40 0.17
19 Tampa Hillsborough I-4 WB Right Suburban 10190000 9.311 0.40 0.34 1 Highlighted locations are considered for further analysis.
2 Upstream length includes 0.05 miles downstream of billboard.
3 Not applicable due to the existence of another digital billboard in close proximity.
17
3.3 Determination of Segment Lengths
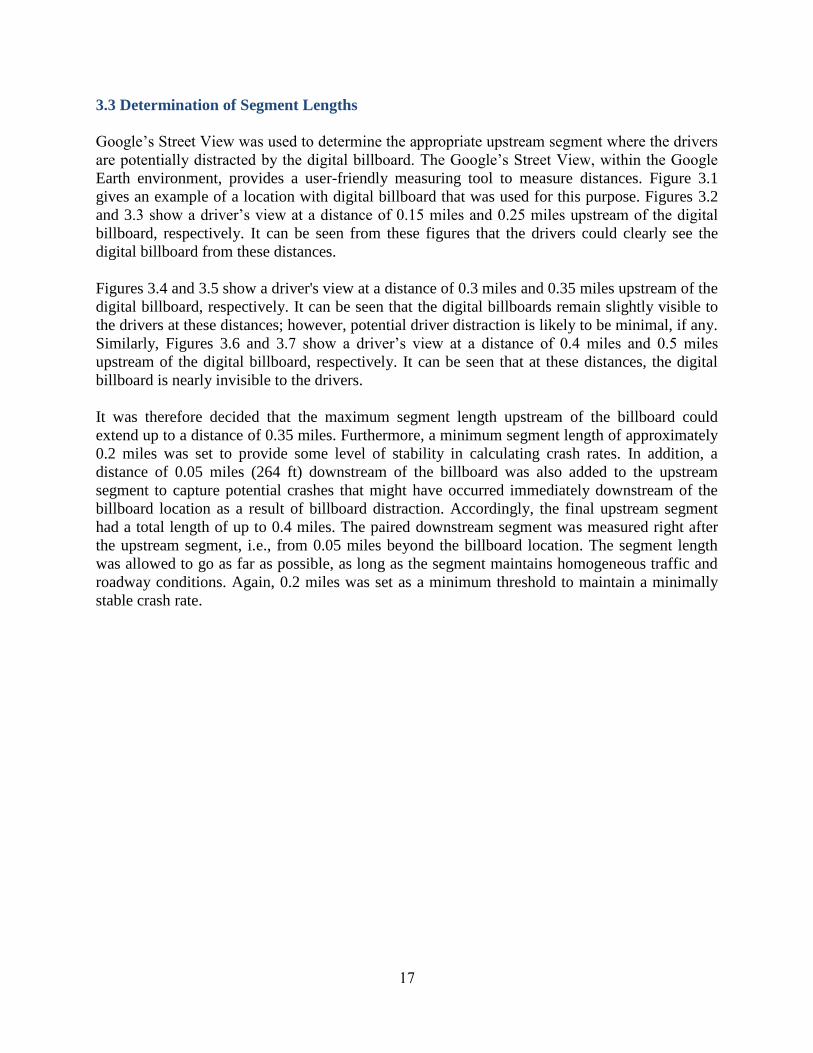
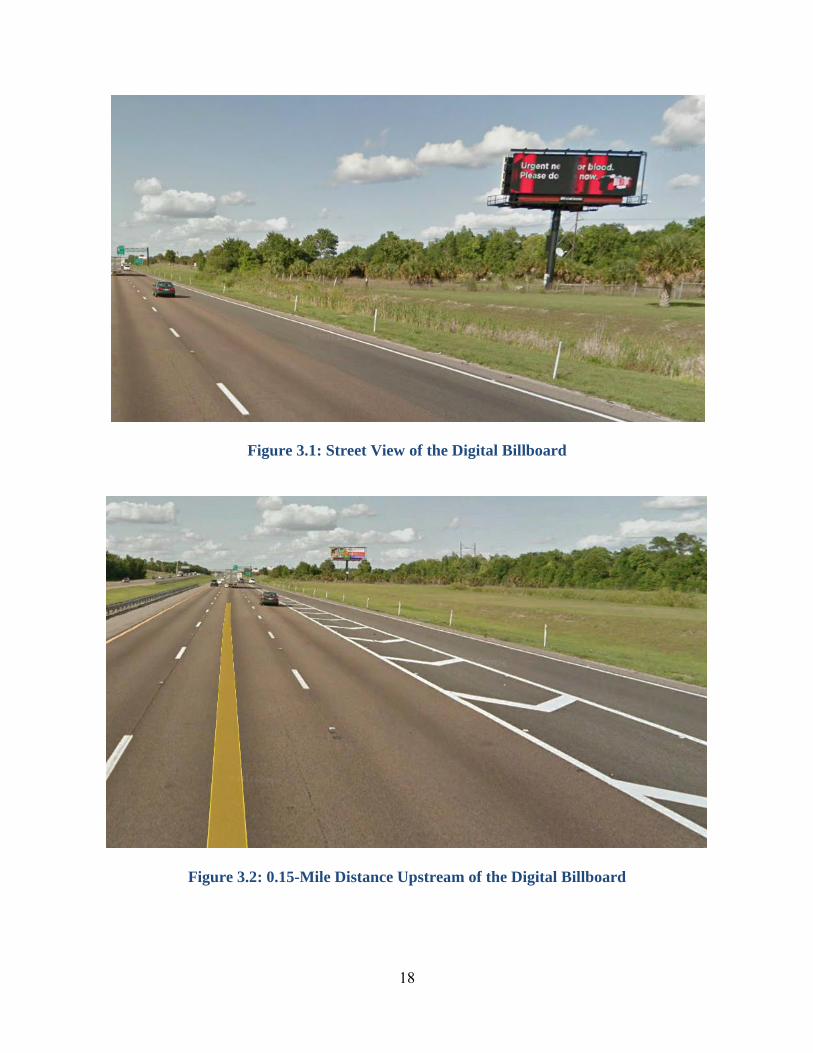
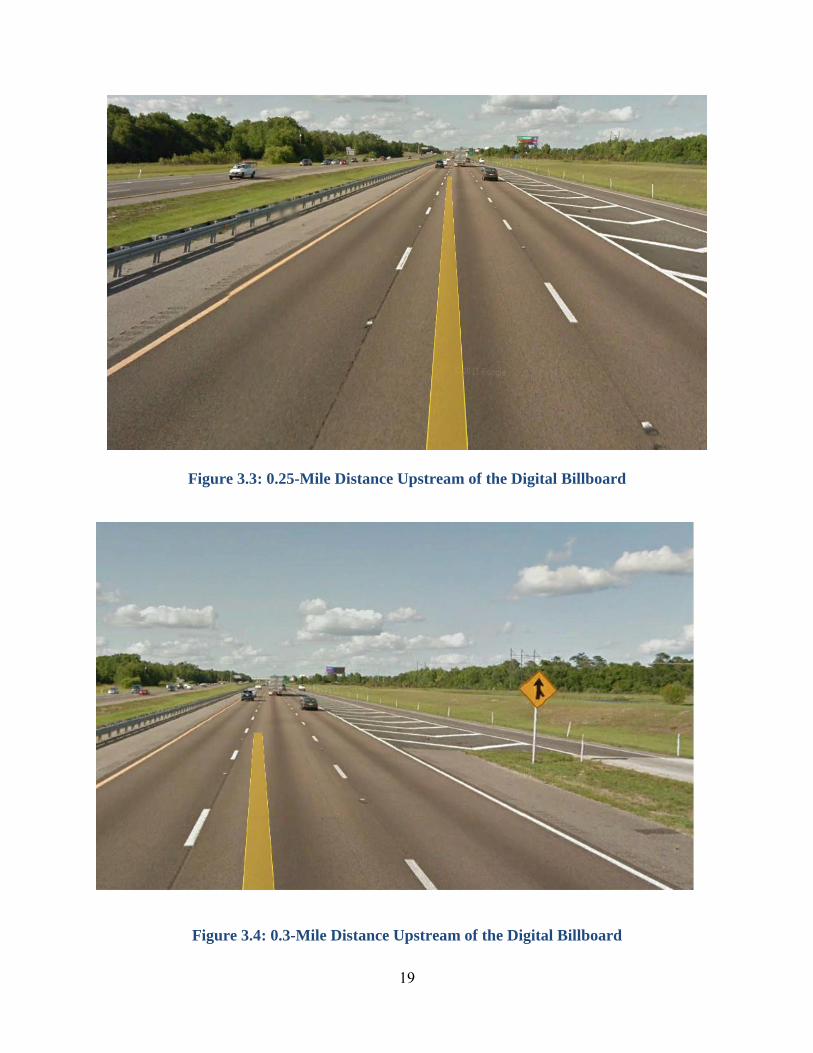
Google’s Street View was used to determine the appropriate upstream segment where the drivers
are potentially distracted by the digital billboard. The Google’s Street View, within the Google
Earth environment, provides a user-friendly measuring tool to measure distances. Figure 3.1
gives an example of a location with digital billboard that was used for this purpose. Figures 3.2
and 3.3 show a driver’s view at a distance of 0.15 miles and 0.25 miles upstream of the digital
billboard, respectively. It can be seen from these figures that the drivers could clearly see the
digital billboard from these distances.
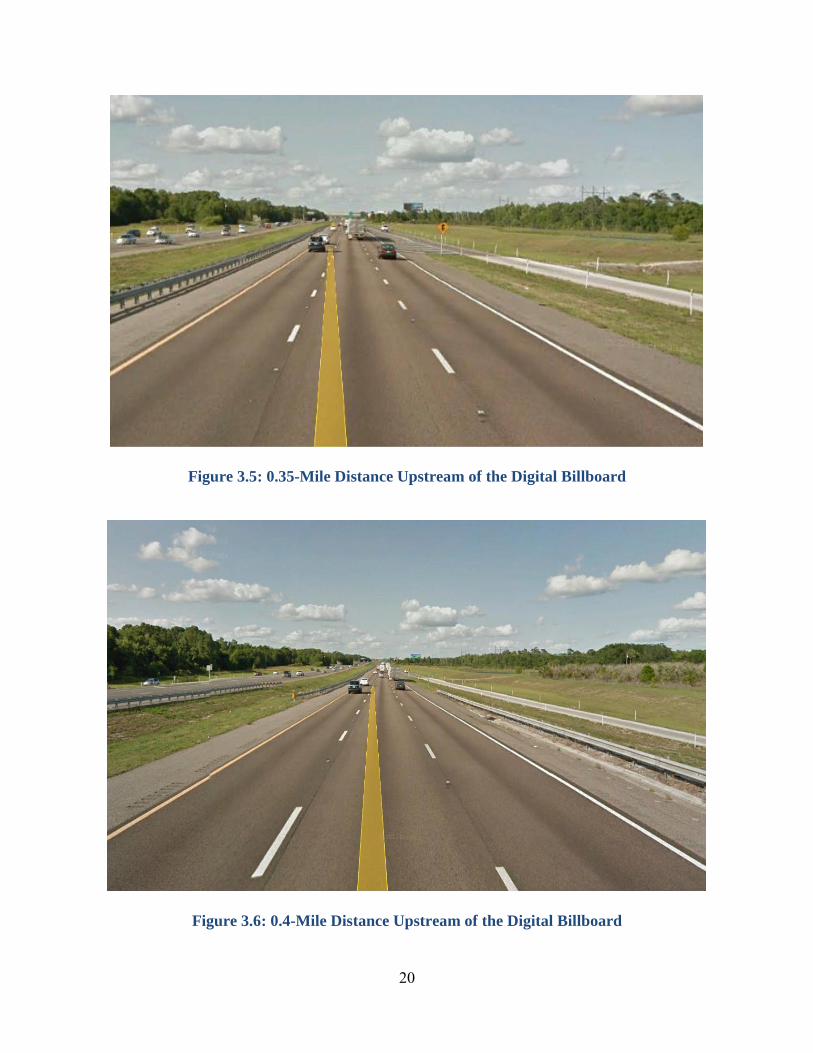
Figures 3.4 and 3.5 show a driver's view at a distance of 0.3 miles and 0.35 miles upstream of the
digital billboard, respectively. It can be seen that the digital billboards remain slightly visible to
the drivers at these distances; however, potential driver distraction is likely to be minimal, if any.
Similarly, Figures 3.6 and 3.7 show a driver’s view at a distance of 0.4 miles and 0.5 miles
upstream of the digital billboard, respectively. It can be seen that at these distances, the digital
billboard is nearly invisible to the drivers.
It was therefore decided that the maximum segment length upstream of the billboard could
extend up to a distance of 0.35 miles. Furthermore, a minimum segment length of approximately
0.2 miles was set to provide some level of stability in calculating crash rates. In addition, a
distance of 0.05 miles (264 ft) downstream of the billboard was also added to the upstream
segment to capture potential crashes that might have occurred immediately downstream of the
billboard location as a result of billboard distraction. Accordingly, the final upstream segment
had a total length of up to 0.4 miles. The paired downstream segment was measured right after
the upstream segment, i.e., from 0.05 miles beyond the billboard location. The segment length
was allowed to go as far as possible, as long as the segment maintains homogeneous traffic and
roadway conditions. Again, 0.2 miles was set as a minimum threshold to maintain a minimally
stable crash rate.
18
Figure 3.1: Street View of the Digital Billboard
Figure 3.2: 0.15-Mile Distance Upstream of the Digital Billboard
19
Figure 3.3: 0.25-Mile Distance Upstream of the Digital Billboard
Figure 3.4: 0.3-Mile Distance Upstream of the Digital Billboard
20
Figure 3.5: 0.35-Mile Distance Upstream of the Digital Billboard
Figure 3.6: 0.4-Mile Distance Upstream of the Digital Billboard
21
Figure 3.7: 0.5-Mile Distance Upstream of the Digital Billboard
3.4 Final Determination of Digital Billboard Locations
As shown in Table 3.1, strictly, only seven of the 19 locations could meet the aforementioned
stringent segment definitions. However, location ID 7 along I-95 in Miami was added to the list
of potential locations since the upstream distance was very close to the minimum 0.2-mile
threshold. Similarly, location IDs 15 and 18 in Orange County were included since the
downstream distance at both the locations was close to the minimum 0.2-mile threshold. The
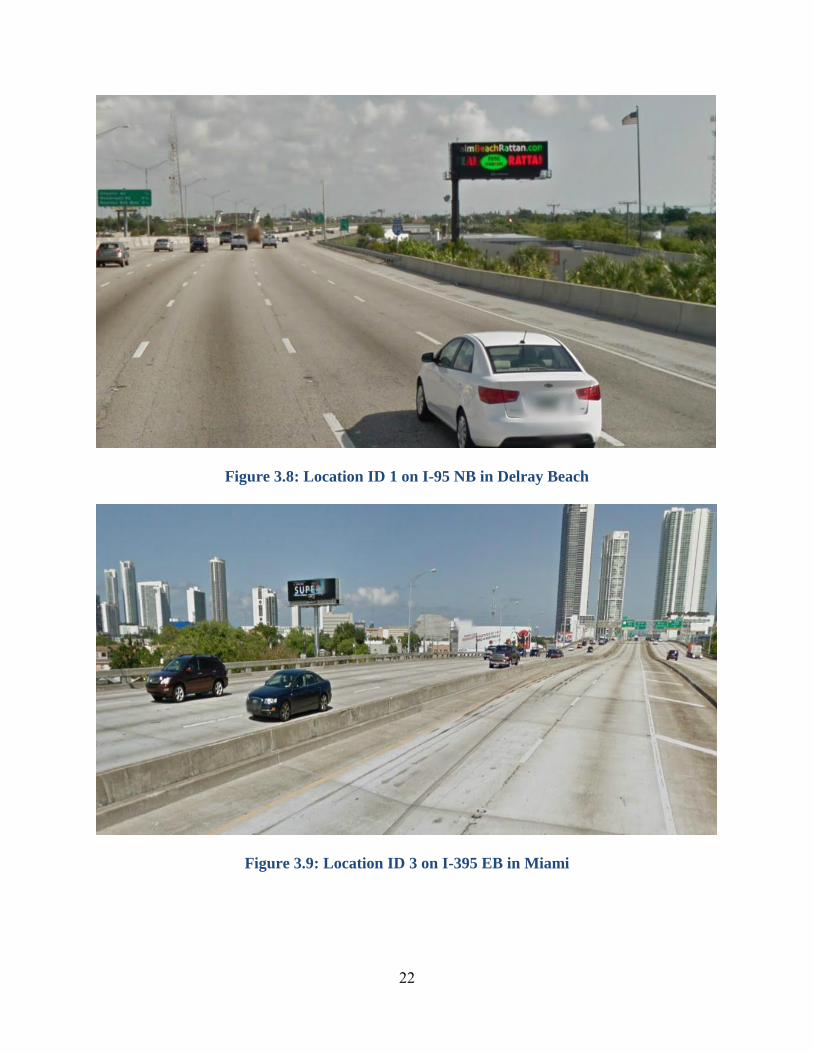
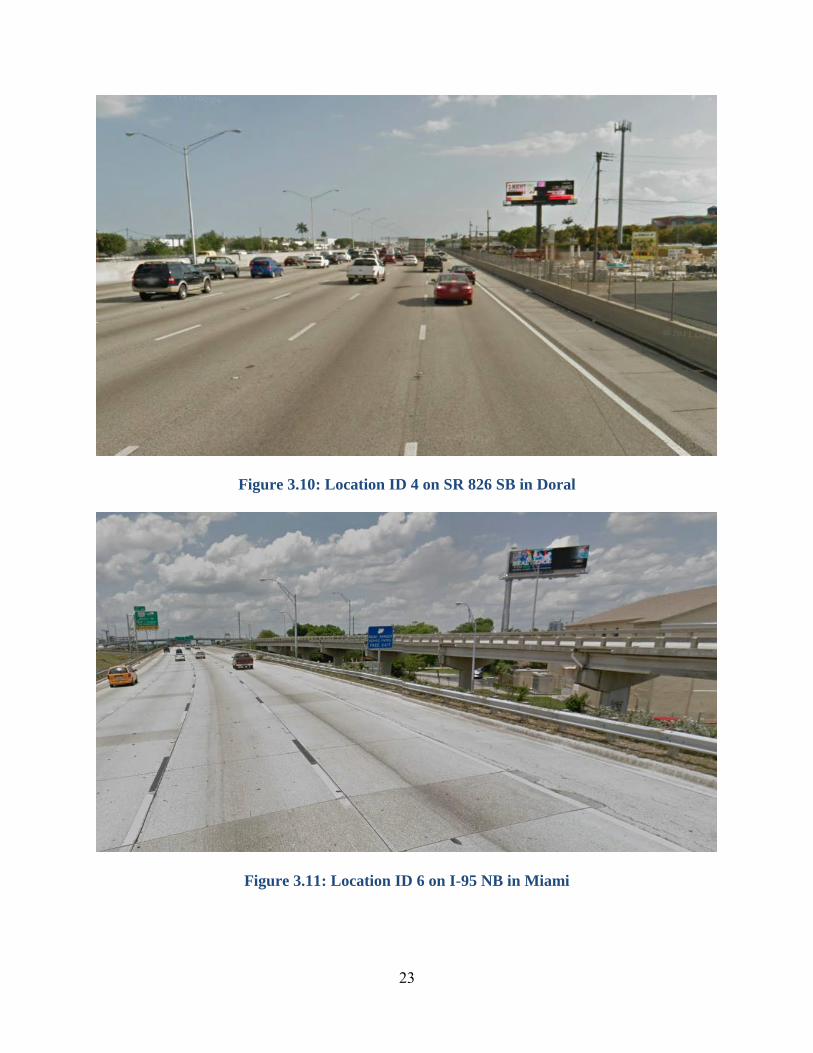
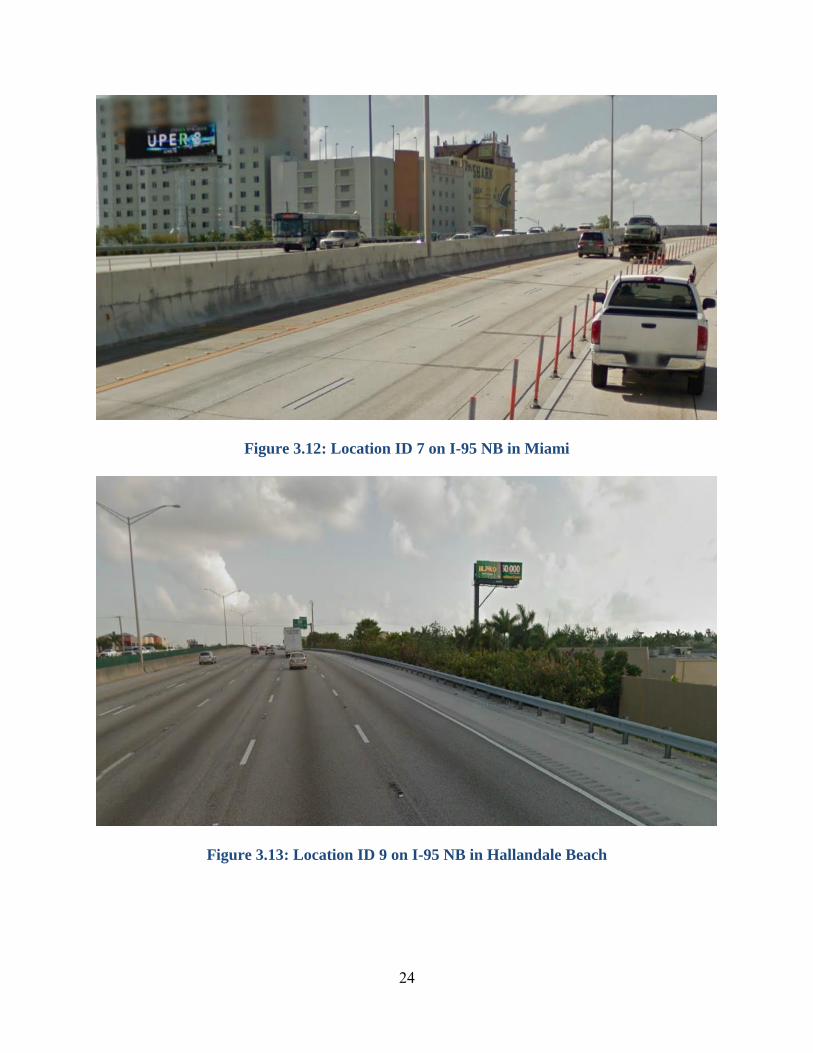
final ten locations selected for this study are highlighted in Table 3.1 and the street view of each
of these locations is shown in Figures 3.8 through 3.17, respectively. These locations were
further verified to ensure that no static signs exist in their vicinity that could further cause driver
distraction.
22
Figure 3.8: Location ID 1 on I-95 NB in Delray Beach
Figure 3.9: Location ID 3 on I-395 EB in Miami
23
Figure 3.10: Location ID 4 on SR 826 SB in Doral
Figure 3.11: Location ID 6 on I-95 NB in Miami
24
Figure 3.12: Location ID 7 on I-95 NB in Miami
Figure 3.13: Location ID 9 on I-95 NB in Hallandale Beach
25
Figure 3.14: Location ID 14 on I-4 NB in Eatonville
Figure 3.15: Location ID 15 on SR 408 EB in Orlovista
26
Figure 3.16: Location ID 18 on SR 528 WB in Orlando
Figure 3.17: Location ID 19 on I-4 WB in Tampa
3.5 Safety Assessment Procedure
As previously mentioned, the safety assessment of digital billboards was conducted by
comparing the crash rate at the segment upstream of the billboard to the crash rate at the segment
downstream of the billboard. A schematic sketch of the analysis procedure is illustrated in Figure
3.18. Crashes from 2009 to 2011 were extracted from the Crash Analysis Reporting (CAR)
System and were assigned to the paired upstream and downstream segments at the ten study
locations. Note that only crashes in the direction of the billboard distraction were included in the
analysis. The crash rate (CR) (in crashes per million vehicle miles (MVM) per year) was
27
Figure 3.18: Schematic Sketch of the Safety Assessment Procedure
calculated for each segment using the following equation. Note that the AADT in the dominator
was multiplied by 0.5 to calculate the crash rate for the affected roadway direction, i.e., by
assuming a 50/50 directional split.
NLAADT
CountCrashCR
3655.0
106
(3.1)
where,
Crash Count = count of crashes at each segment,
AADT = annual average daily traffic for both directions in vehicles/day,
L = segment length in miles, and
N = number of study years (N = 3 in this study, i.e., 2009-2011).
3.6 Review of Police Reports
Three years of crashes from 2009 to 2011 were assigned to the ten study locations. Closer review
of the police reports revealed that the mileposts of crashes, especially on freeways, are not
accurate as they are based on the distance of the crash from a landmark, such as a mile marker or
an interchange (for example, 0.3 miles from Node No. 01116). For this, the exact location of
crash is imprecise. From the illustrative sketches in the police reports, it was also found that
crashes that occurred at the upstream section were located at the downstream section, and vice-
Digital
Billboard Direction of Travel
0.05 mi (264 ft)
Upstream
Segment
(CRB)
Compare
Downstream Paired
Segment
(≥ 0.2 mi and ≤ 0.4 mi) (≥ 0.2 mi)
(CRA)
28
versa. Therefore, to accurately assign crashes to the upstream and downstream sections, police
reports of all the crashes that occurred at the study locations were downloaded and reviewed in
detail to verify and correct crash locations. Furthermore, police reports of crashes that occurred
along an additional 0.4-mile distance (0.2 miles prior to the upstream point and 0.2 miles beyond
the downstream point) were also reviewed to capture crashes that should have been included in
the analysis, but were incorrectly excluded.
A total of 783 police reports were downloaded and reviewed in detail. The review focused on
correcting the crash location and the crash type. After carefully investigating the police reports of
these 783 crashes, it was concluded that 406 crashes should be excluded and were outside the
upstream and downstream segment borders. In other words, a total of 377 crashes (215 at the
upstream segments and 162 at the downstream segments) were finally included in the analysis.
3.7 Safety Analysis Results
3.7.1 Crash Summary by Location
Table 3.2 shows crash summary statistics of the upstream and downstream segments at each of
the ten locations. The statistics include segment length, crash count, AADT, crash rate, and
percent change in crash rates. The table also includes the overall crash statistics. From the table,
it is observed that the three highlighted locations (5, 6, and 9) experienced a crash rate reduction
in the downstream section compared to the upstream section. Location 9 had the highest
reduction of 100% since no crash occurred in the downstream section. On the other hand, the
other seven locations experienced a crash rate increase in the downstream section compared to
the upstream section. The highest increase was 501.7% at location 1, and the lowest increase was
2.82% at location 10. Note that an overall crash rate reduction of 24.79% was observed at all the
ten locations combined.
3.7.2 Summary by Crash Type
Table 3.3 shows summary statistics by crash type at all ten study locations combined at each of
the upstream and downstream sections. The locations experienced five types of crash types: rear-
end, sideswipe, collision with fixed objects, median crossover, and tractor jackknifed. The most
frequent crashes that occurred at the upstream sections were sideswipe, while rear-end crashes
were the most frequent at the downstream sections. It is observed that the median crossover and
tractor jackknifed crash types were too few to yield reliable conclusions. It is also seen that the
crash rates of the remaining crash types (i.e., rear-end, sideswipe, and collisions with fixed
objects) were reduced at the downstream sections compared to the upstream sections. The
highest reduction in crash rates was observed for collisions with fixed objects (55.84%),
followed by sideswipe (45.74%), and finally rear-end (0.12%).
29
Table 3.2: Crash Summary Statistics at the Ten Digital Billboard Locations
Loc. City Upstream Downstream %
Change
in Crash
Rate
Len.
(mi)
Total
Crash
Count
AADT Crash
Rate*
Len.
(mi)
Total
Crash
Count
AADT Crash
Rate*
1 Delray Beach 0.23 1 195,000 0.041 0.54 14 193,250 0.245 501.70
2 Miami 0.39 13 123,808 0.492 0.21 9 143,333 0.546 11.06
3 Doral 0.40 21 210,000 0.457 0.35 36 211,667 0.888 94.38
4 Miami 0.20 15 162,900 0.841 0.20 41 160,720 2.330 177.04
5 Miami 0.19 97 245,000 3.806 0.26 35 251,543 0.977 -74.32
6 Hallandale
Beach
0.28 54 232,389 1.516 0.24 15 238,253 0.479 -68.39
7 Eatonville 0.40 3 160,000 0.086 0.40 3 151,500 0.090 5.61
8 Orlovista 0.36 1 60,000 0.085 0.17 2 60,000 0.358 323.53
9 Orlando 0.40 2 42,750 0.214 0.17 0 --- 0.000 -100.00
10 Tampa 0.40 8 153,750 0.238 0.34 7 153,929 0.244 2.82
Total Crashes 3.25 215 --- 0.809 2.88 162 --- 0.608 -24.79 * Crash rate is in crashes per million vehicle miles per year.
Table 3.3: Summary Statistics by Crash Type Crash Type Upstream Downstream Percent Change
in Crash Rate Crash Count Crash Rate2 Crash Count Crash Rate
2
Rear-end 82 0.373 99 0.373 -0.12
Sideswipe 88 0.346 40 0.187 -45.74
Collision with Fixed
Objects1
43 0.222 21 0.098 -55.84
Median Crossover 1 0.041 2 0.063 54.27
Tractor/Trailer Jackknifed 1 0.028 0 0.000 -100.00
Total Crashes 215 0.809 162 0.608 -24.79 1 Fixed objects include traffic signs, guardrails, concrete barrier walls, and trees.
2 Crash rate is in crashes per million vehicle miles per year.
30
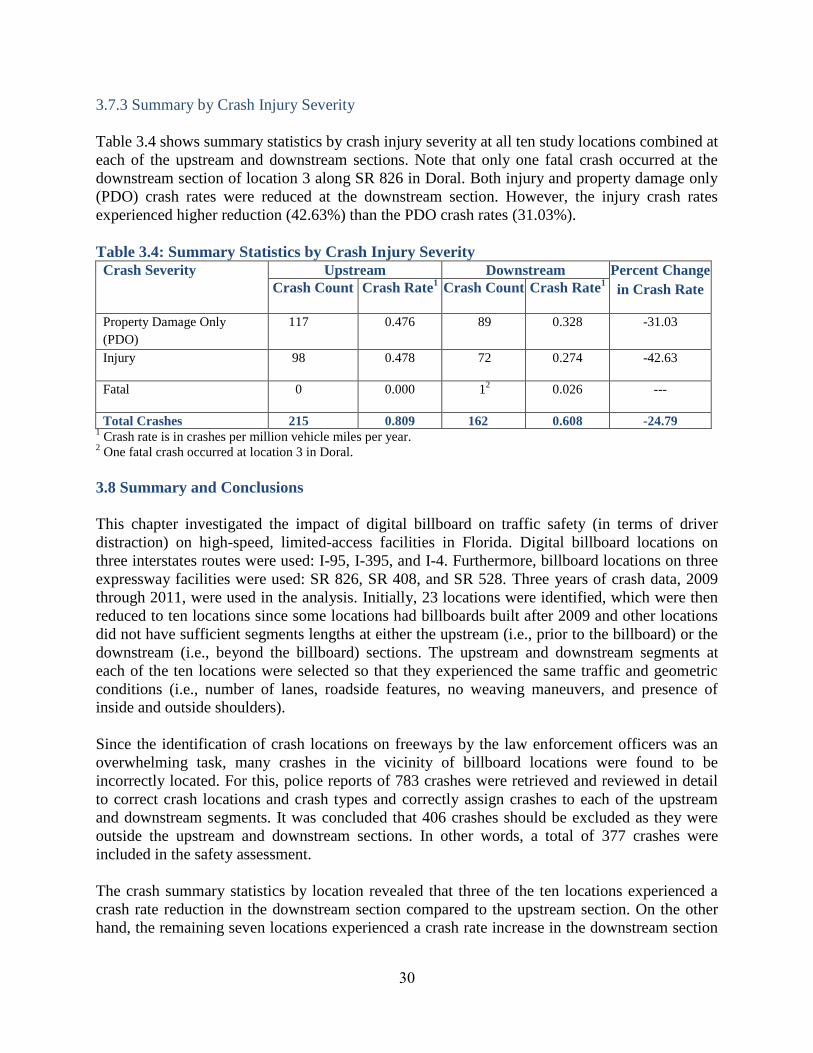
3.7.3 Summary by Crash Injury Severity
Table 3.4 shows summary statistics by crash injury severity at all ten study locations combined at
each of the upstream and downstream sections. Note that only one fatal crash occurred at the
downstream section of location 3 along SR 826 in Doral. Both injury and property damage only
(PDO) crash rates were reduced at the downstream section. However, the injury crash rates
experienced higher reduction (42.63%) than the PDO crash rates (31.03%).
Table 3.4: Summary Statistics by Crash Injury Severity Crash Severity Upstream Downstream Percent Change
in Crash Rate Crash Count Crash Rate1 Crash Count Crash Rate
1
Property Damage Only
(PDO)
117 0.476 89 0.328 -31.03
Injury 98 0.478 72 0.274 -42.63
Fatal 0 0.000 12 0.026 ---
Total Crashes 215 0.809 162 0.608 -24.79 1 Crash rate is in crashes per million vehicle miles per year.
2 One fatal crash occurred at location 3 in Doral.
3.8 Summary and Conclusions
This chapter investigated the impact of digital billboard on traffic safety (in terms of driver
distraction) on high-speed, limited-access facilities in Florida. Digital billboard locations on
three interstates routes were used: I-95, I-395, and I-4. Furthermore, billboard locations on three
expressway facilities were used: SR 826, SR 408, and SR 528. Three years of crash data, 2009
through 2011, were used in the analysis. Initially, 23 locations were identified, which were then
reduced to ten locations since some locations had billboards built after 2009 and other locations
did not have sufficient segments lengths at either the upstream (i.e., prior to the billboard) or the
downstream (i.e., beyond the billboard) sections. The upstream and downstream segments at
each of the ten locations were selected so that they experienced the same traffic and geometric
conditions (i.e., number of lanes, roadside features, no weaving maneuvers, and presence of
inside and outside shoulders).
Since the identification of crash locations on freeways by the law enforcement officers was an
overwhelming task, many crashes in the vicinity of billboard locations were found to be
incorrectly located. For this, police reports of 783 crashes were retrieved and reviewed in detail
to correct crash locations and crash types and correctly assign crashes to each of the upstream
and downstream segments. It was concluded that 406 crashes should be excluded as they were
outside the upstream and downstream sections. In other words, a total of 377 crashes were
included in the safety assessment.
The crash summary statistics by location revealed that three of the ten locations experienced a
crash rate reduction in the downstream section compared to the upstream section. On the other
hand, the remaining seven locations experienced a crash rate increase in the downstream section
31
compared to the upstream section. However, overall, there was a 24.79% reduction in total crash
rate at all the ten study locations combined.
The breakdown of crashes by crash type at all ten locations combined showed a crash rate
reduction at the downstream section compared to the upstream section for collisions with fixed
objects (55.84%), followed by sideswipe crashes (45.74%), and finally rear-end crashes (0.12%).
The summary statistics by crash injury severity at all ten locations combined revealed that both
injury and PDO crash rates were reduced at the downstream section. However, the injury crash
rates experienced higher reduction (42.63%) than the PDO crash rates (31.03%).
From the safety assessment in this chapter, it can be concluded that the difference in the crash
rates between DBB influence areas and control sites in Florida varies from site to site but overall
there is a 25% increase (approximately) in crash rates in DBB influence areas. Also, certain
types of crashes are overrepresented in digital advertising billboard influence areas, including
fixed objects, sideswipe, and rear-end crashes, hinting a correlation between traffic safety and
driver distraction at DBB influence areas.
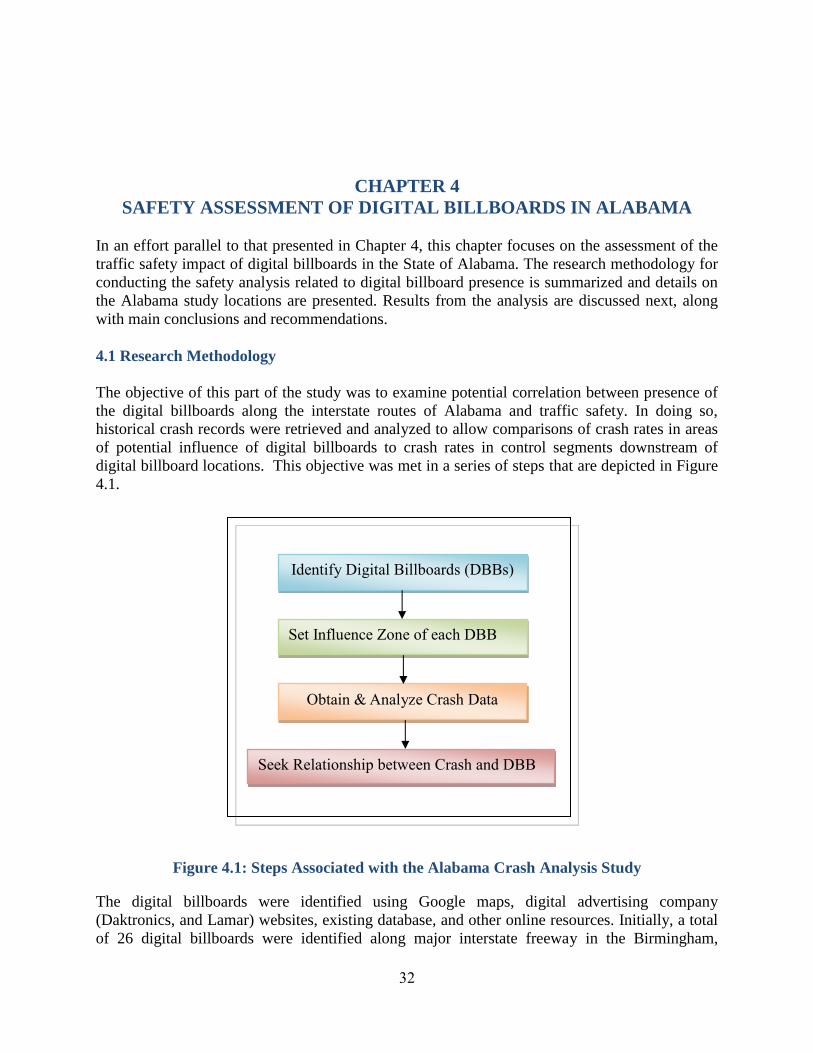
32
CHAPTER 4
SAFETY ASSESSMENT OF DIGITAL BILLBOARDS IN ALABAMA
In an effort parallel to that presented in Chapter 4, this chapter focuses on the assessment of the
traffic safety impact of digital billboards in the State of Alabama. The research methodology for
conducting the safety analysis related to digital billboard presence is summarized and details on
the Alabama study locations are presented. Results from the analysis are discussed next, along
with main conclusions and recommendations.
4.1 Research Methodology
The objective of this part of the study was to examine potential correlation between presence of
the digital billboards along the interstate routes of Alabama and traffic safety. In doing so,
historical crash records were retrieved and analyzed to allow comparisons of crash rates in areas
of potential influence of digital billboards to crash rates in control segments downstream of
digital billboard locations. This objective was met in a series of steps that are depicted in Figure
4.1.
Figure 4.1: Steps Associated with the Alabama Crash Analysis Study
The digital billboards were identified using Google maps, digital advertising company
(Daktronics, and Lamar) websites, existing database, and other online resources. Initially, a total
of 26 digital billboards were identified along major interstate freeway in the Birmingham,
Identify Digital Billboards (DBBs)
Set Influence Zone of each DBB
Obtain & Analyze Crash Data
Seek Relationship between Crash and DBB
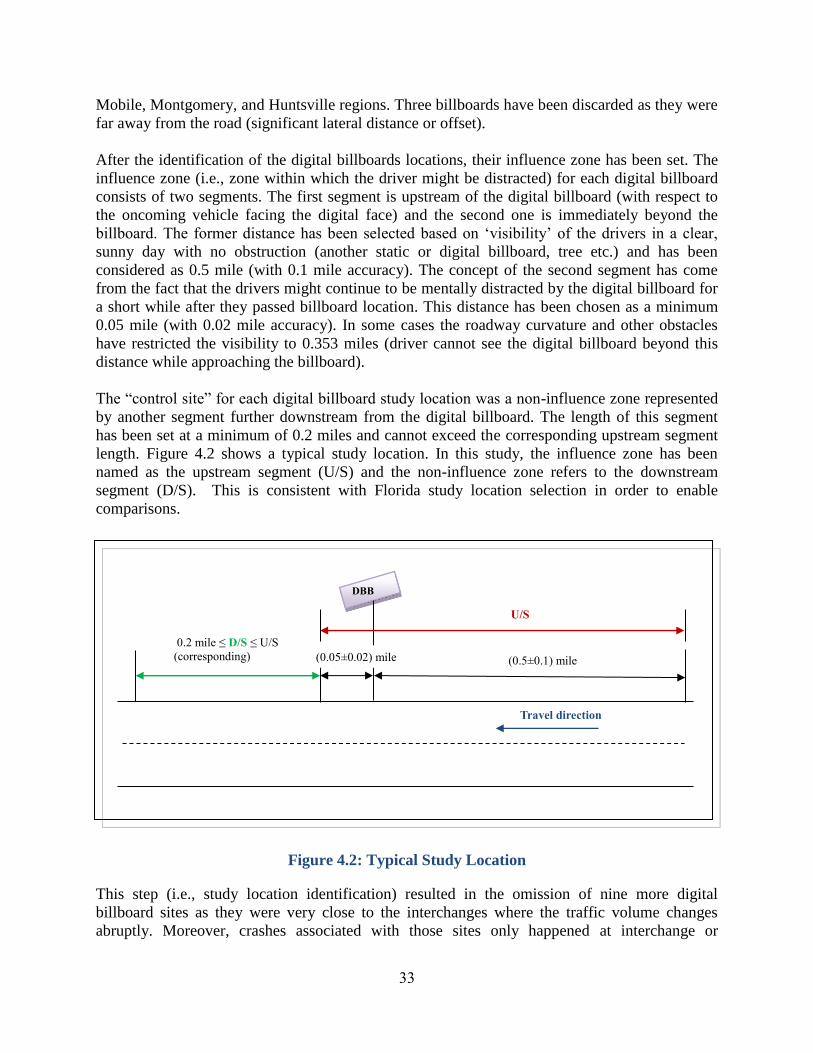
33
Mobile, Montgomery, and Huntsville regions. Three billboards have been discarded as they were
far away from the road (significant lateral distance or offset).
After the identification of the digital billboards locations, their influence zone has been set. The
influence zone (i.e., zone within which the driver might be distracted) for each digital billboard
consists of two segments. The first segment is upstream of the digital billboard (with respect to
the oncoming vehicle facing the digital face) and the second one is immediately beyond the
billboard. The former distance has been selected based on ‘visibility’ of the drivers in a clear,
sunny day with no obstruction (another static or digital billboard, tree etc.) and has been
considered as 0.5 mile (with 0.1 mile accuracy). The concept of the second segment has come
from the fact that the drivers might continue to be mentally distracted by the digital billboard for
a short while after they passed billboard location. This distance has been chosen as a minimum
0.05 mile (with 0.02 mile accuracy). In some cases the roadway curvature and other obstacles
have restricted the visibility to 0.353 miles (driver cannot see the digital billboard beyond this
distance while approaching the billboard).
The “control site” for each digital billboard study location was a non-influence zone represented
by another segment further downstream from the digital billboard. The length of this segment
has been set at a minimum of 0.2 miles and cannot exceed the corresponding upstream segment
length. Figure 4.2 shows a typical study location. In this study, the influence zone has been
named as the upstream segment (U/S) and the non-influence zone refers to the downstream
segment (D/S). This is consistent with Florida study location selection in order to enable
comparisons.
Figure 4.2: Typical Study Location
This step (i.e., study location identification) resulted in the omission of nine more digital
billboard sites as they were very close to the interchanges where the traffic volume changes
abruptly. Moreover, crashes associated with those sites only happened at interchange or
Travel direction
(0.5±0.1) mile
DBB
0.2 mile ≤ D/S ≤ U/S
(corresponding)
(0.05±0.02) mile
U/S
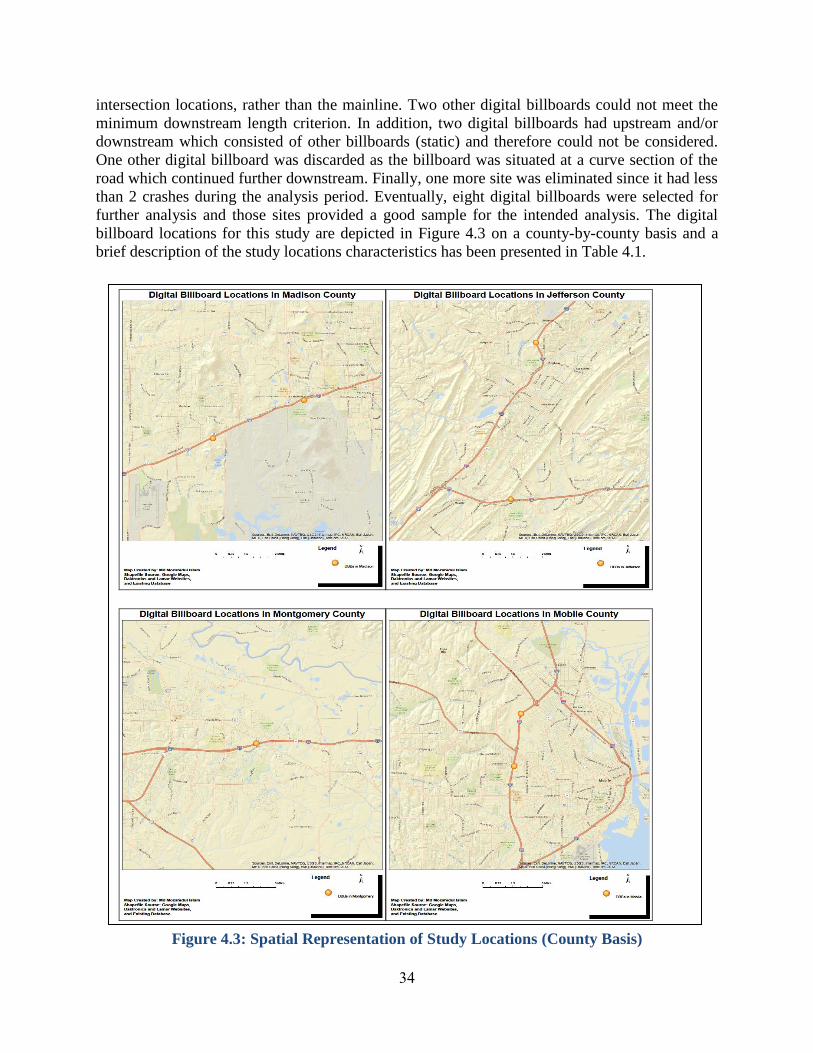
34
intersection locations, rather than the mainline. Two other digital billboards could not meet the
minimum downstream length criterion. In addition, two digital billboards had upstream and/or
downstream which consisted of other billboards (static) and therefore could not be considered.
One other digital billboard was discarded as the billboard was situated at a curve section of the
road which continued further downstream. Finally, one more site was eliminated since it had less
than 2 crashes during the analysis period. Eventually, eight digital billboards were selected for
further analysis and those sites provided a good sample for the intended analysis. The digital
billboard locations for this study are depicted in Figure 4.3 on a county-by-county basis and a
brief description of the study locations characteristics has been presented in Table 4.1.
Figure 4.3: Spatial Representation of Study Locations (County Basis)
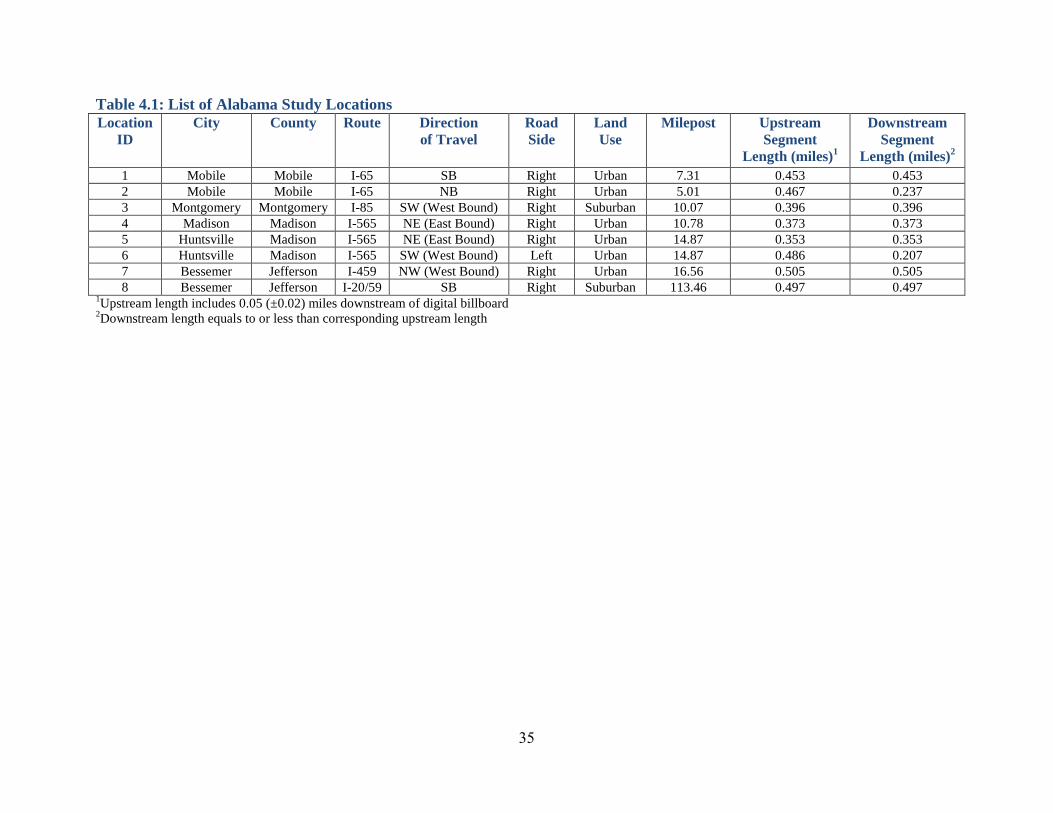
35
Table 4.1: List of Alabama Study Locations
Location
ID
City County Route Direction
of Travel
Road
Side
Land
Use
Milepost
Upstream
Segment
Length (miles)1
Downstream
Segment
Length (miles)2
1 Mobile Mobile I-65 SB Right Urban 7.31 0.453 0.453
2 Mobile Mobile I-65 NB Right Urban 5.01 0.467 0.237
3 Montgomery Montgomery I-85 SW (West Bound) Right Suburban 10.07 0.396 0.396
4 Madison Madison I-565 NE (East Bound) Right Urban 10.78 0.373 0.373
5 Huntsville Madison I-565 NE (East Bound) Right Urban 14.87 0.353 0.353
6 Huntsville Madison I-565 SW (West Bound) Left Urban 14.87 0.486 0.207
7 Bessemer Jefferson I-459 NW (West Bound) Right Urban 16.56 0.505 0.505
8 Bessemer Jefferson I-20/59 SB Right Suburban 113.46 0.497 0.497 1Upstream length includes 0.05 (±0.02) miles downstream of digital billboard
2Downstream length equals to or less than corresponding upstream length
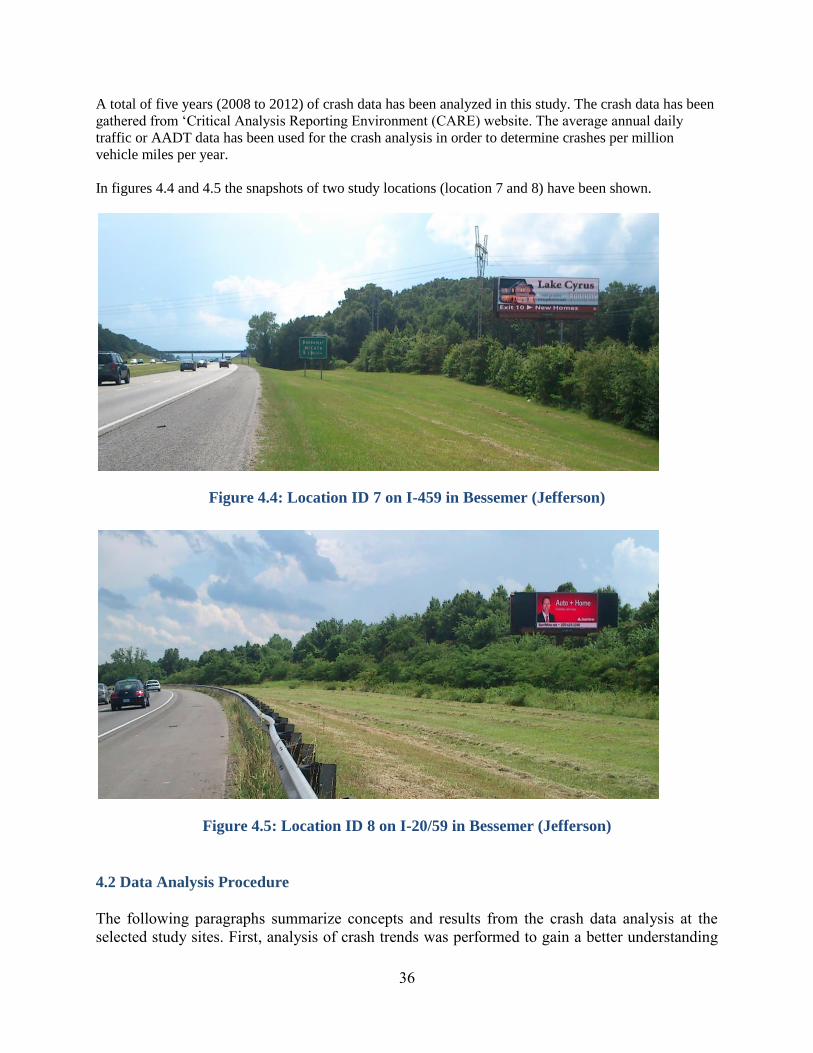
36
A total of five years (2008 to 2012) of crash data has been analyzed in this study. The crash data has been
gathered from ‘Critical Analysis Reporting Environment (CARE) website. The average annual daily
traffic or AADT data has been used for the crash analysis in order to determine crashes per million
vehicle miles per year.
In figures 4.4 and 4.5 the snapshots of two study locations (location 7 and 8) have been shown.
Figure 4.4: Location ID 7 on I-459 in Bessemer (Jefferson)
Figure 4.5: Location ID 8 on I-20/59 in Bessemer (Jefferson)
4.2 Data Analysis Procedure
The following paragraphs summarize concepts and results from the crash data analysis at the
selected study sites. First, analysis of crash trends was performed to gain a better understanding
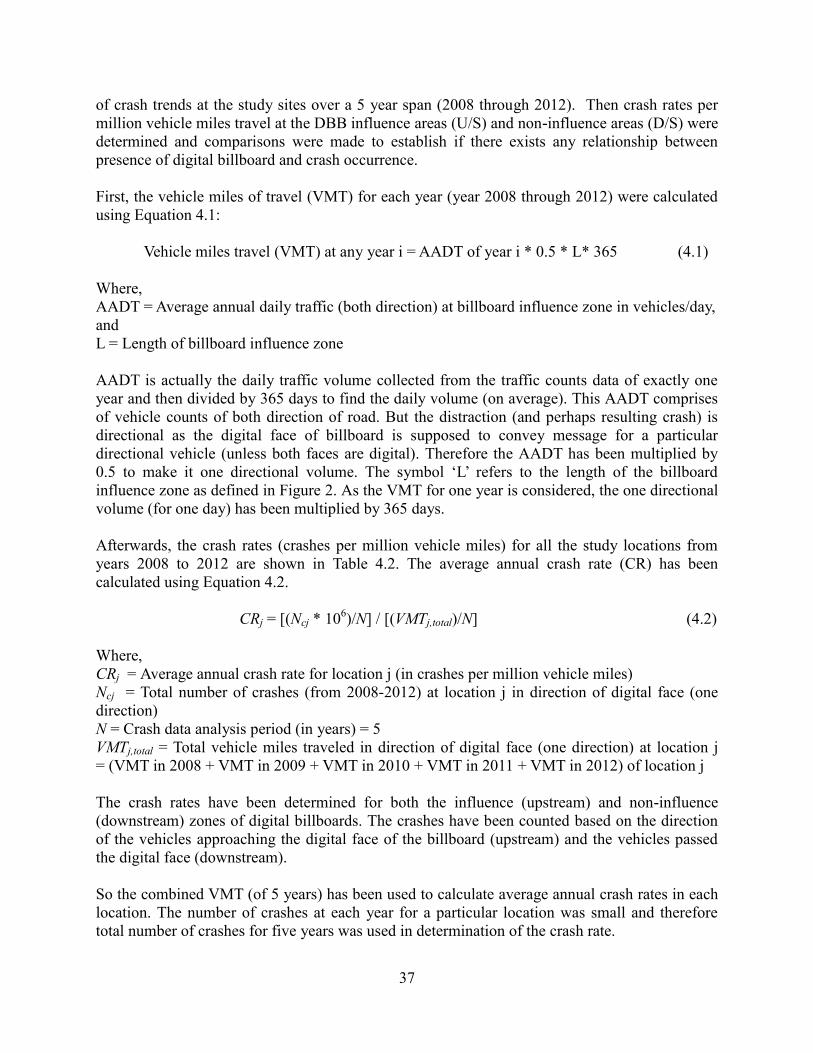
37
of crash trends at the study sites over a 5 year span (2008 through 2012). Then crash rates per
million vehicle miles travel at the DBB influence areas (U/S) and non-influence areas (D/S) were
determined and comparisons were made to establish if there exists any relationship between
presence of digital billboard and crash occurrence.
First, the vehicle miles of travel (VMT) for each year (year 2008 through 2012) were calculated
using Equation 4.1:
Vehicle miles travel (VMT) at any year i = AADT of year i * 0.5 * L* 365 (4.1)
Where,
AADT = Average annual daily traffic (both direction) at billboard influence zone in vehicles/day,
and
L = Length of billboard influence zone
AADT is actually the daily traffic volume collected from the traffic counts data of exactly one
year and then divided by 365 days to find the daily volume (on average). This AADT comprises
of vehicle counts of both direction of road. But the distraction (and perhaps resulting crash) is
directional as the digital face of billboard is supposed to convey message for a particular
directional vehicle (unless both faces are digital). Therefore the AADT has been multiplied by
0.5 to make it one directional volume. The symbol ‘L’ refers to the length of the billboard
influence zone as defined in Figure 2. As the VMT for one year is considered, the one directional
volume (for one day) has been multiplied by 365 days.
Afterwards, the crash rates (crashes per million vehicle miles) for all the study locations from
years 2008 to 2012 are shown in Table 4.2. The average annual crash rate (CR) has been
calculated using Equation 4.2.
CRj = [(Ncj * 106)/N] / [(VMTj,total)/N] (4.2)
Where,
CRj = Average annual crash rate for location j (in crashes per million vehicle miles)
Ncj = Total number of crashes (from 2008-2012) at location j in direction of digital face (one
direction)
N = Crash data analysis period (in years) = 5
VMTj,total = Total vehicle miles traveled in direction of digital face (one direction) at location j
= (VMT in 2008 + VMT in 2009 + VMT in 2010 + VMT in 2011 + VMT in 2012) of location j
The crash rates have been determined for both the influence (upstream) and non-influence
(downstream) zones of digital billboards. The crashes have been counted based on the direction
of the vehicles approaching the digital face of the billboard (upstream) and the vehicles passed
the digital face (downstream).
So the combined VMT (of 5 years) has been used to calculate average annual crash rates in each
location. The number of crashes at each year for a particular location was small and therefore
total number of crashes for five years was used in determination of the crash rate.
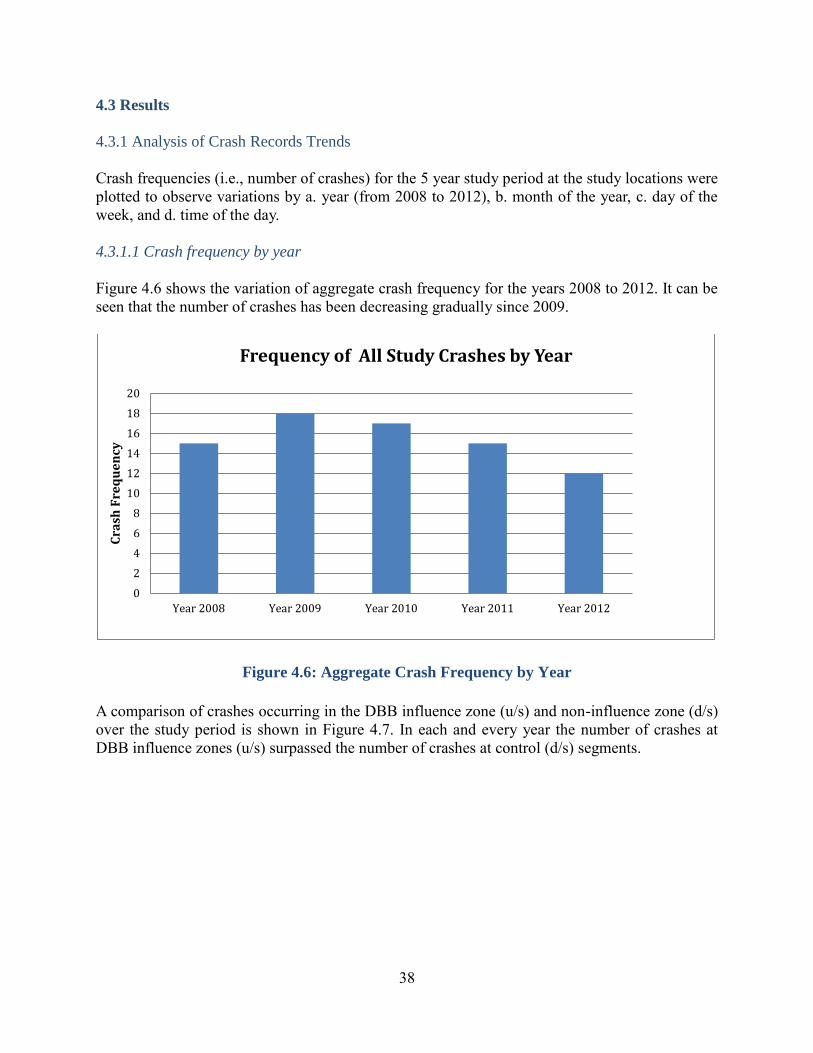
38
4.3 Results
4.3.1 Analysis of Crash Records Trends
Crash frequencies (i.e., number of crashes) for the 5 year study period at the study locations were
plotted to observe variations by a. year (from 2008 to 2012), b. month of the year, c. day of the
week, and d. time of the day.
4.3.1.1 Crash frequency by year
Figure 4.6 shows the variation of aggregate crash frequency for the years 2008 to 2012. It can be
seen that the number of crashes has been decreasing gradually since 2009.
Figure 4.6: Aggregate Crash Frequency by Year
A comparison of crashes occurring in the DBB influence zone (u/s) and non-influence zone (d/s)
over the study period is shown in Figure 4.7. In each and every year the number of crashes at
DBB influence zones (u/s) surpassed the number of crashes at control (d/s) segments.
0
2
4
6
8
10
12
14
16
18
20
Year 2008 Year 2009 Year 2010 Year 2011 Year 2012
Cra
sh F
req
ue
ncy
Frequency of All Study Crashes by Year
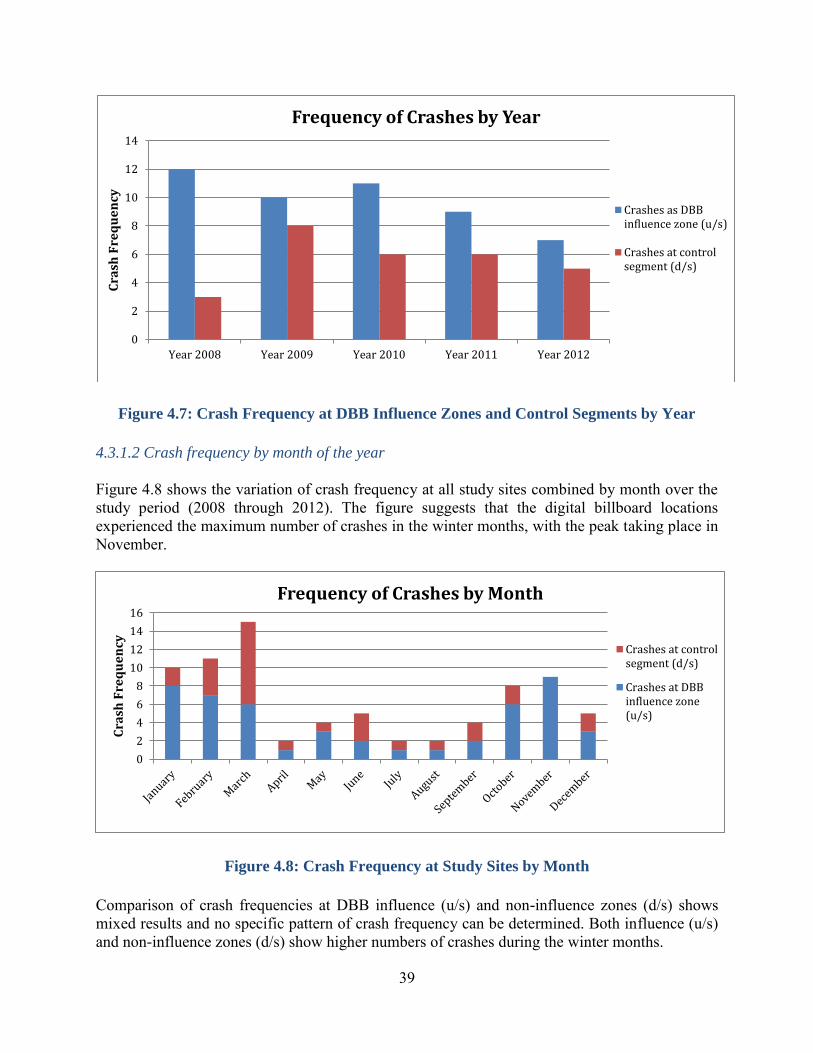
39
Figure 4.7: Crash Frequency at DBB Influence Zones and Control Segments by Year
4.3.1.2 Crash frequency by month of the year
Figure 4.8 shows the variation of crash frequency at all study sites combined by month over the
study period (2008 through 2012). The figure suggests that the digital billboard locations
experienced the maximum number of crashes in the winter months, with the peak taking place in
November.
Figure 4.8: Crash Frequency at Study Sites by Month
Comparison of crash frequencies at DBB influence (u/s) and non-influence zones (d/s) shows
mixed results and no specific pattern of crash frequency can be determined. Both influence (u/s)
and non-influence zones (d/s) show higher numbers of crashes during the winter months.
0
2
4
6
8
10
12
14
Year 2008 Year 2009 Year 2010 Year 2011 Year 2012
Cra
sh F
req
ue
ncy
Frequency of Crashes by Year
Crashes as DBBinfluence zone (u/s)
Crashes at controlsegment (d/s)
0
2
4
6
8
10
12
14
16
Cra
sh F
req
ue
ncy
Frequency of Crashes by Month
Crashes at controlsegment (d/s)
Crashes at DBBinfluence zone(u/s)
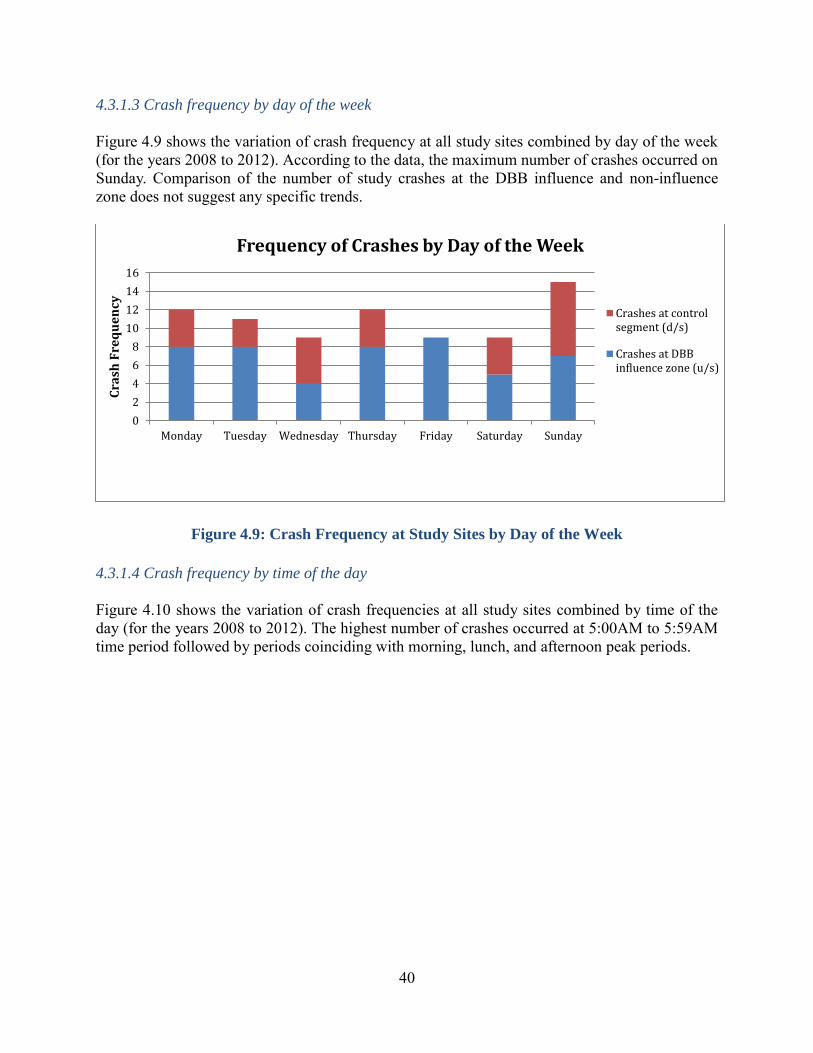
40
4.3.1.3 Crash frequency by day of the week
Figure 4.9 shows the variation of crash frequency at all study sites combined by day of the week
(for the years 2008 to 2012). According to the data, the maximum number of crashes occurred on
Sunday. Comparison of the number of study crashes at the DBB influence and non-influence
zone does not suggest any specific trends.
Figure 4.9: Crash Frequency at Study Sites by Day of the Week
4.3.1.4 Crash frequency by time of the day
Figure 4.10 shows the variation of crash frequencies at all study sites combined by time of the
day (for the years 2008 to 2012). The highest number of crashes occurred at 5:00AM to 5:59AM
time period followed by periods coinciding with morning, lunch, and afternoon peak periods.
0
2
4
6
8
10
12
14
16
Monday Tuesday Wednesday Thursday Friday Saturday Sunday
Cra
sh F
req
ue
ncy
Frequency of Crashes by Day of the Week
Crashes at controlsegment (d/s)
Crashes at DBBinfluence zone (u/s)
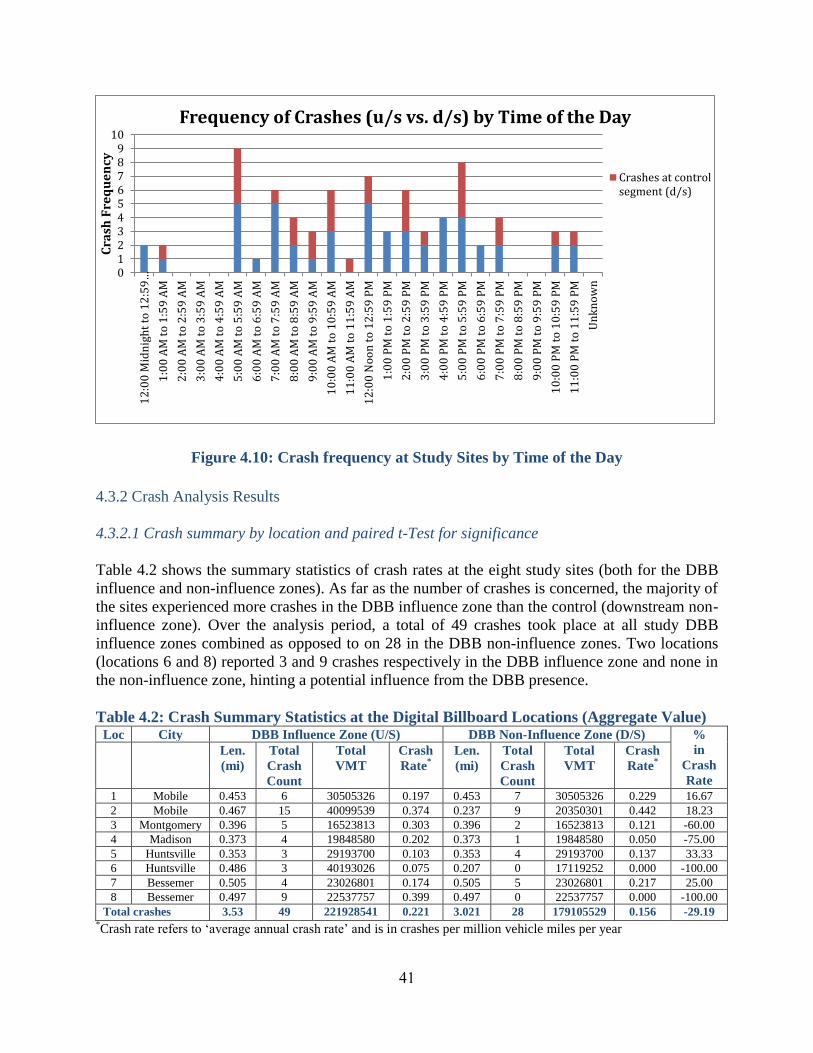
41
Figure 4.10: Crash frequency at Study Sites by Time of the Day
4.3.2 Crash Analysis Results
4.3.2.1 Crash summary by location and paired t-Test for significance
Table 4.2 shows the summary statistics of crash rates at the eight study sites (both for the DBB
influence and non-influence zones). As far as the number of crashes is concerned, the majority of
the sites experienced more crashes in the DBB influence zone than the control (downstream non-
influence zone). Over the analysis period, a total of 49 crashes took place at all study DBB
influence zones combined as opposed to on 28 in the DBB non-influence zones. Two locations
(locations 6 and 8) reported 3 and 9 crashes respectively in the DBB influence zone and none in
the non-influence zone, hinting a potential influence from the DBB presence.
Table 4.2: Crash Summary Statistics at the Digital Billboard Locations (Aggregate Value) Loc City DBB Influence Zone (U/S) DBB Non-Influence Zone (D/S) %
in
Crash
Rate
Len.
(mi)
Total
Crash
Count
Total
VMT
Crash
Rate*
Len.
(mi)
Total
Crash
Count
Total
VMT
Crash
Rate*
1 Mobile 0.453 6 30505326 0.197 0.453 7 30505326 0.229 16.67
2 Mobile 0.467 15 40099539 0.374 0.237 9 20350301 0.442 18.23
3 Montgomery 0.396 5 16523813 0.303 0.396 2 16523813 0.121 -60.00
4 Madison 0.373 4 19848580 0.202 0.373 1 19848580 0.050 -75.00
5 Huntsville 0.353 3 29193700 0.103 0.353 4 29193700 0.137 33.33
6 Huntsville 0.486 3 40193026 0.075 0.207 0 17119252 0.000 -100.00
7 Bessemer 0.505 4 23026801 0.174 0.505 5 23026801 0.217 25.00
8 Bessemer 0.497 9 22537757 0.399 0.497 0 22537757 0.000 -100.00
Total crashes 3.53 49 221928541 0.221 3.021 28 179105529 0.156 -29.19 *Crash rate refers to ‘average annual crash rate’ and is in crashes per million vehicle miles per year
0123456789
101
2:0
0 M
idn
igh
t to
12
:59
…
1:0
0 A
M t
o 1
:59
AM
2:0
0 A
M t
o 2
:59
AM
3:0
0 A
M t
o 3
:59
AM
4:0
0 A
M t
o 4
:59
AM
5:0
0 A
M t
o 5
:59
AM
6:0
0 A
M t
o 6
:59
AM
7:0
0 A
M t
o 7
:59
AM
8:0
0 A
M t
o 8
:59
AM
9:0
0 A
M t
o 9
:59
AM
10
:00
AM
to
10
:59
AM
11
:00
AM
to
11
:59
AM
12
:00
No
on
to
12
:59
PM
1:0
0 P
M t
o 1
:59
PM
2:0
0 P
M t
o 2
:59
PM
3:0
0 P
M t
o 3
:59
PM
4:0
0 P
M t
o 4
:59
PM
5:0
0 P
M t
o 5
:59
PM
6:0
0 P
M t
o 6
:59
PM
7:0
0 P
M t
o 7
:59
PM
8:0
0 P
M t
o 8
:59
PM
9:0
0 P
M t
o 9
:59
PM
10
:00
PM
to
10
:59
PM
11
:00
PM
to
11
:59
PM
Un
kn
ow
n
Cra
sh F
req
ue
ncy
Frequency of Crashes (u/s vs. d/s) by Time of the Day
Crashes at controlsegment (d/s)
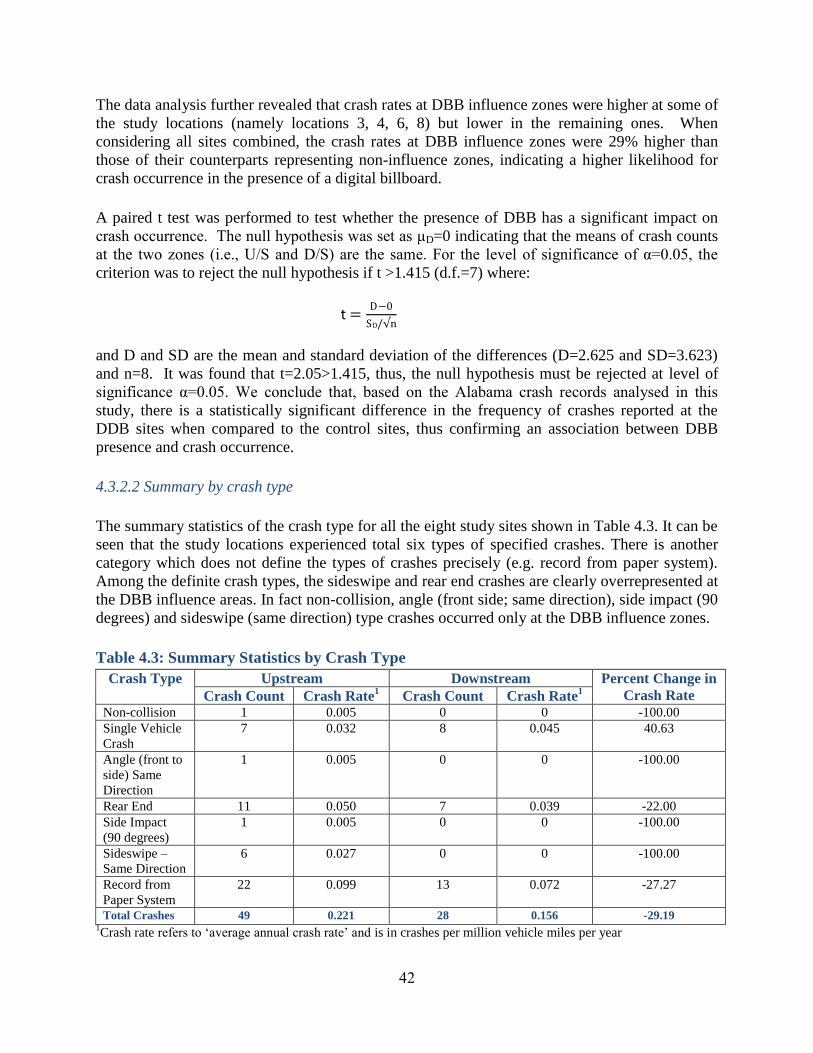
42
The data analysis further revealed that crash rates at DBB influence zones were higher at some of
the study locations (namely locations 3, 4, 6, 8) but lower in the remaining ones. When
considering all sites combined, the crash rates at DBB influence zones were 29% higher than
those of their counterparts representing non-influence zones, indicating a higher likelihood for
crash occurrence in the presence of a digital billboard.
A paired t test was performed to test whether the presence of DBB has a significant impact on
crash occurrence. The null hypothesis was set as μD=0 indicating that the means of crash counts
at the two zones (i.e., U/S and D/S) are the same. For the level of significance of α=0.05, the
criterion was to reject the null hypothesis if t >1.415 (d.f.=7) where:
t =D−0
SD/√n
and D and SD are the mean and standard deviation of the differences (D=2.625 and SD=3.623)
and n=8. It was found that t=2.05>1.415, thus, the null hypothesis must be rejected at level of
significance α=0.05. We conclude that, based on the Alabama crash records analysed in this
study, there is a statistically significant difference in the frequency of crashes reported at the
DDB sites when compared to the control sites, thus confirming an association between DBB
presence and crash occurrence.
4.3.2.2 Summary by crash type
The summary statistics of the crash type for all the eight study sites shown in Table 4.3. It can be
seen that the study locations experienced total six types of specified crashes. There is another
category which does not define the types of crashes precisely (e.g. record from paper system).
Among the definite crash types, the sideswipe and rear end crashes are clearly overrepresented at
the DBB influence areas. In fact non-collision, angle (front side; same direction), side impact (90
degrees) and sideswipe (same direction) type crashes occurred only at the DBB influence zones.
Table 4.3: Summary Statistics by Crash Type
Crash Type Upstream Downstream Percent Change in
Crash Rate Crash Count Crash Rate1
Crash Count Crash Rate1
Non-collision 1 0.005 0 0 -100.00
Single Vehicle
Crash
7 0.032 8 0.045 40.63
Angle (front to
side) Same
Direction
1 0.005 0 0 -100.00
Rear End 11 0.050 7 0.039 -22.00
Side Impact
(90 degrees)
1 0.005 0 0 -100.00
Sideswipe –
Same Direction
6 0.027 0 0 -100.00
Record from
Paper System
22 0.099 13 0.072 -27.27
Total Crashes 49 0.221 28 0.156 -29.19 1Crash rate refers to ‘average annual crash rate’ and is in crashes per million vehicle miles per year
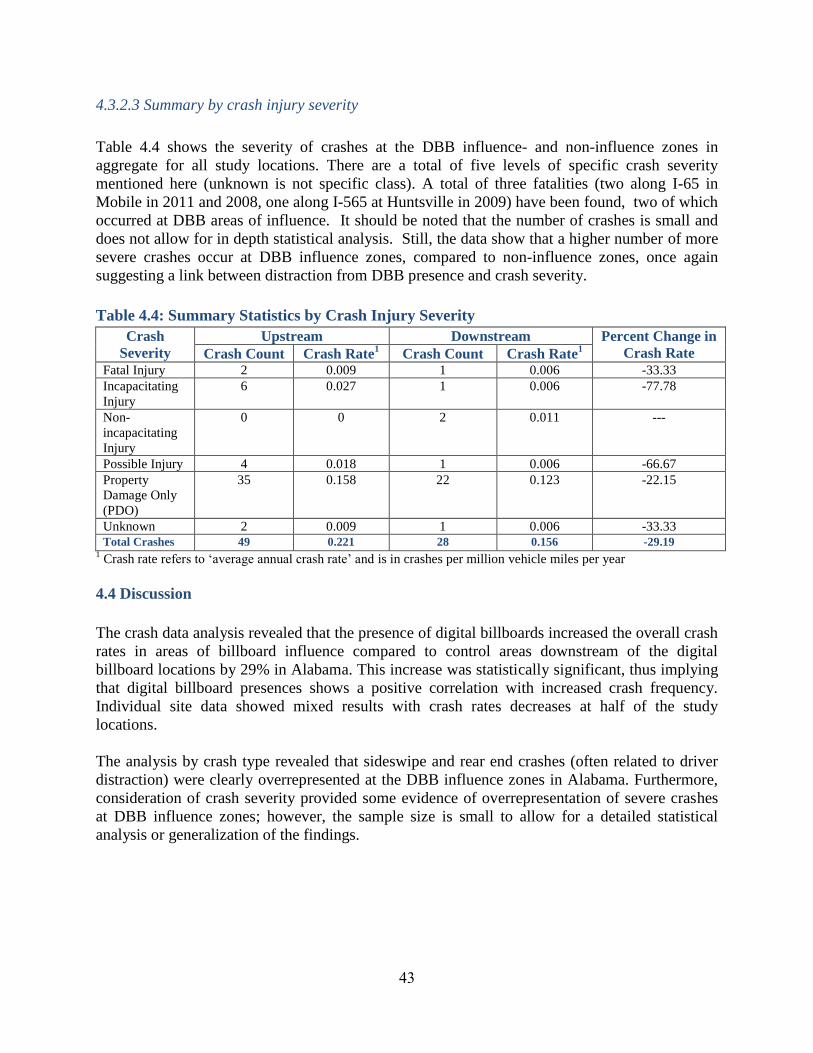
43
4.3.2.3 Summary by crash injury severity
Table 4.4 shows the severity of crashes at the DBB influence- and non-influence zones in
aggregate for all study locations. There are a total of five levels of specific crash severity
mentioned here (unknown is not specific class). A total of three fatalities (two along I-65 in
Mobile in 2011 and 2008, one along I-565 at Huntsville in 2009) have been found, two of which
occurred at DBB areas of influence. It should be noted that the number of crashes is small and
does not allow for in depth statistical analysis. Still, the data show that a higher number of more
severe crashes occur at DBB influence zones, compared to non-influence zones, once again
suggesting a link between distraction from DBB presence and crash severity.
Table 4.4: Summary Statistics by Crash Injury Severity
Crash
Severity
Upstream Downstream Percent Change in
Crash Rate Crash Count Crash Rate1
Crash Count Crash Rate1
Fatal Injury 2 0.009 1 0.006 -33.33
Incapacitating
Injury
6 0.027 1 0.006 -77.78
Non-
incapacitating
Injury
0 0 2 0.011 ---
Possible Injury 4 0.018 1 0.006 -66.67
Property
Damage Only
(PDO)
35 0.158 22 0.123 -22.15
Unknown 2 0.009 1 0.006 -33.33
Total Crashes 49 0.221 28 0.156 -29.19 1 Crash rate refers to ‘average annual crash rate’ and is in crashes per million vehicle miles per year
4.4 Discussion
The crash data analysis revealed that the presence of digital billboards increased the overall crash
rates in areas of billboard influence compared to control areas downstream of the digital
billboard locations by 29% in Alabama. This increase was statistically significant, thus implying
that digital billboard presences shows a positive correlation with increased crash frequency.
Individual site data showed mixed results with crash rates decreases at half of the study
locations.
The analysis by crash type revealed that sideswipe and rear end crashes (often related to driver
distraction) were clearly overrepresented at the DBB influence zones in Alabama. Furthermore,
consideration of crash severity provided some evidence of overrepresentation of severe crashes
at DBB influence zones; however, the sample size is small to allow for a detailed statistical
analysis or generalization of the findings.
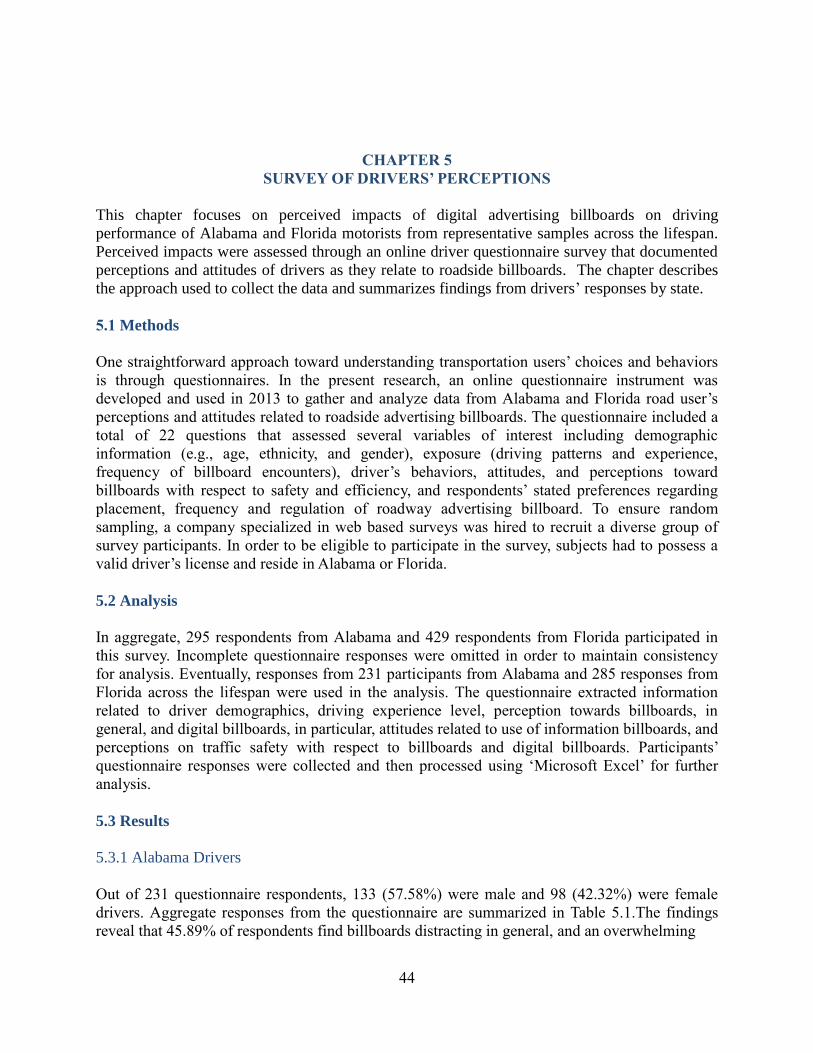
44
CHAPTER 5
SURVEY OF DRIVERS’ PERCEPTIONS
This chapter focuses on perceived impacts of digital advertising billboards on driving
performance of Alabama and Florida motorists from representative samples across the lifespan.
Perceived impacts were assessed through an online driver questionnaire survey that documented
perceptions and attitudes of drivers as they relate to roadside billboards. The chapter describes
the approach used to collect the data and summarizes findings from drivers’ responses by state.
5.1 Methods
One straightforward approach toward understanding transportation users’ choices and behaviors
is through questionnaires. In the present research, an online questionnaire instrument was
developed and used in 2013 to gather and analyze data from Alabama and Florida road user’s
perceptions and attitudes related to roadside advertising billboards. The questionnaire included a
total of 22 questions that assessed several variables of interest including demographic
information (e.g., age, ethnicity, and gender), exposure (driving patterns and experience,
frequency of billboard encounters), driver’s behaviors, attitudes, and perceptions toward
billboards with respect to safety and efficiency, and respondents’ stated preferences regarding
placement, frequency and regulation of roadway advertising billboard. To ensure random
sampling, a company specialized in web based surveys was hired to recruit a diverse group of
survey participants. In order to be eligible to participate in the survey, subjects had to possess a
valid driver’s license and reside in Alabama or Florida.
5.2 Analysis
In aggregate, 295 respondents from Alabama and 429 respondents from Florida participated in
this survey. Incomplete questionnaire responses were omitted in order to maintain consistency
for analysis. Eventually, responses from 231 participants from Alabama and 285 responses from
Florida across the lifespan were used in the analysis. The questionnaire extracted information
related to driver demographics, driving experience level, perception towards billboards, in
general, and digital billboards, in particular, attitudes related to use of information billboards, and
perceptions on traffic safety with respect to billboards and digital billboards. Participants’
questionnaire responses were collected and then processed using ‘Microsoft Excel’ for further
analysis.
5.3 Results
5.3.1 Alabama Drivers
Out of 231 questionnaire respondents, 133 (57.58%) were male and 98 (42.32%) were female
drivers. Aggregate responses from the questionnaire are summarized in Table 5.1.The findings
reveal that 45.89% of respondents find billboards distracting in general, and an overwhelming
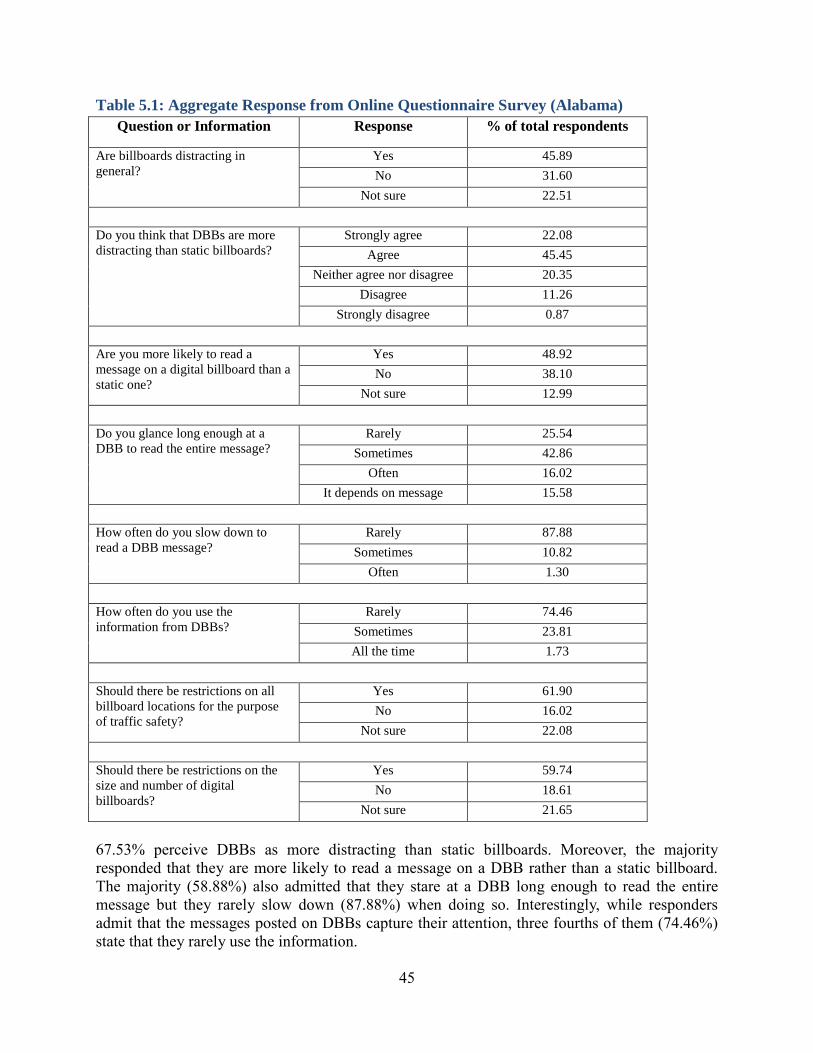
45
Table 5.1: Aggregate Response from Online Questionnaire Survey (Alabama)
Question or Information Response % of total respondents
Are billboards distracting in
general?
Yes 45.89
No 31.60
Not sure 22.51
Do you think that DBBs are more
distracting than static billboards?
Strongly agree 22.08
Agree 45.45
Neither agree nor disagree 20.35
Disagree 11.26
Strongly disagree 0.87
Are you more likely to read a
message on a digital billboard than a
static one?
Yes 48.92
No 38.10
Not sure 12.99
Do you glance long enough at a
DBB to read the entire message?
Rarely 25.54
Sometimes 42.86
Often 16.02
It depends on message 15.58
How often do you slow down to
read a DBB message?
Rarely 87.88
Sometimes 10.82
Often 1.30
How often do you use the
information from DBBs?
Rarely 74.46
Sometimes 23.81
All the time 1.73
Should there be restrictions on all
billboard locations for the purpose
of traffic safety?
Yes 61.90
No 16.02
Not sure 22.08
Should there be restrictions on the
size and number of digital
billboards?
Yes 59.74
No 18.61
Not sure 21.65
67.53% perceive DBBs as more distracting than static billboards. Moreover, the majority
responded that they are more likely to read a message on a DBB rather than a static billboard.
The majority (58.88%) also admitted that they stare at a DBB long enough to read the entire
message but they rarely slow down (87.88%) when doing so. Interestingly, while responders
admit that the messages posted on DBBs capture their attention, three fourths of them (74.46%)
state that they rarely use the information.
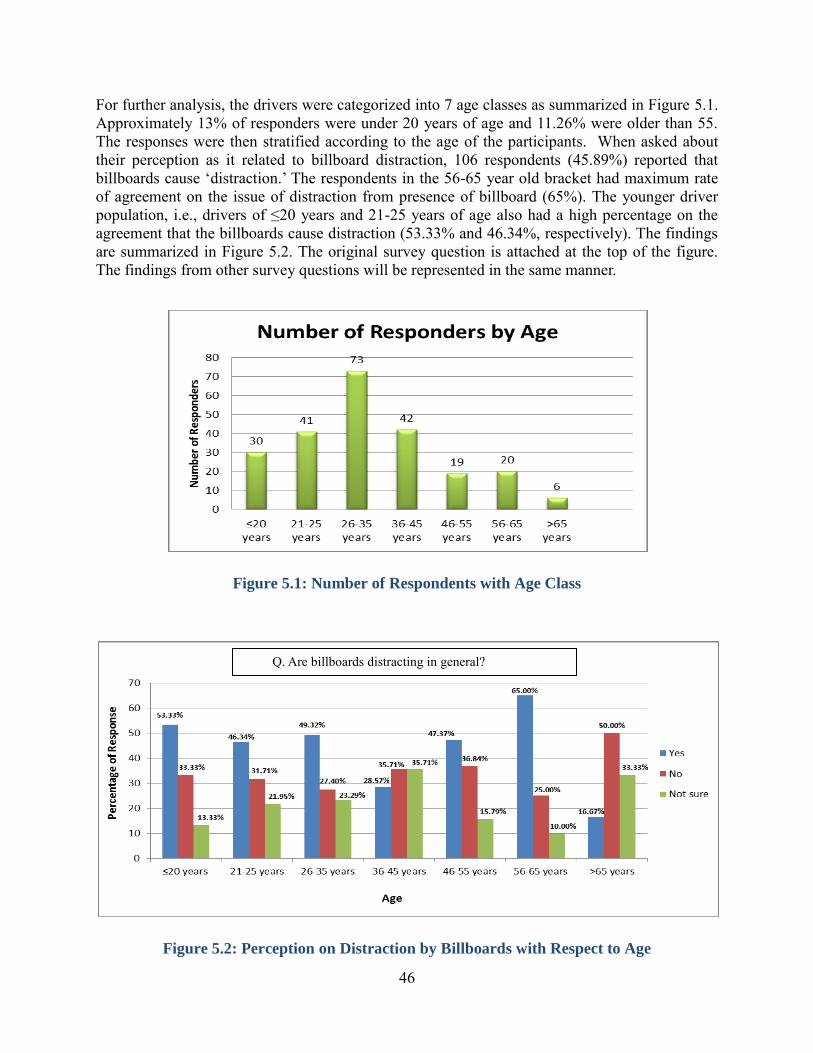
46
For further analysis, the drivers were categorized into 7 age classes as summarized in Figure 5.1.
Approximately 13% of responders were under 20 years of age and 11.26% were older than 55.
The responses were then stratified according to the age of the participants. When asked about
their perception as it related to billboard distraction, 106 respondents (45.89%) reported that
billboards cause ‘distraction.’ The respondents in the 56-65 year old bracket had maximum rate
of agreement on the issue of distraction from presence of billboard (65%). The younger driver
population, i.e., drivers of ≤20 years and 21-25 years of age also had a high percentage on the
agreement that the billboards cause distraction (53.33% and 46.34%, respectively). The findings
are summarized in Figure 5.2. The original survey question is attached at the top of the figure.
The findings from other survey questions will be represented in the same manner.
Figure 5.1: Number of Respondents with Age Class
Figure 5.2: Perception on Distraction by Billboards with Respect to Age
Q. Are billboards distracting in general?
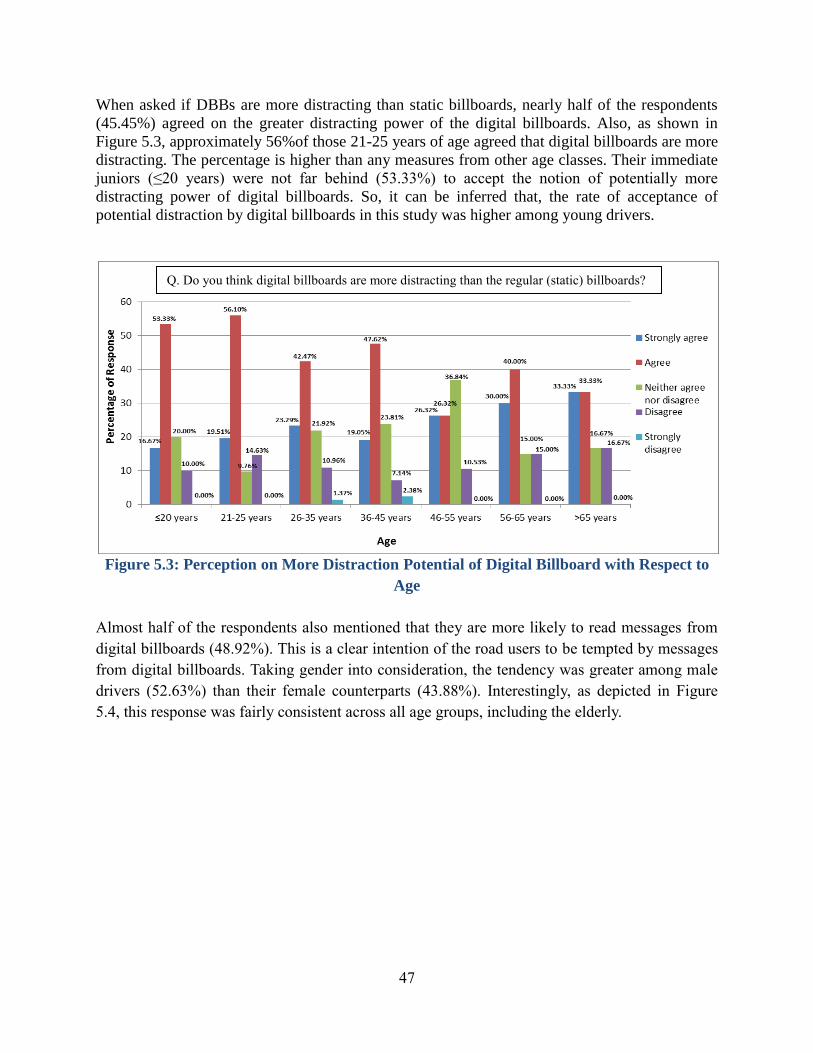
47
When asked if DBBs are more distracting than static billboards, nearly half of the respondents
(45.45%) agreed on the greater distracting power of the digital billboards. Also, as shown in
Figure 5.3, approximately 56%of those 21-25 years of age agreed that digital billboards are more
distracting. The percentage is higher than any measures from other age classes. Their immediate
juniors (≤20 years) were not far behind (53.33%) to accept the notion of potentially more
distracting power of digital billboards. So, it can be inferred that, the rate of acceptance of
potential distraction by digital billboards in this study was higher among young drivers.
Figure 5.3: Perception on More Distraction Potential of Digital Billboard with Respect to
Age
Almost half of the respondents also mentioned that they are more likely to read messages from
digital billboards (48.92%). This is a clear intention of the road users to be tempted by messages
from digital billboards. Taking gender into consideration, the tendency was greater among male
drivers (52.63%) than their female counterparts (43.88%). Interestingly, as depicted in Figure
5.4, this response was fairly consistent across all age groups, including the elderly.
Q. Do you think digital billboards are more distracting than the regular (static) billboards?
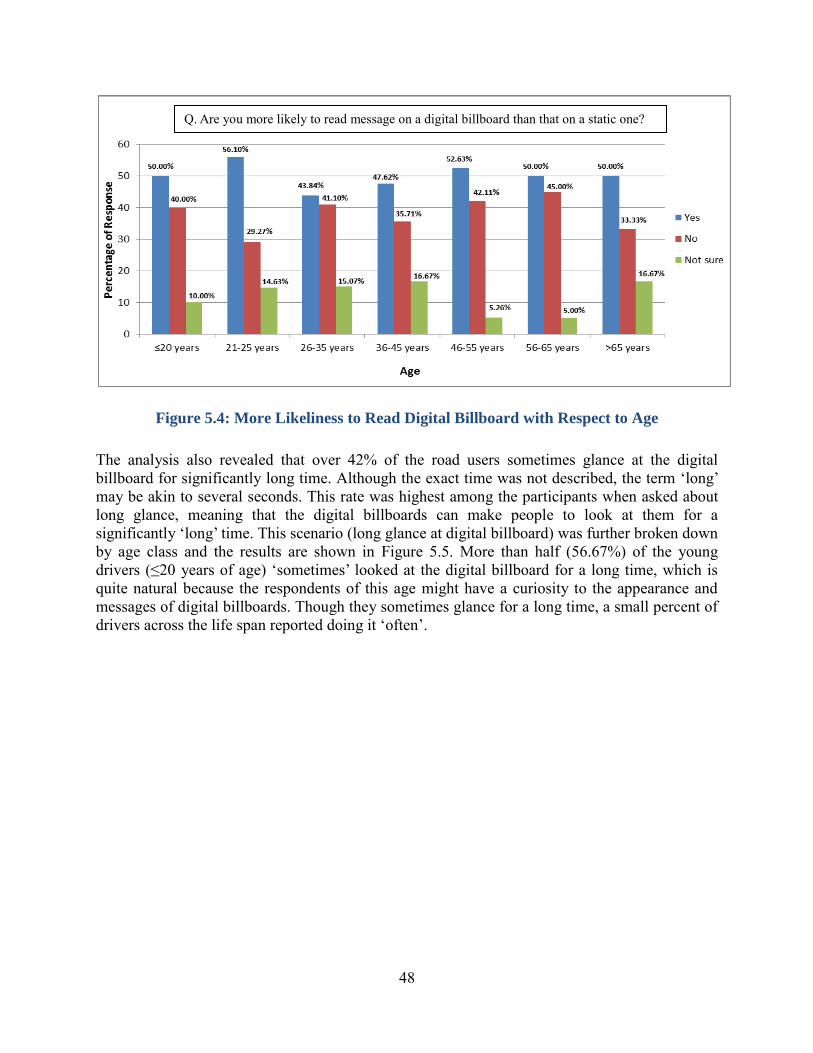
48
Figure 5.4: More Likeliness to Read Digital Billboard with Respect to Age
The analysis also revealed that over 42% of the road users sometimes glance at the digital
billboard for significantly long time. Although the exact time was not described, the term ‘long’
may be akin to several seconds. This rate was highest among the participants when asked about
long glance, meaning that the digital billboards can make people to look at them for a
significantly ‘long’ time. This scenario (long glance at digital billboard) was further broken down
by age class and the results are shown in Figure 5.5. More than half (56.67%) of the young
drivers (≤20 years of age) ‘sometimes’ looked at the digital billboard for a long time, which is
quite natural because the respondents of this age might have a curiosity to the appearance and
messages of digital billboards. Though they sometimes glance for a long time, a small percent of
drivers across the life span reported doing it ‘often’.
Q. Are you more likely to read message on a digital billboard than that on a static one?
49
Figure 5.5: Long Glance at Digital Billboard with Respect to Age
It can be deduced from the analysis of the responses that the overwhelming majority of the
questionnaire participants (87.88%) had a rare tendency to slow down near digital billboards.
Very small percentage of the drivers ‘sometimes’ reduced their speed (10.82%). Figure 5.6 shows
the result of ‘slow down at digital billboard’ scenario based on age. The youngest driver group
(≤20 years) rarely reduced their vehicle speed disregarding the presence of digital billboard.
Figure 5.6: Slow Down to Digital Billboard with Respect to Age
Q. Do you glance long enough at a digital billboard to read the entire message?
Q. How often do you slow down to read a digital billboard message?
50
Interestingly, most of the participants stated that they rarely used information from digital
billboards, and just over one-fifth of them (23.81%) used the information sometimes. The rate
was highest (36.84%) for participants between 46 and 55 years of age. As can be seen in Figure
5.7, the youngest population group and the older population (>65 years) showed almost no
intention to use digital billboard’s information.
Figure 5.7: Use of Information from Digital Billboard with Respect to Age
The survey participants were asked about their perception on the restriction of locations of all
billboards. The result is depicted in figure 5.8.
Figure 5.8: Perception on Restriction on Location of Billboards with Respect to Age
63.33%
53.66%
63.01% 61.90%
47.37%
80.00% 83.33%
30.00%
17.07% 12.33% 14.29%
21.05%
10.00%
0.00%
6.67%
29.27% 24.66% 23.81%
31.58%
10.00% 16.67%
0
10
20
30
40
50
60
70
80
90
≤20 years 21-25 years 26-35 years 36-45 years 46-55 years 56-65 years >65 years
Pe
rce
nta
ge
of
Re
spo
nse
Age
Age vs. Perception on Restrication on Location of Billboards
Yes
No
Not sure
Q. How often do you use information from digital billboards?
Q. Should there be restrictions on all billboard locations for the purpose of traffic safety?
51
The participants were also asked for their opinion on the restriction of size and number of digital
billboards. The result has been shown in Figure 5.9.
Figure 5.9: Perception on Restriction on Size and Number of Digital Billboards with
Respect to Age
The above two questions have produced quite similar response across all the age groups. This is
an interesting finding. Most of the people think that there should be restriction on location of all
billboards and also on the size and number of digital billboards for safety purpose.
Apart from the general analysis of the responses between genders and age groups, chi-square test
has been performed across age groups and gender separately. The observed values for the chi-
square test have been found from the survey itself and the expected values have been determined.
The result of this test has been presented in Tables 5.2 and 5.3.
The probability or p-values from Table 5.2 (in all cases greater than significance level 0.05)
suggest that there is no significant difference among responses across different age groups of
drivers when asked for their perceptions (e.g. if billboards are distracting) and/or intended
actions (e.g. slow down before digital billboard to read entire message) to specific survey
questions. Similarly From Table 5.3 it can be implied that, there is no significant differences
between the responses of male and female drivers.
66.67%
46.34%
64.38%
57.14% 52.63%
75.00%
50.00%
26.67% 24.39%
13.70% 16.67%
21.05%
10.00%
33.33%
6.67%
29.27%
21.92% 26.19% 26.32%
15.00% 16.67%
0
10
20
30
40
50
60
70
80
≤20 years 21-25 years 26-35 years 36-45 years 46-55 years 56-65 years >65 years
Pe
rce
nta
ge
of
Re
spo
nse
Age
Age vs. Perception on Restriction on Size & Number of DBBs
Yes
No
Not sure
Q. Should there be restrictions on the size and number of digital billboards for traffic safety?
52
Table 5.2: Chi-square Test Result for Age Groups (Alabama Drivers)
Notion/Information/Query Degrees of
freedom (DF)
Chi-squire (χ2)
* Probability
greater than
Chi-squire
(P>χ2)
Are billboards distracting in
general?
14 15.134 0.3691
Do you think that DBBs are more
distracting than static billboards?
28 16.886 0.9508
Are you more likely to read a
message on a digital billboard
than a static one?
14 6.882 0.9392
Do you glance long enough at a
DBB to read the entire message?
21 18.591 0.6114
How often do you slow down to
read a DBB message?
14 13.018 0.5251
How often do you use the
information from DBBs?
14 15.309 0.3574
Should there be restrictions on all
billboard locations for the purpose
of traffic safety?
14 16.396 0.2898
Should there be restrictions on the
size and number of digital
billboards
14 17.101 0.2508
*Chi-square value derived from Pearson Chi-square test
Table 5.3: Chi-square test Result for Male and Female (Alabama Drivers)
Notion/Information/Query Degrees of
freedom (DF)
Chi-squire (χ2)
* Probability
greater than
Chi-squire
(P>χ2)
Are billboards distracting in
general?
2 0.883 0.6431
Do you think that DBBs are more
distracting than static billboards?
4 2.409 0.6610
Are you more likely to read a
message on a digital billboard
than a static one?
2 2.450 0.2938
Do you glance long enough at a
DBB to read the entire message?
3 3.348 0.3410
How often do you slow down to
read a DBB message?
2 0.782 0.6763
How often do you use the
information from DBBs?
2 2.154 0.3405
Should there be restrictions on all
billboard locations for the purpose
of traffic safety?
2 4.763 0.0924
Should there be restrictions on the
size and number of digital
billboards
2 3.232 0.1987
*Chi-square values derived from Pearson Chi-square test
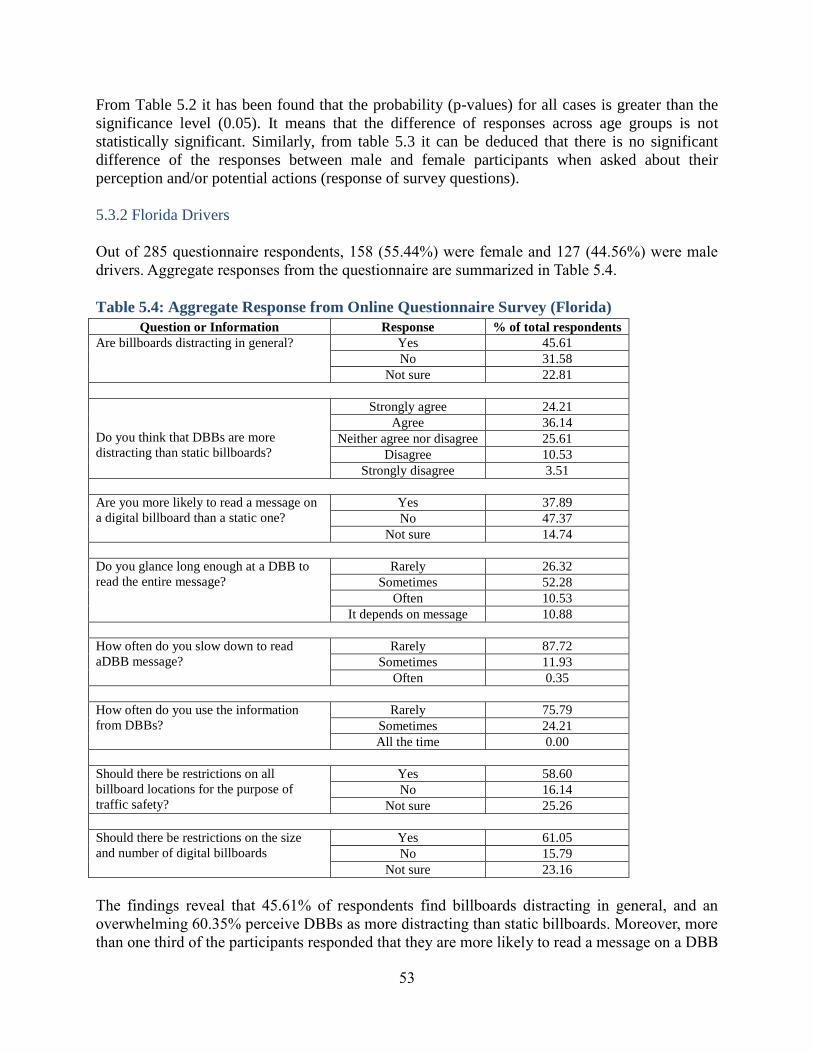
53
From Table 5.2 it has been found that the probability (p-values) for all cases is greater than the
significance level (0.05). It means that the difference of responses across age groups is not
statistically significant. Similarly, from table 5.3 it can be deduced that there is no significant
difference of the responses between male and female participants when asked about their
perception and/or potential actions (response of survey questions).
5.3.2 Florida Drivers
Out of 285 questionnaire respondents, 158 (55.44%) were female and 127 (44.56%) were male
drivers. Aggregate responses from the questionnaire are summarized in Table 5.4.
Table 5.4: Aggregate Response from Online Questionnaire Survey (Florida)
Question or Information Response % of total respondents
Are billboards distracting in general? Yes 45.61
No 31.58
Not sure 22.81
Do you think that DBBs are more
distracting than static billboards?
Strongly agree 24.21
Agree 36.14
Neither agree nor disagree 25.61
Disagree 10.53
Strongly disagree 3.51
Are you more likely to read a message on
a digital billboard than a static one?
Yes 37.89
No 47.37
Not sure 14.74
Do you glance long enough at a DBB to
read the entire message?
Rarely 26.32
Sometimes 52.28
Often 10.53
It depends on message 10.88
How often do you slow down to read
aDBB message?
Rarely 87.72
Sometimes 11.93
Often 0.35
How often do you use the information
from DBBs?
Rarely 75.79
Sometimes 24.21
All the time 0.00
Should there be restrictions on all
billboard locations for the purpose of
traffic safety?
Yes 58.60
No 16.14
Not sure 25.26
Should there be restrictions on the size
and number of digital billboards
Yes 61.05
No 15.79
Not sure 23.16
The findings reveal that 45.61% of respondents find billboards distracting in general, and an
overwhelming 60.35% perceive DBBs as more distracting than static billboards. Moreover, more
than one third of the participants responded that they are more likely to read a message on a DBB
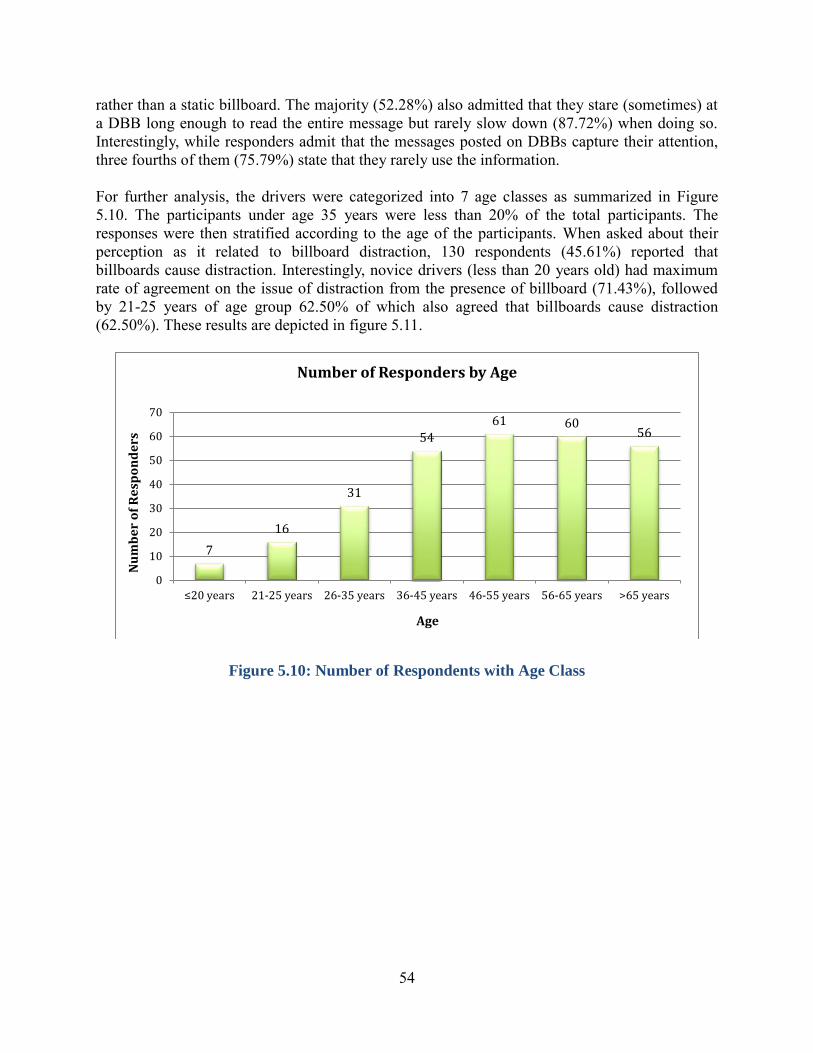
54
rather than a static billboard. The majority (52.28%) also admitted that they stare (sometimes) at
a DBB long enough to read the entire message but rarely slow down (87.72%) when doing so.
Interestingly, while responders admit that the messages posted on DBBs capture their attention,
three fourths of them (75.79%) state that they rarely use the information.
For further analysis, the drivers were categorized into 7 age classes as summarized in Figure
5.10. The participants under age 35 years were less than 20% of the total participants. The
responses were then stratified according to the age of the participants. When asked about their
perception as it related to billboard distraction, 130 respondents (45.61%) reported that
billboards cause distraction. Interestingly, novice drivers (less than 20 years old) had maximum
rate of agreement on the issue of distraction from the presence of billboard (71.43%), followed
by 21-25 years of age group 62.50% of which also agreed that billboards cause distraction
(62.50%). These results are depicted in figure 5.11.
Figure 5.10: Number of Respondents with Age Class
7
16
31
54
61 60 56
0
10
20
30
40
50
60
70
≤20 years 21-25 years 26-35 years 36-45 years 46-55 years 56-65 years >65 years
Nu
mb
er
of
Re
spo
nd
ers
Age
Number of Responders by Age
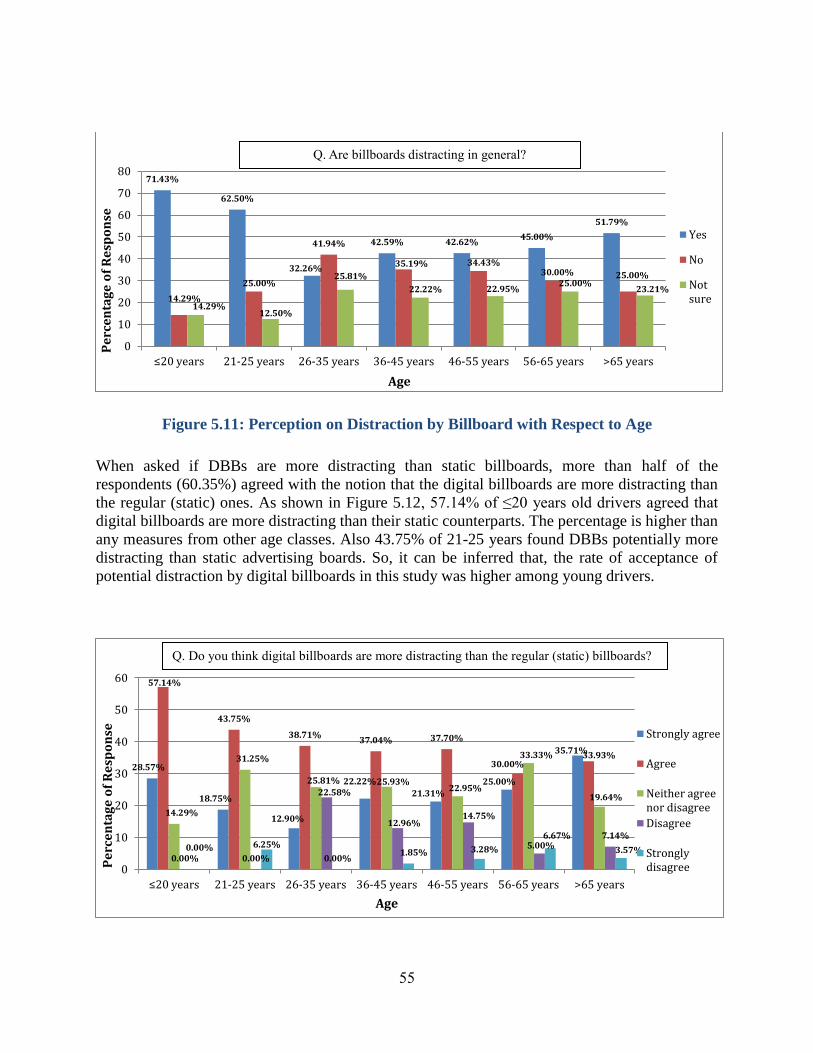
55
Figure 5.11: Perception on Distraction by Billboard with Respect to Age
When asked if DBBs are more distracting than static billboards, more than half of the
respondents (60.35%) agreed with the notion that the digital billboards are more distracting than
the regular (static) ones. As shown in Figure 5.12, 57.14% of ≤20 years old drivers agreed that
digital billboards are more distracting than their static counterparts. The percentage is higher than
any measures from other age classes. Also 43.75% of 21-25 years found DBBs potentially more
distracting than static advertising boards. So, it can be inferred that, the rate of acceptance of
potential distraction by digital billboards in this study was higher among young drivers.
71.43%
62.50%
32.26%
42.59% 42.62% 45.00%
51.79%
14.29%
25.00%
41.94%
35.19% 34.43% 30.00% 25.00%
14.29% 12.50%
25.81%
22.22% 22.95% 25.00%
23.21%
0
10
20
30
40
50
60
70
80
≤20 years 21-25 years 26-35 years 36-45 years 46-55 years 56-65 years >65 years
Pe
rce
nta
ge
of
Re
spo
nse
Age
Age vs. Perception on Distraction by Billboard
Yes
No
Notsure
28.57%
18.75%
12.90%
22.22%
21.31%
25.00%
35.71%
57.14%
43.75%
38.71% 37.04% 37.70%
30.00% 33.93%
14.29%
31.25%
25.81% 25.93% 22.95%
33.33%
19.64%
0.00% 0.00%
22.58%
12.96% 14.75%
5.00% 7.14%
0.00% 6.25%
0.00% 1.85% 3.28%
6.67%
3.57%
0
10
20
30
40
50
60
≤20 years 21-25 years 26-35 years 36-45 years 46-55 years 56-65 years >65 years
Pe
rce
nta
ge
of
Re
spo
nse
Age
Age vs. Perception on More Distraction of Digital Billboard
Strongly agree
Agree
Neither agreenor disagree
Disagree
Stronglydisagree
Q. Do you think digital billboards are more distracting than the regular (static) billboards?
Q. Are billboards distracting in general?
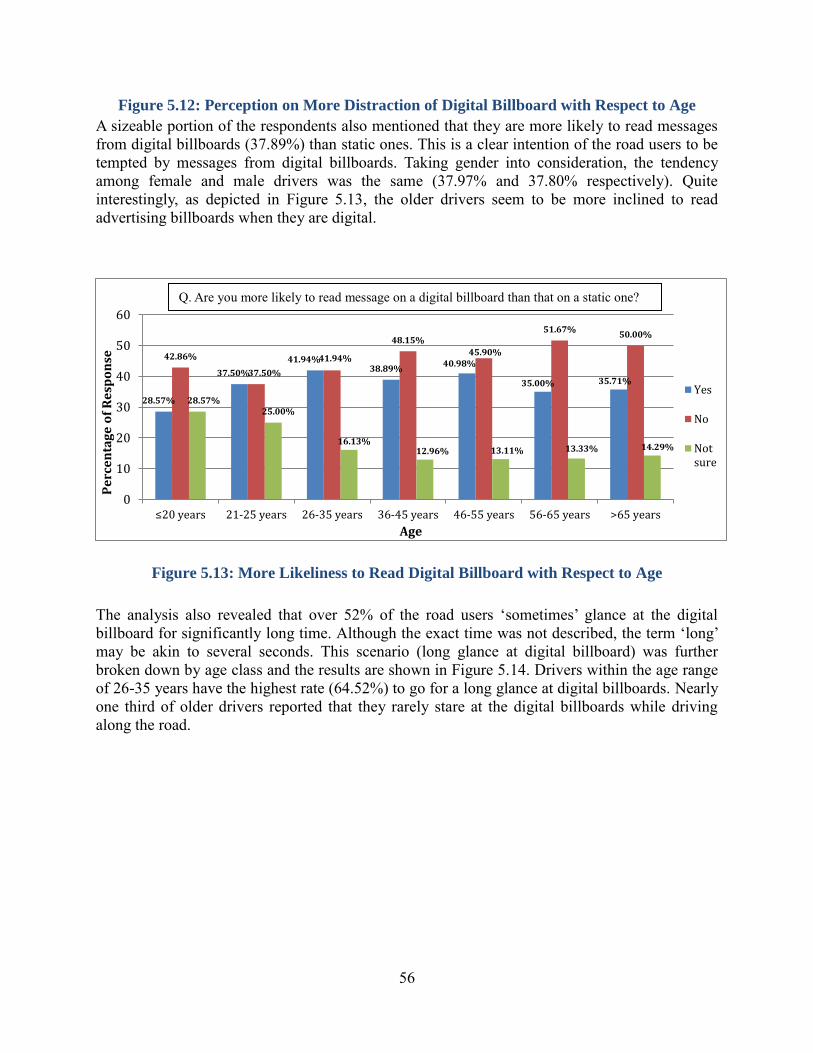
56
Figure 5.12: Perception on More Distraction of Digital Billboard with Respect to Age
A sizeable portion of the respondents also mentioned that they are more likely to read messages
from digital billboards (37.89%) than static ones. This is a clear intention of the road users to be
tempted by messages from digital billboards. Taking gender into consideration, the tendency
among female and male drivers was the same (37.97% and 37.80% respectively). Quite
interestingly, as depicted in Figure 5.13, the older drivers seem to be more inclined to read
advertising billboards when they are digital.
Figure 5.13: More Likeliness to Read Digital Billboard with Respect to Age
The analysis also revealed that over 52% of the road users ‘sometimes’ glance at the digital
billboard for significantly long time. Although the exact time was not described, the term ‘long’
may be akin to several seconds. This scenario (long glance at digital billboard) was further
broken down by age class and the results are shown in Figure 5.14. Drivers within the age range
of 26-35 years have the highest rate (64.52%) to go for a long glance at digital billboards. Nearly
one third of older drivers reported that they rarely stare at the digital billboards while driving
along the road.
28.57%
37.50%
41.94% 38.89%
40.98%
35.00% 35.71%
42.86%
37.50%
41.94%
48.15%
45.90%
51.67% 50.00%
28.57% 25.00%
16.13% 12.96% 13.11% 13.33% 14.29%
0
10
20
30
40
50
60
≤20 years 21-25 years 26-35 years 36-45 years 46-55 years 56-65 years >65 years
Pe
rce
nta
ge
of
Re
spo
nse
Age
Age vs. More Likeliness to Read Digital Billboard
Yes
No
Notsure
Q. Are you more likely to read message on a digital billboard than that on a static one?
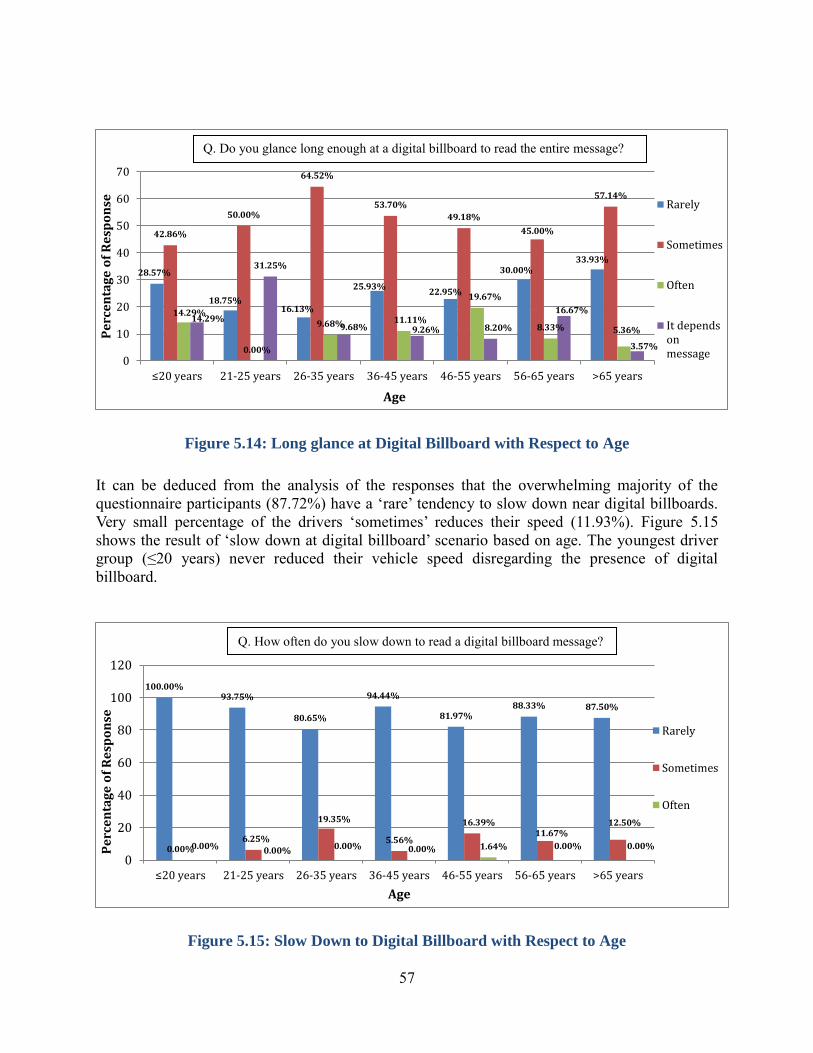
57
Figure 5.14: Long glance at Digital Billboard with Respect to Age
It can be deduced from the analysis of the responses that the overwhelming majority of the
questionnaire participants (87.72%) have a ‘rare’ tendency to slow down near digital billboards.
Very small percentage of the drivers ‘sometimes’ reduces their speed (11.93%). Figure 5.15
shows the result of ‘slow down at digital billboard’ scenario based on age. The youngest driver
group (≤20 years) never reduced their vehicle speed disregarding the presence of digital
billboard.
Figure 5.15: Slow Down to Digital Billboard with Respect to Age
28.57%
18.75% 16.13%
25.93% 22.95%
30.00% 33.93%
42.86%
50.00%
64.52%
53.70%
49.18%
45.00%
57.14%
14.29%
0.00%
9.68% 11.11%
19.67%
8.33% 5.36% 14.29%
31.25%
9.68% 9.26% 8.20%
16.67%
3.57%
0
10
20
30
40
50
60
70
≤20 years 21-25 years 26-35 years 36-45 years 46-55 years 56-65 years >65 years
Pe
rce
nta
ge
of
Re
spo
nse
Age
Age vs. Long Glance at Digital Billboard
Rarely
Sometimes
Often
It dependsonmessage
100.00% 93.75%
80.65%
94.44%
81.97% 88.33% 87.50%
0.00% 6.25%
19.35%
5.56%
16.39% 11.67%
12.50%
0.00% 0.00% 0.00% 0.00% 1.64% 0.00% 0.00%
0
20
40
60
80
100
120
≤20 years 21-25 years 26-35 years 36-45 years 46-55 years 56-65 years >65 years
Pe
rce
nta
ge
of
Re
spo
nse
Age
Age vs. Slow Down to Digital Billboard
Rarely
Sometimes
Often
Q. How often do you slow down to read a digital billboard message?
Q. Do you glance long enough at a digital billboard to read the entire message?
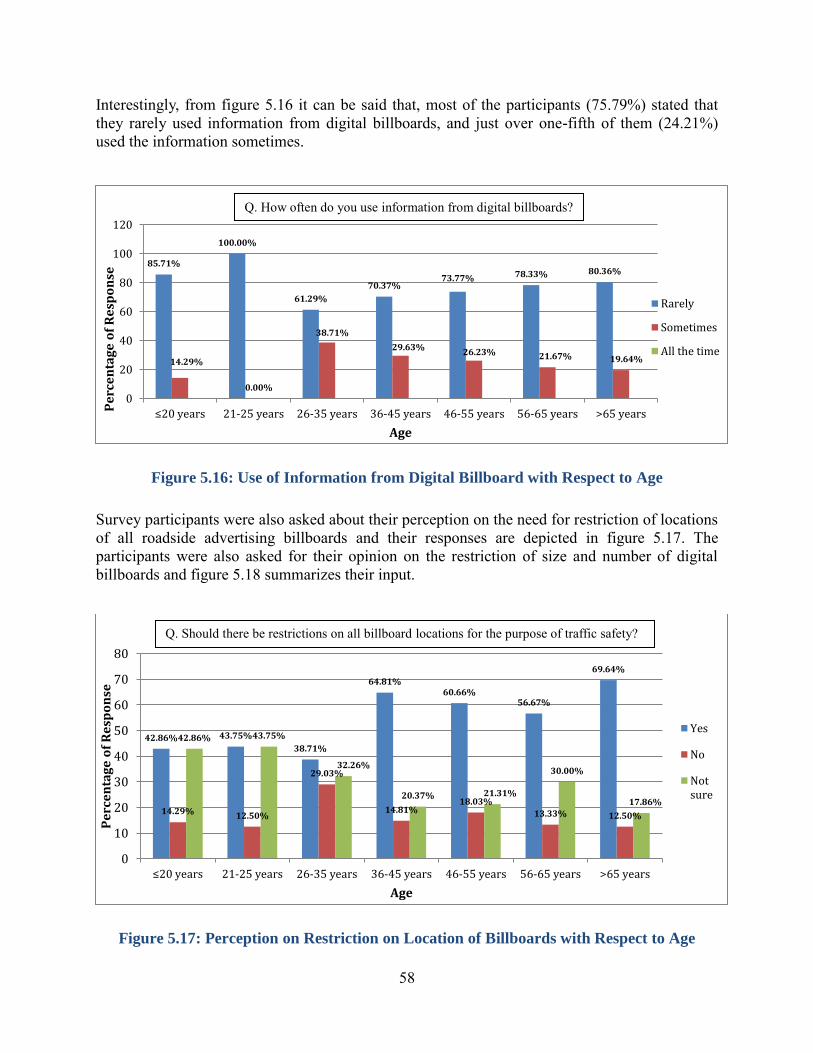
58
Interestingly, from figure 5.16 it can be said that, most of the participants (75.79%) stated that
they rarely used information from digital billboards, and just over one-fifth of them (24.21%)
used the information sometimes.
Figure 5.16: Use of Information from Digital Billboard with Respect to Age
Survey participants were also asked about their perception on the need for restriction of locations
of all roadside advertising billboards and their responses are depicted in figure 5.17. The
participants were also asked for their opinion on the restriction of size and number of digital
billboards and figure 5.18 summarizes their input.
Figure 5.17: Perception on Restriction on Location of Billboards with Respect to Age
85.71%
100.00%
61.29%
70.37% 73.77% 78.33% 80.36%
14.29%
0.00%
38.71%
29.63% 26.23% 21.67% 19.64%
0
20
40
60
80
100
120
≤20 years 21-25 years 26-35 years 36-45 years 46-55 years 56-65 years >65 yearsPe
rce
nta
ge
of
Re
spo
nse
Age
Age vs. Use Info from Digital Billboard
Rarely
Sometimes
All the time
42.86% 43.75%
38.71%
64.81% 60.66%
56.67%
69.64%
14.29% 12.50%
29.03%
14.81% 18.03%
13.33% 12.50%
42.86% 43.75%
32.26%
20.37% 21.31%
30.00%
17.86%
0
10
20
30
40
50
60
70
80
≤20 years 21-25 years 26-35 years 36-45 years 46-55 years 56-65 years >65 years
Pe
rce
nta
ge
of
Re
spo
nse
Age
Age vs. Perception on Restriction on Location of Billboards
Yes
No
Notsure
Q. Should there be restrictions on all billboard locations for the purpose of traffic safety?
Q. How often do you use information from digital billboards?
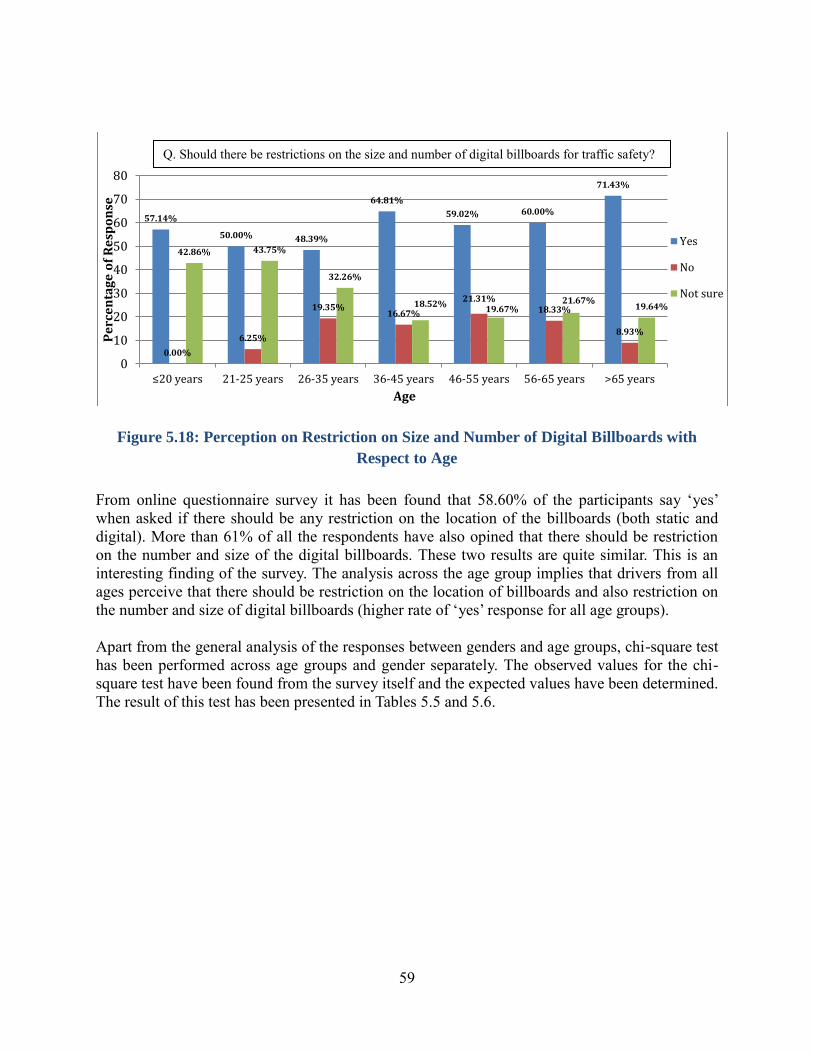
59
Figure 5.18: Perception on Restriction on Size and Number of Digital Billboards with
Respect to Age
From online questionnaire survey it has been found that 58.60% of the participants say ‘yes’
when asked if there should be any restriction on the location of the billboards (both static and
digital). More than 61% of all the respondents have also opined that there should be restriction
on the number and size of the digital billboards. These two results are quite similar. This is an
interesting finding of the survey. The analysis across the age group implies that drivers from all
ages perceive that there should be restriction on the location of billboards and also restriction on
the number and size of digital billboards (higher rate of ‘yes’ response for all age groups).
Apart from the general analysis of the responses between genders and age groups, chi-square test
has been performed across age groups and gender separately. The observed values for the chi-
square test have been found from the survey itself and the expected values have been determined.
The result of this test has been presented in Tables 5.5 and 5.6.
57.14%
50.00% 48.39%
64.81%
59.02% 60.00%
71.43%
0.00%
6.25%
19.35% 16.67%
21.31% 18.33%
8.93%
42.86% 43.75%
32.26%
18.52% 19.67%
21.67% 19.64%
0
10
20
30
40
50
60
70
80
≤20 years 21-25 years 26-35 years 36-45 years 46-55 years 56-65 years >65 years
Pe
rce
nta
ge
of
Re
spo
nse
Age
Age vs. Perception on Restrictio on Size & Number of DBBs
Yes
No
Not sure
Q. Should there be restrictions on the size and number of digital billboards for traffic safety?
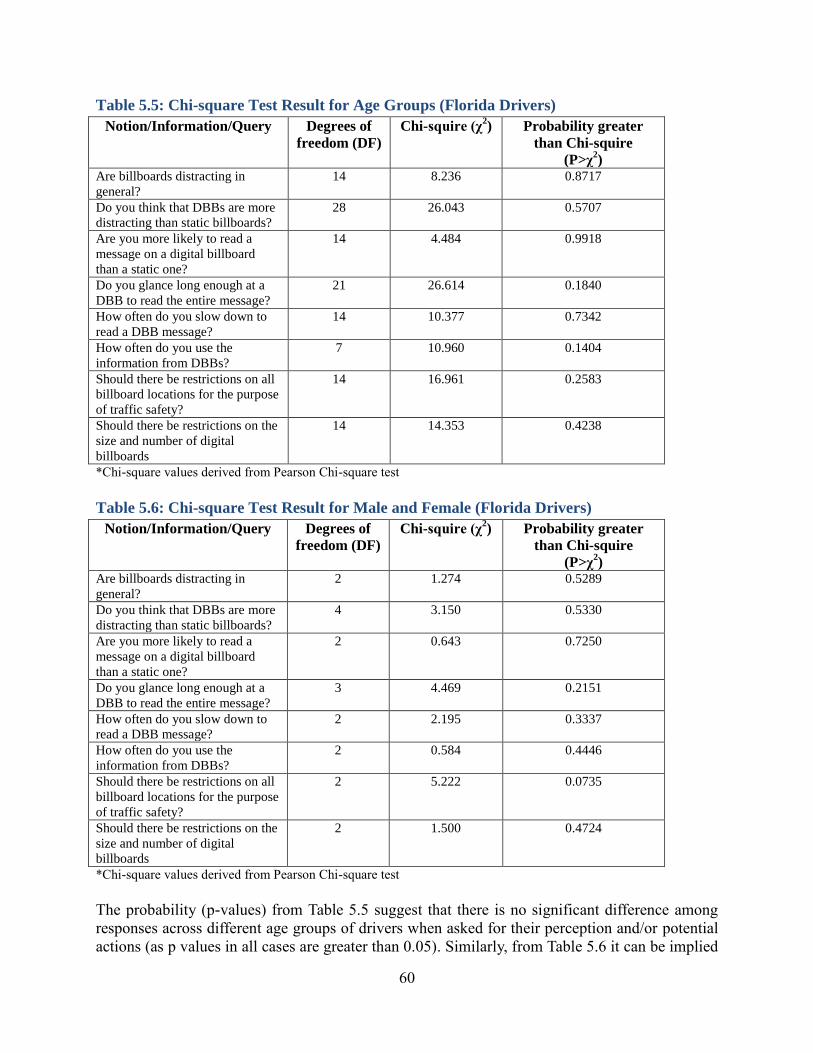
60
Table 5.5: Chi-square Test Result for Age Groups (Florida Drivers)
Notion/Information/Query Degrees of
freedom (DF)
Chi-squire (χ2) Probability greater
than Chi-squire
(P>χ2)
Are billboards distracting in
general?
14 8.236 0.8717
Do you think that DBBs are more
distracting than static billboards?
28 26.043 0.5707
Are you more likely to read a
message on a digital billboard
than a static one?
14 4.484 0.9918
Do you glance long enough at a
DBB to read the entire message?
21 26.614 0.1840
How often do you slow down to
read a DBB message?
14 10.377 0.7342
How often do you use the
information from DBBs?
7 10.960 0.1404
Should there be restrictions on all
billboard locations for the purpose
of traffic safety?
14 16.961 0.2583
Should there be restrictions on the
size and number of digital
billboards
14 14.353 0.4238
*Chi-square values derived from Pearson Chi-square test
Table 5.6: Chi-square Test Result for Male and Female (Florida Drivers)
Notion/Information/Query Degrees of
freedom (DF)
Chi-squire (χ2) Probability greater
than Chi-squire
(P>χ2)
Are billboards distracting in
general?
2 1.274 0.5289
Do you think that DBBs are more
distracting than static billboards?
4 3.150 0.5330
Are you more likely to read a
message on a digital billboard
than a static one?
2 0.643 0.7250
Do you glance long enough at a
DBB to read the entire message?
3 4.469 0.2151
How often do you slow down to
read a DBB message?
2 2.195 0.3337
How often do you use the
information from DBBs?
2 0.584 0.4446
Should there be restrictions on all
billboard locations for the purpose
of traffic safety?
2 5.222 0.0735
Should there be restrictions on the
size and number of digital
billboards
2 1.500 0.4724
*Chi-square values derived from Pearson Chi-square test
The probability (p-values) from Table 5.5 suggest that there is no significant difference among
responses across different age groups of drivers when asked for their perception and/or potential
actions (as p values in all cases are greater than 0.05). Similarly, from Table 5.6 it can be implied
61
that, there is no significant differences between the responses of male and female drivers when
asked for their perception and/or potential actions.
5.4 Discussion
5.4.1 Discussion on Analysis Result of Alabama drivers
The analysis of the driver questionnaire has produced some interesting findings regarding the
perceptions and attitudes of Alabamians with respect to DBBs. Younger drivers (≤20 years and
21-25 years) have a significant agreement rate on the distraction caused by the billboards in
general. They also provided similar opinions when asked if digital billboards are more distracting
than static billboards. So, this younger driver group actually perceived the distraction caused by
billboards and also the higher distraction level when the billboards are digitized. It has also been
revealed that young drivers usually have a long glance at digital billboards but very rarely slow
down. This behavior might be a matter of concern as it could lead to potential risk for traffic
crash occurrence.
It has been found that the older population group (>65 years) was more likely to use information
from digital billboards but barely used the information conveyed by the billboards. In fact, the
effectiveness of billboards, in general, and DBBs in particular to convey a message to the drivers
is found to be questionable since the vast majority of respondents confirmed that they rarely use
information from outdoor advertising billboards.
The analysis of aggregate responses of the drivers showed that almost half of the participants
agreed that billboards distract drivers while 22.51% ‘were not sure’. A similar percentage of
drivers perceived that the digital billboards are more distracting than their static counterparts.
The online survey also suggests that more than 40 percent of the drivers looked at the digital
billboards for a sufficiently long time, but most of the drivers barely slowed down. This behavior
is a matter of concern as the combination of speed and inattention is found to increase the risk for
a crash. Last but not least, survey responders emphasized the need for stricter regulation of
DBBs and restriction of size and frequency of placement for the benefit of traffic safety.
At the end, chi-square test has been performed across age groups and genders discretely. There
was no significant difference in the responses among the drivers groups. No significant change
was also found between the responses of male and female drivers when asked about their
perception or action while driving.
5.4.2 Discussion on Analysis Result of Florida drivers
The analysis of the driver questionnaire has produced some interesting findings regarding the
perceptions and attitudes of Florida residents with respect to DBBs. Younger drivers (≤20 years
and 21-25 years) have a significant agreement rate on the distraction caused by the billboards in
general. They also provided similar opinions when asked if digital billboards are more distracting
than static billboards. So, this younger driver group actually perceived the distraction caused by
billboards and also the higher distraction level when the billboards are digitized. It has also been
revealed that young to middle aged (26 to 35 years) drivers and older drivers (>65 years) usually
62
have a long glance at digital billboards but rarely slow down. This behavior might be a matter of
concern as it could lead to potential risk for traffic crash occurrence.
Another interesting finding is that the older population groups (56 to 65 and greater than 65
years) were more likely to use information from digital billboards but used the information
infrequently. In fact, the effectiveness of billboards, in general, and DBBs in particular to convey
a message to the drivers is found to be questionable since the vast majority of respondents
confirmed that they rarely use information from outdoor advertising billboards.
The analysis of aggregate responses of the drivers showed that more than 45% of the participants
agreed that billboards distract drivers while 22.81% ‘were not sure’. A comparable percentage of
drivers perceived that the digital billboards are more distracting than their static counterparts.
The online survey also suggests that more than half of the drivers looked at the digital billboards
for a sufficiently long time (though sometimes), but vast majority of the drivers barely slowed
down. This behavior is a matter of concern as the combination of speed and inattention is found
to increase the risk for a crash. Last but not least, survey responders emphasized the need for
stricter regulation of DBBs and restriction of size and frequency of placement for the benefit of
traffic safety.
The chi-square test has been performed across age groups and genders discretely. There was no
significant difference in the responses among the drivers of different age groups. No significant
change was also found between the responses of male and female drivers when asked about their
perception or action while driving.
Overall, the responses from the Alabama and Florida motorists were very consistent and
confirmed that drivers recognize digital advertising billboards as being distracting and a risk to
traffic safety and thus recommend stricter regulation of such billboards in the future.
63
CHAPTER 6
DRIVING SIMULATOR STUDY
This chapter discusses the use of a driving simulator platform to assess the extent to which
roadside advertising billboards in the United States cause driver distraction and, in turn, how
they impact driver safety. This study focused on the effect of external distractions from
billboards on driver's visual and cognitive attention as well as driving performance. Ultimately,
the goal of this effort was to help inform future public policy relating to driver distraction and
billboards.
6.1 Background
Driver distraction and the role that driver distraction plays in motor vehicle collisions (MVCs)
has been the subject of a great deal of research in recent years. In the United States in 2011,
driver distraction was cited as a factor in 10% of all MVCs, 17% of MVCs causing injury but no
fatalities, and 10% of MVCs causing at least one fatality(National Highway Traffic Safety
Administration [NHTSA], 2013)Furthermore, while distraction by visual fixation on objects
outside the vehicle is not the leading cause of fatal driver distraction, it does play an important
role. Among the 3,085 drivers in 2011 whose involvement in fatal MVCs was deemed to have
been at least in part due to distraction, objects outside the vehicle were reported as part or all of
the cause of the distraction 188 times, or for about 6% of all distracted drivers involved in fatal
MVCs that year (National Highway Traffic Safety Administration [NHTSA], 2013).It is
important to remember that these figures may underestimate the scope of external vehicle
distraction, because the determination of causes for fatal crashes relies on witness report and/or
an after-the-fact reconstruction of events by police. One example of external driver distraction is
billboards.
According to the Outdoor Advertising Association of America (OAAA), there were
approximately 365,839 unique billboard faces in the United States in 2013 (Outdoor Advertising
Association of America [OAAA], 2013). This figure includes 158,868 bulletins (ranging from
378 sq. ft. to 672 sq. ft.; located along highways and major local roads), 4,000 digital billboards
(similar in sizes to bulletins or posters; typically have two display faces, each of which rotates
through a selection of unique advertisements every 6-8 seconds; located along highways and
major local roads), 165,606 posters (typically ~236 sq. ft.; located along major local roads),
33,336 junior posters (typically 55 sq. ft.; located in urban areas and along smaller roads), and
4,029 wall murals (occupying some or all of a building face; located in urban areas and visible to
local traffic as well as some major highways) and “spectaculars” (made to order in larger-than-
standard sizes; may employ bright lights, motion, and other special effects; located in urban areas
and visible to urban traffic as well as some major highways). With such a high prevalence of
billboards along major highways and interstates, it is crucial that we understand the impact of
these external distractions on driver safety. Numerous studies have attempted to examine these
effects through the presentation of static (billboards with only one display which remains
constant) as well as digital billboards (billboards with two or more display faces, each of which
64
rotates through unique advertisements every 6-8 seconds) in a driving simulator (Bendak & Al-
Saleh, 2010; Divekar, Pradhan, Pollatsek, & Fisher, 2012; Edquist, Horberry, Hosking, &
Johnston, 2011; Marciano & Yeshurun, 2012; Young & Mahfoud, 2007).
Distracted driving has been formally defined as anytime a driver diverts attention away from the
task of driving to an object, person, task, or event not related to driving (Hanowski, 2011; Olsen,
Shults, & Eaton, 2013). This definition includes not only visual distraction, but also tasks that
are physically and cognitively demanding. Visual distractions encompass anything that requires
you to take your eyes off of the road; physical distractions occur when anything requires one or
both of your hands to be taken off the wheel; while cognitive distractions comprise anything that
distracts your mind from driving (Centers for Disease Control and Prevention [CDC], 2013a).
Distracted driving behaviors become increasingly more dangerous as they grow to include each
type of distraction (visual, physical and cognitive) (Goodwin, Foss, Harrell, & O'Brien, 2012).
Because billboards are external distractors (they occur outside of the vehicle), visual and
cognitive distractions are the two forms of distraction most relevant in the discussion of
billboards.
Visual distraction occurs anytime something causes the driver to take his/her eyes off of the road.
This type of distraction is especially dangerous as it impairs the detection of unexpected driving-
relevant information, including emergent hazards. One study done to test these specific effects
measured the proportion of drivers who fixated on an emergent stimulus in the environment and
the latency of the first detection of that stimulus. They found that visual distraction significantly
delayed the detection of emergent stimuli (as long as 1 second), which, in real-world situations,
translates into a delayed response in avoiding a hazard(Divekar et al., 2012; Smiley, Smahel, &
Eizenman, 2004). Several other studies were conducted to analyze the specific visual distraction
imposed on drivers fixated on billboards and how long these fixations lasted. Of particular
interest were fixations lasting more than 0.75 seconds. The mean duration of gaze at billboards
and proportion of time spent fixating towards billboards vs. towards the forward roadway were
analyzed. It was discovered that digital billboards attracted more visual attention and longer
gazes than conventional static billboards (Edquist, 2008; Lee, McElheny, & Gibbons, 2007).
The findings of this research indicate that digital billboard produced a great deal of visual
distraction, which in turn can significantly impair driving performance.
As previous research has indicated, visual distraction, specifically distraction produced by
billboards, can prove detrimental to driver’s safety. The second form of distraction created by
the presence of billboards is cognitive distraction. Cognitive distraction refers to anything that
takes a person’s mind off of the primary task at hand; in this case, driving. A study by Young and
Mahfoud (2007) utilized a driving simulator to test this very effect. They recorded driver
attention, mental workload, and performance in urban roadway, and rural roadway environments.
Results indicated that billboards decreased driver control, increased mental workload, and drew
attention away from relevant traffic signs. These results, more specifically the increase in mental
workload, support the cognitive distractions imposed by billboards. This increase in mental
workload impairs driver’s ability to appropriately allocate their attention and ultimately process
important information in the environment leading to diminished driving performance. Results
from the previous research cited leads to the conclusion that the presence of billboards increases
cognitive workload (the amount of information processed simultaneously) and response time of
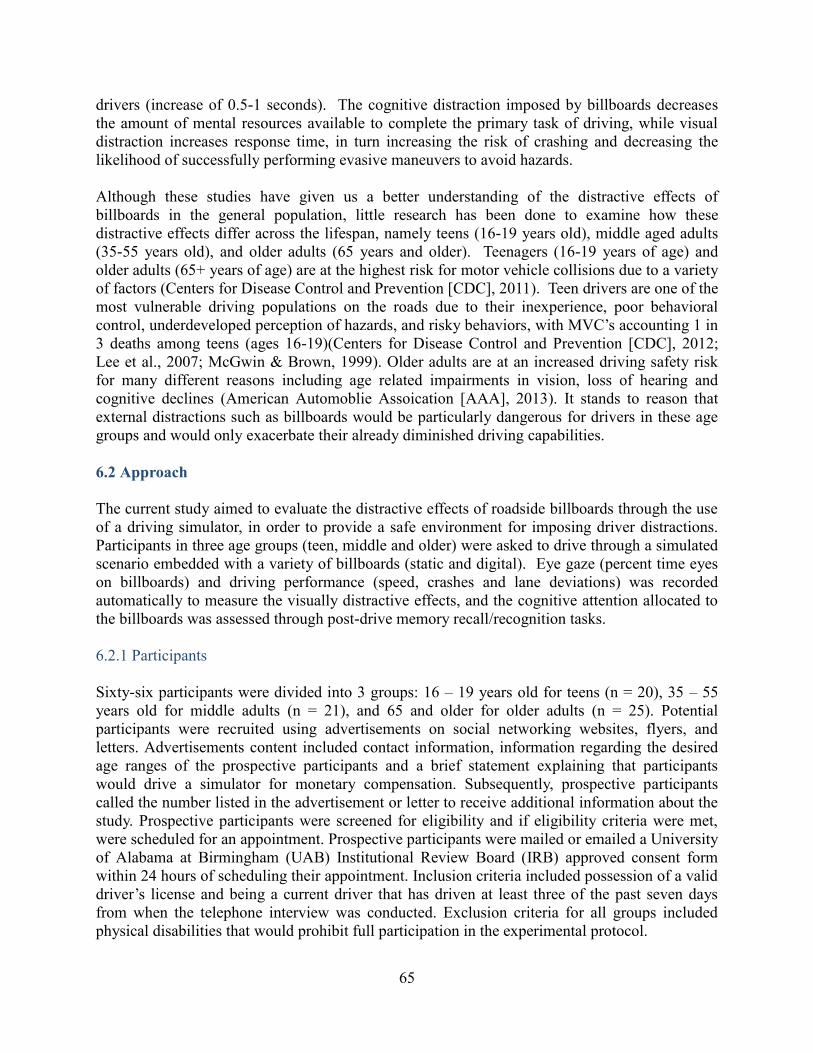
65
drivers (increase of 0.5-1 seconds). The cognitive distraction imposed by billboards decreases
the amount of mental resources available to complete the primary task of driving, while visual
distraction increases response time, in turn increasing the risk of crashing and decreasing the
likelihood of successfully performing evasive maneuvers to avoid hazards.
Although these studies have given us a better understanding of the distractive effects of
billboards in the general population, little research has been done to examine how these
distractive effects differ across the lifespan, namely teens (16-19 years old), middle aged adults
(35-55 years old), and older adults (65 years and older). Teenagers (16-19 years of age) and
older adults (65+ years of age) are at the highest risk for motor vehicle collisions due to a variety
of factors (Centers for Disease Control and Prevention [CDC], 2011). Teen drivers are one of the
most vulnerable driving populations on the roads due to their inexperience, poor behavioral
control, underdeveloped perception of hazards, and risky behaviors, with MVC’s accounting 1 in
3 deaths among teens (ages 16-19)(Centers for Disease Control and Prevention [CDC], 2012;
Lee et al., 2007; McGwin & Brown, 1999). Older adults are at an increased driving safety risk
for many different reasons including age related impairments in vision, loss of hearing and
cognitive declines (American Automoblie Assoication [AAA], 2013). It stands to reason that
external distractions such as billboards would be particularly dangerous for drivers in these age
groups and would only exacerbate their already diminished driving capabilities.
6.2 Approach
The current study aimed to evaluate the distractive effects of roadside billboards through the use
of a driving simulator, in order to provide a safe environment for imposing driver distractions.
Participants in three age groups (teen, middle and older) were asked to drive through a simulated
scenario embedded with a variety of billboards (static and digital). Eye gaze (percent time eyes
on billboards) and driving performance (speed, crashes and lane deviations) was recorded
automatically to measure the visually distractive effects, and the cognitive attention allocated to
the billboards was assessed through post-drive memory recall/recognition tasks.
6.2.1 Participants
Sixty-six participants were divided into 3 groups: 16 – 19 years old for teens (n = 20), 35 – 55
years old for middle adults (n = 21), and 65 and older for older adults (n = 25). Potential
participants were recruited using advertisements on social networking websites, flyers, and
letters. Advertisements content included contact information, information regarding the desired
age ranges of the prospective participants and a brief statement explaining that participants
would drive a simulator for monetary compensation. Subsequently, prospective participants
called the number listed in the advertisement or letter to receive additional information about the
study. Prospective participants were screened for eligibility and if eligibility criteria were met,
were scheduled for an appointment. Prospective participants were mailed or emailed a University
of Alabama at Birmingham (UAB) Institutional Review Board (IRB) approved consent form
within 24 hours of scheduling their appointment. Inclusion criteria included possession of a valid
driver’s license and being a current driver that has driven at least three of the past seven days
from when the telephone interview was conducted. Exclusion criteria for all groups included
physical disabilities that would prohibit full participation in the experimental protocol.
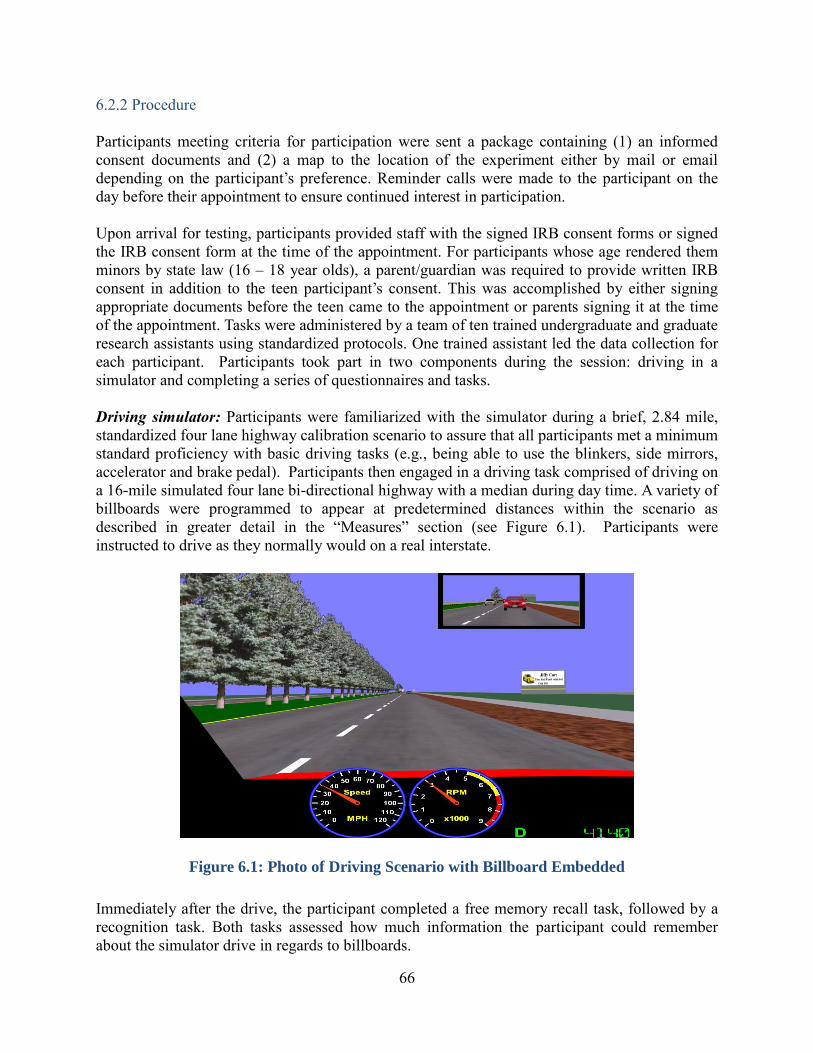
66
6.2.2 Procedure
Participants meeting criteria for participation were sent a package containing (1) an informed
consent documents and (2) a map to the location of the experiment either by mail or email
depending on the participant’s preference. Reminder calls were made to the participant on the
day before their appointment to ensure continued interest in participation.
Upon arrival for testing, participants provided staff with the signed IRB consent forms or signed
the IRB consent form at the time of the appointment. For participants whose age rendered them
minors by state law (16 – 18 year olds), a parent/guardian was required to provide written IRB
consent in addition to the teen participant’s consent. This was accomplished by either signing
appropriate documents before the teen came to the appointment or parents signing it at the time
of the appointment. Tasks were administered by a team of ten trained undergraduate and graduate
research assistants using standardized protocols. One trained assistant led the data collection for
each participant. Participants took part in two components during the session: driving in a
simulator and completing a series of questionnaires and tasks.
Driving simulator: Participants were familiarized with the simulator during a brief, 2.84 mile,
standardized four lane highway calibration scenario to assure that all participants met a minimum
standard proficiency with basic driving tasks (e.g., being able to use the blinkers, side mirrors,
accelerator and brake pedal). Participants then engaged in a driving task comprised of driving on
a 16-mile simulated four lane bi-directional highway with a median during day time. A variety of
billboards were programmed to appear at predetermined distances within the scenario as
described in greater detail in the “Measures” section (see Figure 6.1). Participants were
instructed to drive as they normally would on a real interstate.
Figure 6.1: Photo of Driving Scenario with Billboard Embedded
Immediately after the drive, the participant completed a free memory recall task, followed by a
recognition task. Both tasks assessed how much information the participant could remember
about the simulator drive in regards to billboards.
67
Questionnaires and Tasks: Participants were escorted into a nearby private room for the
completion of several brief questionnaires. Research assistants verbally administered the
questionnaires and tasks in an interview style.
Debriefing: After completing the driving scenario, questionnaires, and tasks, participants were
debriefed. The debriefing included two components: (1) a brief discussion of topics relevant to
the present work and (2) the presentation of a take home brochure describing the purpose of the
study. Participants received a single monetary payment at the end of the session.
6.2.3 Measures
STISIM Driving Simulator: Participants drove for a total of 16 miles in a computerized driving
simulation task to provide a measure of driving performance under specified conditions of
interest (STISIM Drive, Systems Technology Inc., Hawthorne, CA). The simulation was
displayed on three, 20” LCD computer monitors, providing a 135° field of view. Participants sat
within the simulator’s passenger compartment which provided a view of the roadway and
dashboard instruments, including a speedometer. The vehicle was controlled by moving a
steering wheel in a typical driving manner and depressing accelerator and brake pedals
accordingly. An on-board stereo sound system provided naturalistic engine sounds, external road
noise, and sounds of passing traffic (see Figure 6.2).
Figure 6.2: Photo of UAB Simulator
The driving scenario featured a four lane highway with a median, in which traffic flowed in a bi-
directional manner and day-time scenery (mixture of buildings and billboards) was displayed.
Participants were required to drive as they normally would. A posted speed limit of 65 mph was
displayed periodically throughout the scenario. Key driving variables were coded electronically
by the simulator, except for visual attention, which was coded electronically by supplemental eye
tracking equipment.
68
Billboards: The driving simulation displayed a mixture of digital and static billboards
interspersed throughout the drive and always appeared on the right side of the road. Eight
billboards were digital (i.e., they transitioned from one advertisement to another at pre-
determined points) and four were static (i.e., they did not transition). Transition times for the
digital billboards varied to mimic naturalistic digital billboards which transition at different
points in time while a driver passes. Two transition time points (i.e., point at which the billboard
would transition from one advertisement to another) were established at 250 feet and 500 feet
away from the billboard to ensure clear visibility of both first (initial) and second (changed)
advertisements. Therefore, if the billboard was digital, the first advertisement would change to
another advertisement once the participant passed the predetermined marker (i.e., 250 or 500 feet
from the billboard) while driving.
The 16-mile drive was further broken into four equal parts for development purposes. Each part
consisted of the following: 1) a billboard that transitioned (i.e., changed from one advertisement
to another) when the driver was 500 feet away from it, 2) a billboard that transitioned (i.e.,
changed from one advertisement to another) when the driver was 250 feet away from it, 3) a
billboard that was static and therefore did not transition, and 4) a segment that did not include a
billboard at all. Each of these 4 parts spanned one mile each and were populated in a
randomized order according to a Latin square design.
The transition times and design of the billboards was based off the Alabama Outdoor Advertising
Code outlined in the Alabama Department of Transportation’s Procedure and Requirements for
Outdoor Advertising (Ala. Code 1975 § 450-10-1). To maintain consistency with Alabama
guidelines and to maximize external validity of study results, the billboards embedded in the
simulated scenario met the following criteria: (1) the size dimensions for all billboards were 14
feet by 48 feet, (2) at least 500 feet between billboard structures was maintained, (3) at least 8
seconds elapsed between the transition of individual billboards, and (4) digital billboards did not
consist of flashing or moving lights. Additionally, real world digital billboards on Alabama
roadways were considered in the development of the billboards embedded in the scenario. The
following four main components of a typical billboard were defined and remained constant
across all billboards presented in the scenario: (1) a large visual image or photograph, (2) the title
of a business or marketed product, (3) either a slogan or a statement, and (4) an exit number (see
Figure 6.3).
A total of 16 billboards were presented in the simulation drive. Each billboard was presented
once per simulation, thus the billboard order was fixed across participants. Each billboard was
presented at a predetermined distance within the simulation. The billboard spawned, or appeared,
once the participant reached the predetermined distance into the simulation. Individual
billboards were designed to maintain consistency and balance across particular variables such as
complexity, font size, color, word count, billboard components (as indicated in the previous
paragraph), and right or left image placement. To vary the types of billboards presented, four
categories were established: food (e.g., restaurants), goods (e.g., products), services (e.g.,
businesses), and destinations (e.g., vacation spots).
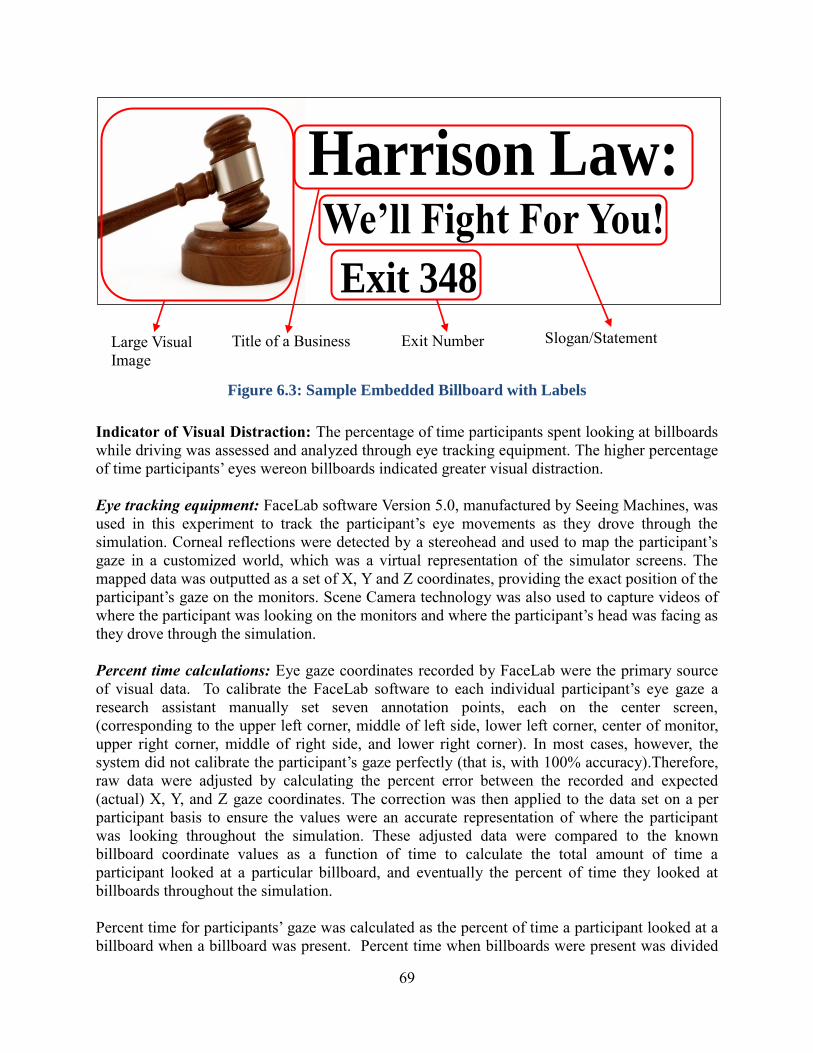
69
Figure 6.3: Sample Embedded Billboard with Labels
Indicator of Visual Distraction: The percentage of time participants spent looking at billboards
while driving was assessed and analyzed through eye tracking equipment. The higher percentage
of time participants’ eyes wereon billboards indicated greater visual distraction.
Eye tracking equipment: FaceLab software Version 5.0, manufactured by Seeing Machines, was
used in this experiment to track the participant’s eye movements as they drove through the
simulation. Corneal reflections were detected by a stereohead and used to map the participant’s
gaze in a customized world, which was a virtual representation of the simulator screens. The
mapped data was outputted as a set of X, Y and Z coordinates, providing the exact position of the
participant’s gaze on the monitors. Scene Camera technology was also used to capture videos of
where the participant was looking on the monitors and where the participant’s head was facing as
they drove through the simulation.
Percent time calculations: Eye gaze coordinates recorded by FaceLab were the primary source
of visual data. To calibrate the FaceLab software to each individual participant’s eye gaze a
research assistant manually set seven annotation points, each on the center screen,
(corresponding to the upper left corner, middle of left side, lower left corner, center of monitor,
upper right corner, middle of right side, and lower right corner). In most cases, however, the
system did not calibrate the participant’s gaze perfectly (that is, with 100% accuracy).Therefore,
raw data were adjusted by calculating the percent error between the recorded and expected
(actual) X, Y, and Z gaze coordinates. The correction was then applied to the data set on a per
participant basis to ensure the values were an accurate representation of where the participant
was looking throughout the simulation. These adjusted data were compared to the known
billboard coordinate values as a function of time to calculate the total amount of time a
participant looked at a particular billboard, and eventually the percent of time they looked at
billboards throughout the simulation.
Percent time for participants’ gaze was calculated as the percent of time a participant looked at a
billboard when a billboard was present. Percent time when billboards were present was divided
Harrison Law: We’ll Fight For You!
Exit 348
Large Visual
Image
Title of a Business Exit Number Slogan/Statement
70
into two divisions: (1) when static billboards were present and (2) when digital billboards were
present. The digital billboard division was subdivided by the distance from a billboard
participants were when it transitioned: (1) a 250-foot transition and (2) a 500-foot transition.
Three basic calculations were made to derive the percent of time participants spent looking at
billboards, overall and in specific subdivisions:
(1) The total time of a participant’s drive, in seconds, was taken from electronically recorded
output of the simulator.
(2) The total amount of time a participant spent looking at a particular billboard, in seconds, was
calculated by taking the sum total of coordinates (recorded every 1-60th
seconds by FaceLab)
that matched the expected values for the billboard’s placement on the screen. Calculations
were made across all divisions when billboards were present. Sub-calculations were made for
each division when a billboard was present: (1) static, and (2) digital and its subdivisions: (1)
250 feet transition digital billboards and (2) 500 feet transition digital billboards.
(3) The total percent of time participants' eyes were on billboards was calculated by dividing the
total amount of time a participant spent looking at billboards by the total time of the
participant’s drive. Sub-calculations were made for each division when a billboard was
present: (1) static, and (2) digital and its subdivisions: (1) 250 feet transition digital
billboards and (2) 500 feet transition digital billboards.
Indicators of Cognitive Distraction: Two indicators of cognitive distraction were assessed and
analyzed through a laboratory-developed Free Memory Recall Task and Recognition Task. Both
tasks assessed the amount of information a participant remembered about the billboards
embedded within the simulator drive. Higher recall of billboards in the Free Memory Recall Task
or more recognition of billboards in the Recognition Task indicated greater cognitive distraction.
Free Memory Recall Task: The Free Memory Recall Task consisted of verbally asking the
participant to describe as many or as much of the billboards they may have remembered from the
simulation. The billboards did not have to be recalled in the order in which they appeared during
the simulation. They were instructed that “billboards” in this case were to be defined as any large
outdoor advertising signs, which were designed, intended or used to advertise or inform.
Participants were specifically told that speed limit and other road signs did not apply.
Participants were given three minutes to freely recall any information about the billboards seen
in the simulation. Answers were audio recorded and hand written by the research assistant for
scoring purposes.
A score was then calculated using the following scoring protocol: 2 points for correct response
per billboard component, 1 point for partial response per billboard component, and 0 points for
incorrect or no response per billboard component. Correct responses included: (1) the large
visual image or photograph (e.g., Gavel), (2) the full title of a business or marketed product (e.g.,
Harrison Law), (3) the full slogan or statement (e.g., We’ll Fight for You), and (4) the exit
number (e.g., 348). Partial responses included: (1) a large visual image or photograph similar to
the original image or photograph (e.g., Wooden Stick), (2) part of the title of the business or
marketed product (e.g., Law Firm), or (3) part of the slogan or statement (e.g., Fight). No partial
credit was given to participants for incorrect exit numbers. The maximum score for each
billboard was eight, totaling a maximum score of 160.
71
Recognition Task: The Recognition Task was constructed using Microsoft PowerPoint
slideshow, which displayed a total of 48 billboards: 20 real billboards (i.e., billboards that
appeared within the driving simulation) and 28 false billboards (i.e., billboards that did not
appear within the driving simulation). A single billboard was displayed in the middle of a
computer screen for ten seconds followed by a blank screen for three seconds. Participants were
instructed to verbally indicate whether or not they recognized the billboard fromthe simulation
by saying “yes” if they remembered seeing the billboard or “no” if they did not remember seeing
the billboard. The research assistant recorded each of the participant’s responses.
The total number of hits (i.e., correct remembrance of billboards), misses (i.e., incorrect
remembrance of real billboards), and false hits (i.e., incorrect remembrance of false billboards)
were calculated.
Indicators of Driving Performance: Three indicators of driving performance were
electronically recorded by the simulator and were analyzed across four conditions: 250-foot
billboard transition, 500-foot billboard transition, static billboard, or no billboard present:
(a) The number of road edge excursions, situations in which the right tire touches or crosses the
right line, were recorded by the STISIM simulator. The total number of road edge excursions
was divided into two different divisions: (1) when billboard was not present and (2) when
billboard was present. Occurrences when billboards were present were further divided into
two main divisions: (1) when static billboard was present and (2) when digital billboards were
present and it subdivisions: (1) when digital billboards, which transitioned at 250 feet, was
present and (2) when digital billboards, which transitioned at 500 feet, was present.
(b) The number of speed limit exceedances, situations in which the participant’s speed exceeded
69 miles per hour (mph) or 101.2 feet per second (fps), was recorded by the STISIM
simulator. The total number of speed exceedances was then divided into two different
divisions: (1) when a billboard was not present and (2) when a billboard was present. Speed
limit exceedances which occurred when billboards were present were further divided into two
main divisions: (1) when static billboards were present and (2) when digital billboards were
present, and its subdivisions: (1) when digital billboards, which transitioned at 250 feet, were
present and (2) when digital billboards, which transitioned at 500 feet, were present.
(c) A total number of motor vehicle collisions, situations in which the driver made contact with
another vehicle or structure within the scenario, were recorded by the STISIM simulator and
compiled across each billboard division as described above.
Other Variables of Interest: The following questionnaire was administered to provide
information for secondary areas of interest:
a) The Questionnaire Assessing Distracted Driving (QUADD; Welburn et al., 2010; Welburn et
al., 2011), a laboratory-developed questionnaire, assessed several variables of interest
including demographic information (e.g., gender, age, time since licensure), perception of
billboards, cell phone and text messaging use, driving history and experience, number of real
world crashes, traffic violations, and perception of risk associated with distracted driving and
ability to focus while engaging in distracted driving.
72
6.3 Data Analytic Technique
6.3.1 Preliminary Analyses
Participants without full participation in experimental protocol were excluded from analyses.
Descriptive statistics were obtained for the remaining sample and were divided by group.
Significant differences between age groups (teen, middle, older) on key demographic variables
were tested using One- Way Analyses of Variances (ANOVAs) (for continuous variables).
P’s<.05 were considered significant for all analyses.
Questionnaire data was also compiled and summarized to provide a descriptive overview of
participants’ perceptions towards billboards, as well as distracted driving in general, using One-
Way ANOVAs.
6.3.2 Primary Analyses
To examine the impact of billboards on various components of driver distraction, primary
analyses involved a series of Repeated Measures ANOVAs (RM ANOVA) where the between
subjects factor was age group (teen, middle, older) and the within-subjects factor was billboard
type (static vs. digital, not present vs. static vs. 250-ft transition vs. 500-ft transition).
Interactions between age group and billboard type were tested using RM ANOVAs. The
following served as dependent variables: (1) visual distraction (percent time spent looking at
billboards) and (2) degraded driving performance (speed exceedances, motor vehicle collisions,
and road edge excursions). One-Way ANOVAs were used to test significant differences between
age groups for cognitive distraction (total score on memory free recall task and total score on
memory recognition task).
6.4 Results
A total of 66 participants were recruited for the study, but nine were excluded from the final
analyses due to attrition for the following reasons: one participant experienced simulator sickness
and did not fully participate in the experimental protocol, and eight participants’ eye gaze was
not tracked due to technical difficulties with properly calibrating the eye tracking equipment. Of
the 57 participants retained for data analyses, there were no significant differences of gender and
ethnicity (Table 6.1) across age groups.
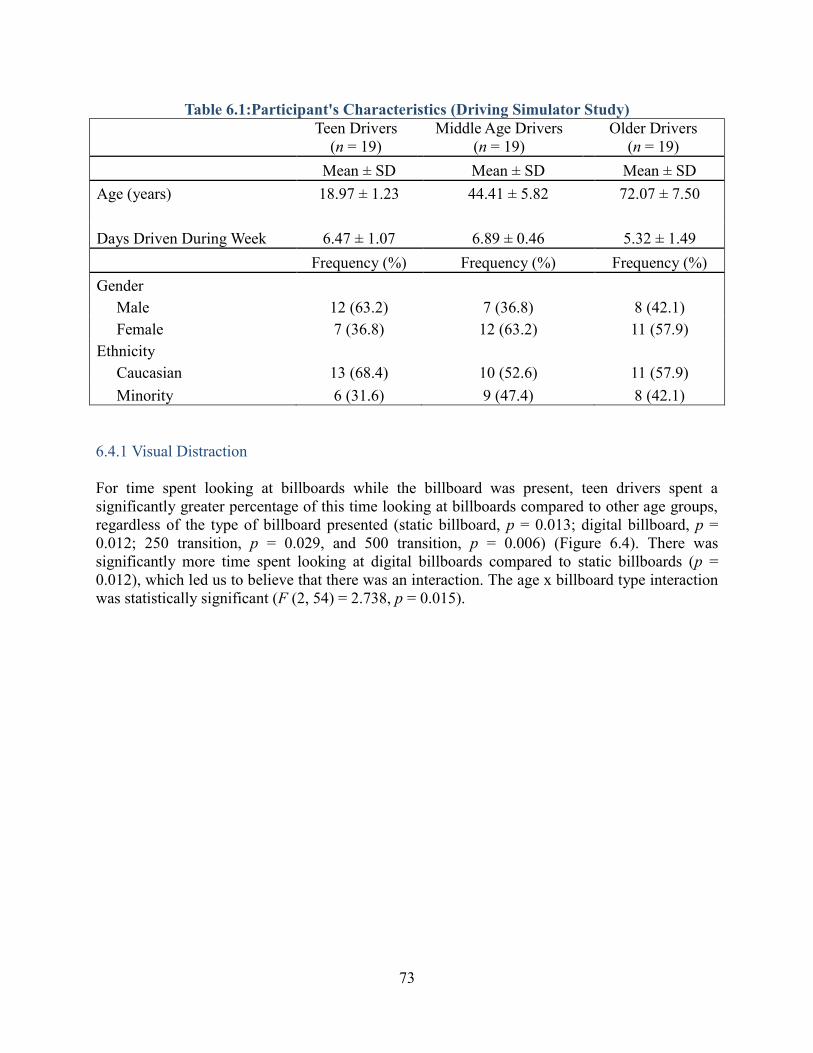
73
Table 6.1:Participant's Characteristics (Driving Simulator Study)
Teen Drivers
(n = 19)
Middle Age Drivers
(n = 19)
Older Drivers
(n = 19)
Mean ± SD Mean ± SD Mean ± SD
Age (years) 18.97 ± 1.23 44.41 ± 5.82 72.07 ± 7.50
Days Driven During Week 6.47 ± 1.07 6.89 ± 0.46 5.32 ± 1.49
Frequency (%) Frequency (%) Frequency (%)
Gender
Male 12 (63.2) 7 (36.8) 8 (42.1)
Female 7 (36.8) 12 (63.2) 11 (57.9)
Ethnicity
Caucasian 13 (68.4) 10 (52.6) 11 (57.9)
Minority 6 (31.6) 9 (47.4) 8 (42.1)
6.4.1 Visual Distraction
For time spent looking at billboards while the billboard was present, teen drivers spent a
significantly greater percentage of this time looking at billboards compared to other age groups,
regardless of the type of billboard presented (static billboard, p = 0.013; digital billboard, p =
0.012; 250 transition, p = 0.029, and 500 transition, p = 0.006) (Figure 6.4). There was
significantly more time spent looking at digital billboards compared to static billboards (p =
0.012), which led us to believe that there was an interaction. The age x billboard type interaction
was statistically significant (F (2, 54) = 2.738, p = 0.015).
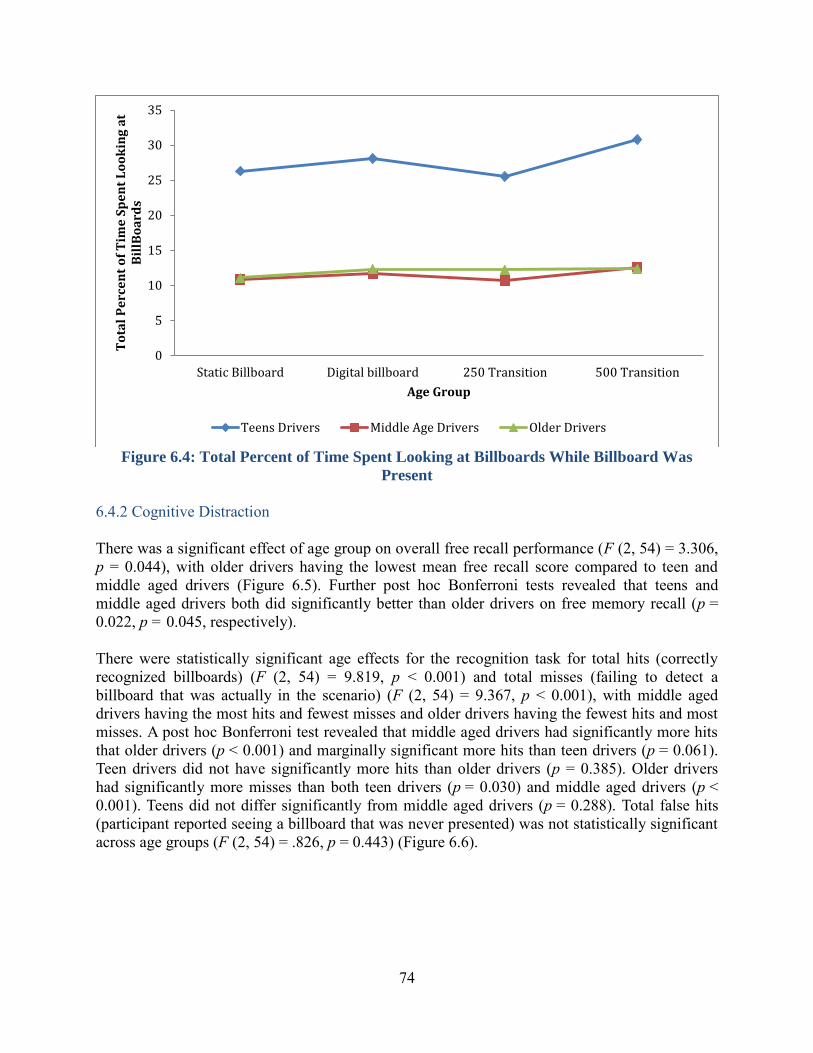
74
Figure 6.4: Total Percent of Time Spent Looking at Billboards While Billboard Was
Present
6.4.2 Cognitive Distraction
There was a significant effect of age group on overall free recall performance (F (2, 54) = 3.306,
p = 0.044), with older drivers having the lowest mean free recall score compared to teen and
middle aged drivers (Figure 6.5). Further post hoc Bonferroni tests revealed that teens and
middle aged drivers both did significantly better than older drivers on free memory recall (p =
0.022, p = 0.045, respectively).
There were statistically significant age effects for the recognition task for total hits (correctly
recognized billboards) (F (2, 54) = 9.819, p < 0.001) and total misses (failing to detect a
billboard that was actually in the scenario) (F (2, 54) = 9.367, p < 0.001), with middle aged
drivers having the most hits and fewest misses and older drivers having the fewest hits and most
misses. A post hoc Bonferroni test revealed that middle aged drivers had significantly more hits
that older drivers (p < 0.001) and marginally significant more hits than teen drivers (p = 0.061).
Teen drivers did not have significantly more hits than older drivers (p = 0.385). Older drivers
had significantly more misses than both teen drivers (p = 0.030) and middle aged drivers (p <
0.001). Teens did not differ significantly from middle aged drivers (p = 0.288). Total false hits
(participant reported seeing a billboard that was never presented) was not statistically significant
across age groups (F (2, 54) = .826, p = 0.443) (Figure 6.6).
0
5
10
15
20
25
30
35
Static Billboard Digital billboard 250 Transition 500 Transition
To
tal
Pe
rce
nt
of
Tim
e S
pe
nt
Lo
ok
ing
at
Bil
lBo
ard
s
Age Group
Teens Drivers Middle Age Drivers Older Drivers
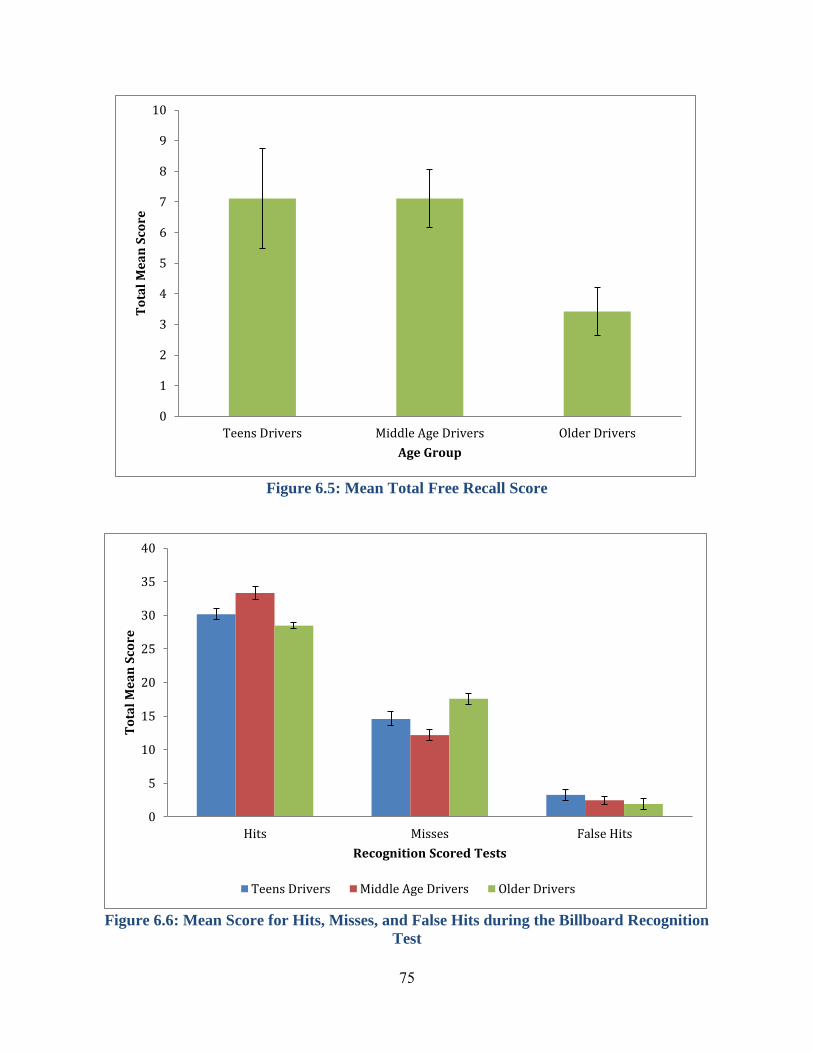
75
Figure 6.5: Mean Total Free Recall Score
Figure 6.6: Mean Score for Hits, Misses, and False Hits during the Billboard Recognition
Test
0
1
2
3
4
5
6
7
8
9
10
Teens Drivers Middle Age Drivers Older Drivers
To
tal
Me
an
Sco
re
Age Group
0
5
10
15
20
25
30
35
40
Hits Misses False Hits
To
tal
Me
an
Sco
re
Recognition Scored Tests
Teens Drivers Middle Age Drivers Older Drivers
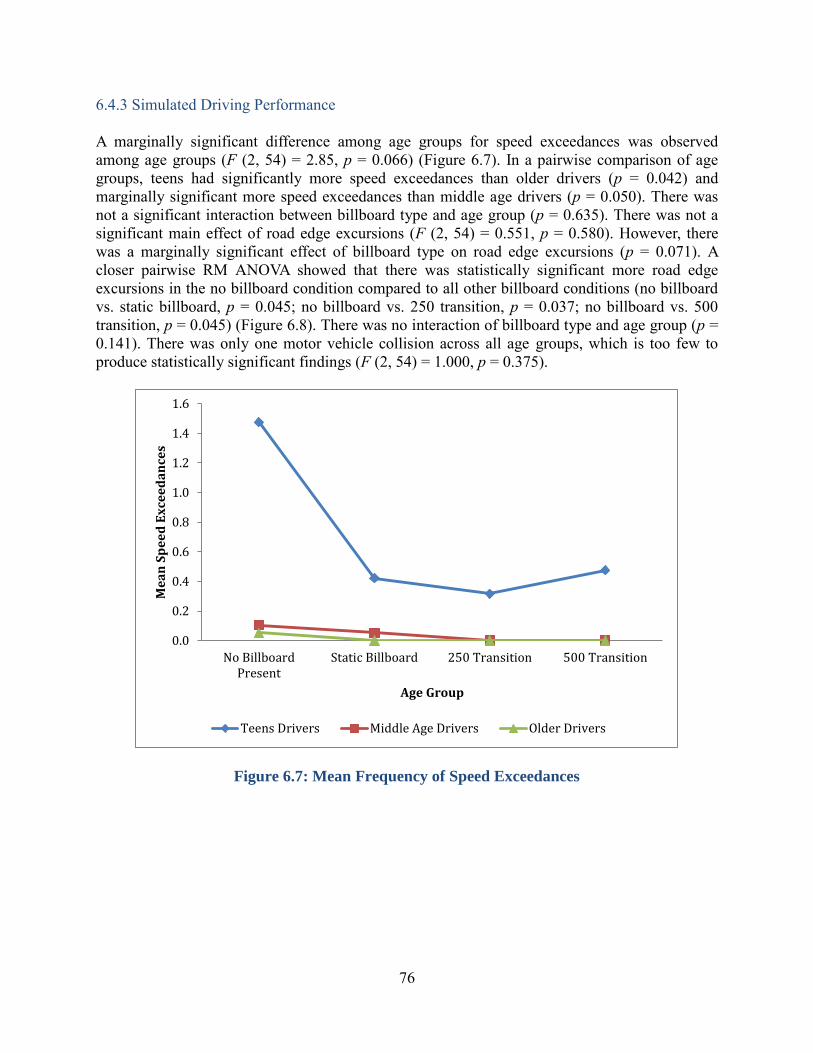
76
6.4.3 Simulated Driving Performance
A marginally significant difference among age groups for speed exceedances was observed
among age groups (F (2, 54) = 2.85, p = 0.066) (Figure 6.7). In a pairwise comparison of age
groups, teens had significantly more speed exceedances than older drivers (p = 0.042) and
marginally significant more speed exceedances than middle age drivers (p = 0.050). There was
not a significant interaction between billboard type and age group (p = 0.635). There was not a
significant main effect of road edge excursions (F (2, 54) = 0.551, p = 0.580). However, there
was a marginally significant effect of billboard type on road edge excursions (p = 0.071). A
closer pairwise RM ANOVA showed that there was statistically significant more road edge
excursions in the no billboard condition compared to all other billboard conditions (no billboard
vs. static billboard, p = 0.045; no billboard vs. 250 transition, p = 0.037; no billboard vs. 500
transition, p = 0.045) (Figure 6.8). There was no interaction of billboard type and age group (p =
0.141). There was only one motor vehicle collision across all age groups, which is too few to
produce statistically significant findings (F (2, 54) = 1.000, p = 0.375).
Figure 6.7: Mean Frequency of Speed Exceedances
0.0
0.2
0.4
0.6
0.8
1.0
1.2
1.4
1.6
No BillboardPresent
Static Billboard 250 Transition 500 Transition
Me
an
Sp
ee
d E
xce
ed
an
ces
Age Group
Teens Drivers Middle Age Drivers Older Drivers
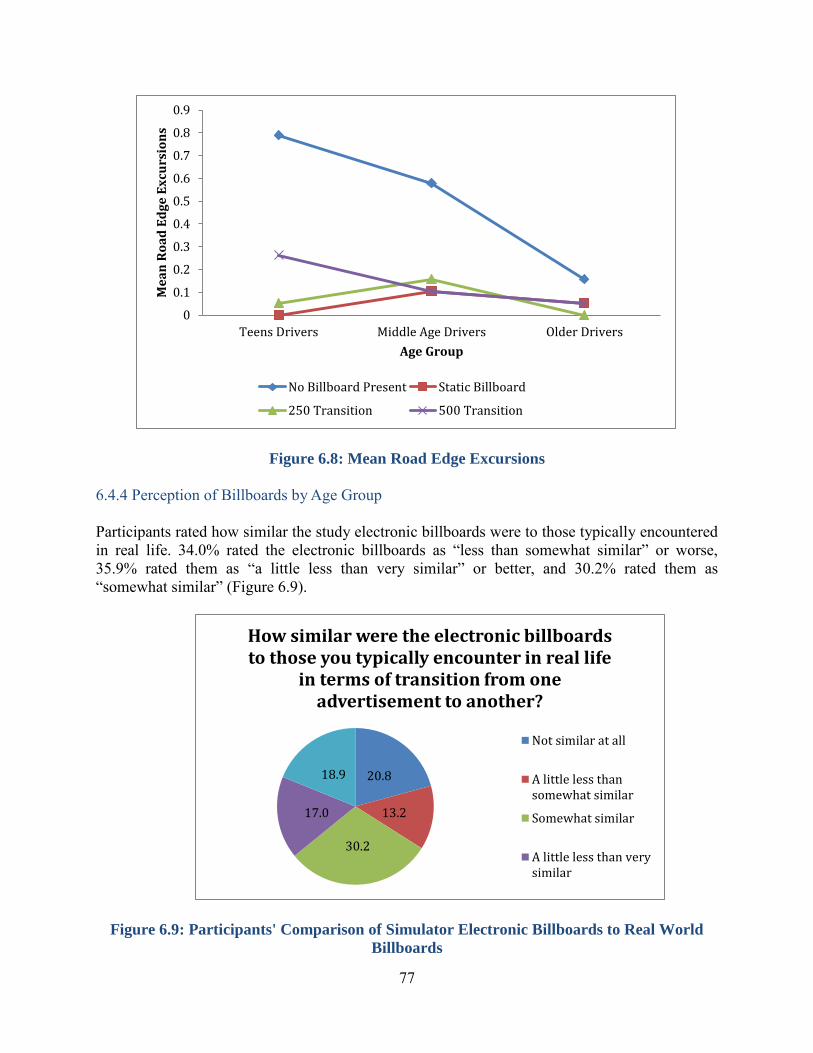
77
Figure 6.8: Mean Road Edge Excursions
6.4.4 Perception of Billboards by Age Group
Participants rated how similar the study electronic billboards were to those typically encountered
in real life. 34.0% rated the electronic billboards as “less than somewhat similar” or worse,
35.9% rated them as “a little less than very similar” or better, and 30.2% rated them as
“somewhat similar” (Figure 6.9).
Figure 6.9: Participants' Comparison of Simulator Electronic Billboards to Real World
Billboards
0
0.1
0.2
0.3
0.4
0.5
0.6
0.7
0.8
0.9
Teens Drivers Middle Age Drivers Older Drivers
Me
an
Ro
ad
Ed
ge
Ex
curs
ion
s
Age Group
No Billboard Present Static Billboard
250 Transition 500 Transition
20.8
13.2
30.2
17.0
18.9
How similar were the electronic billboards to those you typically encounter in real life
in terms of transition from one advertisement to another?
Not similar at all
A little less thansomewhat similar
Somewhat similar
A little less than verysimilar
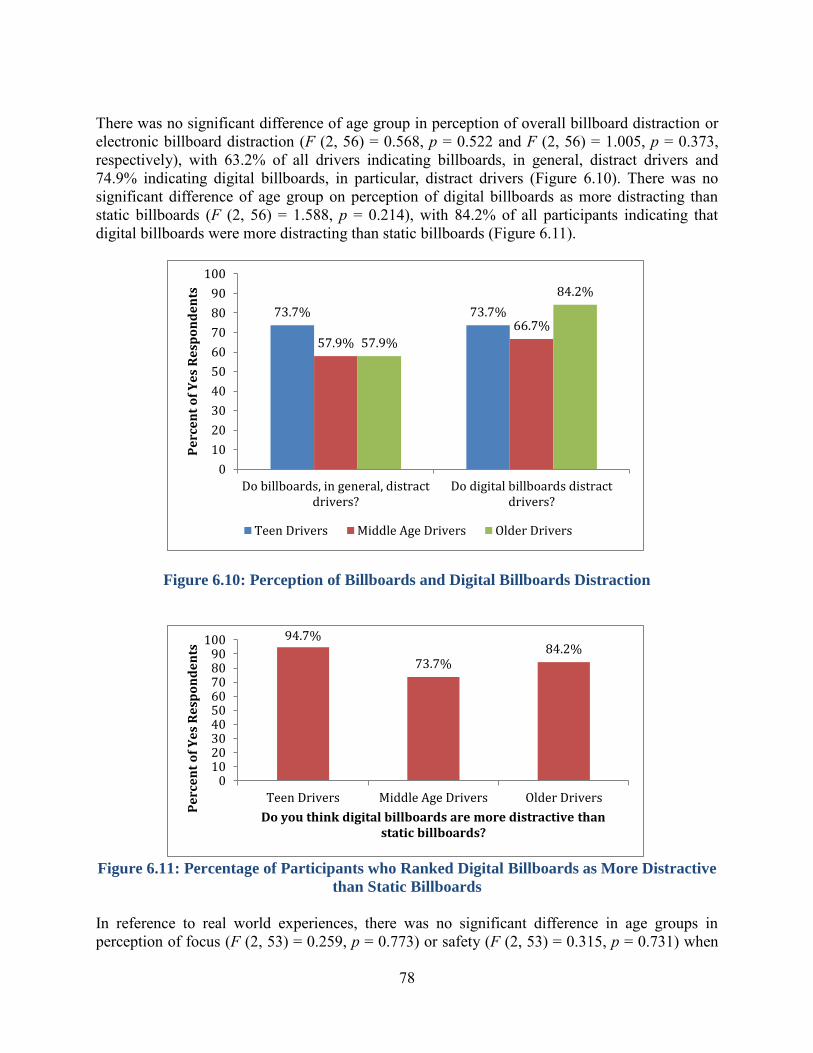
78
There was no significant difference of age group in perception of overall billboard distraction or
electronic billboard distraction (F (2, 56) = 0.568, p = 0.522 and F (2, 56) = 1.005, p = 0.373,
respectively), with 63.2% of all drivers indicating billboards, in general, distract drivers and
74.9% indicating digital billboards, in particular, distract drivers (Figure 6.10). There was no
significant difference of age group on perception of digital billboards as more distracting than
static billboards (F (2, 56) = 1.588, p = 0.214), with 84.2% of all participants indicating that
digital billboards were more distracting than static billboards (Figure 6.11).
Figure 6.10: Perception of Billboards and Digital Billboards Distraction
Figure 6.11: Percentage of Participants who Ranked Digital Billboards as More Distractive
than Static Billboards
In reference to real world experiences, there was no significant difference in age groups in
perception of focus (F (2, 53) = 0.259, p = 0.773) or safety (F (2, 53) = 0.315, p = 0.731) when
73.7% 73.7%
57.9%
66.7%
57.9%
84.2%
0
10
20
30
40
50
60
70
80
90
100
Do billboards, in general, distractdrivers?
Do digital billboards distractdrivers?
Pe
rce
nt
of
Ye
s R
esp
on
de
nts
Teen Drivers Middle Age Drivers Older Drivers
94.7%
73.7% 84.2%
0102030405060708090
100
Teen Drivers Middle Age Drivers Older Drivers
Pe
rce
nt
of
Ye
s R
esp
on
de
nts
Do you think digital billboards are more distractive than static billboards?
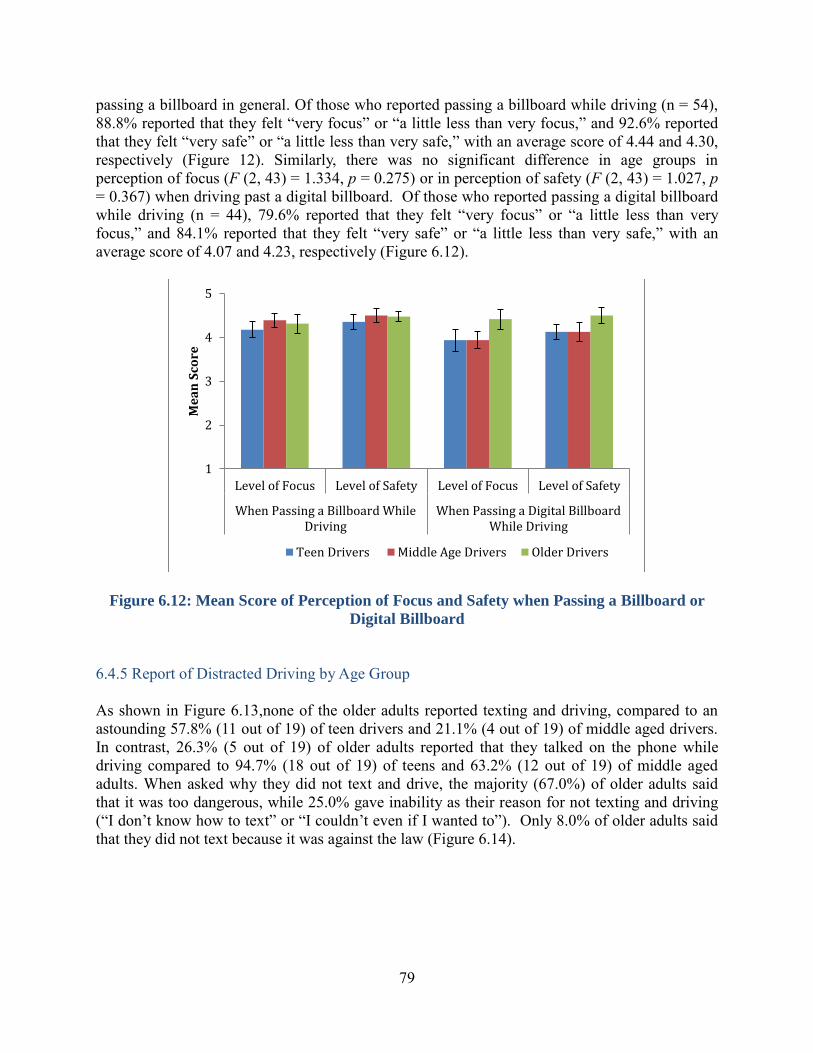
79
passing a billboard in general. Of those who reported passing a billboard while driving (n = 54),
88.8% reported that they felt “very focus” or “a little less than very focus,” and 92.6% reported
that they felt “very safe” or “a little less than very safe,” with an average score of 4.44 and 4.30,
respectively (Figure 12). Similarly, there was no significant difference in age groups in
perception of focus (F (2, 43) = 1.334, p = 0.275) or in perception of safety (F (2, 43) = 1.027, p
= 0.367) when driving past a digital billboard. Of those who reported passing a digital billboard
while driving (n = 44), 79.6% reported that they felt “very focus” or “a little less than very
focus,” and 84.1% reported that they felt “very safe” or “a little less than very safe,” with an
average score of 4.07 and 4.23, respectively (Figure 6.12).
Figure 6.12: Mean Score of Perception of Focus and Safety when Passing a Billboard or
Digital Billboard
6.4.5 Report of Distracted Driving by Age Group
As shown in Figure 6.13,none of the older adults reported texting and driving, compared to an
astounding 57.8% (11 out of 19) of teen drivers and 21.1% (4 out of 19) of middle aged drivers.
In contrast, 26.3% (5 out of 19) of older adults reported that they talked on the phone while
driving compared to 94.7% (18 out of 19) of teens and 63.2% (12 out of 19) of middle aged
adults. When asked why they did not text and drive, the majority (67.0%) of older adults said
that it was too dangerous, while 25.0% gave inability as their reason for not texting and driving
(“I don’t know how to text” or “I couldn’t even if I wanted to”). Only 8.0% of older adults said
that they did not text because it was against the law (Figure 6.14).
1
2
3
4
5
Level of Focus Level of Safety Level of Focus Level of Safety
When Passing a Billboard WhileDriving
When Passing a Digital BillboardWhile Driving
Me
an
Sco
re
Teen Drivers Middle Age Drivers Older Drivers
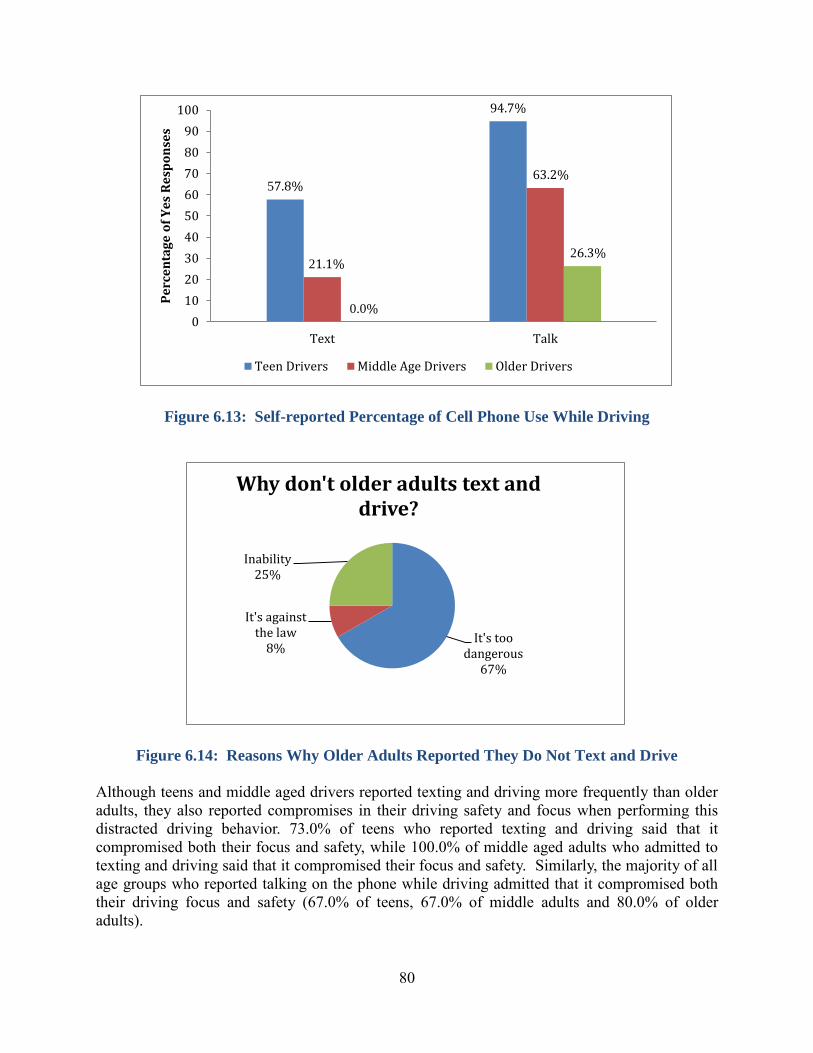
80
Figure 6.13: Self-reported Percentage of Cell Phone Use While Driving
Figure 6.14: Reasons Why Older Adults Reported They Do Not Text and Drive
Although teens and middle aged drivers reported texting and driving more frequently than older
adults, they also reported compromises in their driving safety and focus when performing this
distracted driving behavior. 73.0% of teens who reported texting and driving said that it
compromised both their focus and safety, while 100.0% of middle aged adults who admitted to
texting and driving said that it compromised their focus and safety. Similarly, the majority of all
age groups who reported talking on the phone while driving admitted that it compromised both
their driving focus and safety (67.0% of teens, 67.0% of middle adults and 80.0% of older
adults).
57.8%
94.7%
21.1%
63.2%
0.0%
26.3%
0
10
20
30
40
50
60
70
80
90
100
Text Talk
Pe
rce
nta
ge
of
Ye
s R
esp
on
ses
Teen Drivers Middle Age Drivers Older Drivers
It's too dangerous
67%
It's against the law
8%
Inability 25%
Why don't older adults text and drive?
81
Overall, teens performed the worst out of all age groups, which was expected. They had more
speed exceedances, spent more time looking at the billboards, and engaged in texting while
driving more than any other age group. The middle age adult group spent significantly less time
looking at the billboards compared to the teen group; however, they were able to recognize just
as many billboards correctly as the teens.
6.5 Discussion
The purpose of this study was to assess roadside advertising billboard distraction in the United
States and how they impact driver safety using a driving simulator platform. This study is among
the first to look at billboard distraction across different age groups, namely teens and older
drivers who have the highest rates of motor vehicle collisions. In general, billboards tended to
impact driver performance in two cases; speed exceedances and visual attention were impacted
in particular.
Overall, participants had fewer speed exceedances when there was a billboard present, indicating
that their attention may have been captured by the billboards resulting in a slowed speed. Teens,
as expected, had more speed exceedances than middle aged and older drivers.Also, in the
presence of a billboard, the number of speed exceedances across all age groups was significantly
reduced. These findings suggest there was an impact of billboard distraction, which could be
attributed to drivers paying more attention to the billboard (Crundall, Van Loon, & Underwood,
2006; Dukic, Ahlstron, Patten, Kettwich, & Kircher, 2013). However, there was no significant
difference in perception of overall billboard distraction or hindrance to perception of focus across
all age groups as reported by the participants. The fact that significantly more speed exceedances
were observed in the teen age group is consistent with other studies' results (Compton & Ellison-
Potter, 2008; National Highway Traffic Safety Administration [NHTSA], 2012).
Overall, our findings support previous studies examining the impact of billboards on driver
distraction such as Chattington, Reed, Basacik, Flint, and Parkes (2009) who found that video
billboards (in our study referred to as digital billboards) were associated with more glances away
from the road than stationary billboards, or static billboards; however, we are among the first to
look at age effects and billboard types on driver distraction from billboards. Participants in the
present study also spent more time looking at digital billboards than static billboards, which is
indicative of visual distraction, and teens had significantly more time spent looking at all
billboard types compared to middle aged and older drivers. There was also an interaction of age
group and billboard type on visual distraction, meaning that teens were most likely to divert
more of their gaze towards billboards, especially if it was a digital billboard. Our findings show
that teen drivers spend a significantly greater percentage of their drive looking at billboards
compared to other age groups, regardless of the type of billboard presented. Other distracted
driving studies have also found that teens are most easily distracted visually by advertising
billboards, in-vehicle devices, and other devices such as cell phones compared to older age
groups, with teens also being more willing to engage in risky behaviors such as texting on a
phone while driving(Edquist et al., 2011; Klauer et al., 2014).
Older drivers had poorer performance in the recognition and recall tests compared to middle
aged drivers. Teen drivers performed better than older drivers on the recognition and recall tests,
82
in general, but not better than middle aged drivers. Surprisingly, although over half of the
participants rated billboards as distracting, they also reported high levels of focus and perceived
safety when passing billboards in the real world.
Participants reported that they found digital billboards more distracting than static billboards,
which is consistent with data results showing that participants spent significantly more time
looking at digital billboards compared to static billboards during the simulation. Teens reported
using a cell phone to text while driving more than other age groups, which is consistent with
other studies (Centers for Disease Control and Prevention [CDC], 2013b; Moreno, 2013).
However, the CDC (2013b) reported that middle age adults talk on a cell phone while driving
more than 18 to 24 year olds, which our results showed that teens talk on the phone while driving
more than middle aged adults. This may be due to the fact that our teen group consists of mostly
of 18 and 19 year olds.
Although drivers' eye gaze and attention was diverted from the road to billboards, very few road
edge excursions and vehicle collisions occurred when billboards were present. This may be due
to the fact that the presented simulation was a long, straight highway with no turns, only right
side billboard placement, and very few unexpected hazards, such as other cars cutting off the
driver or pedestrians crossing the street. Future studies should include such variables in driving
scenarios looking at billboard distraction.
Driving simulators provide a great benefit for research mainly due to experimental control. Road
conditions (turns, traffic, speed limits, etc.) are programmed to be consistent across all
participants. In contrast, naturalistic driving studies differ per participant, and cannot provide a
fair baseline to which to compare data across participants. Naturalistic studies do, however,
provide a realistic element to the experiment, which simulators cannot provide.
The results from this study can help inform future public policy relating to driver distraction and
billboards, especially in regards to regulations for billboard use. These findings offer support to
future interventions such as incorporating billboard awareness into driver education courses for
teen drivers, since younger drivers were most distracted out of all age groups.
6.6 Limitations
While the present study is among the first to consider the impact of billboards across the
lifespan, our teen group did not include many “novice” drivers (i.e., newly licensed drivers) but
rather consisted primarily of 18- and 19-year-olds, making it difficult to generalize our findings
to a younger, less experienced group of drivers. While driving simulators provide much needed
experimental control to test hypotheses with regard to driving safety, it is difficult to truly
ascertain the degree to which simulated driving performance models real world driving behavior
or how well the simulated billboards model real world billboards. For example, in the real-world,
digital billboards feature characteristic brightness and vividness that could capture the attention
of drivers; however, this is something that is difficult to emulate in the simulator. Although
participants provided an average realistic rating of the billboards presented in the simulation,
they looked at the billboards for a significant amount of time. Finally, we considered gazes but
not fixations, which may have been more indicative of cognitive processing of billboards.
83
Nevertheless, the driving simulator platform enabled us to view how participants might react to
the same billboard – something that would have been difficult to examine in a naturalistic driving
study. Participants were also not told that the study was examining billboard distraction, so we
were able to see participants’ natural behavior in passing billboards while driving in an
environment similar to that encountered in the local area.
Lack of significant results in performance degradation may be due to the fact that hazards were
not presented throughout the simulation - there were not ample opportunities to crash. Rather, the
simulation was a mundane driving situation. Speed exceedances seemed to have the largest
impact in this study, perhaps because the scenario was a straight road which could have been
interpreted as boring by participants. In addition, there was not a significant increase in road
edge excursions. Within lane deviation (i.e., RMS calculation) may have picked up subtleties in
swerving that went undetected. Future studies should look at this type of lane deviation as a
measure of driving performance.
Future studies may consider whether participants recall certain types of billboards (e.g., food
advertisements vs. public health announcements vs. variable message signs) more readily than
others or whether billboard placement (i.e., right vs. left) has a differential impact on driver
distraction. Studies could also consider what specific aspects of billboards (e.g. graphics,
slogans, and exit numbers) are more easily recalled or divert driver’s attention from the roadway
more readily.
This study is among the first to provide effects of age and billboard type on billboard distraction.
Although our study had a few limitations, the findings from the study have significant
implications for informing policy makers on the effect of billboard advertisement on cognitive
and visual distraction. Our study also gave rise to new questions that could further improve upon
our own study.
84
6.7 References
Alabama Outdoor Advertising Code, Ala. Code 1975 § 450-10-1.
American Automoblie Assoication [AAA]. (2013). How to help an older driver. Retrieved
October 19, 2013, from https://seniordriving.aaa.com/tools-additional-resources
Bendak, S., & Al-Saleh, K. (2010). The role of roadside advertising signs in distracting drivers.
International Journal of Industrial Ergonomics, 40(3), 233-236. doi:
10.1016/j.ergon.2009.12.001
Centers for Disease Control and Prevention [CDC]. (2011). State-based costs of deaths from
crashes Retrieved September 29, 2011, from
http://www.cdc.gov/Motorvehiclesafety/statecosts/index.html
Centers for Disease Control and Prevention [CDC]. (2012). Teen drivers: Fact sheet. National
Center for Injury Prenvention and Control, Division of Unintentional Injury Prevention.
Centers for Disease Control and Prevention [CDC]. (2013a). Distracted driving. National Center
for Injury Prevention and Control, Division of Unintentional Injury Prevention.
Centers for Disease Control and Prevention [CDC]. (2013b). Mobile device use while driving--
United States and seven European countries, 2011. Morbidity and Mortality Weekly Report,
62(10), 177-182.
Chattington, M., Reed, N., Basacik, D., Flint, A., & Parkes, A. (2009). Investigating driver
distraction: The effects of video and static advertising. Crowthorne, England: Transport Research
Laboratory.
Compton, R. P., & Ellison-Potter, P. (2008). Teen driver crashes: A report to Congress: National
Highway Traffic Safety Administration [NHTSA], US Department of Transportation [USDOT].
Crundall, D., Van Loon, E., & Underwood, G. (2006). Attraction and distraction of attention with
roadside advertisements. Accident Analysis & Prevention, 38, 671-677.
Divekar, G., Pradhan, A., Pollatsek, A., & Fisher, D. (2012). External distractions: Evaluation of
their effect on younger and experienced driver's behaviors and vehicle control. Paper presented
at the Transporation Research Board, Washington, DC.
Dukic, T., Ahlstron, C., Patten, C., Kettwich, C., & Kircher, K. (2013). Effects of electronic
billboards on driver distraction. Traffic Injury Prevention, 14(5), 469-476. doi:
10.1080/15389588.2012.731546
Edquist, J. (2008). The effects of visual clutter on driving performance. (PhD thesis), Monash
University. Retrieved from
http://arrow.monash.edu.au/vital/access/manager/Repository/monash:7883
85
Edquist, J., Horberry, T., Hosking, S., & Johnston, I. (2011). Effects of advertising billboards
during simulated driving. [Comparative StudyResearch Support, Non-U.S. Gov't]. Applied
Ergonomics, 42(4), 619-626. doi: 10.1016/j.apergo.2010.08.013
Goodwin, A. H., Foss, R. D., Harrell, S. S., & O'Brien, N. P. (2012). Distracted driving among
newly licensed teen drivers. AAA Foundation for Traffic Safety, i-43.
Hanowski, R. J. (2011). Towards developing a US-EU common distracted driving taxonomy:
Updating a naturalistic driving data coding approach. Virginia Tech Trasportation Institute: The
National Surface Transportation Safety Center for Excellence.
Klauer, S. G., Guo, F., Simons-Morton, B. G., Ouimet, M. C., Lee, S. E., & Dingus, T. A. (2014).
Distracted driving and risk of road crashes among novice and experienced drivers. The New
England Journal of Medicine, 370(1), 54-59. doi: 10.1056/NEJMsa1204142.
Lee, S. E., McElheny, M. J., & Gibbons, R. (2007). Driving performance and digital billboards:
Final report: Prepared for: Foundation for Outdoor Advertising Research and Education by the
Virginia Tech Transportation Institute [VTTI], Center for Automotive Safety Research.
Marciano, H., & Yeshurun, Y. (2012). Perceptual load in central and peripheral regions and its
effects on driving performance: Advertising billboards. Work: A Journal of Prevention,
Assessment and Rehabilitation, 41 Suppl 1. doi: 10.3233/wor-2012-0580-3181
McGwin, G., & Brown, D. B. (1999). Characteristics of traffic crashes among young, middle-
aged, and older drivers. Accident Analysis & Prevention, 31(3), 181-198. doi: 10.1016/S0001-
4575(98)00061-X.
Moreno, M. A. (2013). Distracted driving and motor vehicle crashes among teens. JAMA
Pediatrics, 167(10), 984. doi: 10.1001/jamapediatrics.2013.3475.
National Highway Traffic Safety Administration [NHTSA]. (2013). Traffic safety facts: Research
Note. (DOT HS 811 737). Washington, DC: National Highway Traffic and Safety
Administration's National Center for Statistics and Analysis.
National Highway Traffic Safety Administration [NHTSA]. (2012). Traffic Safety Facts:
Speeding 2010 Data: US Department of Transportation [USDOT].
Olsen, E. O., Shults, R. A., & Eaton, D. K. (2013). Texting while driving and other risky motor
vehicle behaviors among US high school students. Pediatrics, 131(6), e1708-e1715. doi:
10.1542/peds.2012-3462
Outdoor Advertising Association of America [OAAA]. (2013). Out of home media formats:
Number of out of home displays (2013), October 14, 2013, from
http://www.oaaa.org/OutofHomeAdvertising/OOHMediaFormats/OOHMediaFormats.aspx
86
Smiley, A., Smahel, T., & Eizenman, M. (2004). The impact of video advertising on driver
fixation patterns. Transportation Research Record, 1899(2004 Driver and Vehicle Simulation,
Human Performance, and Information Systems for Highways; Railroad Safety; and Visualization
in Transportation), 19.
Tzeng, O. J. L. (1973). Positive recency effect in a delayed free recall. Journal of Verbal
Learning and Verbal Behavior, 12(4), 436-439. doi: 10.1016/S0022-5371(73)80023-4.
Young, M., & Mahfoud, J. (2007). Driven to distraction: Determining the effects of roadside
advertising on driver attention. Brunel University: Ergonomics Research Group.

87
CHAPTER 7
CONCLUSIONS AND RECOMMENDATIONS
7.1 Conclusions
7.1.1 Crash Analysis Conclusions
The impact of digital billboard on traffic safety (in terms of driver distraction) on high-speed,
limited-access facilities was explored at ten study sites in Florida and eight sites in Alabama. The
methodology of crash investigation in both states relied on comparing the crash rate statistics
upstream and downstream each billboard location. The upstream and downstream segments at
each billboard location were selected so that they experienced the same traffic and geometric
conditions, i.e., number of lanes, roadside features, no weaving maneuvers, etc. In Florida, 377
crashes were used in the analysis, whereas 77 crashes were used in the analysis in Alabama. The
crash data analysis in both states revealed that the presence of digital billboards increased the
overall crash rates in areas of billboard influence compared to control areas downstream of the
digital billboard locations. The overall result suggested that the increase was in the range of 25%
(Florida) to 29% (Alabama) although the site specific change was varying. Also, certain types of
crashes often linked to driver distraction (such as fixed object, side-swipe, and rear-end) were
clearly overrepresented at the DBB influence zones studied.
7.1.2 Survey of Motorists Conclusions
The online questionnaire survey included a total of 22 questions that assessed several variables
of interest. In aggregate, 295 respondents from Alabama and 429 respondents from Florida
participated in this survey. After omission of incomplete questionnaire responses, responses of
231 participants from Alabama and 285 participants from Florida across the lifespan were used
for analysis. The survey results revealed that younger drivers have a significant agreement rate
on the distraction caused by the billboards in general. Moreover, young to middle aged drivers
and oldest drivers usually have a long glance at digital billboards but rarely slow down. Another
interesting finding is that the upper middle age to older population groups (56 to 65 and greater
than 65 years) were more likely to use information from digital billboards but used the
information infrequently. The online survey also suggested that more than half of the drivers
looked at digital billboards for a sufficiently long time (though ‘sometimes’), but the vast
majority of the drivers barely slowed down. This particular finding may raise concern about the
safety of the drivers. In the end, survey responders emphasized the need for stricter regulation of
DBBs and restriction of size and frequency of placement for the benefit of traffic safety. The chi-
square test has been performed across age groups and genders discretely. There was no
statistically significant difference in the responses among the drivers of different age groups or in
between the genders.
7.1.3 Driving Simulator Study Conclusions
The driving simulator study examined the impact of roadside advertising billboard distraction in
88
individuals across the lifespan. In general, driving segments which contained billboards tended
to negatively impact driver visual attention than segments without billboards. Participants,
regardless of age, spent significantly more time looking away from the roadway and at digital
billboards as compared to static billboards. Consistent with driving simulator findings, a survey
of participants further revealed that participants reported the digital billboards more distracting
than static billboards. Findings suggested that teen drivers, in particular, looked significantly
longer at all billboards (static and digital) while driving than any other age group. These findings
offer recommendations for interventions such as incorporating billboard awareness into driver
education courses for teen drivers, since younger drivers tended to be the most visually distracted
by billboards while driving.
7.2 Implications for Practice
Although the crash analysis in Florida and Alabama consistently revealed that the impact of
digital billboards on traffic safety varies from site to site, there is still a correlation between
driver distraction and traffic safety. Digital billboard manufacturers should design such
billboards with the minimal amount of animations to minimize the impact of distraction on
drivers. It is also recommended to avoid installing digital billboards on sections with horizontal
and vertical alignments and locations with high historical number of crashes to significantly
diminish the impact of driver distraction.
Among other findings, the survey of users highlights the need for better regulation of digital
advertising billboards in the future. The study recommends reevaluation of current legislation
and regulation for controlling outdoor advertising both at the federal and state level. Updates of
regulations shall consider restrictions in the frequency, placement and operation of digital
advertising billboards in order to protect the safety of the public and reduce unnecessary
cluttering and visual pollution.
7.3 Limitations and Future Research
It should be noted that the findings from the crash analysis in the states of Florida and Alabama
were based on relatively small sample of locations and relatively small segment lengths. It is
recommended to validate the results of the crash analysis using larger sample sizes and longer
segments. Future research could compare the findings of the crash analysis in Alabama and
Florida with other states to determine how the impact of digital billboard on traffic safety varies
across states. Crash analysis on other roadway facilities that carry digital advertising billboards,
e.g., arterials can be also conducted to evaluate the potential safety impacts on DBB in such
settings. Future simulator studies may consider whether certain types of billboards (e.g., food
advertisements vs. public health announcements vs. variable message signs) evoke significantly
more driver distraction than others or whether billboard placement (i.e., right vs. left) has a
differential impact. Studies could also consider what specific aspects of billboards (e.g. graphics,
slogans, and exit numbers) divert drivers’ attention from the roadway more readily.