Digi.Com Berhad 425190-Xdigi.listedcompany.com/misc/presentation/presentation3Q17.pdf · 17 Oct...
27
1 Digi.Com Berhad 425190-X 3Q 2017 Earnings Call 17 Oct 2017
-
Upload
dinhnguyet -
Category
Documents
-
view
224 -
download
7
Transcript of Digi.Com Berhad 425190-Xdigi.listedcompany.com/misc/presentation/presentation3Q17.pdf · 17 Oct...

1
Digi.Com Berhad 425190-X
3Q 2017 Earnings Call 17 Oct 2017

2
Key Highlights
Operational & Performance Review
2017 Outlook
Q&A
3
Financial Highlights
3Q 2017 STRONGER SEQUENTIAL PERFORMANCE with 46% EBITDA margin
Key Highlights
46% EBITDA Margin
4.9 sen Dividend Per Share
Stabilised q-q Prepaid Revenue
1.6% q-q Service Revenue
(Narrowed y-y decline)
8.3% q-q Internet Revenue
(15.6% y-y )
3.9% q-q Postpaid Revenue
(13.9% y-y )
Operational Highlights
Stronger 4G Plus network with
LTE 900Mhz
Efficient capex management
Robust coverage with efficient capex
87% 4G-LTE; 49% LTE-A
+227K internet subscribers
to 8.5 million

4
DATA TRAFFIC growth 1.6x y-y and 0.2x q-q
3Q 2017 BETTER MONETISATION AND INTERNET REVENUE fuelled by relentless internet and digital proposition
Key Highlights
69% 4G subscribers among
smartphone users
2.2 million Monthly active MyDigi users
17.7 million Upsell transactions
in 3Q17
GROWING 4G SUBSCRIBERS
597 616 621 637 690
64% 65% 68% 69%
71%
50%
55%
60%
65%
70%
75%
80%
85%
90%
300
350
400
450
500
550
600
650
700
750
3Q16 4Q16 1Q17 2Q17 3Q17
Internet Rev SmartPh %
8.3% Q-Q AND 15.6% Y-Y INTERNET REVENUE GROWTH
STRONGER MONETISATION HIGHLY ENGAGED USERS
GROWING UPSELL TRANSACTIONS
72.0% of 11.9 million subscribers
INCREASING ACTIVE INTERNET USERS

5
9M17 Capex ex-Spectrum: RM578m
3Q 2017 ADVANCING NETWORK COVERAGE AND QUALITY with efficient capex spending
Key Highlights
Leading on LTE-A network
coverage
49%
EXTENSIVE LTE 2600MHZ OVERLAY SITES
ENHANCED QUALITY POST LTE900MHZ
STRONGER NETWORK PERCEPTION
BETTER INTERNET SPEED AND EXPERIENCE
DEPLOYMENT OF LTE 900MHZ OVERLAY SITE
Stronger data traffic in LTE 900Mhz overlay sites
• Better Indoor Signal • Wider Outdoor Coverage • Better Network Capacity
Consistent LTE speed ~10Mbps, 80%
of the time
Improvement in average download speed
2.5 3.0 3.7 5.0 6.0 -
1.0
2.0
3.0
4.0
5.0
6.0
7.0
3Q16 4Q16 1Q17 2Q17 3Q17
HIGHER AVERAGE DATA PER USER (GB)

6
3Q 2017 SOLIDIFIED INTERNET PROPOSITION to grow internet usage and revenue across prepaid and postpaid
Operational Review
Prepaid • Simplification of internet portfolio with robust offers to drive
stronger monetisation and recurring internet revenue - Affordable weekly and monthly internet passes - Easy, worry-free one time internet passes
• Further capitalised on the Telenor Friends value position • Strengthened internet adoption and usage among migrant
segment
Postpaid • Accelerated postpaid acquisition and growth momentum via
- Easy entry postpaid plans and bundles - Digi Postpaid Family plans - Robust 4G Plus network and ‘Freedom to Internet’
proposition • Leveraged on online channel as an extended sales channel for
exclusive deals • Enabled the convenience to pay purchases on Apple App Store
and Google Play Store using Digi Direct Billing

7
• Sequential service revenue climbed 1.6% while y-y decline narrowed to 5.0%
- All-time high postpaid revenue and stabilised q-q prepaid revenue
- Robust internet revenue growth of 8.3% q-q and 15.6% y-y to RM690 million
• Active internet subscribers climbed to 8.5 million or
72.0% while smartphone users surged to 71.1% - Solid increase in LTE subscribers to 5.7 million
(3Q16: 3.7 million) led by robust 4G Plus network and relentless focus on ‘Freedom To Internet’ proposition
• High prepaid rotational churn leveled subscriber base although partially mitigated by stronger Malaysians and internet base while ARPU remained stable with healthy margins
• Improved growth momentum across postpaid and prepaid into 2H17 narrowed y-y decline for 9M17 service revenue to 5.7%
12,249 12,299 11,776 12,030 11,852
7,961 8,088 8,056 8,311 8,538
3Q16 4Q16 1Q17 2Q17 3Q17
1,554 1,555 1,472 1,453 1,476
Subscribers (‘000)
Service revenue (RM m)
41 42 40 41 41 ARPU (RM)
Internet
Non-Internet
3Q 2017 HIGHER Q-Q SERVICE REVENUE backed by solid internet revenue growth
Performance Review
BLENDED

8
• Stronger network capabilities now enhanced with LTE 900Mhz continued to fuel solid postpaid acquisitions, internet usage and subscriptions
• Sustained record high acquisition momentum with net adds of 103K to 2.4 million postpaid subscribers
- Postpaid internet subscribers surged 5.4% q-q and 29.7% y-y to 2.1 million or 89.7%
• Postpaid revenue rose 3.9% q-q and 13.9% y-y with
continued solid demand for Digi’s affordable internet plans - Postpaid internet revenue increased 7.9% q-q and
30.9% y-y to RM326 million
• Postpaid ARPU levelled to RM77 on the back of larger postpaid subscriber base supported by strong demand from the new postpaid plans
• Well-positioned to continue to grow postpaid with robust 4G Plus network proposition
1,994 2,099 2,189 2,292 2,395
1,657 1,821 1,923 2,038 2,149
3Q16 4Q16 1Q17 2Q17 3Q17
489 511 520 536 557
80 81 79 78 77
Subscribers (‘000)
Service revenue (RM m)
ARPU (RM)
Internet
Non-Internet
3Q 2017 SOLID POSTPAID GROWTH MOMENTUM with close to 2.4 million postpaid subscribers
Performance Review
POSTPAID
9
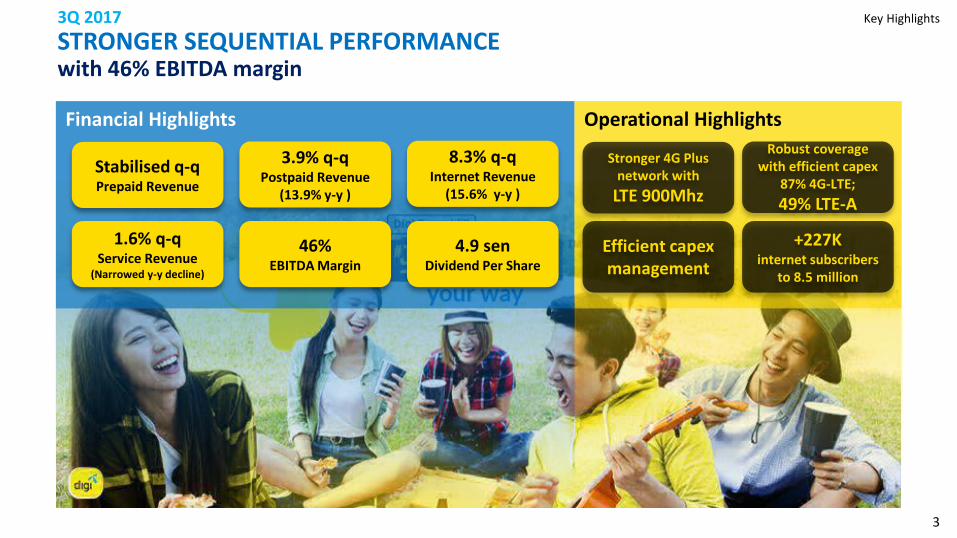
• Digi Prepaid LiVE’s strong internet offers spurred higher acquisition of Malaysian prepaid subscribers
- Prepaid internet subscribers surged 116K to 6.4 million or 67.6%
- Prepaid internet revenue reached a new high with 8.7% q-q and 4.6% y-y growth to RM364 million or 39.6% of prepaid revenue
• Festive and public holidays boosted higher demand for
prepaid internet plans and passes during the quarter
• Prepaid service revenue stabilised q-q, up 0.2% anchored by solid internet revenue growth amid lower IDD migrant subscribers and declining legacy prepaid voice and messaging revenue q-q and y-y
• Prepaid ARPU remained steady at RM32 q-q with higher contribution from prepaid internet revenue
10,255 10,200 9,587 9,738 9,457
6,304 6,267 6,133 6,273 6,389
1,065 1,044 952 917 919
34 34 32 32 32
Subscribers (‘000)
Service revenue (RM m)
ARPU (RM)
Internet
Non-Internet
3Q 2017 STABILISED Q-Q PREPAID REVENUE with stronger prepaid internet revenue growth
Performance Review
PREPAID

10
3Q 2017 EFFICIENT COST MANAGEMENT with improved 9M17 opex
8.8% 10.0% 9.9% 10.2% 8.9% 4.1% 3.6% 4.1% 4.3% 4.4% 7.9% 8.0% 8.6% 8.8% 9.1% 7.7% 7.1% 6.6% 4.1% 6.8% 3.9% 4.6% 4.4% 4.5% 4.3%
3Q16 4Q16 1Q17 2Q17 3Q17
OthersUSOO&MStaffS.Mktg
32.1% 33.2% 33.3% 31.7% 33.3% 32.4% 33.3% 33.6% 31.9% 33.5%
345 412 373 375 352
503 519 494 464 494
848 931 867 839 846
3Q16 4Q16 1Q17 2Q17 3Q17
• Cost of goods sold (COGS) trimmed 6.1% q-q mainly due to lower device bundled sales and decrease in domestic and international voice traffic volumes
• On the back of stronger sequential service revenue and leaner q-q COGS, gross profit improved 3.5% q-q
• Opex to service revenue remained steady at 33.5% and well controlled amid network expansion and data traffic growth
- Relatively higher q-q due to effects from one-off saving on network related cost in 2Q
- Sales and marketing cost trended seasonally lower from lower market activities similar to same quarter last year
• 9M17 opex decline altered historical y-y increasing opex trend in line with opex ambition of 1-3% y-y improvement
1Net opex = Opex + Forex/FV changes + Other income
Net opex1
Opex
Performance Review
Total cost (RM m) Opex COGS
TOTAL COST (RM m)
OPEX - % OF SERVICE REVENUE

11
775 741 711 717 727
48% 44% 45% 46% 46%
0%
20%
40%
60%
80%
100%
-
200
400
600
800
1,000
3Q16 4Q16 1Q17 2Q17 3Q17
• EBITDA strengthened 1.4% q-q to RM727 million, supported by stronger service revenue and efficient cost management
• EBITDA margin remained strong at 46%, although 1.6pp lower than a year ago due to relatively weaker IDD margin and higher device revenue
• Profit before tax rose 5.8% q-q to RM511 million as a flow through from stronger sequential EBITDA and after accounting for
– Relatively lower q-q finance cost due to savings from lower debt exposure and FV gains from IRS
– 6.2% q-q higher depreciation to RM206 million, with the commencement of 900Mhz and 1800Mhz spectrum amortisation
• Profit after tax (PAT) climbed 7.2% q-q to RM385 million while PAT margin stood healthy at 25%
438 375 373 359 385
27% 22% 24% 23% 25%
-10%10%30%50%70%90%
- 100 200 300 400 500
3Q16 4Q16 1Q17 2Q17 3Q17
Performance Review 3Q 2017 STRONGER Q-Q EBITDA WITH 46% MARGIN and 7.2% q-q PAT growth
EBITDA AND MARGIN (RM m and %)
PAT AND MARGIN (RM m and %)
12
202 240
197 229
152
13% 15% 13% 16% 10%
0%
10%
20%
30%
- 50
100 150 200 250 300
3Q16 4Q16 1Q17 2Q17 3Q17
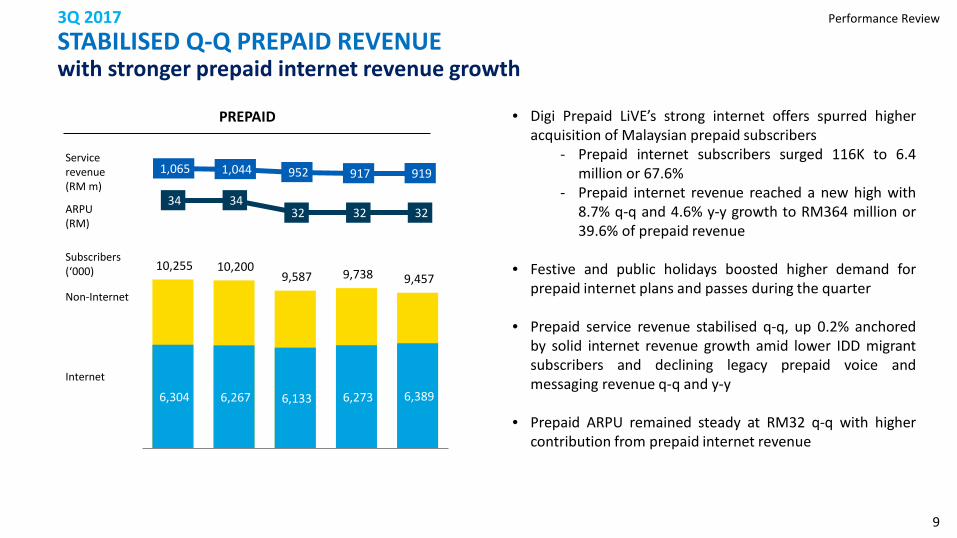
• Ops cashflow increased 17.8% q-q and 0.3% y-y to RM575m or 37% margin, the strongest level in the last 4 quarters on the back of stronger EBITDA and efficient capex management
• After accelerating network deployment efforts in 1H17, capex spent for current quarter trimmed to RM152 million, as planned, with 9M17 cumulative investment at RM578m or 13.1% of service revenue
• 4G LTE and LTE-A network coverage reached 87% and 49% of population backed by robust fiber network nationwide
– Intensified rollout of LTE 900Mhz sites to further improve indoor 4G network coverage
– Built solid capabilities to support growing data demand and y-y data traffic growth of 1.6x
• Global sourcing synergies, strategic focus on efficient
operations and digitisation of core business continued to provide cost levers to deliver competitive infrastructure capabilities
573 501 514 488
575
35% 30% 33% 31%
37%
0%
10%
20%
30%
40%
50%
(100)
100
300
500
700
3Q16 4Q16 1Q17 2Q17 3Q17
Performance Review 3Q 2017 HIGHER Q-Q AND Y-Y OPS CASH FLOW backed by efficient capex management
OPS CASH FLOW AND MARGIN (RM m and %)
CAPEX1 AND MARGIN (RM m and % of service revenue)
1 Exclude spectrum cost

13
5.6 4.8 4.7 4.6 4.9
5.6 4.8 4.8 4.6 5.0
100% 100% 98% 100% 99%
0%
20%
40%
60%
80%
100%
120%
-
5.0
10.0
3Q16 4Q16 1Q17 2Q17 3Q17DPS EPS
3Q16 4Q16 1Q17 2Q17 3Q17 Total Assets 4,739 5,498 5,729 5,996 5,869
Total Equity 580 519 519 513 540
Interest-bearing debts 1,461 2,282 2,558 1,810 1,802
Islamic debts 0 0 0 899 899
Cash & cash equivalents 331 377 479 628 661
Payout Ratio
Performance Review
• Earnings per share (EPS) tracked 8.7% higher q-q to 5.0 sen with cumulative EPS for the financial year at 14.4 sen
• The Board of Directors declared 3rd interim dividend of 4.9 sen per share equivalent to RM381 million, payable to shareholders on 22 December 2017
• Total assets remained relatively stable q-q while y-y
increase mainly contributed by one-time fee for 900Mhz and 1800Mhz spectrum bands and continued investments to support 4G Plus network expansion
• Digi’s net debt to EBITDA ratio remained healthy at 0.7 times while balance sheet continued to demonstrate solid financial capability and flexibility to fund immediate as well as future investments and operational commitments
3Q 2017 HEALTHY SHAREHOLDERS RETURN and strong balance sheet
EPS AND DPS (sen)
BALANCE SHEET (RM m)

14
Other Updates 3Q 2017 SOLID DEBT PROFILE with healthy net debt/EBITDA ratio < 1.0x
DEBT RATIOS
Conven-tional 66%
Islamic 34%
DEBT1 PROFILE (RM m)
1 Exclude finance lease
30% 41% 44%
30% 30%
0.4 0.6 0.7 0.7 0.7
0%
5%
10%
15%
20%
25%
30%
35%
40%
45%
50%
(0.9)
(0.7)
(0.5)
(0.3)
(0.1)
0.1
0.3
0.5
0.7
3Q16 4Q16 1Q17 2Q17 3Q17
4Q16 and 1Q17 Drawdown of existing loan facility for 900Mhz and 1800Mhz spectrum fees 2Q17 Establishment of RM5 billion Islamic bond facilities (Sukuk) to enhance funding flexibility to support the business and growth opportunities
Net debt/ EBITDA (x) Conventional debt1/ Total Assets

15
Other Updates 3Q 2017 CUSTOMER FIRST DAY CELEBRATION with 1,200 Digizens on nationwide customer engagement
Customer First Day (CFD) 21 Sep 2017
Telenor BoD and senior management joined Digizens to meet customers.
Talking to customers is crucial for us to better understand how we can continue delivering better customer experiences.
Our customers’ honest feedback and willingness to openly engage with us inspires us to be better, particularly in our mission to transform Digi into a Digital Services Provider.
Customer First Day serves as a strong reminder of what’s truly important to our business – our customers, and the need to bring the best of the internet to them.

16
Other Updates 3Q 2017 SUSTAINING MOMENTUM for our Empower Societies program
DIGITAL CITIZENSHIP
Townhalls with experts from UNICEF, PDRM and R.AGE on
cybergrooming in schools nationwide
Partnership with Ministry of
Education
EMPOWERING WOMEN
Working with Women of Will (WoW) to explore how Vcash
can be used to collect repayment of microcredit
loan.
DIGITAL ENABLEMENT
Digi ‘Schools in Hospital’
programme
Back-end Online Platform for Social Enterprises – starting with Batik Boutique in 3Q
17
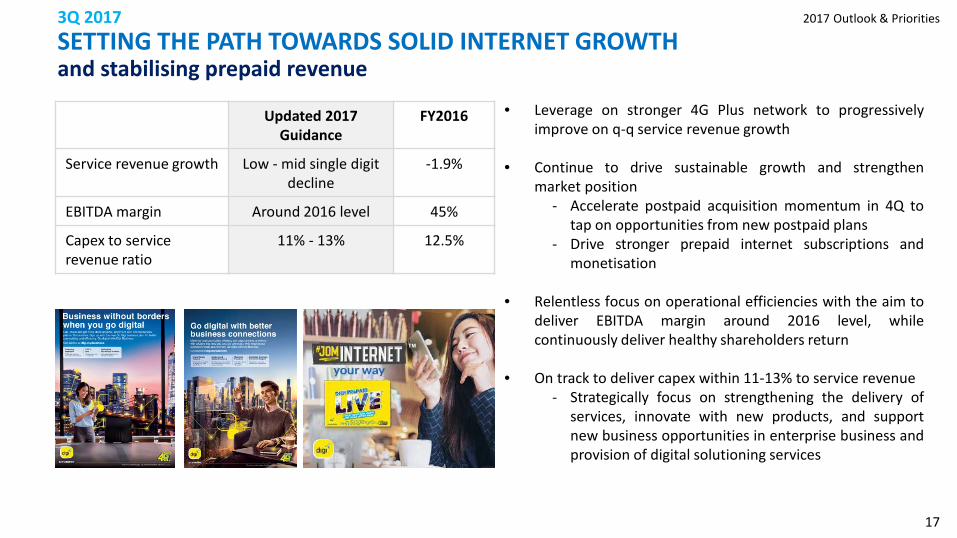
• Leverage on stronger 4G Plus network to progressively improve on q-q service revenue growth
• Continue to drive sustainable growth and strengthen market position
- Accelerate postpaid acquisition momentum in 4Q to tap on opportunities from new postpaid plans
- Drive stronger prepaid internet subscriptions and monetisation
• Relentless focus on operational efficiencies with the aim to deliver EBITDA margin around 2016 level, while continuously deliver healthy shareholders return
• On track to deliver capex within 11-13% to service revenue - Strategically focus on strengthening the delivery of
services, innovate with new products, and support new business opportunities in enterprise business and provision of digital solutioning services
2017 Outlook & Priorities
Updated 2017 Guidance
FY2016
Service revenue growth Low - mid single digit decline
-1.9%
EBITDA margin Around 2016 level 45%
Capex to service revenue ratio
11% - 13% 12.5%
3Q 2017 SETTING THE PATH TOWARDS SOLID INTERNET GROWTH and stabilising prepaid revenue

18
Q&A

19
Disclaimer
This presentation and the following discussion may contain forward looking statements by Digi.Com Berhad (Digi) related to financial trends for future periods. Some of the statements contained in this presentation or arising from this discussion which are not of historical facts are statements of future expectations with respect to financial conditions, results of operations and businesses, and related plans and objectives. Such forward looking statements are based on Digi’s current views and assumptions including, but not limited to, prevailing economic and market conditions and currently available information. These statements involve known and unknown risks and uncertainties that could cause actual results, performance or achievements to differ materially from those in the forward looking statements. Such statements are not and, should not be construed, as a representation as to future performance or achievements of Digi. In particular, such statements should not be regarded as a forecast or projection of future performance of Digi. It should be noted that the actual performance or achievements of Digi may vary significantly from such statements.

21
Appendix

22
NO. OF DEVICES SOLD
3Q 2017
15.6% Y-Y INTERNET REVENUE GROWTH amid stronger internet and smartphone adoption
77 73
108
150
120
3Q16 4Q16 1Q17 2Q17 3Q17
65.0% 65.8% 68.4% 69.1% 72.0%
63.7% 64.7% 68.0% 68.6% 71.1%
Appendix
597 616 621 637 690
104 100 94 91 88 34 38 36 36 36 735 754 751 764
814
3Q16 4Q16 1Q17 2Q17 3Q17
Data Rev (RM m) VAS Messaging Internet
% of internet subscribers % smartphone subscribers
DATA REVENUE AND PENETRATION

23
3Q 2017
REPORTED KEY OPERATING PERFORMANCE KPIS
(RM m) 3Q17 2Q17 1Q17 4Q16 3Q16 2Q16 1Q16 4Q15 3Q15 Q-o-Q Y-o-Y
Subscribers (‘000) 11,852 12,030 11,776 12,299 12,249 12,347 12,336 12,125 11,675 -1.5% -3.2% Internet subscribers (‘000) 8,538 8,311 8,056 8,088 7,961 7,965 7,917 7,502 7,024 2.7% 7.2%
MOU 175 176 173 179 182 203 217 221 226 -0.6% -3.8% Revenue 1,570 1,552 1,574 1,670 1,619 1,655 1,653 1,725 1,675 1.2% -3.0% Mobile serv. revenue 1,476 1,453 1,472 1,555 1,554 1,557 1,560 1,587 1,584 1.6% -5.0%
EBITDA 727 717 711 741 775 735 704 701 719 1.4% -6.2%
EBITDA margin 46% 46% 45% 44% 48% 44% 43% 41% 43% 0.1pp -1.6 pp Depreciation & Amortisation (206) (194) (176) (178) (174) (143) (156) (169) (170) 6.2% 18.4%
EBIT 521 523 535 563 601 592 548 532 549 -0.4% -13.3% Net finance (costs)/income (10) (40) (25) (19) (16) (16) (14) (13) (12) -75.0% -37.5%
Profit Before Tax 511 483 510 544 585 576 534 519 537 5.8% -12.6% Taxation 126 124 137 169 147 155 135 137 140 1.6% -14.3%
Profit After Tax 385 359 373 375 438 421 399 382 397 7.2% -12.1%
EPS (sen) 5.0 4.6 4.8 4.8 5.6 5.4 5.1 4.9 5.1 8.7% -10.7%
Prepaid ARPU (RM) 32 32 32 34 34 34 35 38 38 0.0% -5.9% Postpaid ARPU (RM) 77 78 79 81 80 82 80 80 81 -1.3% -3.8% Blended ARPU (RM) 41 41 40 42 41 42 42 44 45 0.0% 0.0%
Appendix

24
3Q 2017
REVENUE COMPOSITION
(RM m) 3Q17 2Q17 1Q17 4Q16 3Q16 2Q16 1Q16 4Q15 3Q15 Q-o-Q Y-o-Y
REVENUE 1,570 1,552 1,574 1,670 1,619 1,655 1,653 1,725 1,675 1.2% -3.0%
Mobile serv. revenue 1,476 1,453 1,472 1,555 1,554 1,557 1,560 1,587 1,584 1.6% -5.0%
Voice revenue 662 689 721 801 819 849 866 891 893 -3.9% -19.2%
Data revenue 814 764 751 754 735 708 694 696 691 6.5% 10.7%
Internet 690 637 621 616 597 562 539 535 530 8.3% 15.6%
Messaging 88 91 94 100 104 110 117 119 112 -3.3% -15.4%
VAS 36 36 36 38 34 36 38 42 49 0.0% 5.9% Device and other revenue 94 99 102 115 65 98 93 138 91 -5.1% 44.6%
Prepaid Revenue 919 917 952 1,044 1,065 1,065 1,096 1,137 1,141 0.2% -13.7%
Voice revenue 485 511 541 613 631 655 680 708 713 -5.1% -23.1%
Data revenue 434 406 411 431 434 410 416 429 428 6.9% 0.0%
Postpaid Revenue 557 536 520 511 489 492 464 450 443 3.9% 13.9%
Voice revenue 177 178 180 188 188 194 186 183 180 -0.6% -5.9%
Data revenue 380 358 340 323 301 298 278 267 263 6.1% 26.2%
Appendix

25
3Q 2017
COGS AND OPEX
(RM m) 3Q17 2Q17 1Q17 4Q16 3Q16 2Q16 1Q16 4Q15 3Q15 Q-o-Q Y-o-Y
COGS 352 375 373 412 345 403 481 537 464 -6.1% 2.0%
Cost of materials 100 120 116 113 72 91 103 156 98 -16.7% 38.9%
Traffic charges 252 255 257 299 273 312 378 381 366 -1.2% -7.7%
OPEX 494 464 494 519 503 509 482 490 470 6.5% -1.8%
Sales & marketing 131 149 145 156 137 134 144 157 142 -12.1% -4.4%
Staff costs 65 63 61 56 64 72 64 63 68 3.2% 1.6%
Operations & maintenance 134 128 127 125 122 124 96 96 98 4.7% 9.8%
Other expenses 164 124 161 182 180 179 178 174 162 32.3% -8.9%
USP fund and license fees 101 59 97 111 120 116 116 112 102 71.2% -15.8%
Credit loss allowances 10 9 10 12 12 13 14 14 12 11.1% -16.7%
Others 53 56 54 59 48 50 48 48 48 -5.4% 10.4%
TOTAL 846 839 867 931 848 912 963 1,027 934 0.8% -0.2%
Appendix

26
(RM m) 3Q17 2Q17 1Q17 4Q16 3Q16 2Q16 1Q16 4Q15 3Q15 Q-o-Q Y-o-Y
Cash at start 628 479 377 331 366 503 234 306 303 31.1% 71.6%
Cash flow from operations 625 664 518 524 738 728 546 535 523
Changes in working capital 514 (73) (127) (634) (190) (103) (77) 72 98
Cash flow used in investing activities (743) (224) (190) (232) (199) (162) (168) (280) (218)
Cash flow used in financing activities (363) (218) (98) 387 (384) (599) (31) (396) (409)
Net change in cash 33 149 103 45 (35) (136) 270 (69) (6)
Effect of exchange rate changes on cash and cash equivalents
- - (1) 1 0 (1) (1) (3) 9
Cash at end 661 628 479 377 331 366 503 234 306 5.3% 99.7%
Capex1 152 229 197 240 202 167 171 288 223 -33.6% -24.8% Ops cash flow (EBITDA – Capex) 575 488 514 501 573 568 533 413 496 17.8% 0.3%
Ops cash flow margin 37% 31% 33% 30% 35% 34% 32% 24% 30% 5.2pp 1.2pp
3Q 2017
CASH FLOW STATEMENT Appendix
1 Exclude 900Mhz and 1800Mhz spectrum cost
27
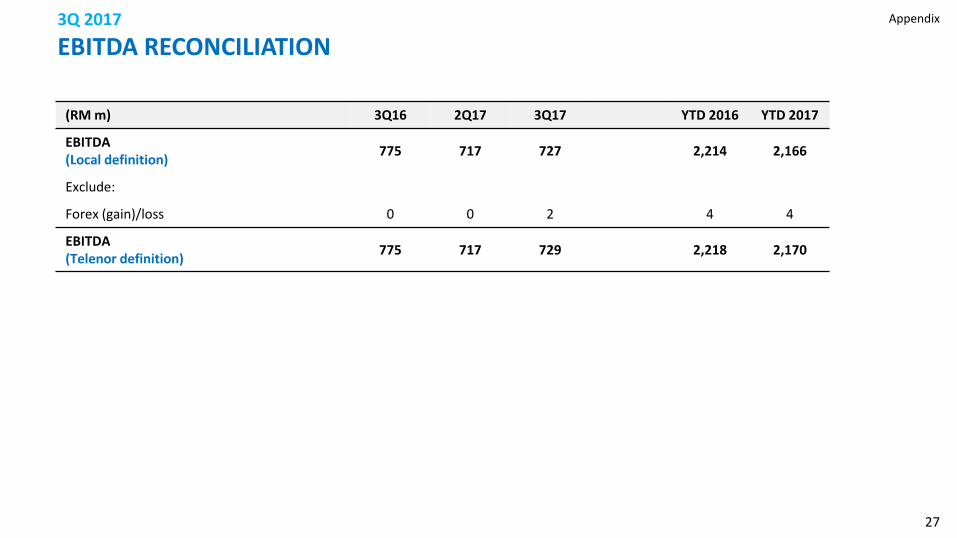
3Q 2017
EBITDA RECONCILIATION
(RM m) 3Q16 2Q17 3Q17 YTD 2016 YTD 2017
EBITDA (Local definition) 775 717 727 2,214 2,166
Exclude:
Forex (gain)/loss 0 0 2 4 4
EBITDA (Telenor definition) 775 717 729 2,218 2,170
Appendix