
Diggers N Dealers 2011 Presentation
27
DIGGERSPRESENTATION AUGUST2011 ChrisReed– ManagingDirector ASX:RDR www.reedresources.com
-
Upload
reed-resources-ltd -
Category
Documents
-
view
215 -
download
0
description
Presentation made at the 2011 Diggers n Dealers Forum in Kalgoorlie, Western Australia by Reed Resources Ltd
Transcript of Diggers N Dealers 2011 Presentation

Page�1
DIGGERS�PRESENTATION
AUGUST�2011
Chris�Reed�– Managing�Director
ASX:�RDR
www.reedresources.com

Page�2
Important�Notice
Disclaimer
This�document�has�been�prepared�by�Reed�Resources�Ltd�(“Reed” or�“the�Company”)�to�provide�an�update�of�the�Company�to�investors�and�potential�new�shareholders.
Any�statements,�opinions,�projections,�forecasts�or�other�material�contained�in�this�document�do�not�constitute�any�commitments,�representations�or�warranties�by�Reed�and�associated�entities�or�its�directors,�agents�and�employees.�Except�as�required�by�law,�and�only�to�the�extent�so�required,�directors,�agents�and�employees�of�Reed�shall�in�no�way�be�liable�to�any�person�or�body�for�any�loss,�claim,�demand,�damages,�costs�or�expenses�of�whatsoever�nature�arising�in�any�way�out�of,�or�in�connection with,�the�information�contained�in�the�document.
This�document�includes�certain�statements,�opinions,�projections,�forecasts�and�other�material,�which�reflect�various�assumptions.�The�assumptions�may�or�may�not�prove�to�be�correct.�Recipients�of�the�document�must�make�their�own�independent�investigations,�consideration�and�evaluation�of�the�opportunity�to�invest�in�the�Company. By�accepting�this�document�the�recipient�agrees�that�if�it�proceeds�further�with�its�investigations,�consideration�or�evaluation�of�the�opportunity�to�invest�in�the�Company�it�shall�make�and�rely�solely�upon�its�own�investigations�and�inquiries�and�will�not�in�any�way�rely�upon�the�document.
All�figures�in�this�document�are�in�Australian�dollars�(AUD)�unless�stated�otherwise.

Page�3
Market�Capitalisation
Last�price�(29�July�11) $ 0.44
Shares�on�issue $ 262.2
Market�capitalisation $m 115
Cash�(est.�end�July) $m 16.6
Debt $m 0.0
Enterprise�value $m ~100
� Reed�Resources�Ltd�(ASX:�RDR)�is�a�WA�focused�resource�developer
� Proven�strategy�to�acquire�and�develop�undervalued�assets across�varying�commodities�
� 3�company�making�projects across�gold,�lithium�and�vanadium
12�Month�Share�Price
Background
Reed�Corporate�Snapshot
Substantial�Shareholders
David�Reed 8%
M�&�G/Vanguard 5%
SG�Hiscock 5%
Page�4
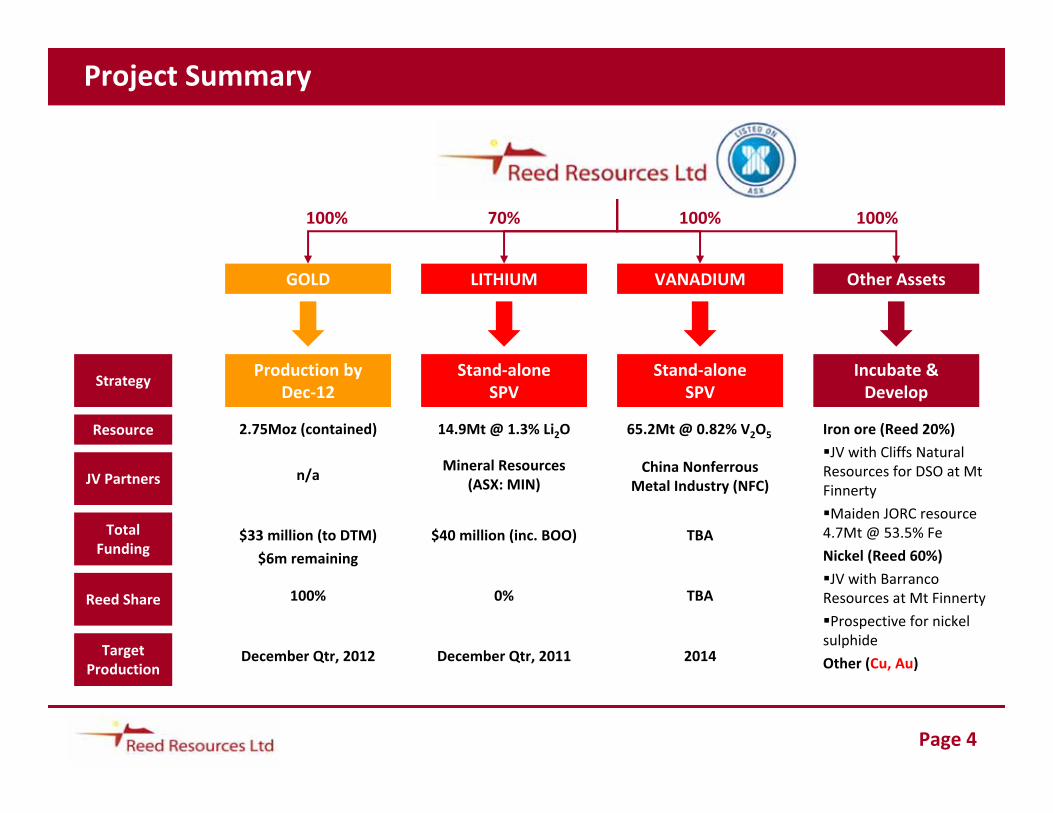
Project�Summary
GOLD LITHIUM VANADIUM Other�Assets
100% 70% 100%100%
Production�by�Dec�12
Stand�aloneSPV
Stand�aloneSPV
Incubate�&�Develop
Resource
JV�Partners
Reed�Share
Target�Production
TotalFunding
14.9Mt�@�1.3%�Li2O2.75Moz�(contained) 65.2Mt�@�0.82%�V2O5
Mineral�Resources�(ASX:�MIN)
China�Nonferrous�Metal�Industry�(NFC)
Iron�ore�(Reed�20%)
�JV�with�Cliffs�Natural�Resources�for�DSO�at�Mt�Finnerty
�Maiden�JORC�resource�4.7Mt�@�53.5%�Fe
Nickel�(Reed�60%)
�JV�with�Barranco�Resources�at�Mt�Finnerty
�Prospective�for�nickel�sulphide
Other�(Cu,�Au)
n/a
$40�million�(inc.�BOO)$33�million�(to�DTM)
$6m remaining
TBA
100% 0% TBA
December�Qtr,�2011December�Qtr,�2012 2014
Strategy

Page�5
Meekatharra�Gold�Project�Update�(Reed�100%)
� 3�Mtpa�processing�plant
� 180�man�camp
� Low�Capex�re�start
Resource�Inventory
NOW 48Mt�@�1.7g/t� 2.75Moz
Reserve�Inventory
NOW 4.2Mt�@�3.4g/t 559Koz

Page�6
$0
$20
$40
$60
$80
$100
$120
DRM SLR FML RMS SAR SBM RDR WGR CRE AXM NGF NAV *RDR
$�Market�Cap�/�Resource�oz
Gold�Peer�Comparisons
Average�$56/oz
Reed�acq.�$11/oz
Source:�IRESS,�ASX,�company�reports

Page�7
Regional�Location

Page�8
Meekatharra�Fly�Through

Page�9
Bluebird�Pit

Page�10
Prohibition�Pit

Page�11
Paddys�Flat�Underground

Page�12
Southern�Group�Long�SectionReedys
Reedys Tonnes(Mt)
Grade(g/t)
Gold(koz)
Resource 4.9 2.5 395
Reserve�(o/p) 0.4 2.9 37

Page�13
Reed�Turnaround�Strategy
Initial�4�5�year�sustainable�production�profile�100�– 120Kozpa
Results�to�Date Target
�Results Feb�2011 Aug�2011 IncreaseResource 2.5Moz 2.8Moz �12%
Reserve 420koz 559koz �32%
Reserve�(o/p) 114koz 250koz �119%

Page�14
Meekatharra�Summary
Reed�is�re�establishing�the�integrity,�credibility�and�value�of�the��Meekatharra�Gold�Project
� Careful�planning�and�compliance
� Detailed�evaluation�and�feasibility�studies
� Reliable�development�schedules
� Sustainable�operations

Page�15
Mt�Marion�Fly�Through
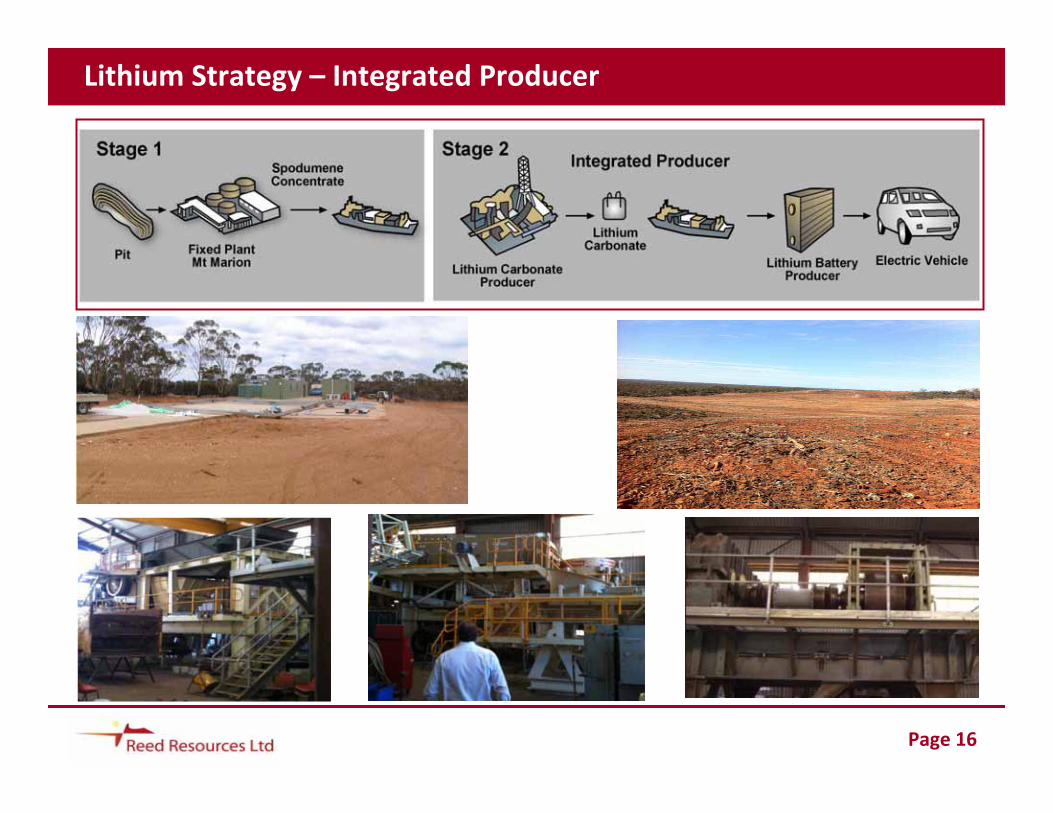
Page�16
Lithium�Strategy�– Integrated�Producer

Page�17
Lithium�Resource�Estimate
Mt�Marion�(100%�basis)
Tonnes(Mt)
Li�Grade(%�Li2O)
Fe�Grade(%�Fe2O3)
Measured 2.0 1.45 0.9
Indicated 4.8 1.39 1.2
Inferred 8.1 1.3 1.3
Total 14.9 1.3 1.2

Page�18
Comparison�– Australian�Lithium�Mineral�Producers
Source:�Reed�Resources�Ltd
Talison�� Greenbushes
�Incline�vein�pegmatite
�Head�grade�3%�Li2O
�Glass,�ceramic,�chemical�grade
�Strip�ratio�5.6:1
Deposit�Comparisons
Reed/MIN�– Mt�Marion
�Flat�lying�vein�pegmatite
�Head�grade�1.3%�Li2O
�Chemical�grade
�Strip�ratio�3.3:1
Galaxy�– Mt�Cattlin
�Flat�lying�pegmatite
�Head�grade�1%�Li2O
�Chemical�grade
�Strip�ratio�2.4:1�
Source:�Reed�Resources�Ltd

Page�19
Barrambie�Fly�Through

Page�20
Vanadium�Market�– Strong�Long�Term�Fundamentals
+ =��?�Vanadium�Redox�(Liquid)�Batteries
�Renewable�energy�storage,�peak�shaving,�load�leveling,�backup
�High�efficiency,�long�life�>20yrs
�Variable�input/fixed�output
�Power�(cell)�and�capacity�(concentration�and�volume)�varied�to�suit�application
� 1MWh�storage�=�9t�of�V2O5
+Lithium�Vanadium�EV�Batteries
�Highest�voltage�� POWER
�Highest�energy�density��� RANGE
�Contains�4kg�Li,�20kg�of�V
Titanium�Vanadium�Alloys
�Increasing�intensity�of�use�in�aerospace
$75

Page�21
The�2011�CRU�Commodity�Price�Ladder:
1.�Vanadium2.�Manganese3.�Cobalt4.�Molybdenum5.�Nickel6.�Copper7.�Iron�Ore8.�Uranium9.�Sulfur10.�Alumina11.�Lead12.�Zinc13.�Tin14.�Silver15.�Coking�Coal16.�Metallurgical�Coke17.�Aluminium18.�Palladium19.�Gold20.�Tungsten

Page�22
$0
$100
$200
$300
$400
$500
$600
$700
$800
Largo American�Vanadium
Atlantic Apella TNG Energizer Sino�Vanadium
Yellow�Rock
EV�/�Resource�Multiple�($/t�V2O5)
Potential�valuation�range�of�$100�� 400/t�V2O5
Mean $251/t V2O5
Vanadium�Peer�Comparisons�
Based�on�EV/resource�benchmarking�of�listed�vanadium�peers,�Barrambie�has�an�implied�
valuation�of�$53�� $214mSource:�Bloomberg,�ASX,�company�reports

Page�23
Board and Senior Management
David ReedFCPA, OAM Executive Chairman
Steven ColeLlb(Hons), FAICDNon-Executive Director
Dr Peter Collins BSc(Hons), PhD, MAIGNon-Executive Director
Chris ReedBCom, GradCertMinEcon, MAusIMMManaging Director and CEO
Craig Fawcett BSc(Hons), GDipMiningGeneral Manager - Gold
Ian Junk BEng(Hons), MAusIMMNon-Executive Director
Jason Carone BCom, CAFinancial Controller and Company Secretary
Dr Vanessa GuthrieBSc (Hons), PhD, GDBMNon-Executive Director
Darren WatesLegal Counsel and Company Secretary

Page�24
Reed Technical Staff
David HollingsworthSenior Exploration Geologist
Elizabeth Jones Snr Planning Engineer
Matt SchembriResource Geologist Open Pit
James LawrenceResource Geologist Underground
Jeremy WatkinsProject Manager – Gold
Dudley KingsnorthConsultant Lithium
Tony SimpsonConsultant Vanadium
Dr Bryan SmithConsultant GeologistLithium/Vanadium/Nickel
Bill Crossley Project Manager – Lithium/Vanadium

Page�25
Summary
� Staged�production�profile�with�Mt�Marion�on�line�March�Qtr�2012
� Diversified�cash�flows�across�3�strategic�commodities�with�strong�price�outlook
� Well�funded�with�experienced�management�team
� Trades�at�a�significant�discount�to�peers�across�all�projects�(current�price�$0.44)
*�Subject�to�Decision�to�Mine

Page�26
Appendix�1
COMPETENT�PERSONS�STATEMENTGeological�aspects�of�this�report�have�been�compiled�by�Mr�Craig Fawcett�(MAIMM),�a�full�time�employee�of�Reed�Resources�Ltd.�Mr Fawcett�has�sufficient�experience�relevant�to�the�style�of�mineralisation�and�type�of�deposit�under�consideration�and�to�the�activity�which�is�being�reported�on�to�qualify�as�a�Competent�Person�as�defined�in�the�Code�for�Reporting�of�Mineral�Resources�and�Ore�Reserves�(2004). Mr�Fawcett�consents�to�the�inclusion�in�this�report�of�the�matters�in�the�form�and�context�in�which�it�appears.
JORC�Statement

Page�27
Appendix�2
Notes:
1.Resources� and� Reserves� comply�with� the� Australian� JORC� reportingguidelines
2.Resources�are�inclusive�of�Reserves
Reed�Resource�and�Reserve�Inventory
Meekatharra Category Tonnes (Mt) Grade�(g/t) Gold�(koz)
Meek.�North Indicated 0.7 1.3 29.0
Inferred 0.2 1.2 6.0
Paddys Flat Indicated 19.1 1.7 1,047.9
Inferred 9.5 1. 437.3
Yaloginda Indicated 9.7 1.7 536.3
Inferred 3.9 1.7 240.4
Reedys Indicated 1.8 2.7 153.4
Inferred 3.1 2.4 241.2
Total 48.6 1.7 2,754.8
Comet�Vale Category Tonnes (Mt) Grade�(g/t) Gold�(koz)
Comet�Vale Indicated 0.2 10.8 82.5
Inferred 0.3 10.9 103.5
Total 0.5 10.8 186.0
Mt�Marion Category Tonnes (Mt) Li2O�(%) Li2O�(kt)
1,�2,�2W,�4,5,6 Measured 2.0 1.45 29.2
Indicated 4.8 1.39 66.3
Inferred 8.1 1.3 105.1
Total 10.5 1.4 193.7
Barrambie Category Tonnes (Mt) V2O5 (%) TiO2 (%)
Barrambie Indicated 49.2 0.82 17.3
Inferred 16.0 0.81 17.2
Total 65.2 0.82 17.3
Meekatharra Category Tonnes (Mt) Grade�(g/t) Gold�(koz)
Bluebird Probable 1.4 1.9 87.0
South�Junct. Probable 0.1 1.5 4.5
Prohibition Probable 1.1 2.7 96.0
Surprise Probable 0.1 3.0 13.0
Batavia Probable 0.2 2.4 14.0
Jack�Ryan Probable 0.2 3.1 21.8
Callisto Probable 0.1 3.1 7.2
Rand Probable 0.1 2.4 7.6
Total�(o/p) Probable 3.3 2.3 251.1
Prohibition Probable 1.4 4.1 179.0
Vivian/Cons. Probable 0.3 10.4 83.0
Fatts/Mud. Probable 0.4 4.0 46.0
Total�(u/g) Probable 2.0 4.8 308.0
Total Probable 5.3 3.3 559.1
Barrambie Category Tonnes (Mt) V2O5 (%) TiO2 (%)
Barrambie Probable 39.7 0.82 15.7
Total 39.7 0.82 15.7


