
Diffusion Tensor Imaging Tim Hughes & Emilie Muelly 1.
15
Diffusion Tensor Imaging Tim Hughes & Emilie Muelly 1
-
Upload
daisy-washington -
Category
Documents
-
view
222 -
download
0
Transcript of Diffusion Tensor Imaging Tim Hughes & Emilie Muelly 1.

1
DiffusionTensor Imaging
Tim Hughes & Emilie Muelly

2
DTI Module
• Learning objectives– Acquisition– Fiber orientation distribution function (ODF)– Tractography
• Projects– Combining fMRI + DTI to explore face
recognition & working memory – Comparing and contrasting DTI parameters

3
Diffusion Tensor Imaging• DTI acquisition: – Non-diffusion weighted images – Diffusion weighted images (DWI)
• Magnitude of diffusion weighting (e.g. b=1200 or 2400) b-value : angular resolution
signal:noise
• Output measures– Apparent Diffusion Co-efficient, Mean Diffusivity– Fractional Anisotropy (FA)

4
Acquired b0 image• Acquired b0 (b=0 s/mm2): a reference for
DTI analysis• Problematic with partial volumes– Neuronal tissue– Free water (cerebrospinl fluid, extracellular
fluid, and edema)• Effect on ADC, FA value, and fiber tracking• Partially fixed by FLAIR, – Incomplete saturation (mainly corrects for CSF)– Increased scan time
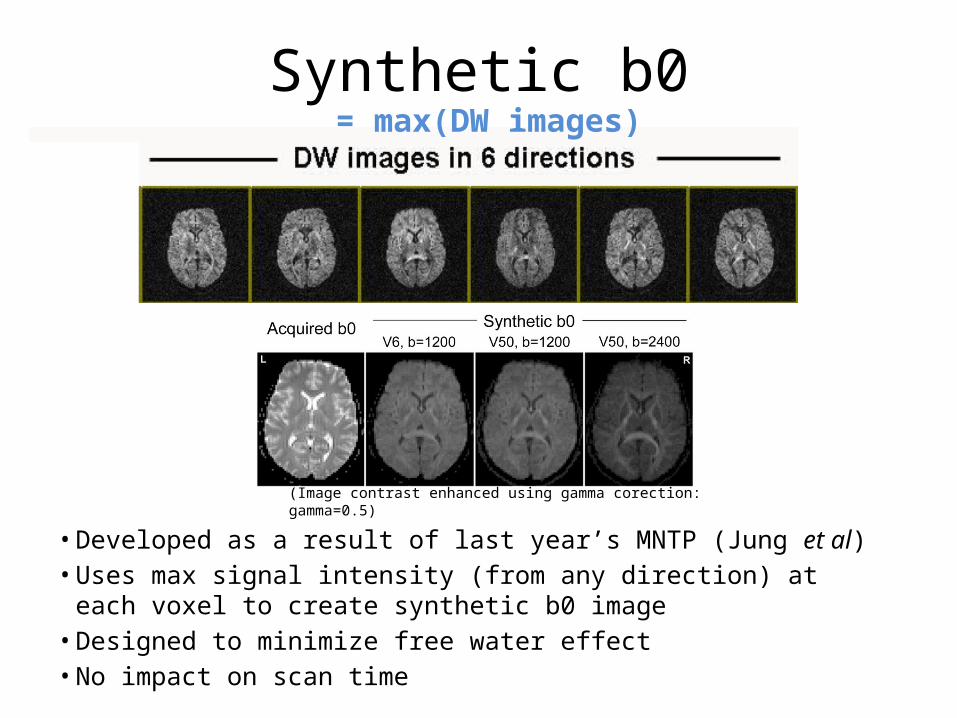
Synthetic b0
• Developed as a result of last year’s MNTP (Jung et al)• Uses max signal intensity (from any direction) at each voxel to
create synthetic b0 image• Designed to minimize free water effect• No impact on scan time
R= max(DW images)
(Image contrast enhanced using gamma corection: gamma=0.5)

6
• Tensor model – Single orientation at voxel (single ODF)– 6+ directions with 1 b0– No information regarding fiber crossing
• Constrained Spherical Deconvolution (CSD)– HARDI (high angular resolution diffusion imaging)– 23+ DW directions with multiple b0– Informative crossing
Fiber ODF Analysis Methods
Tournier et al., 2007
7
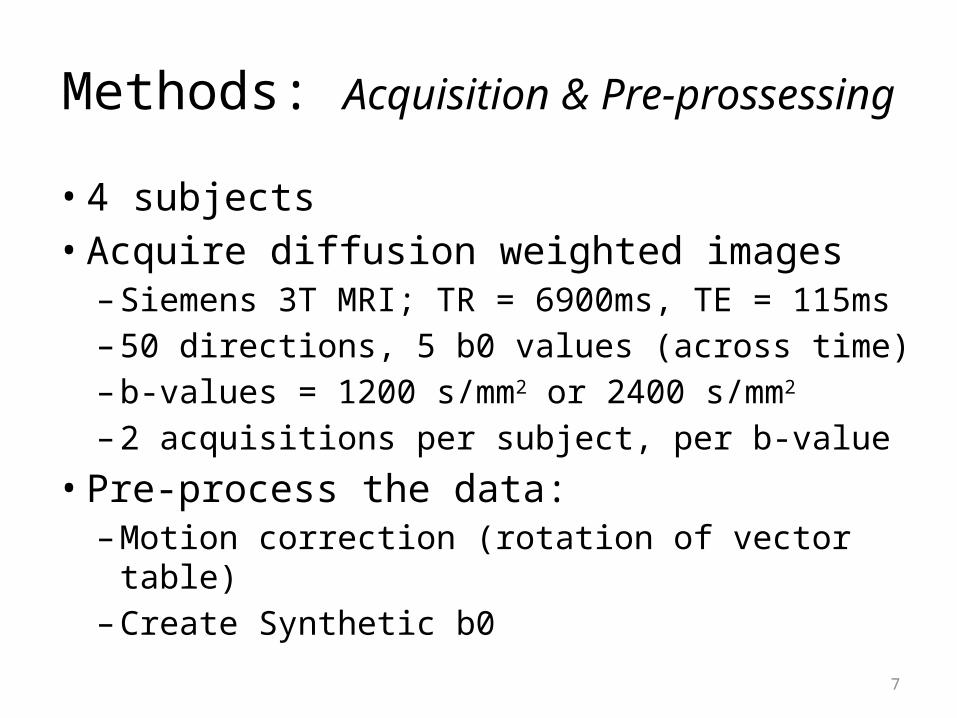
Methods: Acquisition & Pre-prossessing
• 4 subjects• Acquire diffusion weighted images– Siemens 3T MRI; TR = 6900ms, TE = 115ms– 50 directions, 5 b0 values (across time)– b-values = 1200 s/mm2 or 2400 s/mm2 – 2 acquisitions per subject, per b-value
• Pre-process the data: –Motion correction (rotation of vector table)– Create Synthetic b0

8
Methods: ODF and Tractography
• ExploreDTI v4.8.0 (A. Leemans)• ODF analysis (Tensor or CSD)• Identified tracts using regions of interest
• Obtained tract-based statistics (mean FA value, standard deviation, number of “fibers”)
Fornix Cingulum
UncinateFasciculus (UF)
Inferior fronto-occipital
fasciculus (IFOF)

9
Methods: Fiber analysis
• Parameters– Diffusion weighting: – b0 images: – ODF method:
• SAS v9.2– GLM, compare effects of each parameter on outcomes
– Evaluated effects of all first order interactions on outcomes
• Number of fibers • Mean FA value
b1200 vs. b2400Acquired vs. Synthetic
DTI vs. CSD

10
Raw Data (UF)Synthetic b0Acquired b0
Tensorb2400
CSDb2400
Right_UFtensor
b2400acq b0
b2400synthb0
b1200acq b0
b1200synth b0
FA value 0.45 0.70 0.49 0.73
Std Dev 0.12 0.10 0.13 0.10
# fibers 3465 3530 5017 5023
Right_UFCSD
b2400acq b0
b2400synth b0
b1200acq b0
b1200 synth b0
FA value 0.34 0.60 0.43 0.66
Std Dev 0.14 0.15 0.13 0.14
# fibers 6345 4162 5519 5455

11
Effect of DTI parameters on number of fibers
p-value R²
Subject 0.0922 5%
Tracts* <0.0001 70%
b1200 vs. b2400 0.7702 0%
Acquired b0 vs. Synthetic b0* 0.7357 0%
Tensor vs. CSD 0.0041 6%
* Tract-based analysis indicates that synthetic b0 significantly increases the number of fibers in the fornix only.

12
Effect of DTI parameters on mean FA value
p-value R²
Subject 0.9077 0%
Tract* <0.0001 17%
b1200 vs. b2400 0.1239 2%
Acquired b0 vs. Synthetic b0* <0.0001 67%
Tensor vs. CSD 0.0013 8%
Number of fibers 0.0046 6%(positive correlation)
* Significant interaction between b0 method and tract on mean FA value
13
Mea
n FA
val
ue
Fornix UF Cingulum IFOF0
0.1
0.2
0.3
0.4
0.5
0.6
0.7
0.8
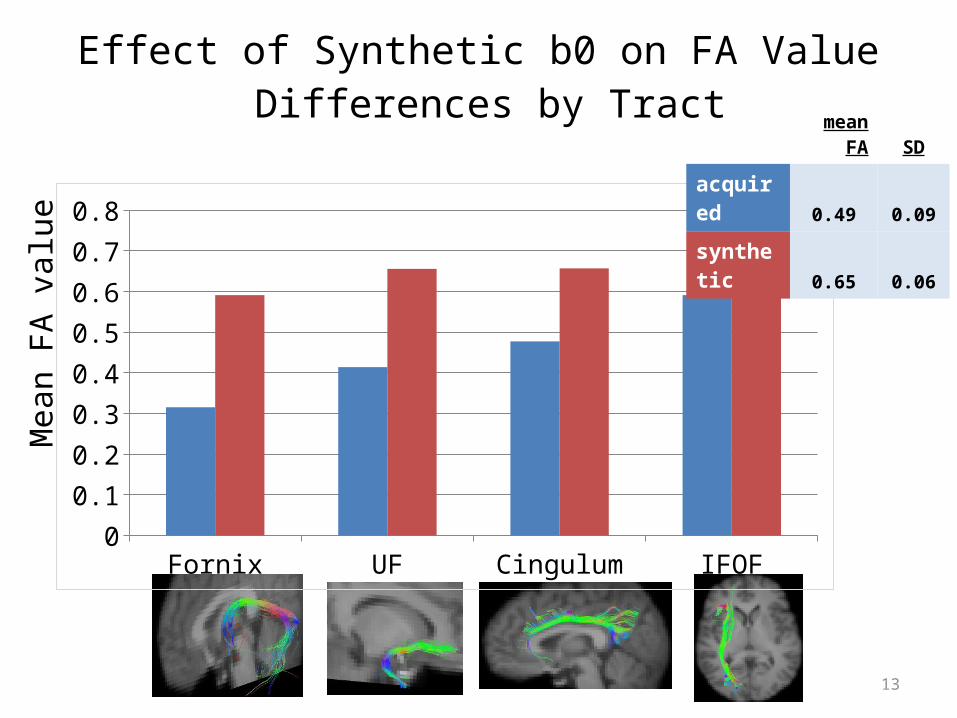
mean FA SD
acquired 0.49 0.09
synthetic 0.65 0.06
Effect of Synthetic b0 on FA Value Differences by Tract

14
Conclusions
• Changing DTI parameters can significantly alter the number of fibers and FA values
• Diffusion weighting– No significant differences in b1200 and b2400
• b0 images– Synthetic b0 FA compared to acquired b0– Effects of both FA and # fibers are most dramatic in the fornix
• ODF methods– CSD method # fibers, mean FA values compared to tensor
based method

15
Acknowledgments
• MNTP program– Seong-Gi Kim– Bill Eddy – Tomika Cohen
• DTI module Mentor – Kwan-Jin JungTA – Xiaohan Huang

![Sanity Checks for Saliency Maps · Sanity Checks for Saliency Maps Julius Adebayo, Justin Gilmer], Michael Muelly , Ian Goodfellow], Moritz Hardt y, Been Kim] juliusad@mit.edu, {gilmer,muelly,goodfellow,mrtz,beenkim}@google.com]Google](https://static.fdocuments.net/doc/165x107/5f962ac012d023390b54a09c/sanity-checks-for-saliency-maps-sanity-checks-for-saliency-maps-julius-adebayo.jpg)


![arXiv:1810.03292v2 [cs.CV] 28 Oct 2018 · Julius Adebayo, Justin Gilmer], Michael Muelly , Ian Goodfellow], Moritz Hardt y, Been Kim] juliusad@mit.edu, {gilmer,muelly,goodfellow,mrtz,beenkim}@google.com]Google](https://static.fdocuments.net/doc/165x107/5fa9a9bf617fd74f255701a4/arxiv181003292v2-cscv-28-oct-2018-julius-adebayo-justin-gilmer-michael-muelly.jpg)