
Diffusion …DistinctionofSkullBaseChordoma FromChondrosarcoma K.W. Yeom, R.M. Lober, B.C. Mobley,...
6
ORIGINAL RESEARCH HEAD & NECK Diffusion-Weighted MRI: Distinction of Skull Base Chordoma From Chondrosarcoma K.W. Yeom, R.M. Lober, B.C. Mobley, G. Harsh, H. Vogel, R. Allagio, M. Pearson, M.S.B. Edwards, and N.J. Fischbein ABSTRACT BACKGROUND AND PURPOSE: Chordoma and chondrosarcoma of the skull base are rare tumors with overlapping presentations and anatomic imaging features but different prognoses. We hypothesized that these tumors might be distinguished by using diffusion- weighted MR imaging. MATERIALS AND METHODS: We retrospectively reviewed 19 patients with pathologically confirmed chordoma or chondrosarcoma who underwent both conventional and diffusion-weighted MR imaging. Differences in distributions of ADC were assessed by the Kruskal-Wallis test. Associations between histopathologic diagnosis and conventional MR imaging features (T2 signal intensity, contrast enhancement, and tumor location) were assessed with the Fisher exact test. RESULTS: Chondrosarcoma was associated with the highest mean ADC value (2051 261 10 6 mm 2 /s) and was significantly different from classic chordoma (1474 117 10 6 mm 2 /s) and poorly differentiated chordoma (875 100 10 6 mm 2 /s) (P .001). Poorly differentiated chordoma was characterized by low T2 signal intensity (P .001), but other conventional MR imaging features of enhance- ment and/or lesion location did not reliably distinguish these tumor types. CONCLUSIONS: Diffusion-weighted MR imaging may be useful in assessing clival tumors, particularly in differentiating chordoma from chondrosarcoma. A prospective study of a larger cohort will be required to determine the value of ADC in predicting histopathologic diagnosis. ABBREVIATIONS: PD poorly differentiated C hordoma and chondrosarcoma constitute most primary bone tumors arising within the skull base, with a collective incidence of 0.03 cases per 100,000 person-years in the United States. 1 Due to their common location, they often have similar clinical presentations, though recurrence and survival rates are notably worse for chordoma than for the rarer chondrosarcoma. 2-4 Chordoma arises from notochordal remnants and is typically centered on the clivus, 5 whereas chondrosarcoma is mesenchy- mal in origin and is typically centered on the petro-occipital fis- sure. 2 These are not pathognomonic features, however, due to unpredictable patterns of origin, growth, and invasion. 6 Microscopically, chordoma is a moderately cellular neoplasm composed of vacuolated physaliferous cells arranged singly and in cords within a myxoid stroma. 7 While mitotic activity is rare in typical chordoma, poorly differentiated chordoma shows high mitotic activity and relatively high cell attenuation with a high nuclear-to-cytoplasmic ratio and prominent nucleoli. 8-10 The poorly differentiated chordoma is a particularly aggressive tumor with a predilection for the pediatric population. Chondrosar- coma, histologically distinct from chordoma, is composed of atypical chondrocytes with enlarged hyperchromatic nuclei set in an abundant cartilaginous matrix. Chondrosarcoma is graded from low to high, with higher grade tumors demonstrating in- creased cellularity, mitotic activity, nuclear size, nuclear hyper- chromasia, and aggressiveness. 11 Despite distinct origins and generally distinct histopathologic Received June 2, 2012; accepted after revision July 26. From the Departments of Radiology (K.W.Y., N.J.F.), Neurosurgery (R.M.L., G.H., M.S.B.E.), and Pathology (H.V.), Stanford University, Palo Alto, California; Depart- ments of Pathology (B.C.M.) and Neurosurgery (M.P.), Vanderbilt University Medi- cal Center, Nashville, Tennessee; and Department of Pathology (R.A.), University of Padova, Padova, Italy. Previously presented in abstract form at: 22nd Annual Meeting of the North Amer- ican Skull Base Society, February 17–19, 2012; Las Vegas, Nevada. Please address correspondence to Kristen W. Yeom, MD, Department of Radiol- ogy, Pediatric MRI and CT, Lucile Packard Children’s Hospital, Stanford University, Room 0511, 725 Welch Rd, Palo Alto, CA 94304; e-mail: [email protected] Indicates article with supplemental on-line table. http://dx.doi.org/10.3174/ajnr.A3333 AJNR Am J Neuroradiol ●:● ● 2013 www.ajnr.org 1 Published November 1, 2012 as 10.3174/ajnr.A3333 Copyright 2012 by American Society of Neuroradiology.
Transcript of Diffusion …DistinctionofSkullBaseChordoma FromChondrosarcoma K.W. Yeom, R.M. Lober, B.C. Mobley,...

ORIGINAL RESEARCHHEAD&NECK
Diffusion-WeightedMRI: Distinction of Skull Base ChordomaFrom Chondrosarcoma
K.W. Yeom, R.M. Lober, B.C. Mobley, G. Harsh, H. Vogel, R. Allagio, M. Pearson, M.S.B. Edwards, and N.J. Fischbein
ABSTRACT
BACKGROUND AND PURPOSE: Chordoma and chondrosarcoma of the skull base are rare tumors with overlapping presentations andanatomic imaging features but different prognoses. We hypothesized that these tumors might be distinguished by using diffusion-weighted MR imaging.
MATERIALS ANDMETHODS: We retrospectively reviewed 19 patients with pathologically confirmed chordoma or chondrosarcomawhounderwent both conventional and diffusion-weightedMR imaging. Differences in distributions of ADCwere assessed by the Kruskal-Wallistest. Associations between histopathologic diagnosis and conventional MR imaging features (T2 signal intensity, contrast enhancement,and tumor location) were assessed with the Fisher exact test.
RESULTS: Chondrosarcoma was associated with the highest mean ADC value (2051� 261� 10�6 mm2/s) and was significantly differentfrom classic chordoma (1474 � 117 � 10�6 mm2/s) and poorly differentiated chordoma (875 � 100 � 10�6 mm2/s) (P � .001). Poorlydifferentiated chordoma was characterized by low T2 signal intensity (P� .001), but other conventional MR imaging features of enhance-ment and/or lesion location did not reliably distinguish these tumor types.
CONCLUSIONS: Diffusion-weighted MR imaging may be useful in assessing clival tumors, particularly in differentiating chordoma fromchondrosarcoma. A prospective study of a larger cohort will be required to determine the value of ADC in predicting histopathologicdiagnosis.
ABBREVIATIONS: PD� poorly differentiated
Chordoma and chondrosarcoma constitute most primary
bone tumors arising within the skull base, with a collective
incidence of 0.03 cases per 100,000 person-years in the
United States.1 Due to their common location, they often have
similar clinical presentations, though recurrence and survival
rates are notably worse for chordoma than for the rarer
chondrosarcoma.2-4
Chordoma arises from notochordal remnants and is typically
centered on the clivus,5 whereas chondrosarcoma is mesenchy-
mal in origin and is typically centered on the petro-occipital fis-
sure.2 These are not pathognomonic features, however, due to
unpredictable patterns of origin, growth, and invasion.6
Microscopically, chordoma is a moderately cellular neoplasm
composed of vacuolated physaliferous cells arranged singly and in
cords within a myxoid stroma.7 While mitotic activity is rare in
typical chordoma, poorly differentiated chordoma shows high
mitotic activity and relatively high cell attenuation with a high
nuclear-to-cytoplasmic ratio and prominent nucleoli.8-10 The
poorly differentiated chordoma is a particularly aggressive tumor
with a predilection for the pediatric population. Chondrosar-
coma, histologically distinct from chordoma, is composed of
atypical chondrocytes with enlarged hyperchromatic nuclei set in
an abundant cartilaginous matrix. Chondrosarcoma is graded
from low to high, with higher grade tumors demonstrating in-
creased cellularity, mitotic activity, nuclear size, nuclear hyper-
chromasia, and aggressiveness.11
Despite distinct origins and generally distinct histopathologic
Received June 2, 2012; accepted after revision July 26.
From the Departments of Radiology (K.W.Y., N.J.F.), Neurosurgery (R.M.L., G.H.,M.S.B.E.), and Pathology (H.V.), Stanford University, Palo Alto, California; Depart-ments of Pathology (B.C.M.) and Neurosurgery (M.P.), Vanderbilt University Medi-cal Center, Nashville, Tennessee; and Department of Pathology (R.A.), University ofPadova, Padova, Italy.
Previously presented in abstract form at: 22nd Annual Meeting of the North Amer-ican Skull Base Society, February 17–19, 2012; Las Vegas, Nevada.
Please address correspondence to Kristen W. Yeom, MD, Department of Radiol-ogy, Pediatric MRI and CT, Lucile Packard Children’s Hospital, Stanford University,Room 0511, 725 Welch Rd, Palo Alto, CA 94304; e-mail: [email protected]
Indicates article with supplemental on-line table.
http://dx.doi.org/10.3174/ajnr.A3333
AJNR Am J Neuroradiol ●:● ● 2013 www.ajnr.org 1
Published November 1, 2012 as 10.3174/ajnr.A3333
Copyright 2012 by American Society of Neuroradiology.

features and clinical behavior, chordoma
and chondrosarcoma may be difficult to
distinguish from each other on preop-
erative imaging. Several previous stud-
ies have found no MR imaging or CT
features that definitively distinguish
chordoma from chondrosarcoma.6,12,13
None of these studies, however, applied
DWI, a technique used in tumor imag-
ing to assess differences in cellular den-
sity and the nuclear-to-cytoplasmic ra-
tio on the basis of water motion within
tissue voxels.14-16 Given the discrete
histopathologic features of classic chor-
doma, poorly differentiated chordoma,
and chondrosarcoma, we hypothesized
that these tumors could be distin-
guished by using DWI.
MATERIALS AND METHODSSubjectsAll patients with pathologically proved
skull base chordoma or chondrosarcoma
at 2 institutions, between 2004 and 2011,
were retrospectively reviewed after ap-
proval by the institutional review board,
and a waiver of consent was authorized.
Patient privacy was protected in accor-
dance with the Health Insurance Portabil-
FIG 1. ADC measurement. In this 22-month-old girl, poorly differentiated chordoma is seen arising from the clivus (A), which shows minimal orno enhancement (B) and relatively low T2 intensity (C). Regions of interest were drawn at all available axial planes of the tumor on the ADCmap(D) and along the entire boundary of the tumor soft tissue, avoiding areas of hemorrhage, necrosis, cyst, or calcification.
FIG 2. Sample ADC measurements in various tumors. Chondrosarcoma (A and D), classic chor-doma (B), and poorly differentiated chordoma (C).
2 Yeom AJNR ● ● 2013 www.ajnr.org

ity and Accountability Act of 1996 and with our institutional ethics
standards and guidelines. The study cohort was identified from a
consecutive series of patients in a pathology data base that included
2 institutions and was defined by 2 inclusion criteria: the patient
underwent both conventional and diffusion-weighted MR imaging
preoperatively and had pathology confirmed by surgical resection.
Imaging MethodsOf our 19 patients, 16 were examined with brain MR imaging at
1.5T or 3T field strength (Signa, Discovery 750; GE Healthcare,
Milwaukee, Wisconsin) with the following brain MR imaging pa-
rameters: T2 FSE (TR/TE, 2700 –3000/100 –120 ms); FLAIR (TR/
TE/TI, 9000/120/2200 ms); T1 spin-echo pre- and postgadolinium
injection (TR/TE, 600 –700/15–20 ms at
5-mm section thickness with a 0- to
1-mm skip); and DWI (TR/TE, 8300/70
ms at 1.5T and 10,000/80 ms at 3T, b �
1000 s/mm2, three directions, 4- to 5-mm
thickness, 0 skip). Three patients were ex-
amined with brain MR imaging at 1.5T
(Achieva; Philips Healthcare, Best, the
Netherlands) with the following brain
MR imaging parameters: T2 FSE (TR/TE,
5000/100 ms); FLAIR (TR/TE/TI, 10,000/
140/2200 ms); T1 spin-echo pre- and
postgadolinium injection (TR/TE, 500 –
600/15 ms at 5-mm thickness, 1 skip); and
DWI (TR/TE, 4000/53 ms, b � 1000
s/mm2, three directions, 5-mm thickness,
0 skip). ADC maps were generated with
commercially available software.
Radiologic EvaluationThe ADC measurements were obtained
from regions of interest that encompassed
the soft-tissue component of the tumor.
In 2 cases, patients with large intratu-
moral hemorrhages were excluded be-
cause nonhemorrhagic tumor could not
be defined for measurement. ROIs were
drawn by a board-certified neuroradiolo-
gist with a Certificate of Added Qualifica-
tion (K.W.Y.), blinded to both pathologic
and clinical information. A region of in-
terest was drawn on all axial images that
included the tumor, excluding areas of
cyst/cavity formation, hemorrhage/min-
eralization, and/or necrosis (Figs 1 and 2)
identified on the anatomic imaging se-
quences. Mean, maximum, and mini-
mum ADC values were obtained within
this region of interest at all axial sections
that included the tumor and then aver-
aged. Region-of-interest placement was
also performed in a blinded fashion by a
neurosurgeon (R.M.L.) on the basis of 6
random sample cases; interobserver
agreement for ADC values was analyzed by using the intraclass
correlation coefficient and was found to be highly reliable (95%
confidence interval, 0.979 –1.000).
Additionally, we investigated the following MR imaging fea-
tures: enhancement pattern, T2 intensity relative to gray matter,
and lesion location. Enhancement pattern was graded as 0 � little
or none, 1 � heterogeneous, or 2 � �90% homogeneous en-
hancement (Fig 3). Lesions were scored as high or low T2 intensity
on the basis of homogeneous areas that were characteristic of
�90% of the tumor volume (Fig 4). One case (patient 16 in the
On-line Table) was excluded from the analysis with the Fisher
exact test due to mixed T2 intensity, and this is noted as a heter-
ogeneous lesion containing varying T2 intensities in the On-line
FIG 3. Enhancement patterns. Examples of enhancement patterns, mild to none (top), hetero-geneous (middle), and solid (bottom) are shown in poorly differentiated chordomas (A and D),classic chordoma (B), and chondrosarcoma (C, E, and F).
AJNR Am J Neuroradiol ●:● ● 2013 www.ajnr.org 3

Table. These MR imaging features were assessed by a board-certi-
fied neuroradiologist (K.W.Y.), again blinded to pathologic and
clinical information.
PathologyTumor specimens were retrieved from the surgical pathology files
of Stanford University Medical Center and Vanderbilt University
Medical Center. Histologic diagnoses were confirmed by board-
certified neuropathologists (H.V., B.C.M.). Immunohistochemi-
cal staining for SMARCB1/INI1, brachyury, cytokeratin CKAE1/
AE3, and S-100 was performed per standard protocols by using
formalin-fixed paraffin-embedded tissue. The appropriate positive
and negative tissue controls were analyzed.
Statistical AnalysisAll statistical analyses were performed with the Statistical Package
for the Social Sciences, Version 20.0 (SPSS, Chicago, Illinois) with
an a priori significance level of � � .05. Differences in distributions
of ADC and patient age for the 3 tumor types were assessed by the
Kruskal-Wallis test of independent samples with multiple pair-
wise comparisons. Associations between
histopathologic diagnosis and MR imag-
ing features of T2-weighted signal, con-
trast enhancement, and tumor location
were assessed with the Fisher exact test.
RESULTSSubjectsOf 38 patients identified from our data
bases, 21 patients had available diffusion-
weighted imaging. Two patients with
large intratumoral hemorrhage were ex-
cluded due to difficulty visualizing non-
hemorrhagic soft-tissue components of
tumor. The characteristics and clinical
data of the remaining 19 patients are
shown in Table 1. Individual demo-
graphic and MR imaging features of each
tumor are shown in the On-line Table.
The median age at diagnosis was 36
(range, 2– 84) years, and there were 8
males and 11 females. Diagnoses included
9 (47%) chondrosarcomas, 7 (37%) clas-
sic chordomas, and 3 (16%) poorly differ-
entiated chordomas. Histologic analysis
included immunohistochemical studies,
with chondrosarcoma demonstrating
S-100 reactivity and lack of keratin stain-
ing, and chordoma demonstrating
brachyury reactivity. Loss of nuclear
SMARCB1/INI1 reactivity was observed
in the poorly differentiated subset of
chordoma. Tumor locations included 11
(58%) clival, 7 (37%) petroclival, and 1
(5%) pterygoid regions. Sixteen (84%) of
the tumors were new diagnoses, and 3
(16%) represented residual or recurrent
disease. Two of the 3 patients with recurrent/residual tumors had
been treated with radiation before imaging.
Patient age at diagnosis differed among the groups, with sig-
nificance due to the difference between poorly differentiated
chordoma and chondrosarcoma (P � .047). The mean ages in
years at diagnosis for chondrosarcoma, classic chordoma, and
poorly differentiated chordoma were 43.3 � 17.3, 37.7 � 23, and
5.7 � 3.2 years, respectively.
Diffusion MR ImagingThe distributions of averaged mean, minimum, and maximum
ADC for the 3 tumor types are shown in Table 2. Chondrosar-
coma had the highest ADC values, followed by classic chordoma,
and PD chordoma, which had the lowest ADC values. The tumor
types differed in mean, minimum, and maximum ADC according
to the Kruskal-Wallis test of independent samples (P � .001,
0.001, and 0.028, respectively). For mean and minimum ADC,
pair-wise comparisons identified differences between chondro-
sarcoma and both classic and PD chordoma, while these values
were not different between the 2 chordoma types. For maximum
FIG 4. Examples of T2 intensity features of the clival tumors. High T2 intensity of chondrosar-coma (A) and classic chordoma (B) are easily recognized. Contrast this with the low T2 intensityof poorly differentiated chordoma (C and D).
4 Yeom AJNR ● ● 2013 www.ajnr.org
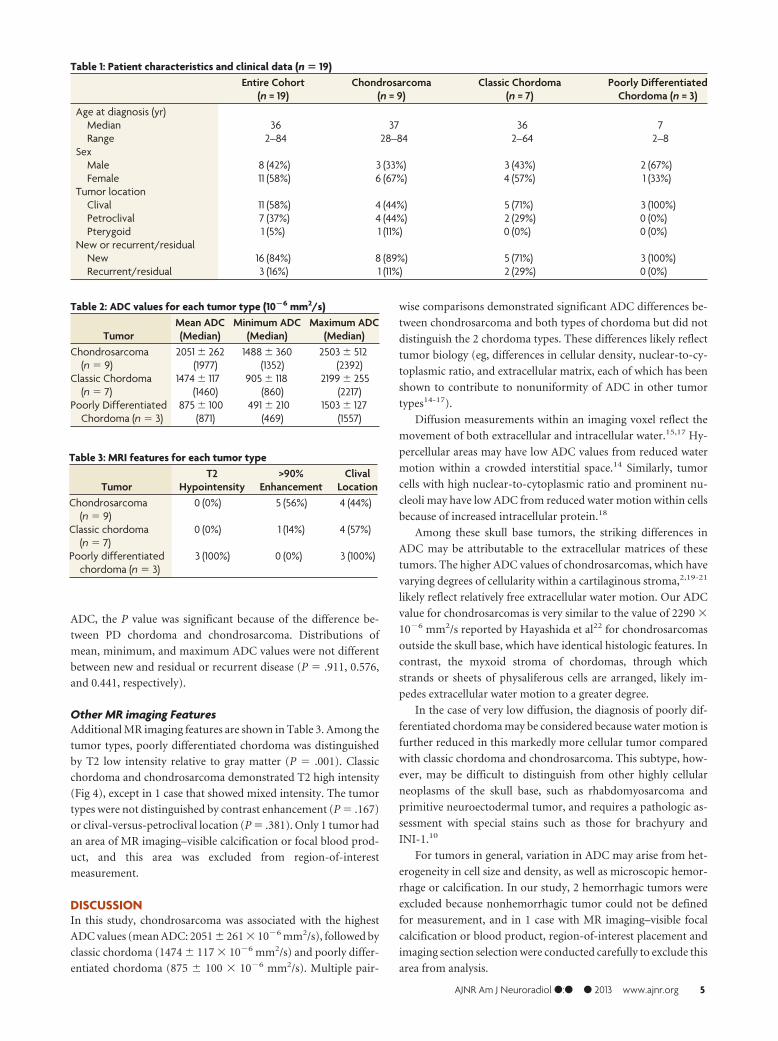
ADC, the P value was significant because of the difference be-
tween PD chordoma and chondrosarcoma. Distributions of
mean, minimum, and maximum ADC values were not different
between new and residual or recurrent disease (P � .911, 0.576,
and 0.441, respectively).
Other MR imaging FeaturesAdditional MR imaging features are shown in Table 3. Among the
tumor types, poorly differentiated chordoma was distinguished
by T2 low intensity relative to gray matter (P � .001). Classic
chordoma and chondrosarcoma demonstrated T2 high intensity
(Fig 4), except in 1 case that showed mixed intensity. The tumor
types were not distinguished by contrast enhancement (P � .167)
or clival-versus-petroclival location (P � .381). Only 1 tumor had
an area of MR imaging–visible calcification or focal blood prod-
uct, and this area was excluded from region-of-interest
measurement.
DISCUSSIONIn this study, chondrosarcoma was associated with the highest
ADC values (mean ADC: 2051 � 261 � 10�6 mm2/s), followed by
classic chordoma (1474 � 117 � 10�6 mm2/s) and poorly differ-
entiated chordoma (875 � 100 � 10�6 mm2/s). Multiple pair-
wise comparisons demonstrated significant ADC differences be-
tween chondrosarcoma and both types of chordoma but did not
distinguish the 2 chordoma types. These differences likely reflect
tumor biology (eg, differences in cellular density, nuclear-to-cy-
toplasmic ratio, and extracellular matrix, each of which has been
shown to contribute to nonuniformity of ADC in other tumor
types14-17).
Diffusion measurements within an imaging voxel reflect the
movement of both extracellular and intracellular water.15,17 Hy-
percellular areas may have low ADC values from reduced water
motion within a crowded interstitial space.14 Similarly, tumor
cells with high nuclear-to-cytoplasmic ratio and prominent nu-
cleoli may have low ADC from reduced water motion within cells
because of increased intracellular protein.18
Among these skull base tumors, the striking differences in
ADC may be attributable to the extracellular matrices of these
tumors. The higher ADC values of chondrosarcomas, which have
varying degrees of cellularity within a cartilaginous stroma,2,19-21
likely reflect relatively free extracellular water motion. Our ADC
value for chondrosarcomas is very similar to the value of 2290 �
10�6 mm2/s reported by Hayashida et al22 for chondrosarcomas
outside the skull base, which have identical histologic features. In
contrast, the myxoid stroma of chordomas, through which
strands or sheets of physaliferous cells are arranged, likely im-
pedes extracellular water motion to a greater degree.
In the case of very low diffusion, the diagnosis of poorly dif-
ferentiated chordoma may be considered because water motion is
further reduced in this markedly more cellular tumor compared
with classic chordoma and chondrosarcoma. This subtype, how-
ever, may be difficult to distinguish from other highly cellular
neoplasms of the skull base, such as rhabdomyosarcoma and
primitive neuroectodermal tumor, and requires a pathologic as-
sessment with special stains such as those for brachyury and
INI-1.10
For tumors in general, variation in ADC may arise from het-
erogeneity in cell size and density, as well as microscopic hemor-
rhage or calcification. In our study, 2 hemorrhagic tumors were
excluded because nonhemorrhagic tumor could not be defined
for measurement, and in 1 case with MR imaging–visible focal
calcification or blood product, region-of-interest placement and
imaging section selection were conducted carefully to exclude this
area from analysis.
Table 3: MRI features for each tumor type
TumorT2
Hypointensity>90%
EnhancementClivalLocation
Chondrosarcoma(n� 9)
0 (0%) 5 (56%) 4 (44%)
Classic chordoma(n� 7)
0 (0%) 1 (14%) 4 (57%)
Poorly differentiatedchordoma (n� 3)
3 (100%) 0 (0%) 3 (100%)
Table 1: Patient characteristics and clinical data (n� 19)Entire Cohort(n = 19)
Chondrosarcoma(n = 9)
Classic Chordoma(n = 7)
Poorly DifferentiatedChordoma (n = 3)
Age at diagnosis (yr)Median 36 37 36 7Range 2–84 28–84 2–64 2–8
SexMale 8 (42%) 3 (33%) 3 (43%) 2 (67%)Female 11 (58%) 6 (67%) 4 (57%) 1 (33%)Tumor locationClival 11 (58%) 4 (44%) 5 (71%) 3 (100%)Petroclival 7 (37%) 4 (44%) 2 (29%) 0 (0%)Pterygoid 1 (5%) 1 (11%) 0 (0%) 0 (0%)New or recurrent/residualNew 16 (84%) 8 (89%) 5 (71%) 3 (100%)Recurrent/residual 3 (16%) 1 (11%) 2 (29%) 0 (0%)
Table 2: ADC values for each tumor type (10�6 mm2/s)
TumorMean ADC(Median)
Minimum ADC(Median)
Maximum ADC(Median)
Chondrosarcoma(n� 9)
2051� 262 1488� 360 2503� 512(1977) (1352) (2392)
Classic Chordoma(n� 7)
1474� 117 905� 118 2199� 255(1460) (860) (2217)
Poorly DifferentiatedChordoma (n� 3)
875� 100 491� 210 1503� 127(871) (469) (1557)
AJNR Am J Neuroradiol ●:● ● 2013 www.ajnr.org 5

Our study corroborates previous reports that both classic
chordoma and chondrosarcoma show high intensity on T2-
weighted images.6,12,13 Our cohort included 3 cases of poorly dif-
ferentiated chordoma, and these demonstrated T2 low intensity
relative to gray matter, a finding that, to our knowledge, has not
been previously reported. We found no pattern of contrast en-
hancement that distinguished among tumor types, similar to pre-
vious reports.6
We recognize that a larger sample size might demonstrate
overlapping diffusion characteristics among these tumors, just as
there may be overlapping histologic features on microscopic ex-
amination, but large sample sizes of these rare tumors are difficult
to accrue. The chondroid variant of chordoma, for example, may
show stromal features that mimic the hyaline cartilage seen in
chondrosarcoma,2 while a subset of chondrosarcoma can show a
myxoid matrix characteristic of chordoma. Both tumors may
have areas of calcification and even ossification.2 Because of the
close relationship between histology and tissue water properties,
ADC may fail as an absolute predictor of diagnosis in such cases of
histopathologic crossover and variability but can still potentially
provide worthwhile information about the presumptive diagnosis
of a skull base lesion. A further limitation may be our use of
patient data following radiation therapy, which may increase the
variance of ADC values and limit the applicability for preopera-
tive diagnosis. However, despite higher ADC among irradiated
chordomas, the values were still lower than those of any
chondrosarcoma.
Diffusion properties of skull base tumors previously have not
been compared for the purpose of preoperative diagnosis, except
in 1 recent study in which ADC was the basis for a general distinc-
tion between benign and malignant skull lesions that correlated
with cell density.23 Our results suggest that diffusion-weighted
imaging and calculation of ADC values may aid in distinguishing
chordoma from chondrosarcoma.
CONCLUSIONSDiffusion MR imaging may be useful in assessing clival tumors,
particularly in differentiating chordoma from chondrosarcoma
and suggesting the rare poorly differentiated chordoma. Prospec-
tive study of a larger cohort will be required to determine the value
of ADC in predicting the histopathologic diagnosis.
ACKNOWLEDGMENTSThe authors would like to recognize the excellent technical sup-
port and impeccable service of staff members in our Departments
of Neurosurgery and Radiology.
Disclosures: Nancy Fischbein—UNRELATED: BoardMembership:AJNR Senior Editor.
REFERENCES1. Central Brain Tumor Registry of the United States. Statistical Report:
Primary Brain Tumors in the United States, 1997–2001. Hinsdale,Illinois: Central Brain Tumor Registry of the United States
2. Heffelfinger MJ, Dahlin DC, MacCarty CS, et al. Chordomas andcartilaginous tumors of the skull base. Cancer 1973;32:410 –20
3. Almefty K, Pravdenkova S, Colli BO, et al. Chordoma andchondrosarcoma: similar, but quite different, skull base tumors.Cancer 2007;110:2456 – 67
4. Cho YH, Kim JH, Khang SK, et al. Chordomas and chondrosarco-mas of the skull base: comparative analysis of clinical results in 30patients. Neurosurg Rev 2008;31:35– 43
5. Burrow JF, Stewart MJ. Original papers: malignant spheno-occipi-tal chordoma. J Neurol Psychopathol 1923;15:205–17
6. Pamir MN, Ozduman K. Analysis of radiological features relative tohistopathology in 42 skull-base chordomas and chondrosarcomas.Eur J Radiol 2006;58:461–70
7. Mirra JM, Nelson SD, Della Rocca C, et al. Chordoma. In: FletcherCDM, Unni KK, Mertens F, eds. World Health Organization Classifi-cation of Tumours: Pathology and Genetics of Tumours of Soft Tissueand Bone. Lyon, France: IARC Press; 2002:315–17
8. Hoch BL, Nielsen GP, Liebsch NJ, et al. Base of skull chordomas inchildren and adolescents: a clinicopathologic study of 73 cases.Am J Surg Pathol 2006;30:811–18
9. Coffin CM, Swanson PE, Wick MR, et al. Chordoma in childhoodand adolescence: a clinicopathologic analysis of 12 cases. ArchPathol Lab Med 1993;117:927–33
10. Mobley BC, McKenney JK, Bangs CD, et al. Loss of SMARCB1/INI1expression in poorly differentiated chordomas. Acta Neuropathol2010;120:745–53
11. Bertoni F, Bacchini P, Hogendoorn PC. Chondrosarcoma. In:Fletcher CDM, Unni KK, Mertens F, eds. World Health OrganizationClassification of Tumours: Pathology and Genetics of Tumours of SoftTissue and Bone. Lyon, France: IARC Press; 2002:247–51
12. Oot RF, Melville GE, New PF, et al. The role of MR and CT in evalu-ating clival chordomas and chondrosarcomas. AJR Am J Roentgenol1988;151:567–75
13. Bourgouin PM, Tampieri D, Robitaille Y, et al. Low-grade myxoidchondrosarcoma of the base of the skull: CT, MR, and histopathol-ogy. J Comput Assist Tomogr 1992;16:268 –73
14. Sugahara T, Korogi Y, Kochi M, et al. Usefulness of diffusion-weighted MRI with echo-planar technique in evaluation of cellular-ity in gliomas. J Mag Res Imaging 1999;9:53– 60
15. Guo AC, Cummings TJ, Dash RC, et al. Lymphomas and high-gradeastrocytomas: Comparison of water diffusibility and histologiccharacteristics. Radiology 2002;224:177– 83
16. Rumboldt Z, Camacho DL, Lake D, et al. Apparent diffusion coeffi-cients for differentiation of cerebellar tumors in children. AJNRAm J Neuroradiol 2006;27:1362– 69
17. Le Bihan D, Breton E, Lallemand D, et al. MR imaging of intravoxelincoherent motions: Application to diffusion and perfusion in neu-rologic disorders. Radiology 1986;161:401– 07
18. Filippi CG, Edgar MA, Ulug AM, et al. Appearance of meningiomason diffusion-weighted images: correlating diffusion constants withhistopathologic findings. AJNR Am J Neuroradiol 2001;22:65–72
19. Lichtenstein L, Jaffe HL. Chondrosarcoma of bone. Am J Pathol1943;19:553– 89
20. Dahlin DC, MacCarty CS. Chordoma. Cancer 1952;5:1170 –7821. Evans HL, Ayala AG, Romsdahl MM. Prognostic factors in chondro-
sarcoma of bone: a clinicopathologic analysis with emphasis on his-tologic grading. Cancer 1977;40:818 –31
22. Hayashida Y, Hirai T, Yakushiji T, et al. Evaluation of diffusion-weighted imaging for the differential diagnosis of poorly contrast-enhanced and T2-prolonged bone masses: initial experience. JMagn Reson Imaging 2006;23:377– 82
23. Ginat DT, Mangla R, Yeaney G, et al. Diffusion-weighted imagingfor differentiating benign from malignant skull lesions and corre-lation with cell density. AJR Am J Roentgenol 2012:198:W597– 601
6 Yeom AJNR ● ● 2013 www.ajnr.org


