Diffusion and sorption of organic micropollutants in...
14
Diffusion and sorption of organic micropollutants in biofilms with varying thicknesses Elena Torresi a, b, **, 1 , Fabio Polesel a, 1 , Kai Bester c , Magnus Christensson b , Barth F. Smets a , Stefan Trapp a , Henrik R. Andersen a , Benedek Gy. Pl osz a, d, * a DTU Environment, Technical University of Denmark, Bygningstorvet B115, 2800 Kongens Lyngby, Denmark b Veolia Water Technologies AB, AnoxKaldnes, Kloster€ angsv€ agen 11A, SE-226 47 Lund, Sweden c Department of Environmental Science, Århus University, Frederiksborgvej 399, 4000 Roskilde, Denmark d Department of Chemical Engineering, University of Bath, Claverton Down, Bath BA2 7AY, UK article info Article history: Received 7 February 2017 Received in revised form 8 June 2017 Accepted 9 June 2017 Available online 14 June 2017 Keywords: Pharmaceuticals Wastewater Moving bed biofilm reactor Partitioning Biofilm density Ionizable chemicals abstract Solid-liquid partitioning is one of the main fate processes determining the removal of micropollutants in wastewater. Little is known on the sorption of micropollutants in biofilms, where molecular diffusion may significantly influence partitioning kinetics. In this study, the diffusion and the sorption of 23 micropollutants were investigated in novel moving bed biofilm reactor (MBBR) carriers with controlled biofilm thickness (50, 200 and 500 mm) using targeted batch experiments (initial concentration ¼ 1 mgL 1 , for X-ray contrast media 15 mgL 1 ) and mathematical modelling. We assessed the influence of biofilm thickness and density on the dimensionless effective diffusivity coefficient f (equal to the biofilm-to-aqueous diffusivity ratio) and the distribution coefficient K d,eq (L g 1 ). Sorption was significant only for eight positively charged micropollutants (atenolol, metoprolol, propranolol, citalopram, venlafaxine, erythromycin, clarithromycin and roxithromycin), revealing the importance of electrostatic interactions with solids. Sorption equilibria were likely not reached within the duration of batch experiments (4 h), particularly for the thickest biofilm, requiring the calculation of the distribution coefficient K d,eq based on the approximation of the asymptotic equilibrium concentration (t > 4 h). K d,eq values increased with increasing biofilm thickness for all sorptive micropollutants (except atenolol), possibly due to higher porosity and accessible surface area in the thickest biofilm. Positive correlations between K d,eq and micropollutant properties (polarity and molecular size descriptors) were identified but not for all biofilm thicknesses, thus confirming the challenge of improving predictive sorption models for positively charged compounds. A diffusion-sorption model was developed and calibrated against experimental data, and estimated f values also increased with increasing biofilm thickness. This indicates that diffusion in thin biofilms may be strongly limited (f ≪ 0.1) by the high biomass density (reduced porosity). © 2017 Elsevier Ltd. All rights reserved. 1. Introduction In wastewater treatment systems, partitioning of organic micropollutants to solid matrices is one of the mechanisms leading to their removal from the aqueous phase. The extent of partitioning is typically compound-dependent, and is governed by its affinity for organic phase (hydrophobic partitioning) and/or by electrostatic and other similar interactions between ionized molecules and charged solid surfaces (non-hydrophobic partitioning) (Franco and Trapp, 2008; Hyland et al., 2012; Ternes et al., 2004; Mackay and Vasudevan, 2012; Polesel et al., 2015). Partitioning describes the distribution of molecules between the aqueous and the solid phase. At equilibrium, sorption and desorption rates are equal, and the ratio of sorbed and dissolved concentrationsdnormalized to the concentration of solidsdis defined as the (linear) solid-liquid partition coefficient K d * Corresponding author. DTU Environment, Technical University of Denmark, Bygningstorvet B115, 2800 Kongens Lyngby, Denmark; Department of Chemical Engineering, University of Bath, Claverton Down, Bath BA2 7AY, UK ** Corresponding author. DTU Environment, Technical University of Denmark, Bygningstorvet B115, 2800 Kongens Lyngby, Denmark. E-mail addresses: [email protected] (E. Torresi), [email protected] (B.Gy. Pl osz). 1 Joint first authors. Contents lists available at ScienceDirect Water Research journal homepage: www.elsevier.com/locate/watres http://dx.doi.org/10.1016/j.watres.2017.06.027 0043-1354/© 2017 Elsevier Ltd. All rights reserved. Water Research 123 (2017) 388e400
Transcript of Diffusion and sorption of organic micropollutants in...

lable at ScienceDirect
Water Research 123 (2017) 388e400
Contents lists avai
Water Research
journal homepage: www.elsevier .com/locate/watres
Diffusion and sorption of organic micropollutants in biofilms withvarying thicknesses
Elena Torresi a, b, **, 1, Fabio Polesel a, 1, Kai Bester c, Magnus Christensson b,Barth F. Smets a, Stefan Trapp a, Henrik R. Andersen a, Benedek Gy. Pl�osz a, d, *
a DTU Environment, Technical University of Denmark, Bygningstorvet B115, 2800 Kongens Lyngby, Denmarkb Veolia Water Technologies AB, AnoxKaldnes, Kloster€angsv€agen 11A, SE-226 47 Lund, Swedenc Department of Environmental Science, Århus University, Frederiksborgvej 399, 4000 Roskilde, Denmarkd Department of Chemical Engineering, University of Bath, Claverton Down, Bath BA2 7AY, UK
a r t i c l e i n f o
Article history:Received 7 February 2017Received in revised form8 June 2017Accepted 9 June 2017Available online 14 June 2017
Keywords:PharmaceuticalsWastewaterMoving bed biofilm reactorPartitioningBiofilm densityIonizable chemicals
* Corresponding author. DTU Environment, TechnBygningstorvet B115, 2800 Kongens Lyngby, DenmaEngineering, University of Bath, Claverton Down, Bat** Corresponding author. DTU Environment, TechnBygningstorvet B115, 2800 Kongens Lyngby, Denmark
E-mail addresses: [email protected] (E. Torresi), b.g.p1 Joint first authors.
http://dx.doi.org/10.1016/j.watres.2017.06.0270043-1354/© 2017 Elsevier Ltd. All rights reserved.
a b s t r a c t
Solid-liquid partitioning is one of the main fate processes determining the removal of micropollutants inwastewater. Little is known on the sorption of micropollutants in biofilms, where moleculardiffusion may significantly influence partitioning kinetics. In this study, the diffusion and the sorption of23 micropollutants were investigated in novel moving bed biofilm reactor (MBBR) carriers withcontrolled biofilm thickness (50, 200 and 500 mm) using targeted batch experiments (initialconcentration ¼ 1 mg L�1, for X-ray contrast media 15 mg L�1) and mathematical modelling. We assessedthe influence of biofilm thickness and density on the dimensionless effective diffusivity coefficient f(equal to the biofilm-to-aqueous diffusivity ratio) and the distribution coefficient Kd,eq (L g�1). Sorptionwas significant only for eight positively charged micropollutants (atenolol, metoprolol, propranolol,citalopram, venlafaxine, erythromycin, clarithromycin and roxithromycin), revealing the importance ofelectrostatic interactions with solids. Sorption equilibria were likely not reached within the duration ofbatch experiments (4 h), particularly for the thickest biofilm, requiring the calculation of the distributioncoefficient Kd,eq based on the approximation of the asymptotic equilibrium concentration (t > 4 h). Kd,eq
values increased with increasing biofilm thickness for all sorptive micropollutants (except atenolol),possibly due to higher porosity and accessible surface area in the thickest biofilm. Positive correlationsbetween Kd,eq and micropollutant properties (polarity and molecular size descriptors) were identified butnot for all biofilm thicknesses, thus confirming the challenge of improving predictive sorption models forpositively charged compounds. A diffusion-sorption model was developed and calibrated againstexperimental data, and estimated f values also increased with increasing biofilm thickness. This indicatesthat diffusion in thin biofilms may be strongly limited (f ≪ 0.1) by the high biomass density (reducedporosity).
© 2017 Elsevier Ltd. All rights reserved.
1. Introduction
In wastewater treatment systems, partitioning of organicmicropollutants to solid matrices is one of the mechanisms leading
ical University of Denmark,rk; Department of Chemicalh BA2 7AY, UKical University of Denmark,[email protected] (B.Gy. Pl�osz).
to their removal from the aqueous phase. The extent of partitioningis typically compound-dependent, and is governed by its affinity fororganic phase (hydrophobic partitioning) and/or by electrostaticand other similar interactions between ionized molecules andcharged solid surfaces (non-hydrophobic partitioning) (Franco andTrapp, 2008; Hyland et al., 2012; Ternes et al., 2004; Mackay andVasudevan, 2012; Polesel et al., 2015).
Partitioning describes the distribution of molecules between theaqueous and the solid phase. At equilibrium, sorption anddesorption rates are equal, and the ratio of sorbed and dissolvedconcentrationsdnormalized to the concentration of solidsdisdefined as the (linear) solid-liquid partition coefficient Kd

E. Torresi et al. / Water Research 123 (2017) 388e400 389
(expressed in units of L kg�1 or, alternatively, L g�1) (Joss et al.,2006; Ternes et al., 2004). Non-linear expressions (Freundlich andLangmuir isotherms) have been also used to describe partitioningequilibria to account for saturation of solid surfaces or synergisticeffects (Delle Site, 2001).
Solid-liquid partitioning onto activated sludge biomass has beencharacterized for a large number of pharmaceuticals. Considerablyless evidence is available for biofilms, being limited to antibiotics(sulfamethoxazole, erythromycin, ciprofloxacin, tetracycline) andpsycho-active drugs (fluoxetine) in biofilters (Wunder et al., 2011)and granules (Alvarino et al., 2015; Shi et al., 2011). Additionally,partitioning kinetics of other organic contaminants (polycyclic ar-omatic hydrocarbons, estrogens, nonylphenols, biocides) have beenassessed for pure culture biofilms (Wicke et al., 2008, 2007) andriver biofilms (Headley et al., 1998; Writer et al., 2011).
Although considered a fast process, partitioning is influenced bymass transfer limitation through diffusive boundary layers andinside the solid matrices, which likely determines the time neededto achieve equilibrium between aqueous and sorbed concentra-tions (Joss et al., 2004, 2006). While for activated sludge the equi-librium time is sufficiently fast to prevent an empirical evaluationof mass transfer limitation (Joss et al., 2004; Pl�osz et al., 2010;Barret et al., 2011), molecular diffusion may have a major role indetermining partitioning kinetics in biofilms. Biofilm characteris-tics, such as biomass density and porosity, have been found to in-fluence intra-biofilm diffusion of a number of organic and inorganicchemical compounds. This effect has been described by introducinga coefficient f, defined as the ratio of effective diffusivity in biofilmsand in free aqueous media, thus defining diffusivity reduction inbiofilms (Fan et al., 1990; Guimer�a et al., 2016; Horn andMorgenroth, 2006; Trapp and Matthies, 1998; Zhang and Bishop,1994a). While f was determined for a number of organic andinorganic chemical compounds, no conclusive evidence currentlyexists for organic micropollutant diffusion in biofilms, which wastherefore investigated in this study.
In our previous work (Torresi et al., 2016), we explored thebiological transformation of pharmaceuticals in nitrifying movingbed biofilm reactors (MBBRs) using novel MBBR carriers (Anox-Kaldnes Z-carriers), allowing the control of the biofilm thickness.
In this study, the main objective set was to assess how thediffusion and the partitioning of 23 selected pharmaceuticals varyat different biofilm thicknesses (50, 200 and 500 mm) and toquantify corresponding single point Kd values at environmentallyrelevant concentration levels. By developing and calibrating amodel that describes diffusive transport and partitioning in bio-films, we aimed at elucidating the influence of biofilm thickness on(i) the molecular diffusion of micropollutants within biofilm ma-trix, described by the dimensionless effective diffusivity coefficientf; (ii) the extent of partitioning, described by the coefficient Kd.Additionally, experimental and modelling results were used toassess the influence of biofilm characteristics (porosity, density)and molecular properties (e.g., hydrophobicity, ionization) on themass transfer limitation and sorption of micropollutants inbiofilms.
2. Model development
2.1. Conceptual approach for diffusion and sorption in biofilms andmodel implementation
Considering molecular diffusion of dissolved micropollutantsfrom the bulk aqueous phase into biofilms as the dominant masstransfer mechanism (Zhang and Bishop, 1994a), the partitioning oforganic micropollutants consists of three consecutive steps (Joss
et al., 2004): (1) diffusion of dissolved micropollutant from bulkaqueous phase, through a boundary layer, into the biofilm matrix;(2) diffusion of dissolvedmicropollutant through the biofilmmatrixvia its pores; (3) sorption to the solid phase of the biofilm matrix(Fig. 1a). The diffusivity of organic chemicals in a free aqueousmedium (DW,i, m2 d�1) can be predicted from properties of thechemical (e.g., molar volume) and of the medium. In this study, DW,i
values for each chemical were calculated according to Hayduk andLaudie (1974), while alternative approaches were also tested(Table S1 in Supplementary Information).
Transport from the bulk liquid to the biofilm is controlled by thediffusion through a boundary layer, for which the diffusivity wasassumed equal to DW,i (Assumption I, Fig 1b). The thickness of theboundary layer, LL (mm), was assumed to be equal to 10 mm for allthe Z-carriers (Brockmann et al., 2008; see section 1 in SI). In bio-films, molecular diffusivity is reduced compared to free aqueousmedia (Wanner and Reichert, 1996). This has been attributed to the“tortuosity” of the transport path in biofilms, i.e. the increased(non-linear) path length needed for diffusive transport ascompared to free aqueous media (Zhang and Bishop, 1994b). Mo-lecular diffusivity reduction is described by the dimensionless co-efficient f, resulting in Eq. (1):
Dbf ;i ¼ f $DW;i (1)
where Dbf,i (m2 d�1) is the effective diffusivity of micropollutantswithin biofilms and f (�) is always lower than 1. While f values of0.5e0.8 have been assigned for micropollutant diffusion (Ort andGujer, 2008; Vasiliadou et al., 2014), this parameter is likely tosignificantly vary depending on the biofilm structure and proper-ties (biofilm thickness, density, porosity and tortuosity).
It has previously been shown that biofilm porosity and densitycan vary over the biofilm depth (Zhang and Bishop, 1994a). In themodel, we assumed the biofilm as a homogenous porous medium(Assumption II), although we accept that biofilms with differentthickness can have different average porosities and densities. As aconsequence, only one f value was used to describe diffusionreduction into a biofilm with a certain thickness.
Sorption/desorption kinetics were described using first-orderrate equations (see matrix in Fig. 1c). Sorption was consideredas an instantaneous equilibrium process (Assumption III) byattributing an arbitrarily high value to the desorption rate kdes,thereby making diffusion from the bulk aqueous phase andwithin the biofilm the rate-limiting steps for solid-liquid parti-tioning. At micropollutant concentration levels targeted in thisstudy (ng L�1 to mg L�1), sorption can be considered linear andbetter described by the distribution coefficient Kd (AssumptionIV).
Based on the presented conceptual approach, a diffusion-sorption model was implemented as one-dimensional biofilmmodel in Aquasim 2.1 (Reichert, 1994). Carrier design characteris-tics and measured biofilm properties (biofilm thickness, surfacearea, biomass density, porosity) were used as input to the model(see Table 1). Each biofilm was spatially discretized in 20completely mixed layers. This allowed solving the generic massbalance equation for dissolved micropollutant concentration CL (ngL�1) in biofilm (Eq. (2)):
vCLvt
¼ Dbf ;iv2CLvz2
� kdesKdCLX þ kdesCS (2)
(where X is the biomass concentration in biofilm, g L�1; CS is thesorbed micropollutant concentration, ng L�1; CL varies with time tand depth z) as a set of ordinary differential equations by using themethod of lines (Wanner and Reichert, 1996). According to the

ProcessComponent
Process rateCL CS
Desorption 1 -1 kdesCS
Sorption -1 1 kdesKdCLX
Assumptions(I) Same diffusivity in bulk liquid and boundary layer
(II) Biofilm is a homogeneous porous medium(III) Sorption to biofilm solid matrix is instantaneous,
i.e. sorption kinetics limited by diffusion though boundary layer and biofilm pores
(IV) Sorption is assumed linear (Kd)
Bulk aqueous
phaseBoundarylayer
Biofilm
DWDW
Dbf
kdes
Transfer through boundary layer
Transfer in biofilm pores
Sorption/desorption
1
2
3Biofilm layer i
a
b c
kdesKdDbf (= f DW)
Dbf
Fig. 1. Conceptual model for diffusion and sorption of micropollutants into biofilms, including (a) a graphical description of the biofilm as porous medium, with discretization in 20finite completely mixed layers, and of the consecutive steps required for partit ioning onto biofilm solids (processes 1e3, see text); (b) the assumptions considered in the model; and(c) the process matrix describing sorption and desorption kinetics.
E. Torresi et al. / Water Research 123 (2017) 388e400390
diffusion-sorption model, micropollutants undergo equilibriummicroscale partitioning as they diffuse through biofilm, in analogyto the approach proposed by Wu and Gschwend (1986). Furtherdetails on the conceptual biofilm model, on microscopic massbalances and on the initial conditions are given in the Supple-mentary Information (Section S1 and Fig. S1).
2.2. Calculation of sorption coefficients
At equilibrium, the micropollutant concentration sorbed ontobiomass (CS,eq, mg L�1) is proportional to the dissolved concen-tration (CL,eq, mg L�1), and their ratio, normalized by the concen-tration of solids (Xbiomass, g L�1), is used to calculate the sorptioncoefficient Kd. With negligible transformation, it is commonlyassumed (e.g., in activated sludge) that the sorbed concentrationis equivalent to the decrease in dissolved concentration(CL,0 � CL,eq) between the beginning and the end of batch sorptionexperiments.
When considering biofilm systems, transport in biofilm pores,along with sorption, can also determine a decrease of micro-pollutant concentrations in the bulk phase. Hence, the coefficientKd,eq (L g�1) was defined to describe sorption in Z-carrier biofilms
Table 1Biofilm characteristics and input parameters used in the sorption and diffusion model in th(defining a true density), while r denotes the drymass of (microbial) biomass per volumetotal attached solids.
Parameter Z50
Dry biofilm mass per carrier (gTAS m�2) 2.6 ± 0.2Biofilm dry density rd (g cm�3) 1.05 ± 0.09Biomass density in wet biofilm r (kg m�3) 51.9 ± 2.6Porosity ε (%) 75 ± 4Biomass concentration in batch reactor (gTAS L�1) 0.80 ± 0.07
based on mass balance considerations (Eq. (3)):
Kd;eq ¼h
CL;0VbulkVbulkþVbf ;wet
� CL;eqðVbulkþVPW ÞVbulkþVbf ;wet
iCL;eqXbiomass
(3)
where Vbulk (L) denotes the volume of the bulk liquid, Vbf,wet (L) thevolume of wet biofilm (equal to the total surface area of Z-carrierstimes the defined biofilm thickness) and VPW (L) the volume of thepore water in the biofilm matrix, not accounting for cellular watercontent (section S2). The procedure used to derive Eq. (3) is pre-sented in detail in the Supplementary Information (section S3).
The ‘asymptotic’ concentration CL,eq, defining true sorptionequilibrium, was estimated by fitting measured concentrationprofiles in batch sorption experiments with a first-order decayequation (Eq. (4))
CLðtÞ ¼�CL;0 � CL;eq
�e�kt þ CL;eq (4)
In activated sludge, it has been widely accepted that sorptionequilibrium can be reached within 0.5e1 h (Ternes et al., 2004;Andersen et al., 2005; Yi and Harper, 2007; H€orsing et al., 2011).To verify whether sorption equilibriumwas achieved relatively fast
is study. The parameter rd denotes the dry mass of biofilm per volume of dry biofilmof wet biofilm (defining the concentration of biomass within the biofilm). TAS defines
Z200 Z500 Reference
4.0 ± 0.3 8.0 ± 0.6 Measured1.05 ± 0.07 1.17 ± 0.05 Calculated20.0 ± 1.3 16.0 ± 0.8 Calculated91 ± 6 93 ± 7 Calculated0.78 ± 0.06 0.78 ± 0.03 Measured

E. Torresi et al. / Water Research 123 (2017) 388e400 391
(i.e., within the 4-hour duration of sorption experiments) also in Z-carrier biofilms, the sorption coefficient Kd,4h (L g�1) was calculated(Eq. (5)):
Kd;4h ¼h
CL;0VbulkVbulkþVbf ;wet
� CL;4hðVbulkþVPW ÞVbulkþVbf ;wet
iCL;4hXbiomass
(5)
where CL,4h is the measured dissolved concentration in bulkaqueous phase at t¼4 h (the last measurement in sorption exper-iments), replacing CL,eq in Eq. (3). Specifically, the 4-hour equilib-rium assumption was verified by comparing Kd,4h and Kd,eq andassessing the relative deviation between the two coefficients.
As mentioned above, the decrease of bulk micropollutant con-centration during sorption experiments with biofilms results fromtransport in biofilm pores (besides sorption in biofilms). To verifythe impact of neglecting mass transfer to biofilm pores on sorptioncoefficient determination, the sorption coefficient Kd,susp wascalculated (Eq. (6)):
Kd;susp ¼ CL;0 � CL;eqCL;eqXbiomass
(6)
where CL,eq was calculated using Eq. (4). Notably, Eq. (6) iscommonly used to describe sorption onto suspended activatedsludge, where the effect of porosity is neglected. The comparisonbetween Kd,eq and Kd,susp (together with relative deviation of thetwo coefficients) was used to quantify the contribution of transportto biofilm pores, hence the impact of porosity, on the estimatedsorption coefficient.
2.3. Parameter estimation approach
The assessment of diffusion and sorption of micropollutants inbiofilms consisted of two main consecutive steps performed foreach micropollutant and at different biofilm thicknesses: (i)calculation of the coefficient Kd,eq (section 2.2); (ii) calibration ofthe diffusion-sorption model (section 2.1) against experimentaldata and estimation of the coefficient f, which was the only pa-rameters fitted in the model. Estimation of f was performed usingthe secant model calibration algorithm embedded in Aquasim 2.1.
3. Materials and methods
3.1. System description and operation
Nitrifying MBBRs used in this study have been described else-where (Torresi et al., 2016). Briefly, two laboratory-scale nitrifyingMBBRs were operated in parallel under continuous-flow conditionsfor approximately 300 days. Z-carriers (AnoxKaldnes AB, Lund,Sweden) were used to obtain biofilms of different thicknesses. Z-carriers have a saddle shaped grid covered surface allowing forbiofilm growth only up to the height of the grid wall (Fig. S7). Threedifferent Z-carriers (named Z50, Z200, and Z500) were used in thisstudy, with the numbers indicating the grid wall height in mm(hence the maximum controlled biofilm thickness). Biofilms wereenriched by feeding the MBBRs with effluent wastewater from alocal municipal treatment plant (K€allby, Lund, Sweden), spikedwith ammonium (50 mg L�1 of NH4-N as NH4Cl) and phosphate(0.5 mg L�1 of PO4-P as KH2PO4). The MBBRs were operated undersimilar conditions, i.e. hydraulic residence time of 2 h, dissolvedoxygen concentration of 4.5 ± 0.5 mg L�1, pH of 7.5 ± 0.5 andtemperature of 20 �C (achieved using a thermostat).
3.2. Sorption batch experiments
Sorption batch experiments were performed after reachingstable nitrogen removal (Torresi et al., 2016), roughly around day300. Prior to batch experiments, the twoMBBRs were disconnectedand three types of Z-carriers (Z50, Z200, Z500) were manuallyseparated. Subsequently, Z-carriers were left overnight at 4 �C in abeaker with tap water to allow for desorption of micropollutantspossibly sorbed during continuous-flow operation.
Sorption batch experiments were carried out in three 200-mLglass beakers using filtered (0.2 mm Munktell MG/A glass fiber fil-ters) effluent wastewater from K€allby treatment plant. Ammoniumand nitrate in the feed were at concentration of <0.5 mgN L�1 and6 mgN L�1, respectively, while dissolved organic carbon concen-tration was lower than 35 mgCOD L�1, mostly in inert form.
The biomass concentration in the three glass beakers wasadjusted to 0.8 g L�1 (Table 1) based on attached biomass con-centrationmeasurements for the different carriers and by adjustingthe number of carriers accordingly (56 carriers for Z50, 32 for Z200and 16 for Z500), resulting in a total biofilm surface area of 0.06,0.04, 0.02 m2 for the batch containing Z50, Z200 and Z500 carriers,respectively. Other abiotic removal processes, such as volatilization,sorption of micropollutants on plastic carriers and glass wall, hadbeen previously assessed and found negligible in theMBBRs used inthis study (Torresi et al., 2016).
Twenty-three micropollutants were spiked in all the beakerswith an initial concentration of 1 mg L�1 except for X-ray contrastmedia (15 mg L�1), which are usually found at higher concentrationsin effluent wastewater (Margot et al., 2015). A stock solution, con-taining micropollutants dissolved in methanol (40 mg L�1), wasfirst spiked into empty glass beakers and themethanol was allowedto evaporate in the fumehood for approximately 1 h. Subsequently,the solution was resuspended in filtered effluent for approximately30min to dissolve the spikedmicropollutants. Biomass inactivationwas achieved by: (i) addition of allylthiourea (ATU, 10 mg L�1, Tranet al., 2009; Khunjar and Love, 2011) and nitrogen sparging (Hamonet al., 2014) to inhibit nitrifying bacteria; and (ii) addition of sodiumazide (0.5 g L�1; Rattier et al., 2014) to inhibit the activity of het-erotrophic bacteria.
The experiment duration was set to 4 h. Homogenous aqueoussamples were collected at regular intervals from the bulk phase ineach beaker at 0, 5, 10, 30, 90 and 240 min. The batch experimentswere performed at ambient temperature and initial pH wasmeasured to be 7.5 ± 0.5. Since only one spiking concentration wastested, results from sorption experiments were used to determinesingle point Kd values.
3.3. Chemicals
Twenty-three environmentally relevant micropollutants wereselected for this study. The targeted pharmaceuticals were groupedin six categories according to their use: (i) four beta-blocker phar-maceuticals (atenolol, metoprolol, propranolol and sotalol); (ii) fiveX-ray contrast media (diatrizoic acid, iohexol, iopamidol, iopro-mide, iomeprol); (iii) three sulfonamide antibiotics (sulfadiazine,sulfamethizole and sulfamethoxazole), one metabolite (acetyl-sulfadiazine) and one combination product (trimethoprim); (iv)three non-steroidal anti-inflammatory pharmaceuticals (phena-zone, diclofenac, ibuprofen); (v) three psycho-active drugs (carba-mazepine, venlafaxine and citalopram); (vi) three macrolideantibiotics (erythromycin, clarithromycin and roxithromycin).Further information regarding chemical structure and properties,CAS numbers and chemical suppliers can be found in Tables S2eS3and in Escol�a Casas et al. (2015).
E. Torresi et al. / Water Research 123 (2017) 388e400392
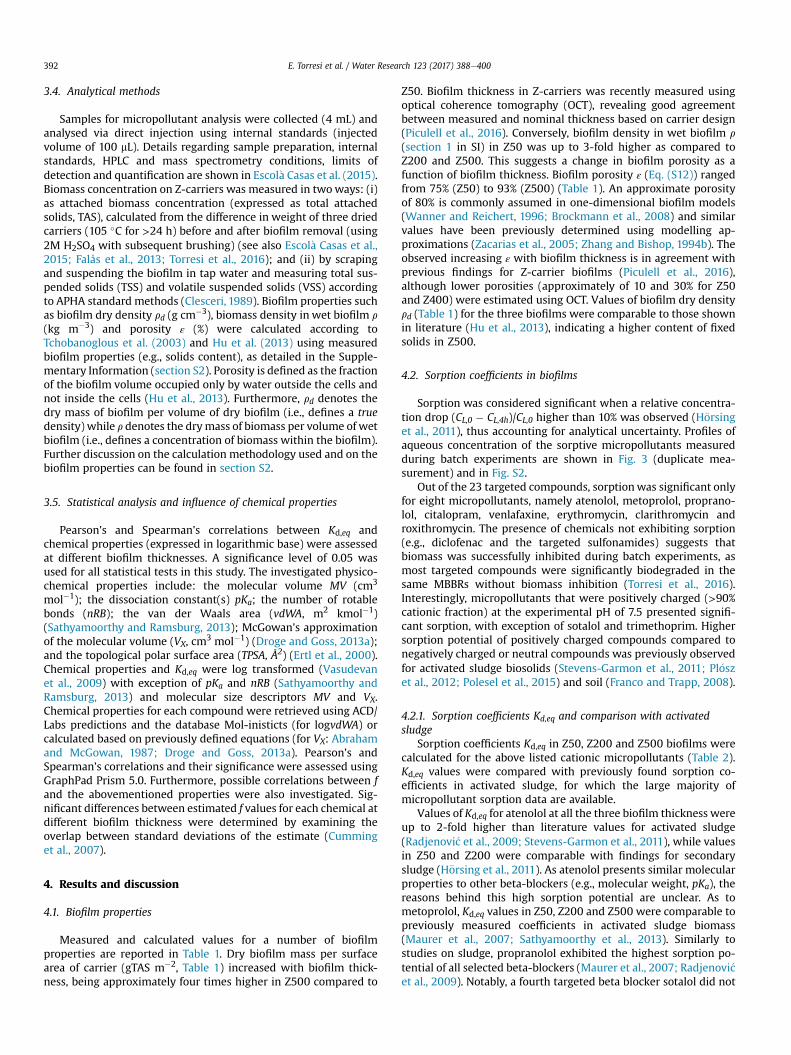
3.4. Analytical methods
Samples for micropollutant analysis were collected (4 mL) andanalysed via direct injection using internal standards (injectedvolume of 100 mL). Details regarding sample preparation, internalstandards, HPLC and mass spectrometry conditions, limits ofdetection and quantification are shown in Escol�a Casas et al. (2015).Biomass concentration on Z-carriers was measured in twoways: (i)as attached biomass concentration (expressed as total attachedsolids, TAS), calculated from the difference in weight of three driedcarriers (105 �C for >24 h) before and after biofilm removal (using2M H2SO4 with subsequent brushing) (see also Escol�a Casas et al.,2015; Falås et al., 2013; Torresi et al., 2016); and (ii) by scrapingand suspending the biofilm in tap water and measuring total sus-pended solids (TSS) and volatile suspended solids (VSS) accordingto APHA standard methods (Clesceri, 1989). Biofilm properties suchas biofilm dry density rd (g cm�3), biomass density in wet biofilm r
(kg m�3) and porosity ε (%) were calculated according toTchobanoglous et al. (2003) and Hu et al. (2013) using measuredbiofilm properties (e.g., solids content), as detailed in the Supple-mentary Information (section S2). Porosity is defined as the fractionof the biofilm volume occupied only by water outside the cells andnot inside the cells (Hu et al., 2013). Furthermore, rd denotes thedry mass of biofilm per volume of dry biofilm (i.e., defines a truedensity) while r denotes the drymass of biomass per volume of wetbiofilm (i.e., defines a concentration of biomass within the biofilm).Further discussion on the calculation methodology used and on thebiofilm properties can be found in section S2.
3.5. Statistical analysis and influence of chemical properties
Pearson's and Spearman's correlations between Kd,eq andchemical properties (expressed in logarithmic base) were assessedat different biofilm thicknesses. A significance level of 0.05 wasused for all statistical tests in this study. The investigated physico-chemical properties include: the molecular volume MV (cm3
mol�1); the dissociation constant(s) pKa; the number of rotablebonds (nRB); the van der Waals area (vdWA, m2 kmol�1)(Sathyamoorthy and Ramsburg, 2013); McGowan's approximationof the molecular volume (VX, cm3 mol�1) (Droge and Goss, 2013a);and the topological polar surface area (TPSA, Å2) (Ertl et al., 2000).Chemical properties and Kd,eq were log transformed (Vasudevanet al., 2009) with exception of pKa and nRB (Sathyamoorthy andRamsburg, 2013) and molecular size descriptors MV and VX.Chemical properties for each compound were retrieved using ACD/Labs predictions and the database Mol-inisticts (for logvdWA) orcalculated based on previously defined equations (for VX: Abrahamand McGowan, 1987; Droge and Goss, 2013a). Pearson’s andSpearman’s correlations and their significance were assessed usingGraphPad Prism 5.0. Furthermore, possible correlations between fand the abovementioned properties were also investigated. Sig-nificant differences between estimated f values for each chemical atdifferent biofilm thickness were determined by examining theoverlap between standard deviations of the estimate (Cumminget al., 2007).
4. Results and discussion
4.1. Biofilm properties
Measured and calculated values for a number of biofilmproperties are reported in Table 1. Dry biofilm mass per surfacearea of carrier (gTAS m�2, Table 1) increased with biofilm thick-ness, being approximately four times higher in Z500 compared to
Z50. Biofilm thickness in Z-carriers was recently measured usingoptical coherence tomography (OCT), revealing good agreementbetween measured and nominal thickness based on carrier design(Piculell et al., 2016). Conversely, biofilm density in wet biofilm r
(section 1 in SI) in Z50 was up to 3-fold higher as compared toZ200 and Z500. This suggests a change in biofilm porosity as afunction of biofilm thickness. Biofilm porosity ε (Eq. (S12)) rangedfrom 75% (Z50) to 93% (Z500) (Table 1). An approximate porosityof 80% is commonly assumed in one-dimensional biofilm models(Wanner and Reichert, 1996; Brockmann et al., 2008) and similarvalues have been previously determined using modelling ap-proximations (Zacarias et al., 2005; Zhang and Bishop, 1994b). Theobserved increasing ε with biofilm thickness is in agreement withprevious findings for Z-carrier biofilms (Piculell et al., 2016),although lower porosities (approximately of 10 and 30% for Z50and Z400) were estimated using OCT. Values of biofilm dry densityrd (Table 1) for the three biofilms were comparable to those shownin literature (Hu et al., 2013), indicating a higher content of fixedsolids in Z500.
4.2. Sorption coefficients in biofilms
Sorption was considered significant when a relative concentra-tion drop (CL,0 � CL,4h)/CL,0 higher than 10% was observed (H€orsinget al., 2011), thus accounting for analytical uncertainty. Profiles ofaqueous concentration of the sorptive micropollutants measuredduring batch experiments are shown in Fig. 3 (duplicate mea-surement) and in Fig. S2.
Out of the 23 targeted compounds, sorptionwas significant onlyfor eight micropollutants, namely atenolol, metoprolol, proprano-lol, citalopram, venlafaxine, erythromycin, clarithromycin androxithromycin. The presence of chemicals not exhibiting sorption(e.g., diclofenac and the targeted sulfonamides) suggests thatbiomass was successfully inhibited during batch experiments, asmost targeted compounds were significantly biodegraded in thesame MBBRs without biomass inhibition (Torresi et al., 2016).Interestingly, micropollutants that were positively charged (>90%cationic fraction) at the experimental pH of 7.5 presented signifi-cant sorption, with exception of sotalol and trimethoprim. Highersorption potential of positively charged compounds compared tonegatively charged or neutral compounds was previously observedfor activated sludge biosolids (Stevens-Garmon et al., 2011; Pl�oszet al., 2012; Polesel et al., 2015) and soil (Franco and Trapp, 2008).
4.2.1. Sorption coefficients Kd,eq and comparison with activatedsludge
Sorption coefficients Kd,eq in Z50, Z200 and Z500 biofilms werecalculated for the above listed cationic micropollutants (Table 2).Kd,eq values were compared with previously found sorption co-efficients in activated sludge, for which the large majority ofmicropollutant sorption data are available.
Values of Kd,eq for atenolol at all the three biofilm thickness wereup to 2-fold higher than literature values for activated sludge(Radjenovi�c et al., 2009; Stevens-Garmon et al., 2011), while valuesin Z50 and Z200 were comparable with findings for secondarysludge (H€orsing et al., 2011). As atenolol presents similar molecularproperties to other beta-blockers (e.g., molecular weight, pKa), thereasons behind this high sorption potential are unclear. As tometoprolol, Kd,eq values in Z50, Z200 and Z500 were comparable topreviously measured coefficients in activated sludge biomass(Maurer et al., 2007; Sathyamoorthy et al., 2013). Similarly tostudies on sludge, propranolol exhibited the highest sorption po-tential of all selected beta-blockers (Maurer et al., 2007; Radjenovi�cet al., 2009). Notably, a fourth targeted beta blocker sotalol did not

E. Torresi et al. / Water Research 123 (2017) 388e400 393
show any significant sorption, in agreement with previous findingsin activated sludge (Maurer et al., 2007; Sathyamoorthy et al.,2013).
Values of Kd,eq for Z50 and Z200 were comparable with previousstudies on conventional activated sludge and membrane bioreactor(MBR) sludge for clarithromycin (Abegglen et al., 2009; G€obel et al.,2005), erythromycin (Radjenovi�c et al., 2009; Xue et al., 2010) androxithromycin (Abegglen et al., 2009; H€orsing et al., 2011). On thecontrary, Kd,eq for Z500 differed by one order of magnitude frompreviously reported values. Nevertheless, 50e80% of dissolvedclarithromycin and roxithromycin were found to be sorbed on MBRsludge (Abegglen et al., 2009), similarly to this study (~80%).Furthermore, highly variable macrolide sorption was shown in soiland onto humic acids (Sibley and Pedersen, 2008; Uhrich et al.,2014), with estimated Kd,eq values also higher than 8 L g�1 or20 L g�1, respectively. Macrolides exhibited the highest Kd,eq of allsorptive compounds in Z500 but not at lower biofilm thickness(Table 2). This might be related to the low porosity of the biofilmsZ50 and Z200. According to Lipinksi’s rule of five (Lipinski et al.,1997), macrolides are expected to poorly permeate across cellmembranes and thus to move only in the intracellular space(depending on the porosity) due to their high molecular weight(>500 g mol�1). Furthermore, macrolides are mainly excreted infeces (G€obel et al., 2005) and due to protonation of the tertiaryamino group, strong ionic interaction of macrolides with thenegatively charged surface of the biomass could be expected.
Few studies investigated the sorption of the antidepressantvenlafaxine and the antiepileptic citalopram. While sorption co-efficients for Z50 and Z200 for both compounds are in agreementwith existing literature on activated sludge (H€orsing et al., 2011),higher values were found in Z500 for citalopram.
In general, sorption coefficients of all the compounds at thethree biofilm thicknesses were comparable or higher than valuesobserved with activated sludge biomass. Studies comparing sorp-tion onto MBR sludge and conventional activated sludge biomass(Joss et al., 2006; Abegglen et al., 2009; Reif et al., 2011; Yi andHarper, 2007) revealed a sorption enhancement in the formercase. Increased sorption was associated to the smaller size of MBRsludge flocs (assumed to be around 80e300 mm in diameter), thusresulting in higher accessible surface area (Tchobanoglous et al.,2003). In analogy with MBR sludge, it can be postulated that thehigh accessible surface area in Z-carrier biofilms (related to the
Table 2Sorption coefficients calculated using the asymptotic equilibrium concentration (Kd,eq, Lcentration (t¼ 4 h) during batch experiments (Kd,4h, L g�1) for eight of the 23 spiked chemKd values, providing also an indication of the deviation from partitioning equilibrium. Litesludge and membrane bioreactor (MBR) sludge.
Z50 Z200
Kd,eq (L g�1) Kd,4h (L g�1) D (%) Kd,eq (L g�1) Kd,4h (L g
Atenolol 1.12 ± 2.21 0.26 77 1.12 ± 0.34 0.68Metoprolol 0.08 ± 0.01 0.08 3 0.19 ± 0.06 0.16Propranolol 0.50 ± 0.04 0.54 �9 1.71 ± 0.03 1.67Clarithromycin 0.42 ± 0.11 0.34 20 0.41 ± 0.02 0.39Erythromycin 0.33 ± 0.07 0.34 �3 0.20 ± 0.01 0.20Roxithromycin 0.00 0.00 / 0.86 ± 0.13 1.05Citalopram 0.47 ± 0.08 0.46 1 0.67 ± 0.08 0.61Venlafaxine 0.00 0.00 / 0.12 ± 0.05 0.09
a Radjenovi�c et al. (2009) for atenolol the lowest value was in MBR sludge.b H€orsing et al. (2011) for atenolol in activated sludge.c Maurer et al. (2007).d Sathyamoorthy et al. (2013).e G€obel et al. (2005).f Abegglen et al. (2009) in MBR.g Xue et al. (2010) in conventional activated sludge and MBR sludge.h Fernandez-Fontaina et al. (2012).
biofilm porous structure) may explain the increased sorption ca-pacity of most of the compounds compared to conventional acti-vated sludge biomass.
4.2.2. Comparison between Kd,eq and Kd,4h
Sorption coefficients Kd,eq were compared with Kd,4h values foreach chemical and relative deviations D (%) between these twocoefficients were calculated at different biofilm thicknesses(Table 2) to verify the equilibrium assumption within the experi-ment duration (4 h). For most compounds, relative deviations forZ50 and Z200 were on average around 10%, with the exception ofatenolol (>50%). Conversely, D values in Z500 were for five com-pounds higher than 30% (up to 80% for atenolol).
Overall, while the assumption of equilibrium reached within 4 hseems justified for Z50 and Z200, diffusive mass transfer cansignificantly influence observations at higher biofilm thickness.Atenolol was the main exception, for which the 4-h equilibriumassumption seems not valid at any biofilm thickness. On the con-trary, propranolol appeared to reach partitioning equilibriumwithin 4-h in Z50, Z200 and Z500, and similar considerations couldbe made for citalopram and venlafaxine. Therefore, to reduce un-certainties in sorption experiments, parameter estimation canbenefit from calculating the asymptotic aqueous concentrationvalue using e.g., simplified first-order decay equations (Eq. (4)).
4.2.3. Comparison between Kd,eq and Kd,sups and trends with biofilmthickness
To assess the impact of biofilm porosity and mass transfer inpores on sorption coefficient estimation, the sorption coefficientsKd,eq and Kd,suspwere compared (Table S4). In Fig. 2, this comparisonis presented for two key chemicals (a: metoprolol, b: roxi-thromycin). For all micropollutants, neglecting the transport frombulk aqueous phase to biofilm pores resulted in an overestimationof sorption coefficients (Kd,susp always greater than Kd,eq). Therelative deviation between Kd,susp and Kd,eq was on average � 10%for most compounds and 30% for less sorptive compounds (meto-prolol and venlafaxine).
We further observed that both Kd,eq and Kd,susp generallyincreased with increasing biofilm thickness (Fig. 2). Specifically,Kd,eq values in Z500 were from 4-fold (most of the compounds) upto 30-fold higher (macrolides antibiotics) than in Z50 (Table 2). Itshould be highlighted that batch experiments were carried out at
g�1; mean and standard deviation are given) and the last measured aqueous con-ical compounds. The parameter D (%) defines the relative deviation between the tworature Kd values comprise measured partition coefficients in conventional activated
Z500 Literature Kd (L g�1)
�1) D (%) Kd,eq (L g�1) Kd,4h (L g�1) D (%)
38 4.84 ± 0.73 0.95 80 (0.006)ae1.9b
15 0.28 ± 0.02 0.15 44 <0.01ce0.23d
1 1.95 ± 0.06 1.92 �1 0.2ae0.32c
4 11.19 ± 0.20 5.63 48 0.26ee1.2f
�4 11.28 ± 2.10 6.13 43 0.31ae1.0g
�24 11.10 ± 0.30 3.92 64 <0.1he0.5f
8 2.52 ± 0.15 2.06 16 0.54b
25 0.14 ± 0.06 0.12 16 <0.1b

E. Torresi et al. / Water Research 123 (2017) 388e400394
the same biomass concentration in the reactors (0.8 g L�1).Consequently, the observed Kd,eq increase with biofilm thicknesslikely derives from differences in biofilm composition and/or in itsphysical properties. Two possible explanations of this observationwere proposed:
(i) Biomass composition, such as the relative fraction ofautotrophic and heterotrophic bacteria and/or the contentof extracellular polymeric substances (EPS), can influencesorption properties. EPS protein content was previouslypositively correlated with Kd for aromatic chemicals insewage sludge and colloids (Barret et al., 2010) and for theestrogen EE2 and trimethoprim in nitrifying and hetero-trophic biomass (Khunjar and Love, 2011). Bassin et al.(2012) further observed higher concentration of proteinsand polysaccharides (that mainly compose EPS) in hetero-trophic MBBRs than in nitrifying MBBRs. Higher fractions ofheterotrophic bacteria (determined using quantitative PCRof 16S rRNA) were measured in Z200 and Z500 comparedto Z50 (Torresi et al., 2016), possibly justifying theincreased sorption capacity in thicker biofilms. Furtherinvestigation on the EPS content in the different biofilms isthus required to support this hypothesis, given the key roleof EPS in the sorption of neutral and ionizable organicchemicals (Sp€ath et al., 1998; Barret et al., 2010; Khunjarand Love, 2011).
Metoprolol
0 200 400 6000.0
0.2
0.4
0.6
Kd
(L g
-1)
0 200 400 6000.0
0.5
1.0
MetoprololPropranololVenlafaxine
Kd,
eq/K
d,eq
Z500
Biofilm thic
aKd,eq
Kd,susp
c
Fig. 2. Values of the sorption coefficient calculated by accounting for and by neglecting biDifferent profiles of Kd,eq normalized to Kd,eq,Z500 (i.e., for biofilm Z500) as a function of bio
(ii) Porosity can influence the available surface area inside thebiofilm. Sorption can be positively impacted by reducedparticle size, i.e., greater specific surface area, in suspendedbiomass (Khunjar and Love, 2011) and biomass floc suspen-sion derived from MBRs (Yi and Harper, 2007). Thicker bio-films, having lower biomass density and substantially higherporosity than thin biofilms, could accordingly provide forhigher available surface (and thus more accessible sites) forsolid-liquid partitioning.
Finally, Kd,eq values were normalized to the highest value of Kd,eq
(i.e., for Z500, Kd,eqZ500). The obtained profiles followed two distincttrends as a function of biofilm thickness (Fig. 2ced): (i) beta-blockers and venlafaxine, exhibiting a logarithmic-like increasebetween Z50 and Z500; and (ii) macrolides and citalopram, pre-senting significantly higher values for Z500, thus an exponential-like increase of Kd,eq with thickness. The question arises as to theinfluence of the specific chemical properties of micropollutants onpartitioning in biofilms, which was further assessed using corre-lation analysis (see 4.5.2).
4.3. Modelling diffusion and sorption in biofilm
Based on the considerations above, calculated Kd,eq values wereused to calibrate the diffusion-sorptionmodel against experimentaldata for the estimation of the dimensionless effective diffusivity
Roxithromycin
0 200 400 6000.0
0.5
1.0
1.510
11
12
13
0 200 400 6000.0
0.5
1.0
ErythromycinClarithromycinCitalopramRoxithromycin
Kd,eq
Kd,susp
kness (μm)
b
d
ofilm porosity, Kd,susp and Kd,eq, respectively for metoprolol (a) and roxithromycin (b).film thickness are also shown for the sorptive micropollutants (c and d).

E. Torresi et al. / Water Research 123 (2017) 388e400 395
coefficient f (the only parameter estimated with the model).Simulated aqueous concentrations (continuous lines, Fig. 3) pre-dicted reasonably well the measured concentrations in bulk liquid(circles, Fig. 3) for most of the targeted compounds (i.e., for pro-pranolol, clarithromycin, erythromycin, roxithromycin, citalopram,venlafaxine R2 > 0.9; Table S5). For atenolol, measured concentra-tions were less well predicted for Z50 and Z500 (R2 equal to 0.8).
The simulated micropollutant concentrations in the bulk liquidand in the biofilm pore liquid (dashed lines, Fig. 3) should convergewhen partitioning equilibrium is reached. This equilibrium condi-tion was satisfied for most compounds in Z50 and Z200 within 4 hexperimental time, with an average 10% relative deviation betweensimulated concentrations in bulk and in biofilm pores. For thethickest biofilm (Z500), however, model predictions for most oftargeted chemicals suggested that equilibrium was not reachedwithin 4 h (60% average discrepancy with the last measurement). Itis likely that, due to the greater thickness, increased time to diffusein deeper biofilm and thus to achieve sorption equilibrium isrequired in Z500. The exception was propranolol, for which equi-librium seemed to be reached in all the three biofilms, thus sup-porting results (relative deviation between Kd,4h and Kd,eq)presented in Table 2. Formacrolide antibiotics, this discrepancywassignificant and simulation results suggested a time for partitioningequilibrium of approximately 10 daysdin good agreement withequilibrium times (days, months and years) in other environmentalmatrices (Delle Site, 2001). Furthermore, the large molecular
Fig. 3. Measured (technical replicates, in circles) and simulated (continuous line) aqueous cCL,0) and simulated concentrations in biofilm pore liquid (dashed lines) of six selected chemicbiofilms. Simulated CL in biofilm denotes the aqueous concentration in the deepest layer of thfigure legend, the reader is referred to the web version of this article.)
volume and weight of macrolides (2- to 3-fold higher than theother targeted compounds, Table S2), as well as their high sorptionpotential in Z500, suggest slower diffusive transport inside thebiofilm, as previously observed for hydrophobic organic moleculesin sediments and soil (Wu and Gschwend, 1986).
There is a large variability concerning the time to reach parti-tioning equilibrium for organic chemicals in biofilms (Alvarinoet al., 2015; Headley et al., 1998; Shi et al., 2011; Wicke et al.,2008; Writer et al., 2011), with values ranging from, e.g., 4e80 hfor biofilm of 0.1 mm thickness (Wicke et al., 2008). In conclusion,our observations conflict with the widely held assumption ofsignificantly shorter period of time (i.e. minutes to 1e2 h) neces-sary to reach equilibrium in activated sludge (e.g., H€orsing et al.,2011; Pomi�es et al., 2013). This may be explained by differencesin pore-scale (hydro)dynamic conditions in MBBRs and activatedsludge reactors, resulting in more pronounced mass transfer limi-tation in MBBRs.
4.4. Influence of biofilm and chemical properties on diffusion (f)and partitioning (Kd,eq)
4.4.1. Estimation of f and proposed empirical correlationValues of the dimensionless effective diffusivity coefficient f
estimated for the three biofilm thicknesses and the eight sorptivecompounds are reported in Fig. 4. For most of the compounds, withthe exception of roxithromycin, f decreased with biofilm density
oncentrations CL in bulk aqueous phase (normalized over initial aqueous concentrationals compounds during batch experiments with Z50 (red), Z200 (blue) and Z500 (green)e discretized biofilm (section 2.1). (For interpretation of the references to colour in this

E. Torresi et al. / Water Research 123 (2017) 388e400396
and thus increased with biofilm thickness and porosity (with f inZ500 significantly higher than in Z200 and Z50 for all the com-pounds, and f in Z200 significantly higher than Z50 for six com-pounds). In thinner biofilms (�50 mm), the transport ofmicropollutants could thus be limited by the high biomass densityand the reduced porosity. A number of regressions to estimate f ofsolutes in biofilms as a function of biofilm density or porosity havebeen previously developed (Fan et al., 1990; Guimer�a et al., 2016;Horn and Morgenroth, 2006; Zhang and Bishop, 1994a), suggest-ing a negative correlation between f and density. Selected regres-sion profiles (i.e., Guimer�a et al., 2016; Horn andMorgenroth, 2006;Zhang and Bishop, 1994a; see Table S6) are reported in Fig. S3 forcomparison with our f estimations. In particular, Guimer�a et al.(2016) observed strong mass transfer limitation (f < 0.1) for oxy-gen in biofilm with density greater than 50 gVSS L�1, in closeagreement with findings (specifically for Z50) presented in thisstudy. Furthermore, studies on the diffusion of organic contami-nants in pure culture biofilms (Holden et al., 1997; Wicke et al.,2007, 2008) revealed a 100- to 10,000-fold reduction of diffu-sivity in biofilms as compared to free water.
In general, estimated f values were lower than values calculatedfrom proposed regressions (Guimer�a et al., 2016; Horn andMorgenroth, 2006; Zhang and Bishop, 1994a) (Fig. S3). Whilethese regressions were identified for solutes with lower molecularweight (<100 g mol�1) and high solubility (e.g., O2, sodium chlo-ride, sodium nitrate), lower values of f (~0.2) were reported formost organic solutes with larger molecular weight (e.g., sugars andfatty acids; Stewart, 2003, 1998).
Given the possible influence of chemical properties onmicropollutant diffusivity, we evaluated the relationship betweenf and several physico-chemical descriptors (section 3.5). No spe-cific correlation was observed between f and molecular volumeand other descriptors (Fig. S4). We observed a positive correlationonly between f and logKOW of the targeted compounds (Fig. S5),while negative dependence was reported in literature for organiccompounds (Headley et al., 1998; Wicke et al., 2007; Wu andGschwend, 1986). Notably, in this study the correlation wasfound for less hydrophobic (0.1 < logKOW < 3.7) and positivelycharged compounds (differently from previous studies), forwhich electrostatic interactions may also have influenced trans-port and partitioning. Thus, an empirical correlation between f,biofilm density r (as function of biofilm thickness) and log KOW isproposed (Eq. (7)):
Fig. 4. Estimated values of dimensionless effective diffusivity f for the three biofilmthicknesses and the eight chemicals e showing significant sorption e by calibratingthe diffusion-sorption model.
f ¼ 1488$e�0:0072$LF
ln� �12:7� log KOW ;max
log Kow � log KOW ;max
�(7)
where LF is the biofilm thickness (mm) and log KOW,max is theasymptotic log KOW approximating the highest value for the com-pounds selected. Profiles of f deriving from Eq. (7) were thendepicted in Fig. 5, along with the estimated f values for the threebiofilm thickness (symbols, see also Fig. 4). Further details on theformulation of Eq. (7) are given in the SI (section S4). We note thatthe size of the available data set may not be sufficiently large tovalidate the correlation, and additional experimental evidence(higher biofilm thickness, wider range of log KOW) may be requiredfor further confirmation.
4.4.2. Predictors of micropollutant Kd,eq in biofilmsCorrelation analyses were performed between Kd,eq and a
number of physico-chemical micropollutant descriptors.First, the octanol-water partitioning coefficient of the neutral
species (logKOW) and the species-dependent octanol-water distri-bution coefficient (logD) were assessed, exhibiting insignificantcorrelation with Kd,eq (�0.27 < Pearson's r < 0.15 for the threebiofilms). This finding confirms the limited reliability of logKOW andlogD as sorption predictors for organic cations, as previously shownin soil (Tolls, 2001; Franco and Trapp, 2008; Droge and Goss,2013a).
Following this preliminary assessment, correlations withphysico-chemical descriptors for ionizable compounds (i.e., pKa,nrB, MV, logTPSA, logvdWA, VX) were investigated (Fig. 6 andFig. S6). Correlations for biofilm Z50 was performed only consid-ering six compounds (Kd,eq ¼ 0 for venlafaxine and roxithromycin).
No significant correlations were found with the stereochemistryparameter nRB and pKa (Fig. S6). While previous studies positivelycorrelated the sorption of cationic compounds with pKa (r2 ¼ 0.5)(Franco and Trapp, 2008), the narrow range of pKa values covered inthis study prevented us from concluding on the significance of thisindicator.
Interestingly, our analysis revealed a significant positive corre-lation only for Z500 between logKd,eq and logTPSA, logvdWA,
Fig. 5. Plots of the empirical equation describing f e for atenolol, erythromycin,metoprolol, propranolol, clarithromycin, roxithromycin, citalopram, venlafaxine e as afunction of biofilm thickness and log Kow, together with estimated f values (red sym-bols) in Z50, Z200 and Z500. (For interpretation of the references to colour in thisfigure legend, the reader is referred to the web version of this article.)
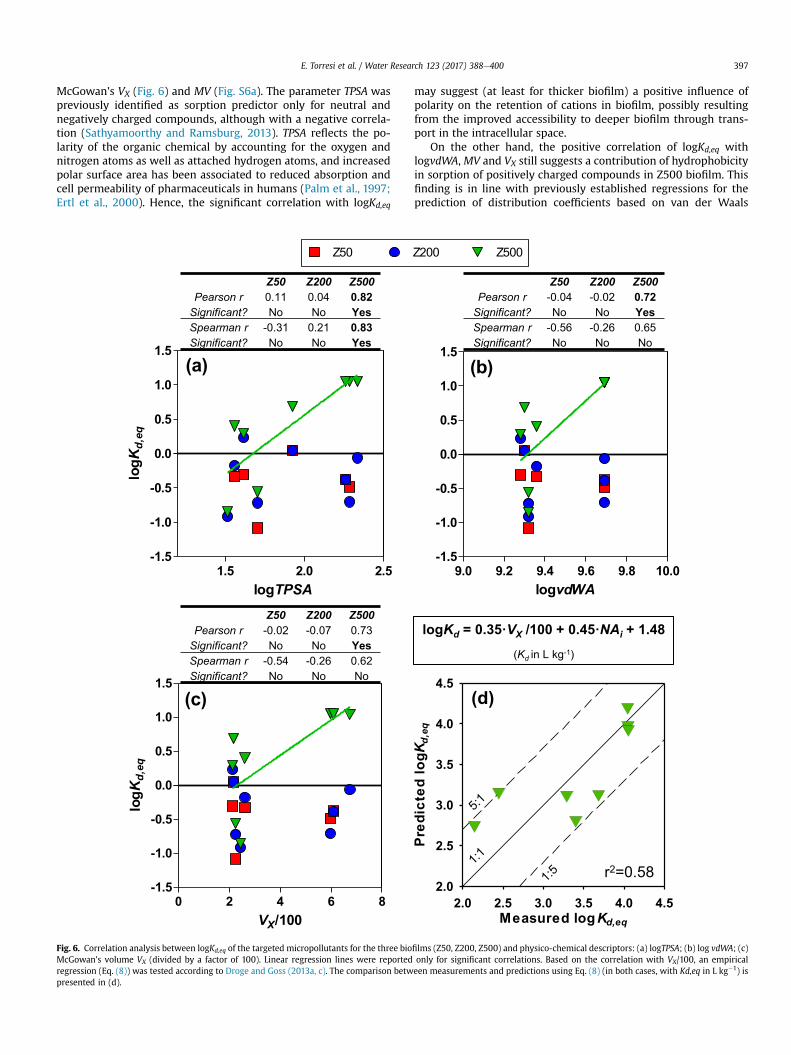
E. Torresi et al. / Water Research 123 (2017) 388e400 397
McGowan's VX (Fig. 6) and MV (Fig. S6a). The parameter TPSA waspreviously identified as sorption predictor only for neutral andnegatively charged compounds, although with a negative correla-tion (Sathyamoorthy and Ramsburg, 2013). TPSA reflects the po-larity of the organic chemical by accounting for the oxygen andnitrogen atoms as well as attached hydrogen atoms, and increasedpolar surface area has been associated to reduced absorption andcell permeability of pharmaceuticals in humans (Palm et al., 1997;Ertl et al., 2000). Hence, the significant correlation with logKd,eq
Z50 Z200 Z500Pearson r -0.02 -0.07 0.73
Significant? No No YesSpearman r -0.54 -0.26 0.62Significant? No No No
Z50 Z200 Z500Pearson r 0.11 0.04 0.82
Significant? No No YesSpearman r -0.31 0.21 0.83Significant? No No Yes
0 2 4 6 8-1.5
-1.0
-0.5
0.0
0.5
1.0
1.5
VX/100
logK
d,eq
(c)
1.5 2.0 2.5-1.5
-1.0
-0.5
0.0
0.5
1.0
1.5
logTPSA
logK
d,eq
(a)
Z50
Fig. 6. Correlation analysis between logKd,eq of the targeted micropollutants for the three bioMcGowan's volume VX (divided by a factor of 100). Linear regression lines were reportedregression (Eq. (8)) was tested according to Droge and Goss (2013a, c). The comparison betwpresented in (d).
may suggest (at least for thicker biofilm) a positive influence ofpolarity on the retention of cations in biofilm, possibly resultingfrom the improved accessibility to deeper biofilm through trans-port in the intracellular space.
On the other hand, the positive correlation of logKd,eq withlogvdWA, MV and VX still suggests a contribution of hydrophobicityin sorption of positively charged compounds in Z500 biofilm. Thisfinding is in line with previously established regressions for theprediction of distribution coefficients based on van der Waals
2.0 2.5 3.0 3.5 4.0 4.52.0
2.5
3.0
3.5
4.0
4.5
Pred
icte
d lo
gKd,eq
Z50 Z200 Z500Pearson r -0.04 -0.02 0.72
Significant? No No YesSpearman r -0.56 -0.26 0.65Significant? No No No
logKd = 0.35·VX /100 + 0.45·NAi + 1.48(Kd in L kg-1)
r2=0.58
Measured logKd,eq
(d)
9.0 9.2 9.4 9.6 9.8 10.0-1.5
-1.0
-0.5
0.0
0.5
1.0
1.5
logvdWA
(b)
Z200 Z500
films (Z50, Z200, Z500) and physico-chemical descriptors: (a) logTPSA; (b) log vdWA; (c)only for significant correlations. Based on the correlation with VX/100, an empiricaleen measurements and predictions using Eq. (8) (in both cases, with Kd,eq in L kg�1) is
E. Torresi et al. / Water Research 123 (2017) 388e400398
volume (Kamlet et al., 1988) or VX (Abraham, 1993; Abraham andAcree, 2010; Droge and Goss, 2013a,b,c) for neutral and ionizedmolecules. Notably, McGowan's volume positively correlates withvan der Waals volume (Zhao et al., 2003), which is itself correlatedto vdWA. Hence, both vdWA and VX provide an indication of theinfluence of the molecular size in the cavity formation mechanism,through which solute molecules can distribute to an organic phaseat the expenses of (i.e., by replacing) water molecules (Mackay andVasudevan, 2012).
Considering the relevance of the correlation between logKd,eqand VX for Z500, an empirical regression model (Eq. (8)) was testedbased on the equation previously proposed by Droge and Goss(2013a,c) for sorption prediction of organic cations to soil organicmatter:
log Kd;eq ¼ a$VX=100þ b$NAi þ c (8)
where Kd,eq is expressed in L kg�1 and NAi indicates the number ofhydrogen atoms bound to the charged nitrogen moiety. The co-efficients a, b and c were estimated by fitting Eq. (8) to measuredsorption coefficients. The comparison between predicted andmeasured logKd,eq for Z500 is shown in Fig. 6d (a ¼ 0.35; b ¼ 0.45;c ¼ 1.48). The regression (r2 ¼ 0.58) could only partly describesorption of cationic micropollutants in Z500 biofilms, yieldingrather good Kd,eq predictions (within factor 1.5 from measure-ments) for propranolol, clarithromycin, erythromycin and roxy-thromycin. Potential improvement of sorption predictions may beexpected from the identification of correction factors for polarfunctional groupsdan area beyond the scope of this study due tothe limited number of substances.
Overall, results from this assessment confirm the challengesin the identification of unique and reliable sorption predictorsfor positively charged micropollutants in biofilm, as previouslyrecognized for other matrices (Kah and Brown, 2007; Franco andTrapp, 2008; Franco et al., 2009; Sathyamoorthy and Ramsburg,2013; Droge and Goss, 2013a,c; Bittermann et al., 2016). Never-theless, it should be highlighted that in this study sorptionwas consistently observed only for positively charged com-pounds, indicating that electrostatic interaction with negativelycharged biomass surfaces play a major role for sorption inbiofilms.
5. Conclusions
This study investigated the sorption and the diffusion of selectedmicropollutants in nitrifying MBBR biofilms (thickness ¼ 50, 200,500 mm) by means of targeted experiments and process modelling,leading to the following conclusions:
� Sorption in biofilm occurred only for eight positively chargedmicropollutants (i.e., three macrolides, three beta-blockers andtwo psycho-active pharmaceuticals) out of 23 targeted sub-stances, while negligible sorption was shown for negativelycharged and neutral compounds. Hence, electrostatic interac-tion with the negatively charged biomass surfaces appears toplay a major role in the sorption to biofilms.
� Values of the partitioning coefficient Kd,eq increased withincreasing biofilm thickness for most of the sorbed compounds,being related to the increasing biofilm porosity and thus thehigher surface area accessible for sorption. Sorption equilibriawere reached within the duration of sorption experiments (4 h)for a number of compounds in 50 and 200 mm thick biofilms, butnot in the thickest biofilm. Slower equilibrium in thick biofilms(�500 mm) is likely determined by the longer time required todiffuse in deeper biofilm.
� Dimensionless effective diffusivity coefficients f for micro-pollutants (estimated for the first time in wastewater treatmentbiofilms) were negatively correlated with biofilm density, whileshowing an increasewith increasing porosity. This indicates thatdiffusive transport may be strongly limited by the higherbiomass density (and the lower porosity) of thinner biofilms.
� Significant positive correlations were observed between logKd,eq
and a limited number of chemical properties of micropollutants(topological polar surface area, van der Waals area and McGo-wan's volume) but not for all biofilm thicknesses, confirming thechallenges in the prediction of sorption in biofilms and othermatrices for positively charged compounds.
Acknowledgments
This research was also supported by MERMAID, ITN funded bythe People Programme (Marie Skłodowska-Curie Actions) of the EUFP7/2007e2013/under REA grant agreement n� 607492’. F. Poleseland S. Trapp gratefully acknowledge the project LRI-ECO32 RABIT,funded under the CEFIC Long Range Research Initiative.
Appendix A. Supplementary data
Supplementary data related to this article can be found at http://dx.doi.org/10.1016/j.watres.2017.06.027.
References
Abegglen, C., Joss, A., McArdell, C.S., Fink, G., Schlüsener, M.P., Ternes, T.A.,Siegrist, H., 2009. The fate of selected micropollutants in a single-house MBR.Water Res. 43, 2036e2046.
Abraham, M.H., McGowan, J.C., 1987. The use of characteristic volumes to measurecavity terms in reversed phase liquid chromatography. Chromatography 23,243e246.
Abraham, M.H., 1993. Scales of solute hydrogen-bonding: their construction andapplication to physicochemical and biochemical processes. Chem. Soc. Rev. 22,73e83.
Abraham, M.H., Acree Jr., W.E., 2010. Equations for the transfer of neutral moleculesand ionic species from water to organic phases. J. Org. Chem. 75, 1006e1015.
Alvarino, T., Suarez, S., Katsou, E., Vazquez-Padin, J., Lema, J.M., Omil, F., 2015.Removal of PPCPs from the sludge supernatant in a one stage nitritation/anammox process. Water Res. 68, 701e709.
Andersen, H.R., Hansen, M., Kjølholt, J., Stuer-Lauridsen, F., Ternes, T., Halling-Sørensen, B., 2005. Assessment of the importance of sorption for steroid es-trogens removal during activated sludge treatment. Chemosphere 61, 139e146.
Barret, M., Carr�ere, H., Latrille, E., Wisniewski, C., Patureau, D., 2010. Micropollutantand sludge characterization for modeling sorption equilibria. Environ. Sci.Technol. 44, 1100e1106.
Barret, M., Carrere, H., Patau, M., Patureau, D., 2011. Kinetics and reversibility ofmicropollutant sorption in sludge. J. Environ. Monit. 13, 2770e2774.
Bassin, J.P., Kleerebezem, R., Rosado, A.S., van Loosdrecht, M.C.M., Dezotti, M., 2012.Effect of different operational conditions on biofilm development, nitrification,and nitrifying microbial population in moving-bed biofilm reactors. Environ.Sci. Technol. 46, 1546e1555.
Bittermann, K., Spycher, S., Goss, K.U., 2016. Comparison of different models pre-dicting the phospholipid-membrane water partition coefficients of chargedcompounds. Chemosphere 144, 382e391.
Brockmann, D., Rosenwinkel, K.H., Morgenroth, E., 2008. Practical identifiability ofbiokinetic parameters of a model describing two-step nitrification in biofilms.Biotechnol. Bioeng. 101, 497e514.
Clesceri, L.S., 1989. Standard Methods for the Examination of Water and Waste-water. American Public Health Association.
Cumming, G., Fidler, F., Vaux, D.L., 2007. Error bars in experimental biology. J. CellBiol. 177, 7e11.
Delle Site, A., 2001. Factors affecting sorption of organic compounds in naturalsorbent/water systems and sorption coefficients for selected pollutants. A re-view. J. Phys. Chem. Ref. Data 30, 187e439.
Droge, S.T.J., Goss, K.U., 2013a. Ion-exchange affinity of organic cations to naturalorganic matter: influence of amine type and nonionic interactions at twodifferent pHs. Environ. Sci. Technol. 47, 798e806.
Droge, S.T.J., Goss, K.U., 2013b. Sorption of organic cations to phyllosilicate clayminerals: CEC normalization, salt dependency, and the role of electrostatic andhydrophobic effects. Environ. Sci. Technol. 47, 14224e14232.
Droge, S.T.J., Goss, K.U., 2013c. Development and evaluation of a new sorptionmodel for organic cations in soil: contributions from organic matter and clayminerals. Environ. Sci. Technol. 47, 14233e14241.

E. Torresi et al. / Water Research 123 (2017) 388e400 399
Ertl, P., Rohe, B., Selzer, P., 2000. Fast calculation of molecular polar surface area assum of fragment-based contributions and its application to the prediction ofdrug transport properties. J. Med. Chem. 43, 3714e3717.
Escol�a Casas, M.E., Chhetri, R.K., Ooi, G., Hansen, K.M.S., Litty, K., Christensson, M.,Kragelund, C., Andersen, H.R., Bester, K., 2015. Biodegradation of pharmaceu-ticals in hospital wastewater by staged moving bed biofilm reactors (MBBR).Water Res. 83, 293e302.
Falås, P., Longr�ee, P., la Cour Jansen, J., Siegrist, H., Hollender, J., Joss, A., 2013.Micropollutant removal by attached and suspended growth in a hybrid biofilm-activated sludge process. Water Res. 47, 4498e4506.
Fan, L.S., Leyva-Ramos, R., Wisecarver, K.D., Zehner, B.J., 1990. Diffusion of phenolthrough a biofilm grown on activated carbon particles in a draft-tube three-phase fluidized-bed bioreactor. Biotechnol. Bioeng. 35, 279e286.
Fernandez-Fontaina, E., Omil, F., Lema, J.M., Carballa, M., 2012. Influence of nitri-fying conditions on the biodegradation and sorption of emerging micro-pollutants. Water Res. 46, 5434e5444.
Franco, A., Fu, W., Trapp, S., 2009. Influence of soil pH on the sorption of ionizablechemicals: modeling advances. Environ. Toxicol. Chem. 28, 458e464.
Franco, A., Trapp, S., 2008. Estimation of the soil-water partition coefficientnormalized to organic carbon for ionizable organic chemicals. Environ. Toxicol.Chem. 27, 1995e2004.
G€obel, A., Thomsen, A., McArdell, C.S., Joss, A., Giger, W., 2005. Occurrence andsorption behavior of sulfonamides, macrolides, and trimethoprim in activatedsludge treatment. Environ. Sci. Technol. 39, 3981e3989.
Guimer�a, X., Dorado, A.D., Bonsfills, A., Gabriel, G., Gabriel, D., Gamisans, X., 2016.Dynamic characterization of external and internal mass transport in hetero-trophic biofilms from microsensors measurements. Water Res. 102, 551e560.
Hamon, P., Villain, M., Marrot, B., 2014. Determination of sorption properties ofmicropollutants: what is the most suitable activated sludge inhibition tech-nique to preserve the biomass structure? Chem. Eng. J. 242, 260e268.
Hayduk, W., Laudie, H., 1974. Prediction of diffusion coefficients for nonelectrolytesin dilute aqueous solutions. AIChE J. 20, 611e615.
Headley, J.V., Gandrass, J., Kuballa, J., Peru, K.M., Gong, Y., 1998. Rates of sorption andpartitioning of contaminants in river biofilm. Environ. Sci. Technol. 32,3968e3973.
Holden, P.A., Hunt, J.R., Firestone, M.K., 1997. Toluene diffusion and reaction inunsaturated Pseudomonas putida biofilms. Biotechnol. Bioeng. 56, 656e670.
Horn, H., Morgenroth, E., 2006. Transport of oxygen, sodium chloride, and sodiumnitrate in biofilms. Chem. Eng. Sci. 61, 1347e1356.
H€orsing, M., Ledin, A., Grabic, R., Fick, J., Tysklind, M., Jansen, J., la, C., Andersen, H.R.,2011. Determination of sorption of seventy-five pharmaceuticals in sewagesludge. Water Res. 45, 4470e4482.
Hu, M., Zhang, T.C., Stansbury, J., Neal, J., Garboczi, E.J., 2013. Determination ofporosity and thickness of biofilm attached on irregular-shaped media.J. Environ. Eng. 139, 923e931.
Hyland, K.C., Dickenson, E.R.V., Drewes, J.E., Higgins, C.P., 2012. Sorption of ionizedand neutral emerging trace organic compounds onto activated sludge fromdifferent wastewater treatment configurations. Water Res. 46, 1958e1968.
Joss, A., Andersen, H., Ternes, T., Richle, P.R., Siegrist, H., 2004. Removal of estrogensin municipal wastewater treatment under aerobic and anaerobic conditions:consequences for plant optimization. Environ. Sci. Technol. 38, 3047e3055.
Joss, A., Zabczynski, S., G€obel, A., Hoffmann, B., L€offler, D., McArdell, C.S., Ternes, T.a.,Thomsen, A., Siegrist, H., 2006. Biological degradation of pharmaceuticals inmunicipal wastewater treatment: proposing a classification scheme. Water Res.40, 1686e1696.
Kah, M., Brown, C.D., 2007. Prediction of the adsorption of lonizable pesticides insoils. J. Agric. Food Chem. 55, 2312e2322.
Kamlet, M.J., Doherty, R.M., Abraham, M.H., Marcus, Y., Taft, R.W., 1988. Linearsolvation energy relationships. 46. An improved equation for correlation andprediction of octanol/water partition coefficients of organic nonelectrolytes(including strong hydrogen bond donor solutes). J. Phys. Chem. 92, 5244e5255.
Khunjar, W.O., Love, N.G., 2011. Sorption of carbamazepine, 17a-ethinylestradiol,iopromide and trimethoprim to biomass involves interactions with exocellularpolymeric substances. Chemosphere 82, 917e922.
Lipinski, C.A., Lombardo, F., Dominy, B.W., Feeney, P.J., 1997. Experimental andcomputational approaches to estimate solubility and permeability in drugdiscovery and develop ment settings. Adv. Drug Deliv. Rev. 23, 3e25.
Margot, J., Rossi, L., Barry, D.A., Holliger, C., 2015. A review of the fate of micro-pollutants in wastewater treatment plants. Wiley Interdiscip. Rev. Water 2,457e487.
Maurer, M., Escher, B.I., Richle, P., Schaffner, C., Alder, a C., 2007. Elimination of beta-blockers in sewage treatment plants. Water Res. 41, 1614e1622.
Mackay, A.A., Vasudevan, D., 2012. Polyfunctional ionogenic compound sorption:challenges and new approaches to advance predictive models. Environ. Sci.Technol. 46, 9209e9223.
Ort, C., Gujer, W., 2008. Sorption and high dynamics of micropollutants in sewers.Water Sci. Technol. 57, 1791e1797.
Palm, K., Stenberg, P., Luthman, K., Artursson, P., 1997. Polar molecular surfaceproperties predict the intestinal absorption of drugs in humans. Pharm. Res. 14,568e571.
Piculell, M., Suarez, C., Li, C., Christensson, M., Persson, F., Wagner, M.,Hermansson, M., Jonsson, K., Welander, T., 2016. The inhibitory effects of rejectwater on nitrifying populations grown at different biofilm thickness. Water Res.104, 292e302.
Pl�osz, B.G.Y., Leknes, H., Thomas, K.V., 2010. Impacts of competitive inhibition,
parent compound formation and partitioning behavior on the removal of an-tibiotics in municipal wastewater treatment. Environ. Sci. Technol. 44, 734e742.
Pl�osz, B.G., Langford, K.H., Thomas, K.V., 2012. An activated sludge modelingframework for xenobiotic trace chemicals (ASM-X): assessment of diclofenacand carbamazepine. Biotechnol. Bioeng. 109, 2757e2769.
Polesel, F., Lehnberg, K., Dott, W., Trapp, S., Thomas, K.V., Pl�osz, B.G., 2015. Factorsinfluencing sorption of ciprofloxacin onto activated sludge: experimentalassessment and modelling implications. Chemosphere 119, 105e111.
Pomi�es, M., Choubert, J.-M., Wisniewski, C., Coquery, M., 2013. Modelling ofmicropollutant removal in biological wastewater treatments: a review. Sci. TotalEnviron. 443, 733e748.
Radjenovi�c, J., Petrovi�c, M., Barcel�o, D., 2009. Fate and distribution of pharmaceu-ticals in wastewater and sewage sludge of the conventional activated sludge(CAS) and advanced membrane bioreactor (MBR) treatment. Water Res. 43,831e841.
Rattier, M., Reungoat, J., Keller, J., Gernjak, W., 2014. Removal of micropollutantsduring tertiary wastewater treatment by biofiltration: role of nitrifiers andremoval mechanisms. Water Res. 54, 89e99.
Reichert, P., 1994. Aquasim - a tool for simulation and data-analysis of aquaticsystems. Water Sci. Technol. 30, 21e30.
Reif, R., Besancon, A., Le Corre, K., Jefferson, B., Lema, J.M., Omil, F., 2011. Comparisonof PPCPs removal on a parallel-operated MBR and AS system and evaluation ofeffluent post-treatment on vertical flow reed beds. Water Sci. Technol. 63,2411e2417.
Sathyamoorthy, S., Ramsburg, C.A., 2013. Assessment of quantitative structuralproperty relationships for prediction of pharmaceutical sorption during bio-logical wastewater treatment. Chemosphere 92, 639e646.
Sathyamoorthy, S., Chandran, K., Ramsburg, C.A., 2013. Biodegradation and com-etabolic modeling of selected beta blockers during ammonia oxidation. Environ.Sci. Technol. 47, 12835e12843.
Shi, Y.J., Wang, X.H., Qi, Z., Diao, M.H., Gao, M.M., Xing, S.F., Wang, S.G., Zhao, X.C.,2011. Sorption and biodegradation of tetracycline by nitrifying granules and thetoxicity of tetracycline on granules. J. Hazard. Mater. 191, 103e109.
Sibley, S.D., Pedersen, J.A., 2008. Interaction of the macrolide antimicrobial clari-thromycin with dissolved humic acid. Environ. Sci. Technol. 42, 422e428.
Sp€ath, R., Flemming, H.C., Wuertz, S., 1998. Sorption properties of biofilms. WaterSci. Technol. 37, 207e210.
Stevens-Garmon, J., Drewes, J.E., Khan, S.J., McDonald, J.A., Dickenson, E.R.V., 2011.Sorption of emerging trace organic compounds onto wastewater sludge solids.Water Res. 45, 3417e3426.
Stewart, P.S., 2003. Diffusion in Biofilms: why is diffusion an important process.J. Bacteriol. 185, 1485e1491.
Stewart, P.S., 1998. A review of experimental measurements of effective diffusivepermeabilities and effective diffusion coefficients in biofilms. Biotechnol. Bio-eng. 59, 261e272.
Tchobanoglous, G., Burton, F., Stensel, H., 2003. Wastewater Engineering: Treatmentand Reuse, fourth ed. Metcalf and Eddy, Inc., McGraw-Hill Company, New York.
Ternes, T.A., Herrmann, N., Bonerz, M., Knacker, T., Siegrist, H., Joss, A., 2004. A rapidmethod to measure the solid-water distribution coefficient (Kd) for pharma-ceuticals and musk fragrances in sewage sludge. Water Res. 38, 4075e4084.
Tolls, J., 2001. Sorption of veterinary pharmaceuticals in soils: a review. Environ. Sci.Technol. 35, 3397e3406.
Torresi, E., Fowler, S.J., Polesel, F., Bester, K., Andersen, H.R., Smets, B.F., Pl�osz, B.G.,Christensson, M., 2016. Biofilm thickness influences biodiversity in nitrifyingMBBRsdimplications on micropollutant removal. Environ. Sci. Technol. 50 (17),9279e9288.
Tran, N.H., Urase, T., Kusakabe, O., 2009. The characteristics of enriched nitrifierculture in the degradation of selected pharmaceutically active compounds.J. Hazard. Mater. 171, 1051e1057.
Trapp, S., Matthies, M., 1998. Transport and transformation of compounds in soil. In:Chemodynamics and Environmental Modeling. Springer-Verlag, Berlin,Germany.
Uhrich, S.R.W., Navarro, D.A., Zimmerman, L., Aga, D.S., 2014. Assessing antibioticsorption in soil: a literature review and new case studies on sulfonamides andmacrolides. Chem. Cent. J. 8, 1e12.
Vasiliadou, I.A., Molina, R., Martínez, F., Melero, J.A., 2014. Experimental andmodeling study on removal of pharmaceutically active compounds in rotatingbiological contactors. J. Hazard. Mater. 274, 473e482.
Vasudevan, D., Bruland, G.L., Torrance, B.S., Upchurch, V.G., MacKay, A.A., 2009. pH-dependent ciprofloxacin sorption to soils: interaction mechanisms and soilfactors influencing sorption. Geoderma 151, 68e76.
Wanner, O., Reichert, P., 1996. Mathematical modeling of mixed-culture biofilms.Biotechnol. Bioeng. 49, 172e184.
Wicke, D., B€ockelmann, U., Reemtsma, T., 2007. Experimental and modelingapproach to study sorption of dissolved hydrophobic organic contaminants tomicrobial biofilms. Water Res. 41, 2202e2210.
Wicke, D., B€ockelmann, U., Reemtsma, T., 2008. Environmental influences on thepartitioning and diffusion of hydrophobic organic contaminants in microbialbiofilms. Environ. Sci. Technol. 42, 1990e1996.
Writer, J.H., Ryan, J.N., Barber, L.B., 2011. Role of biofilms in sorptive removal ofsteroidal hormones and 4-nonylphenol compounds from streams. Environ. Sci.Technol. 45, 7275e7283.
Wu, S.C., Gschwend, P.M., 1986. Sorption kinetics of hydrophobic organic com-pounds to natural sediments and soils. Environ. Sci. Technol. 20, 717e725.
Wunder, D.B., Bosscher, V.A., Cok, R.C., Hozalski, R.M., 2011. Sorption of antibiotics to

E. Torresi et al. / Water Research 123 (2017) 388e400400
biofilm. Water Res. 45, 2270e2280.Xue, W., Wu, C., Xiao, K., Huang, X., Zhou, H., Tsuno, H., Tanaka, H., 2010. Elimination
and fate of selected micro-organic pollutants in a full-scale anaerobic/anoxic/aerobic process combined with membrane bioreactor for municipal wastewaterreclamation. Water Res. 44, 5999e6010.
Yi, T., Harper, W.F., 2007. The effect of biomass characteristics on the partitioningand sorption hysteresis of 17alpha-ethinylestradiol. Water Res. 41, 1543e1553.
Zacarias, G.D., Ferreira, C.P., Velasco-Hernandez, J.X., 2005. Porosity and tortuosityrelations as revealed by a mathematical model of biofilm structure. J. Theor.
Biol. 233, 245e251.Zhang, T.C., Bishop, P.L., 1994a. Evaluation of turtuosity factors and effective diffu-
sivities in biofilms. Water Res. 28, 2279e2287.Zhang, T.C., Bishop, P.L., 1994b. Density, porosity, and pore structure of biofilms.
Water Res. 28, 2267e2277.Zhao, Y.H., Abraham, M.H., Zissimos, A.M., 2003. Determination of McGowan vol-
umes for ions and correlation with van der Waals volumes. J. Chem. Inf.Comput. Sci. 43, 1848e1854.

本文献由“学霸图书馆-文献云下载”收集自网络,仅供学习交流使用。
学霸图书馆(www.xuebalib.com)是一个“整合众多图书馆数据库资源,
提供一站式文献检索和下载服务”的24 小时在线不限IP
图书馆。
图书馆致力于便利、促进学习与科研,提供最强文献下载服务。
图书馆导航:
图书馆首页 文献云下载 图书馆入口 外文数据库大全 疑难文献辅助工具