Diffractive read-out of optical discs - univie.ac.at · Diffractive read-out of optical discs ......
43
1 Diffractive read-out of optical discs Joseph Braat Optics Research Group Faculty of Applied Sciences Delft University of Technology Lorentzweg 1 NL - 2627 CA Delft The Netherlands E-mail: [email protected] P. Dirksen Philips Research Laboratories High Tech Campus 4 Professor Holstlaan 4 NL - 5656 AA Eindhoven The Netherlands E-mail: [email protected] Augustus J.E.M. Janssen Philips Research Laboratories High Tech Campus 36 Professor Holstlaan 4 NL - 5656 AA Eindhoven The Netherlands E-mail: [email protected] Summary. We present the optical principles of actual and projected systems for optical data storage like the CD (Compact Disc) , the DVD (Digital Versatile Disc) and the blue light DVR system. After a short historic overview, the initial choices with respect to optical read- out method, light path and optical components are briefly reviewed. We next consider in more detail the radial tracking method applied in the DVD-system and the compatibility aspects between the DVD- and CD-system. Throughout this chapter we especially pay attention to the modelling of the signal read-out in an optical disc player and we will describe methods to efficiently calculate crucial parameters like signal jitter and cross-talk.
-
Upload
nguyenlien -
Category
Documents
-
view
229 -
download
0
Transcript of Diffractive read-out of optical discs - univie.ac.at · Diffractive read-out of optical discs ......

1
Diffractive read-out of optical discs
Joseph Braat
Optics Research GroupFaculty of Applied SciencesDelft University of TechnologyLorentzweg 1NL - 2627 CA DelftThe NetherlandsE-mail: [email protected]
P. Dirksen
Philips Research LaboratoriesHigh Tech Campus 4Professor Holstlaan 4NL - 5656 AA EindhovenThe NetherlandsE-mail: [email protected]
Augustus J.E.M. Janssen
Philips Research LaboratoriesHigh Tech Campus 36Professor Holstlaan 4NL - 5656 AA EindhovenThe NetherlandsE-mail: [email protected]
Summary. We present the optical principles of actual and projected systems for optical datastorage like the CD (Compact Disc) , the DVD (Digital Versatile Disc) and the blue lightDVR system. After a short historic overview, the initial choices with respect to optical read-out method, light path and optical components are briefly reviewed. We next consider in moredetail the radial tracking method applied in the DVD-systemand the compatibility aspectsbetween the DVD- and CD-system. Throughout this chapter we especially pay attention tothe modelling of the signal read-out in an optical disc player and we will describe methods toefficiently calculate crucial parameters like signal jitter and cross-talk.

2
1 Introduction
An extensive literature is available on optical data storage. Because of the multi-disciplinary character of optical storage, the subjects range from optics, mechanics,control theory, electronics, signal coding and cryptography to chemistry and solid-state physics. Several books [2]-[9] have appeared that aredevoted to one or severalof the subjects mentioned above. This chapter will be limited to purely optical as-pects of the optical storage systems. In Section 2 of this chapter we first present ashort historic overview of the research on optical disc systems that has led to theformer video disc system. In Section 3 we briefly review the general principles ofoptical storage systems that have remained more or less unchanged since the startsome thirty years ago. An interesting feature of the DVD-system is its standardisedradial tracking method that we will treat in some detail in Section 4. The appearanceof new generations with higher spatial density and storage capacity has triggered so-lutions for the backward compatibility of the new systems with the existing ones.In Section 5 we pay attention to these backward compatibility problems that aremainly caused by the smaller cover layer thickness, the shorter wavelength of thelaser source and the higher numerical aperture of the objective in the new gener-ations. Finally, in Section 6 we indicate how an efficient modelling of the opticalread-out system can be done. Important features like the radial cross-talk and inter-symbol interference can be studied with an advanced model ofthe optical read-outand the resulting signal jitter, an important quality factor for a digital signal, is effi-ciently obtained. A new approach is presented that can speedup the calculations sothat the modelling can really serve as an interactive tool when optimizing the opticalread-out.
2 Historic overview of video and audio recording on opticalmedia
Optical data storage uses the principle of the point-by-point scanning of an object toextract the recorded information on the disc. In another context, such an approachwas used in a somewhat primitive way in the ‘flying-spot’ film scanner. This appa-ratus was developed in the early fifties of the last century when a need was felt totransform the pictorial information on film into electricalinformation to be recordedon magnetic tape. The flying-spot in the film scanner was obtained with the aid ofa cathode ray tube and its resolving power was adequate for the resolution encoun-tered on the standard cinema film format. In Fig.(1) the focusing lensLo is shownthat produces the scanning spot on the film. The light is partially transmitted anddiffracted by the information on the film surface and the detector collects the trans-mitted light via the collecting lensLc. The required resolution in the film plane wasof the order of 20 to 30µm and this was not an extreme demand neither for the elec-tron optics nor for the ‘objective’ lensLo. The flying-spot scanner was not analysedin depth for some time, it just functioned correctly for the purpose it had been de-veloped for and produced coloured images with the required TV-resolution.

3
CRT film
detector
L Lo c
Fig. 1. Schematic lay-out of a flying-spot film scanning device.
In 1961 a patent was attributed to M. Minsky [10] where he describes the principleof a scanning microscope with a resolving power comparable to the standard micro-scope. Minsky even proposed to use several scanning spots inparallel, thus realisinga large-field scanning . The practical use of his (confocal) scanning microscope waslimited because of the inefficient use of the power of the (thermal) light source.A further step towards the optical data storage principle aswe know it nowadays wastaken by a research group at Stanford University that focused on the recording ofvideo information on a record with the size of a standard audio Long Play disc [11].The group developed a disc-shaped carrier with data tracks that carried the directlymodulated video signal. After a few years the research was abandoned because ofthe cross-talk problem between the information in neighbouring tracks and becauseof the bad signal to noise ratio of the detected signal. The belief in a commercialsuccess as a consumer product dwindled away and the sponsor,the 3M-company,stopped funding.In parallel to this early research on direct signal recording, several groups workedon the principle of storing pictures on a disc, either directly or via holographic en-coding. Of course, the latter method was believed to be much more robust becauseof the far-field recording of the pictorial information. However, one has to concludethat the various prototypes of ‘pictorial’ video-players that were developed at theend of the sixties and the early 1970’s were not satisfactorybecause of the inef-ficient use of the available recording surface, the difficultmechanics in the case ofthe ‘direct picture’ approach and the colour and speckle problem for the holographicdevices.
2.1 The early optical video system
At the end of the 1960’s, various disciplines and techniqueswere present at PhilipsResearch Laboratories in the Netherlands that enabled a breakthrough in the field ofoptical data storage. Important factors enabling this breakthrough were
• availability of expertise in precision optics and control mechanics,• research on a consumer-type of HeNe-laser where the delicate problems of
alignment and stability of such a coherent source were solved in such a waythat relatively cheap mass-production could be envisaged,
• work on efficient modulation techniques for video recordingon magnetic tape,

4
• a strong belief in the market for educational applications (teaching, instruction,continuous learning).
In an early stage, some decisions [12] were taken (reflectiveread-out, informationprotection via the disc substrate) that have proven to be of vital importance forthe success of ‘robust’ optical data storage. In 1975, several companies (Philips,Thomson [13], Music Corporation of America [14]), later joined by Pioneer, haveunited to establish a standard for the video disc system (VLP= Video Long Play) sothat worldwide disc exchange would be possible. The most important standardisedfeatures were
• HeNe laser source,λ=633 nm, numerical aperture (NA) of the read-out objec-tive equal to 0.40, track pitch of information spiral is 1.6µm, disc diameter is30 cm, rotational velocity is 25 or 30 Hz depending on the television standard.
• frequency modulation of the analog video signal resulting in optical informationpits with a (small) pit length modulation; the average pit length typically is0.6µm with comparable ‘land’ regions in between.
• recording of two video frames per revolution (constant angular velocity, CAV)or recording with constant linear velocity (CLV). The first choice allowed forthe still-picture option without using a frame memory (not yet available at thattime), the second choice yielded discs with the longest playing time (up to twohours)
Further research on the video disc system (later called the Laser Disc system) hascentred on an increase of the recording density, e.g. by
• halving the track pitch to 0.8µm and keeping the cross-talk at an acceptablelevel by introducing a two-level pit depth that alternates from track to track [15]
• using (high-frequency) track undulation for storing extrainformation, e.g. colourand/or sound channels
Other research efforts have resulted in the introduction ofthe semiconductor laser(λ=820 nm) and the simplification of the optics, among others byintroducing as-pherical optics for the scanning objective [16].Further potential changes in disc definition resulting fromthis research on higherdensity have not led to an improved video disc standard; but the semiconductorlaser source and the cheaper optics have been readily introduced at the beginning ofthe 1980’s.In parallel to the video application, storage of purely digital data has been pursuedin the early stages of optical storage. Various systems using large-size optical discshave been put on the professional market while the recordingof data was made pos-sible by the development of high-power semiconductor lasers. In the first instance,the data were irreversibly ‘burnt’ in the recording layer. Later research has revealedthe existence of suitable phase-change materials [17],[18] that show an optical con-trast between the amorphous and crystalline phase and permit rapid thermally in-duced switching between both phases. Other optical recording materials rely on thelaser-induced thermal switching of magnetic domains [7]; the optical read-out of

5
the domains with opposite vertical magnetisation is done using the magneto-opticalKerr effect.
2.2 The origin of the CD-system
The Laser Disc video system knew a limited success due to its restricted playingtime and its lack of the recording option which made direct competition with thewell-established video cassette recorder rather difficult. Other opportunities for theoptical storage technique were already examined for several years and the replace-ment of the audio Long Play disc by an optical medium was actively researched. Anenormous extra capacity becomes available when switching from the mechanical LPneedle to the micron-sized diffraction-limited optical ‘stylus’. The approximatelyhundred times larger storage capacity on an equally sized optical disc has been usedin two ways, first by reducing the size of the new medium and, secondly, by turningtowards digital encoding of the audio signal which, at that time, asked for a verysubstantial increase in signal bandwidth. After a certain number of iterations wheredisc size, signal modulation method, digital error correction scheme and playingtime were optimised, the actual Compact Disc standard was established in 1980 bythe partners Philips and Sony. The disc diameter of 12 cm was established to accom-modate for the integral recording on a single disc of the longest version of the ninthsymphony of Beethoven (74 minutes playing time, Bayreuth 1951 recording by theBerliner Philharmoniker, conductor Wilhelm Fuertwangler).The worldwide market introduction of the CD-system took place at the end of 1982and the beginning of 1983. Apart from the infrared semiconductor laser source andthe corresponding miniaturisation of the optics, no reallyfundamental changes withrespect to the preceding laser disc video system were present regarding the opticalread-out principles. The CD system turned out to be simpler and more robust thanits video signal predecessor. This was mainly due to the digitally encoded signalon the CD-disc that is much less sensitive to inter-track cross-talk than the formeranalog video signal.
2.3 The road towards the DVD-system
For a long period, the application of the CD-system has been restricted to the digitalaudio domain. In an early stage, a read-only digital data storage system with identi-cal capacity (650 MByte) has been defined (CD-ROM) but the market penetration ofthis system has been relatively late, some 8 to 10 years afterthe introduction of theaudio CD. Once the personal computer application took off, the demand for record-able and rewritable CD-systems (CD-R and CD-RW) immediately followed. At thesame time, the computer environment asked for an ever increasing data capacity tohandle combination of pictorial and data content (e.g. for games). Spurred by thequickly developing market of video (using the lower qualitydigital MPEG1 videostandard), a serious need was felt for an improved optical data storage standard. TheDVD-standard has been defined as of 1994 by a consortium of 10 companies and of-fers a seven times higher capacity than the CD-format. Because of its multi-purpose

6
application, the acronym DVD stands for Digital Versatile Disc and both MPEG2video information, super-audio signals and purely digitaldata can be recorded onthis medium. Again, the optical principles used in the DVD-system have not funda-mentally changed; a relatively new radial tracking method was introduced and thebackward compatibility with the existing CD-family asked for various provisions.In recent years, the DVD-medium has also developed into a family with recordable
CRT film
detector
L Lo c
Fig. 2.A sketch of the light paths for the CD, DVD and DVR system and electron microscopephotographs with identical magnification of the information pits of the three systems.
and rewritable versions. The main innovation in the DVR system is the use of thedeep blue semiconductor laser; combined with a drasticallyincreased value of thenumerical aperture of the objective, a forty times higher density with respect to theCD-system is achieved.Even if the basics of optical disc systems have not changed, an enormous effort in re-search and development has been needed to adapt the media andthe playing units tothe drastically increased demands with respect to spatial density, scanning speed anddata rate. Another less visible development is the digitisation of the opto-mechanicaland electronic control systems in the player. Without the easily programmable digi-tised servo and control systems, the multi-purpose disc player/recorder that easilyaccepts a broad range of media would be impossible.In this chapter we will restrict ourselves to the purely optical aspects of an opticaldisc player/recorder. More general overviews can be found in the various textbooksmentioned in the introductory section.
3 Overview of the optical principles of the CD- and theDVD-system
In this section we briefly recall the read-out method to extract the stored informationfrom the optical disc. The information is optically coded interms of a relief patternon a read-only disc while recordable and rewritable discs employ recording layersthat influence both the phase and the amplitude of the incident light. The arrange-ment of the information is along tracks that have to be followed, both in the recorded

7
and the ‘blank’ or pre-formatted situation. To this purpose, a bipolar signal is opti-cally derived that can be connected to a servo mechanism to keep the objective headon track during reading or recording. Simultaneously, an error signal is needed tocorrect for any deviation of the information layer from the optimum focus position.
3.1 Optical read-out of the high-frequency information signal
In Fig.(3), the typical data formats to be read in an optical disc player are shown.The typical track spacing on CD is 1.6µm and the pit length varies between 0.9and 3.3µm with typical increments of 0.3µm. The data disc in b) has a different
Fig. 3. Typical data formats present on optical storage media.a) CD-information recorded as a relief pattern in the surfaceof a disc obtained via injectionmolding b) ‘burned’ data on a digital data discc) amorphous islands (gray) arranged alonga pre-formatted track in a micro-crystalline ‘sea’ (phase-change recording)d) polarisationmicroscope photograph of a magneto-optical layer with recorded CD-like information.
coding scheme that initially looked more appropriate for the hole-burning processby avoiding the length modulation. In Fig.(3.c) the CD-ROM format is present on aphase change disc with the low-contrast regions of micro-crystalline and amorphousstructure. The disc in d) is not compatible with the standard(or DVD) reading prin-ciple because of the polarisation-sensitive read-out.The reading of the information is done with the aid of the scanning microscope prin-ciple that is sketched in Fig.(4). As it is well-known from the literature, the scanning

8
microscope and the classical microscope are very closely related regarding their res-olution and optical bandwidth [19], [20]. In terms of maximum transmitted spatialfrequency, the classical microscope attains a value of2NA/λ in the case of incoher-
Fig. 4. The scanning optical microscopeSOM (a) and the ‘classical’ imaging optical mi-croscopeIOM with a full field illumination (b). In the scanning microscope, the detectorhas been schematically drawn and is optically characterised by its angular extent (dashedcone) with respect to the object. In the figure, the angular extent or ‘aperture’ of the detectorhas been drawn equal to the numerical apertureNA of the objectiveOS , a situation thatcorresponds to standard reflective read-out of an optical disc.
ent illumination via the condensor system (the numerical aperture of the condensorC then needs to be equal to or larger than the numerical apertureNA of the objec-tiveOI ). The scanning microscope achieves the same maximum frequency transferwhen the detectorD at least captures the same apertureNA as offered by the scan-ning objectiveOS (see heavy dashed lines in Fig.(4.a). In the case of a reflectivescanning system, the equal aperture ofOS andD is obtained in a straightforwardmanner because of the double role ofOS as scanning objective and collecting aper-ture for the detector.The optical transfer function of a scanning microscope has been visualised in Figs.(5)-(6). The diffraction of a plane wave with propagation angleα by a (one-dimensional)periodic structure (frequencyν = 1/p) leads to a set of distinct plane waves withpropagation direction anglesαm given by
sinαm = sinα+mλν , (1)
wherem is the order number of the diffracted plane wave.In the case of an impinging focused wave (aperture angleu), the diffracted field

9
Fig. 5. The diffraction of a plane wave and a focused wave by a one-dimensional periodicstructure. The useful region in the far-field for signal detection is given by the regions ofoverlap of zeroth and first orders.
is a superposition of diffracted spherical waves. The incident spherical wave can beconsidered to be the superposition of a set of plane waves with an angular distribu-tion ranging form−u to +u. Note that in the case of a spherical wave, the diffractedorders can not easily be separated in the far field at a large distance from the peri-odic structure. This is in particular the case for low spatial frequencies and this isin line with the intuitive feeling that a finely focused wave is not capable of sharplydiscriminating a large period. As soon as the period becomescomparable with thelateral extent of a focused wave (typically of the order ofλ/2NA), the diffractedspherical waves are fully separated. However, we do not needto fully separate thediffracted spherical orders to draw conclusions about the presence and the positionof the periodic structure.In the regions where e.g. the spherical waves with order numberm = 0 andm = 1overlap, the two waves are brought to interference and the phase difference betweenthem will depend on the lateral position of the periodic structure with respect to thefocal point of the incident spherical wave (note that the phase of a first diffracted or-

10
Fig. 6. The normalised optical transfer function as a function of the coherence factorγ, de-termined by the numerical aperture ratio of detector and scanning objective.
der shows a phase shiftφ that equals2πν∆ if the periodic structure suffers a lateralshift of∆).The strength of the interfering signal depends on the size ofthe overlapping regionand on the usefully captured signal by the detector. In the case of a centred detector,the signal depends on its lateral extent and it is normally expressed in terms of theangular beam extent (NA = sinu) of the incident focused beam.In Fig.(6), the normalised frequency transfer function hasbeen depicted as a func-tion of the commonly called coherence factorγ = NAD/NA (NAD is the numer-ical aperture of the detector as defined by geometrical conditions or by a collectingoptical system in front of the detector, see [19]). The maximum detectable frequencyis 2NA/λ. In this case (γ ≥ 1), the optical system is approaching the fully inco-herent limit which means that from the complex amplitude transmission functionof an object only the modulus part is detectable. At low values of γ, leading to thelimit of ‘coherent’ read-out, the phase part of an object, even if it is a weakly mod-ulated function, can also be detected in principle. Note that on an optical disc therelief pattern mainly affects the phase part of the optical transmission or reflectionfunction. Because of the strong height modulation with respect to wavelength, thephase modulation can also be detected in the (almost) incoherent mode atγ=1. If thephase modulation switches between 0 andπ, the phase modulation even becomesa pure amplitude modulation with extreme values of±1. The choice of the valueof γ has been fixed at unity from the very beginning of optical storage. In contrastwith e.g. optical lithography where a certain minimum transfer value is requiredand where it can be useful to trade off the maximum transmitted frequency againsta better modulation via a choiceγ < 1, the transfer of an optical disc system can

11
Fig. 7.The pit structure on an optical disc and a schematic drawing of the detected signal thatshows a typical maximum slope defined by the spot sizeλ/NA. An oscilloscope image of alarge sequence of signal sections is shown below when the scope is triggered on an arbitrarypositive transient in the signal; this signal is commonly called the digital ‘eye-pattern’ andshould preferably not contain transients that are close to the centre of a digital eye (see thedrawn lozenge in the figure).
be improved electronically afterwards. This electronic equalisation has proved to bepowerful and thus permits to virtually use the entire optical pass-band up to the op-tical cut-off frequency of2NA/λ; in practice, frequencies turn out to be detectableup to 90% or 95% of the cut-off frequency. The typical opticalfrequencies in a CD-system (λ=785 nm,NA=0.45) are 55% of the cut-off frequency for the radial periodand approximately 50% for the highest frequency in the direction of the tracks (thisis the 3T-3T alternation, the shortest land and pit distances (0.9µm) on a CD-discgiven the clock length of 0.3µm). Of course, the binary relief pattern in the track ofa CD may contain higher frequencies than this highest fundamental frequency. Inthe DVD-system (λ=650 nm,NA=0.60) the optical pass band is used in a more ag-gressive way and the typical frequencies are shifted to 75% of the cut-off frequency2NA/λ.The typical signal that is obtained from the high-frequencydetector in an opticaldisc player is shown in Fig.(7). A well-opened digital ‘eye’is essential for a correctread-out of the stored information.

12
3.2 Optical error signals for focusing and radial tracking of the information
Focus error signalVarious methods have been proposed for deriving a focus error signal that can
be fed to e.g. the coils of a miniature linear electromotor sothat an active posi-tioning of the objective with respect to the spinning disc isachieved. In Fig.(8) the
Fig. 8. An optical light path using the astigmatic focusing method by exploiting the astig-matism introduced by a plane parallel plate in the returningconverging beam (left). Thecalculated diffraction patterns corresponding to a focal line and to the best focus position aredepicted in the righthand part of the figure, together with the separation lines of the focusquadrant detector (horizontal and vertical in this picture).
commonly used astigmatic method [21] is shown. The light reflected from the discpasses through a relatively thick plane parallel plate (thebeam splitter on the wayforth from the source to the disc). Depending on the convergence angle of the re-turning beam and on the thickness of the plate, a certain amount of astigmatism isintroduced that generates two focal lines along the opticalaxis with a ‘best’ focalregion in between them. Projected back onto the informationsurface and taking intoaccount the axial magnification of the combination of collimator and objective, oneaims at a distance between the astigmatic lines of some 10 to 15 µm. The best focusposition corresponds to a balanced intensity distributionon the four detectors andshould be made to coincide with optimum high-frequency read-out of the optical

13
disc. In the right part of Fig.(8) a contour picture is shown of the diffraction imagein the best focus position and in the case when one of the line images is focused onthe detector.Another candidate for the detection of a focus defect is the Foucault knife-edgetest. Although its sensitivity can be higher than that of theastigmatic method, theposition tolerances of the knife edge are somewhat critical. A circularly symmet-ric version of the knife-edge method is the ‘ring-toric’ lens method [22]. Anotheroption is the ’spot-size’ detection method that measures the variation of beam cross-section as a function of defocus. All these methods are capable of delivering a signalwith changing polarity as a function of the sign of the focus error. Another impor-tant property of an error signal is the maximum distance through which the signal iswell above the noise, the so-called effective acquisition range. For both methods, atypical value of 30 to 50µm can be expected. More refined methods use the detectedhigh-frequency information to monitor the absolute focus-setting and to correct forany drift in the detector balance or the mechanical settingsof the light path.
Radial error signalThe methods indicated in Fig.(9) have been devised for the detection of the radial
position of the reading or recording light spot with respectto the centre of a track.The first method uses two auxiliary light spots generated by means of a grating(twin-spot method [23]). The light spots have a quarter track spacing off-set withrespect to the central light spot. The reflected light belonging to each auxiliary spotis collected in the focal region on separate detectors and the difference in averagesignal from each detector provides the desired bipolar tracking signal that is zeroon-track. An AC-variant of this method with the auxiliary spots uses a small lateraloscillation of the main spot itself. The detection of the phase (either 0 orπ) of theoscillation in the detected AC-signal yields the required tracking error signal. Theoscillation can be imposed on the scanning spot in the optical player but, preferably,a so-called track wobble is given to the track with a known phase so that no activewobble is needed in the player. Of course, the track wobble should not generatespurious information in the high-frequency signal band norshould it spoil other in-formation (track number, address information) that is stored in an ’undulation’ orlateral displacement of the information track.Both methods described above retrieve the tracking information from a refocused
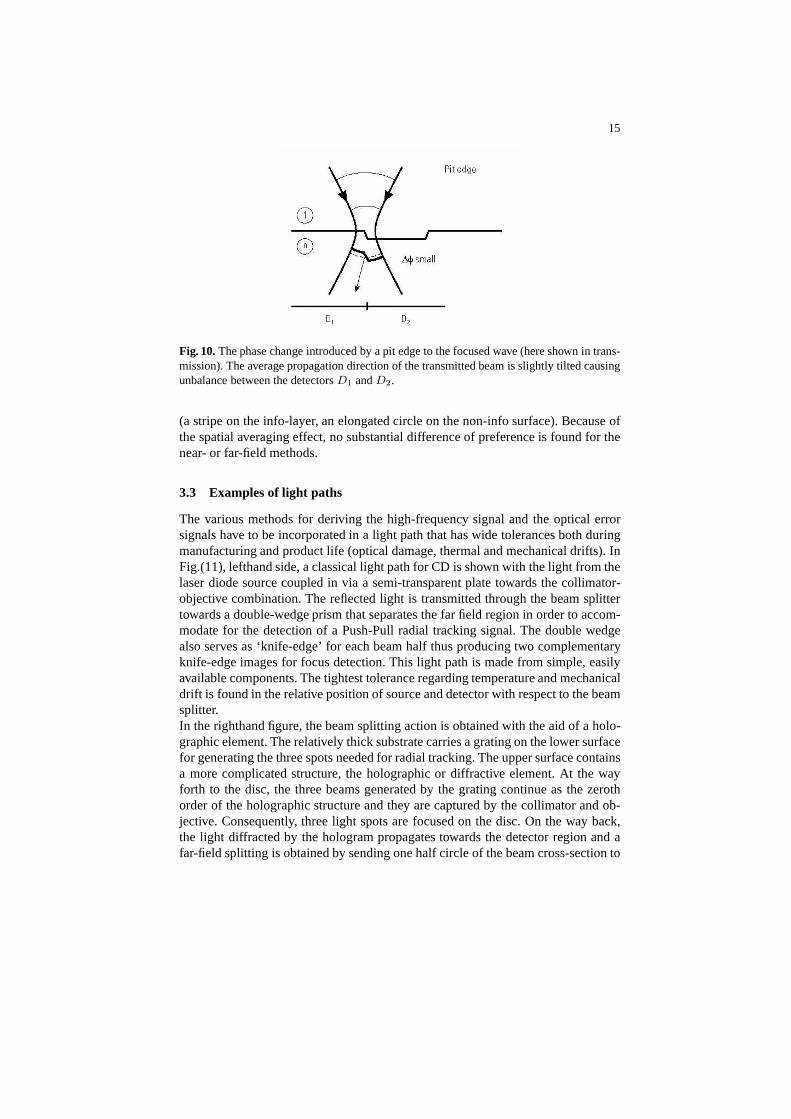
light distribution on one or more detectors that are optically conjugate with the infor-mation layers and for this reason they are called near-field methods. A well-knownfar-field method is the so-called Push-Pull method [21] thatuses a duo-detector insubtractive mode for radial tracking (see Fig.(10)). The method is based on the factthat in the presence of a tracking error (the centre of the scanning spot hits e.g.the edges of the information pits) the average propagation direction is slightly bentaway from the perpendicular direction. For relatively small values of the phase shiftof the light reflected by the pits, the difference signal of the duo-detector shows achange of sign when the scanning spot crosses the information track. If we definethe phase depth∆φ of the information pits as the phase shift suffered by the light

14
Fig. 9.The various options for deriving a bipolar optical trackingsignal. The label ’near field’here means that the detector arrangement is positioned in the image plane of the informationlayer. In the case of ’far field’ detection, the detector is effectively located in the limitingaperture of the objective (or in an image of this diaphragm).
on reflection from the information pits with respect to the light reflected from non-modulated land regions, we observe that the difference signal of the duo-detectorreduces to zero if∆φ equalsπ. The obvious reason is that a phase shift ofπ be-tween pits and land regions has reduced the information structure to effectively anamplitude structure with no directional phase informationavailable. For this rea-son, the Push-Pull method is critical with respect to the phase shift induced by theinformation pits and it also behaves in a rather complicatedway once the optical‘effects’ have a combined amplitude and phase character (phase-change recordingmaterial). A far-field method that, in a first instance, does not suffer from the re-strictions on the phase depth∆φ is the differential phase (or time) detection wherethe phase relations between signal components from a far-field quadrant detectorat the instantaneous signal frequencyω are used to derive a tracking signal [24]. Atracking method based on this principle has been standardised for the DVD-systemand will be discussed in more detail in a following section.The possible perturbations of the near-field or far-field methods is correlated withthe conjugate position of the respective detectors. In Fig.(9), lower part, the near-field methods should be sensitive to damage of the information layer while the far-field based methods should be more sensitive to damage or scratching of the uppersurface (non-info) of the disc. Because of the limited bandwidth of the tracking er-ror signals, their (average) information is collected froma relatively large disc area
15
Fig. 10.The phase change introduced by a pit edge to the focused wave (here shown in trans-mission). The average propagation direction of the transmitted beam is slightly tilted causingunbalance between the detectorsD1 andD2.
(a stripe on the info-layer, an elongated circle on the non-info surface). Because ofthe spatial averaging effect, no substantial difference ofpreference is found for thenear- or far-field methods.
3.3 Examples of light paths
The various methods for deriving the high-frequency signaland the optical errorsignals have to be incorporated in a light path that has wide tolerances both duringmanufacturing and product life (optical damage, thermal and mechanical drifts). InFig.(11), lefthand side, a classical light path for CD is shown with the light from thelaser diode source coupled in via a semi-transparent plate towards the collimator-objective combination. The reflected light is transmitted through the beam splittertowards a double-wedge prism that separates the far field region in order to accom-modate for the detection of a Push-Pull radial tracking signal. The double wedgealso serves as ‘knife-edge’ for each beam half thus producing two complementaryknife-edge images for focus detection. This light path is made from simple, easilyavailable components. The tightest tolerance regarding temperature and mechanicaldrift is found in the relative position of source and detector with respect to the beamsplitter.In the righthand figure, the beam splitting action is obtained with the aid of a holo-graphic element. The relatively thick substrate carries a grating on the lower surfacefor generating the three spots needed for radial tracking. The upper surface containsa more complicated structure, the holographic or diffractive element. At the wayforth to the disc, the three beams generated by the grating continue as the zerothorder of the holographic structure and they are captured by the collimator and ob-jective. Consequently, three light spots are focused on thedisc. On the way back,the light diffracted by the hologram propagates towards thedetector region and afar-field splitting is obtained by sending one half circle ofthe beam cross-section to

16
Fig. 11.An optical light path using separate optical components forachieving the beam sep-aration and the generation of the focus and radial error signals (left). In the righthand picture,the splitting function and the generation of the error signals is obtained by means of holo-graphic or diffractive optical element. In the lower picture, the various beams are shown thatpropagate towards the detector after traversal of the holographic beam splitterHOE.
the detectors 2 and 3 and the other half to detector 4. The auxiliary spots producedby the grating are directed towards the detectors 1 and 5. A focus error signal is ob-tained by taking the difference between detectors 2 and 3 while the Push-Pull radialtracking error signal can be obtained by the signal combination (2+3)-4. Moreover,an extra twin-spot radial error signal is obtained from the detector difference signal1-5 (the radial offset of each spot is one quarter of a pitch).The high frequencysignal is derived from the sum of the detectors 2, 3 and 4. The attractiveness of thehologram solution is its mechanical and environmental stability. The directions ofthe diffracted orders are rather insensitive to hologram tilt and displacement and thesource and detector are mounted on one single substrate. A wavelength change will

17
shift the diffracted spots along the dividing line between detectors 2 and 3 but doesnot cause an offset.
4 Radial tracking for DVD
Some disadvantages of the radial tracking methods had become manifest while us-ing them for the CD-system. The twin-spot method requires anextra grating witha rather delicate angular orientation and, in the recordingmode, precious opticalpower (some 20%) is spread out to the auxiliary twin spots. The Push-Pull methodis sensitive to the phase depth∆φ of the information and does not work in the pres-ence of pure amplitude information patterns. The spot or track wobble method, due
A B
CD
Fig. 12.Overlapping regions in the far-field quadrantsA,B,C andD with typical modula-tion terms in the DC-domain and in the high-frequency domain(frequencyω). In each of theeight examples shown, the letters are printed (between brackets) of the quadrants in the farfield where a certain harmonic modulation term of the signal is detected. The dependence onthe disc translation is given by the termωt and a radial displacement by the phaseφr. If notranslation termωt is present, the signal only shows variations of average instensity (denotedby ’constant’) due to radial position. The tangential direction is chosen horizontally in thefigure.
to its very nature, consumes precious space in the radial direction and is likely toincrease the cross-talk between tracks when compared to theother methods at equal

18
density. For this reason, the Differential Phase Detection(DPD) method [24], orig-inally devised for the analog video disc system, has been revisited to adapt it tothe digital signals on the high-density DVD disc. It is now commonly called theDifferential Time Detection (DTD) method
4.1 A diffraction model for the DPD and DTD tracking signal
An easy picture for the understanding of the differential phase (or time) detectionmethod is obtained when the information in the tangential direction is replacedby a single frequency, so that, together with the radial periodicity, a purely two-dimensional grating is present on the disc. In Fig.(12) the various quasi-DC and ACsignals are depicted that are present in the far-field on a quadrant detector (quad-rantsA,B,C andD). Each modulation term depends on the diffraction direction.
Fig. 13.Various methods for the extraction of a Differential Time radial error signal using thesignals present in the far-field quadrants.
Radially diffracted orders show a (varying) intensity level in an overlapping regionwith the zeroth order that is proportional tocos(ψ10 ±φr). The reference phaseψ10
between the first and zeroth orders is determined by the disc structure; it varies fromπ/2 for very shallow structures toπ if the phase depth∆φ of the optical effectsattains the value ofπ. The quantityφr = 2πr/q is proportional to the tracking error

19
r (q is the track pitch). The sign ofφr depending on the order number±1 of thediffracted order. In the same way, the overlapping regions in the tangential direc-tion show an intensity variation according tocos(ψ10 ±ωt), caused by the scanningwith uniform speed of the tangentially stored periodic pattern. Obliquely diffractedorders show a mixed phase contribution and are carrying the interesting informationfor deriving the tracking error.Collecting the interference terms on the various quadrants, we obtain
SA(t, φr) = cos(ωt+ ψ) + α cos(ωt− φr + ψ)
SB(t, φr) = cos(ωt− ψ) + α cos(ωt+ φr − ψ)
SC(t, φr) = cos(ωt− ψ) + α cos(ωt− φr − ψ)
SD(t, φr) = cos(ωt+ ψ) + α cos(ωt+ φr + ψ) , (2)
where all possible reference phase angles between zeroth and first diffracted orders,for reasons of simplicity, have been replaced by a single phase angleψ and whereα is a factor less than unity that accounts for the relatively small contribution of thediagonal orders with respect to the tangential orders.With this approximation, the various high-frequency signals are now given by:
SCA(t, φr) ∝ +{1 + α cosφr} cosψ cos(ωt)
StPP (t, φr) ∝ +{1 + α cosφr} sinψ sin(ωt)
SrPP (t, φr) ∝ +α sinφr sinψ cos(ωt)
SdPP (t, φr) ∝ −α sinφr cosψ sin(ωt) . (3)
The subscripts here denote the signals according to the detector schemes CentralAperture (CA=A+B+C+D), tangential Push-Pull (tPP=A−B−C+D), radialPush-Pull (rPP=A+B −C −D) and diagonal Push-Pull (dPP=A−B +C −D).For the derivation of a tracking signal, a reference signal with a well-defined time-dependent phase is needed for comparison with a signal whosephase depends onthe tracking error. As a reference signal we can choose the Central Aperture (CA)signal or the tangential Push-Pull signal. If we take the CA-signal and multiply itwith the dPP-signal after a phase shift of the latter overπ/2 we obtain after low-passfiltering:
S1(φr) ∝ −α cos2 ψ{sinφr +1
2α sin 2φr} . (4)
The multiplication of the tangential PP-signal and the diagonal PP signal directlyyields after low-pass filtering:
S2(φr) ∝ −α sinψ cosψ{sinφr +1
2α sin 2φr} . (5)
Inspection of the signalsS1(φr) andS2(φr) shows that they provide us with therequired bipolar signal of the tracking errorφr . The factor in front, containingψ,depends on the phase depth∆φ and makesS2(φr) less apt for discs with relatively

20
deep optical structures whileS1(φr) performs optimum in that case.Other possible combinations are obtained when combining the high-frequency ra-dial Push-Pull signal with either the CA- or the tPP-signal.One easily deduces thatthe following signals result after multiplication, phase-shifting and low-pass filter-ing of, respectively, rPP and CA (S3(φr) and rPP and tPP Radial (S4(φr):
S3(φr) ∝ α sinψ cosψ{sinφr +1
2α sin 2φr} . (6)
S4(φr) ∝ α sin2 ψ{sinφr +1
2α sin 2φr} . (7)
The ψ-dependence of especiallyS4(φr) makes it unsuitable for standard opticaldiscs but especially favourable for extra shallow disc structures.
4.2 The influence of detector misalignment on the tracking signal
The single-carrier model can be equally used for studying the effects of misalign-ment of the quadrant detector with respect to the projected far-field pattern, theso-called beam-landing effect. This effect is produced during quick access of a re-mote information track. The sledge (coarse movement) and the scanning objective(precise positioning) are actuated together and this action produces a lateral dis-placement of the objective with respect to the fixed collimator and detector that canamount to some 10% of the beam foot-print on the detector. As aconsequence, thewhole diffraction pattern is shifted on the detector in the radial direction (see thearrow ‘spot offset’ in Fig.(13)). Taking into account such amechanically inducedoffset with a size ofǫ (normalised with respect to the half-diameter of the beamfoot-print), we write the signals corresponding to the interference terms in the over-lapping regions of the far field as
SA(t, φr) = (1 + ǫ) cos(ωt+ ψ) + α cos(ωt− φr + ψ)
SB(t, φr) = (1 + ǫ) cos(ωt− ψ) + α cos(ωt+ φr − ψ)
SC(t, φr) = (1 − ǫ) cos(ωt− ψ) + α cos(ωt− φr − ψ)
SD(t, φr) = (1 − ǫ) cos(ωt+ ψ) + α cos(ωt+ φr + ψ) . (8)
The beam-landing effect has only been applied to the purely tangential diffractionorders; the diagonal orders are rather far away from the horizontal dividing line ofthe quadrants.Two of the four basic signals derived from the quadrantsA,B,C andD depend onthe radial misalignment and they become:
SrPP (t, φr) ∝ α sinφr sinψ cos(ωt) − ǫ cosψ cos(ωt)
SdPP (t, φr) ∝ −α sinφr cosψ sin(ωt) − ǫ sinψ sin(ωt) . (9)

21
The four possible DPD-signals now become
S1(φr) ∝ −α cos2 ψ{sinφr +1
2α sin 2φr} − ǫ sinψ cosψ(1 + α cosφr)
S2(φr) ∝ −α sinψ cosψ{sinφr +1
2α sin 2φr} − ǫ sin2 ψ(1 + α cosφr)
S3(φr) ∝ α sinψ cosψ{sinφr +1
2α sin 2φr} − ǫ cos2 ψ(1 + α cosφr)
S4(φr) ∝ α sin2 ψ{sinφr +1
2α sin 2φr} − ǫ sinψ cosψ(1 + α cosφr) . (10)
The signalsS1 andS4 show a beam landing sensitivity that is maximum for theλ/4pit depth (ψ ≈ 3π/4); for deep pits (optical depth isλ/2) or for amplitude structures(ψ = π) the beam landing sensitivity is zero.An interesting combination of the signalsS1 andS4 is given by
S5(φr) = S1(φr) − S4(φr) ∝ {sinφr +1
2α sin 2φr} . (11)
The detection scheme can be written as follows:
S5(φr) = [B − C][A +D]90o − [A−D][B + C]90
o
, (12)
where the index90o implies that the 90 degrees phase shifted version of the signalhas to be taken. The signalS5 is fully independent of pit depth and does not sufferat all from beam landing off-set.Another possible linear combination is given by
S6(φr) = S2(φr) − (1 + s)S3(φr)
∝ −(1 + s/2) sinψ cosψ{sinφr +1
2α sin 2φr}
+ǫ/2 [sin2 ψ − (1 + s) cos2 ψ]{1 + α cosφr} . (13)
The beam landing influence on this signal is reduced to zero bythe condition
s = tan2 ψ − 1 . (14)
The detection scheme forS6 is
S6(φr) = [CD −AB] + (s/4)[(C +D)2 − (A+B)2] . (15)
In the particular case thatψ = 3π/4, the signal is free from beam landing effectswhen using its simplest form[CD − AB]; the corresponding tracking signal isobtained after low-pass filtering of this high-frequency signal product.
4.3 The DTD tracking signal for the DVD-system
Shifting from analog to digital signals with their associated clock reference signal,it is evident that the measured phase shifts will now be replaced by time differences

22
between the clock signals associated with specific digital signals derived from thequadrant detector.The principle of differential time detection can be explained with the aid of Fig.(14).The focused light spot (centre inM ) is scanning an information pit slightly off-track(distancev0) in the direction of the arrow. The leading and the trailing edge of the
1 2 3 4
v0
(A,C) (B,D)(B,D)
SCANNING SPOT
PIT
LAND
M
(A,C)
Fig. 14. A schematically drawn focused spot (gray area) is scanning an optical pit with atracking errorv0. The positions1 and3 mark the front and end of the pit as they are detectedby the detector pair(B,D); the positions2 and4 correspond with the beginning and end ofthe pit when detected by the diagonal detector pair(A,C).
pit induce diffraction of the light perpendicularly to the hatched lines(A,C) and(B,D). When the centreM of the scanning spot is in the position1, the detectorpair (B,D) perceives the leading edge of the pit and the intensity on this detectorpair will go down. A short time later, the detector pair(A,C) will measure the pas-sage of the leading edge because the intensity goes down at the position2. Once thescanning spot has advanced towards the pit end, the trailingedge will be detected atthe positions3 and4 by a rise in intensity on respectively the detector pairs(B,D)and(A,C). By measuring the time difference between the information signal on thediagonal detector pairs, a bipolar function of the trackingerrorv0 can be obtained.Further away from the edges, in the longer pit sections and land regions, the summedintensities on the two quadrant pairs are virtually equal and there is no contributionto the DTD-signal.The standard DTD-signal is derived by first summing the intensities on a diagonalpair of detector and then detecting the time shift by electronic means. It is also possi-ble to compare the phase difference between individual quadrants and we concludethat the following set of detection schemes is possible:
• τ(A+C) - τ(B+D)
The time difference between the sum signal from quadrantsA+C and the sumsignal from quadrantsB +D is taken. This is the standard DTD-method basedon a diagonal difference signal and the denomination isDTD2-signal.
• (τB - τC ) + (τD - τA)This difference signal requires four independent high-frequency detectors; ontrack, each difference signal(D −A) and(B − C) is identical zero. The com-
23
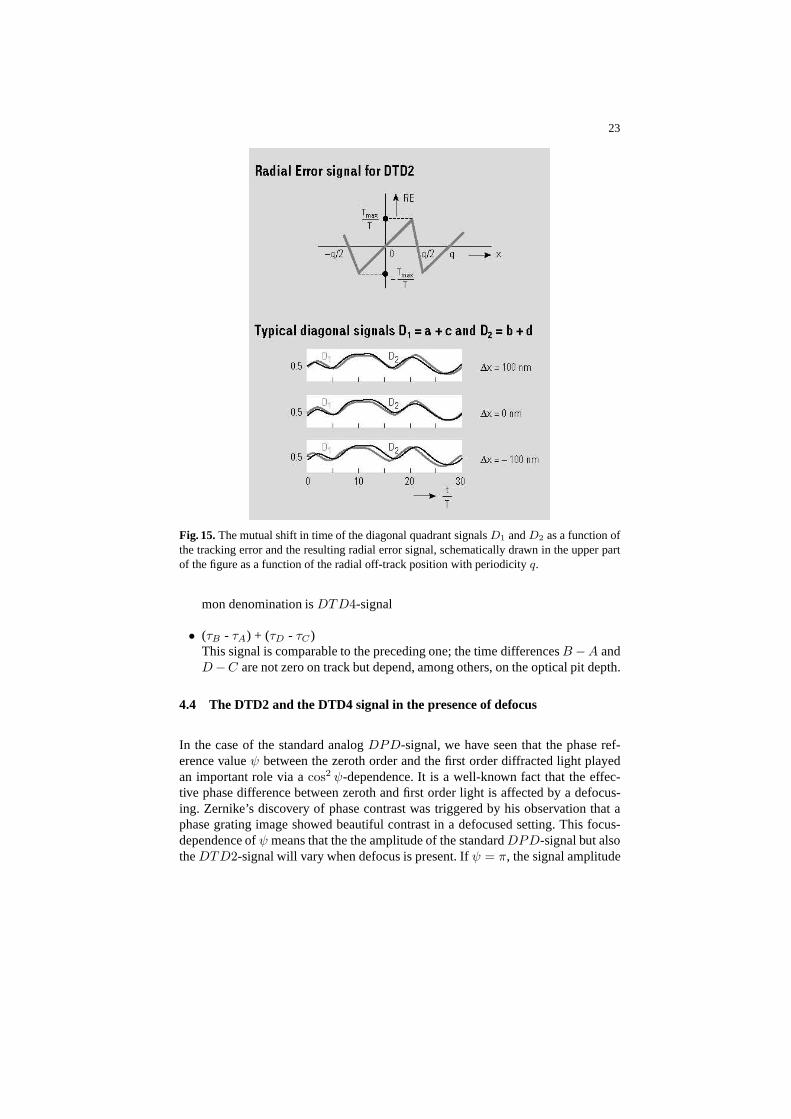
Fig. 15.The mutual shift in time of the diagonal quadrant signalsD1 andD2 as a function ofthe tracking error and the resulting radial error signal, schematically drawn in the upper partof the figure as a function of the radial off-track position with periodicityq.
mon denomination isDTD4-signal
• (τB - τA) + (τD - τC )This signal is comparable to the preceding one; the time differencesB−A andD−C are not zero on track but depend, among others, on the opticalpit depth.
4.4 The DTD2 and the DTD4 signal in the presence of defocus
In the case of the standard analogDPD-signal, we have seen that the phase ref-erence valueψ between the zeroth order and the first order diffracted lightplayedan important role via acos2 ψ-dependence. It is a well-known fact that the effec-tive phase difference between zeroth and first order light isaffected by a defocus-ing. Zernike’s discovery of phase contrast was triggered byhis observation that aphase grating image showed beautiful contrast in a defocused setting. This focus-dependence ofψ means that the the amplitude of the standardDPD-signal but alsotheDTD2-signal will vary when defocus is present. Ifψ = π, the signal amplitude

24
is symmetric around focus and the maximum is found in the optimum focus setting.If ψ < π, the tracking signal will show a maximum value in a defocusedsituationand can even become zero in focus. SpecialDPD-signals (S5(φr) andS6(φr)) re-mained unaffected by the value ofψ and they also show a behaviour that, in a firstinstance, is independent of defocus. It turns out that for the DTD4-signal, wherethe time difference is evaluated independently for each quadrant detector, a compa-rable robustness holds with respect to defocus. In Fig.(16)theDTD2 andDTD4
tracking error (mu)−0.4 −0.2 0.0 0.2 0.4
−3
−2
−1
0
1
2
3
DT
D2
(uni
ts c
lock
leng
th)
tracking error (mu)−0.4 −0.2 0.0 0.2 0.4
−3
−2
−1
0
1
2
3
DT
D4
(uni
ts c
lock
leng
th)
DW20=−0.25
DW20=+0.00
DW20=+0.25
zero level
Fig. 16. The radial tracking signalsDTD2 andDTD4 with different amounts of defocus.The defocus parameterDW20 is expressed in wavefront aberration at the pupil rim in unitsof the wavelengthλ of the light. A value of 0.25 corresponds to a defocusing∆zs of onefocal depth (typically 0.8µm for a DVD-system). The tracking error signal has been numer-ically computed using a long sequence of pits obeying the standard EFM (Eight toFourteenModulation) scheme [25]. The disk layout and the reading conditions are those encoun-tered in the DVD-system but the depth of the information pitshas been reduced to 60 nm(ψ ≈ 3π/4) instead of the common 100 nm.drawn line:∆zs=-0.8µm, triangles:∆zs=0, crosses:∆zs=+0.8µm.
signals have been depicted for a rather shallow disk patternwith DVD-density. Itis clear from the figure that there is a pronounced asymmetry around focus for theDTD2-signal while theDTD4-signal virtually remains unaffected by defocus; inparticular the slope at the central zero set-point of the servo system remains unal-tered on defocusing.We conclude by reminding that the introduction of the DTD-tracking method in theCD-system was hampered by a signal instability that appeared when neighbouringtrack portions showed comparable information with a fixed mutual position over adistance that was within the bandwidth of the radial servo system. An example ofsuch a problematic situation was found in the fixed digital pattern used to representabsolute silence on a CD audio disc. In the DVD-system, this fixed pattern problem

25
has been avoided by an appropriate extra coding step that suppresses the prolongedappearance of fixed patterns.
5 Compatibility issues for the DVD- and the CD-system
The compatibility issues between the two standardsCD andDVD are caused bythe change in substrate thickness, the change in wavelengthand, to a lesser de-gree, the change in numerical aperture. The combination of smaller wavelength andhigherNAwould lead to a density increase by a factor of 2.5. Further gain in densityhas been obtained by the higher frequency choice in the DVD-system with respect tothe available optical pass-band; this has led to a total factor of five. The final factorof 7.2 has been achieved by more efficient modulation schemesand error correctiontechniques.In Fig.(17) the specifications of both systems have been tabulated and we observethat the substrate thickness has been halved forDVD. The reason for this reductionin thickness was the specification on disc tilt during playback. The higherNA andshorter wavelength of the DVD-system causes a two times larger comatic aberrationof the read-out spot at equal tilt angle. The amount of coma being linearly dependenton the substrate thickness, a reduction of thickness was required. The 600µm com-promise between tolerances and mechanical stability was solved by bonding twosubstrates together, leading to a doubled capacity. As it appears from Fig.(18), thedoubled capacity can be further increased by introducing inboth substrates a buriedinformation layer that is approximately semi-transparent. The distance between theburied layer and the fully reflecting information layer is specified in a margin of 40to 70µm to avoid a too large value of spherical aberration when reading the layersat anNA of 0.60 in red light (λ=650 nm).
5.1 The substrate-induced spherical aberration
In a DVD player, the most critical task is the reading of the high-density DVD discwith anNA value of 0.60 and with light of a wavelength of typically 650 nm. Al-though a CD or CD-ROM disc could also be read with the same wavelength, thisdoes not necessarily apply to a CD-R or a CD-RW disc. The correct optical con-trast between recorded optical effects and the land regionsis only guaranteed at theoriginal CD-wavelength of 780 nm. The reading of a CD-type disc thus first re-quires an extra source and, secondly, a solution needs to be found for the readingthrough a substrate that is 600µm thicker than prescribed in the specification for theDVD-objective. The thicker substrate causes spherical aberration in the CD-readingspot due to the fact that the marginal rays are more refractedthan the paraxial rays,thus enlarging the focal distribution in the axial direction away from the objective.Simultaneously, a serious lateral smearing out of the lightintensity distribution isobserved and the correct reading of the CD-information is prohibited by this aber-ration phenomenon. In Fig.(19), images of intensity distributions at various focussettings are shown for a focused wave that suffers from spherical aberration. The

26
Fig. 17.Table with the most relevant specifications of theCD- and theDVD-system.
picture at the height of the chain-dotted line is found at theaxial position corre-sponding to the paraxial focus; approximately two picturesup, the marginal focusposition is found where the aberrated marginal rays cut the optical axis. The amountof wavefront spherical aberrationWS , written as a power series of the numericalaperture (NA=sinα), and normalised with respect to the wavelength of the lightisgiven by
WS =d
λ
{(
n2 − 1
8n3
)
sin4 α+
(
n4 − 1
16n5
)
sin6 α+

27
Fig. 18. Cross-section of a double-sided DVD-disc with an extra semi-transparent informa-tion layer (dotted) on each side.
(
5(n6 − 1)
128n7
)
sin8 α+ · · ·}
, (16)
wheren is the refractive index of the disc substrate material andd the thicknessdeviation.If we use the numbersλ=650 nm,d=600µm, n=1.586 (refractive index of poly-carbonate) andsinα=0.60, the numerical values of the three factors in the powerseries ofsinα in Eq.(16) amount to, respectively, 5.68, 1.43 and 0.36 in units ofwavelengths. At a first sight, knowing that optical disc read-out has to be done indiffraction-limited conditions, these values are far too large. In Fig.(20) we havedepicted the behaviour of the central intensity along the axis and in Fig.(21) wepresent calculated intensity distributions at axial positions between the paraxial andthe ‘best’ focus (halfway the paraxial and the marginal focus). From Fig.(21), it isobvious that the reading of a CD-disc is impossible close to the ‘best’ focus setting(e.g. using the light distribution from the second row, lastpicture) . The reading spotis very much degraded and almost all energy has drifted towards strong diffractionrings; at read-out, the diffraction rings will yield an unacceptable intersymbol inter-ference and the digital eye pattern fully disappears. However, the asymmetry withrespect to the ‘best’ focus position shows a peculiar effect: towards the paraxialregion, the strong diffraction rings disappear and a central lobe is observed super-imposed on a reduced intensity background. The central lobeis much broader thanin the best focus but could have an acceptable size for reading a low-density CD-disc when the background intensity is somehow made inoffensive by the read-outmethod. The distribution that most resembles a standard reading spot (appropriatehalf width, low level of side lobes) is found around the thirdposition of Fig.(21).The focus setting corresponds to an offset from the paraxialfocus of some 6 to 8focal depths (one focal depth≈ 0.8 µm) and yields an intensity distribution thatshould be adequate for CD read-out. In Fig.(20), this interesting axial position is

28
Fig. 19. Intensity profiles at different positions along the opticalaxis for a pencil sufferingfrom spherical aberration (from: M. Cagnet, M. Francon andJ.-C. Thrierr, Atlas of opticalphenomena, Springer-Verlag, Berlin, 1962). In the case of aDVD-player reading a CD-disc,the extra substrate thickness introduces spherical aberration with a sign such that the lowerpart of the figure is closest to the objective and the light travels in the direction given by thelarge arrow in the upper part of the figure.
approximately halfway up-hill the first maximum.

29
Axial intensity focus Delta(d)=+600mu NA=0.60
defocusing0 10 20 30 40 50
0.00
0.05
0.10
0.15
norm
aliz
ed in
tens
ity
Fig. 20.A plot of the axial intensity of a pencil suffering from spherical aberration due to asubstrate thickness increase of 600µm (NA=0.60,λ=650nm). The paraxial focus is at z=0,the best focus at z=24µm and the marginal focus at z=48µm.
Fig. 21.3D-plots of the intensity distribution (from left to right)going away from the paraxialfocus towards the best focus in axial steps of 3µm (one focal depth equals 0.81µm (NA=0.60,λ=650nm). The maximum intensity in the figures is about 0.10 with respect to 1.0 for thediffraction-limited case. The length and width of the square plot area are4λ/NA (4.33µm).The upper right figure represents the optimum focus setting for reading a CD-disc.
Given the low peak intensity, an important amount of low-intensity aberrated straylight can be expected around the central peak and this background should be pre-vented from reaching the detector. This can be done by introducing an aperture inthe light path towards the detector, or, alternatively, by using a detector of finite size;the strongly aberrated rays, after double passage through the mismatched substrate,will have a large transverse aberration in the image plane and miss the quadrant de-

30
tector. The effect on the calculated digital eye pattern of the effective reduction ofthe detector apertureNAD is illustrated in Fig.(22). These graphs show the result-
Fig. 22.A plot of the digital eye that is detected when focusing at a position 6µm away fromthe paraxial focus (lefthand figure: far-field detection region is 80% of full aperture; righthandfigure: 55% of the aperture is effectively used for detection. Note the loss in signal strengthin the second picture.
ing digital eye pattern when the detection diameter in the far field is reduced frome.g. 80% to 55% at a focus setting with z=+6µm from the paraxial focusP . In thecase of a digital disc system, the quality of the detector signal is generally assessedby means of the so-called root mean square digital jitter. This quantity is obtainedby binarising the analog signal read from a disc and comparing it with the desiredbinary wave form. The root mean square value of the shifts of the transients in thedetected signal with respect to the corresponding positions in the originally recordedsignal is called the digital jitter of the signal. The digital jitter ∆d is expressed inthe time domain or in the spatial domain and counted in units of the clock lengthT of the digital signal. In the righthand figure, the residual jitter amounts to 6.7%;this value is obtained in the case of a maximum decorrelationbetween neighbouringtracks. When the information between the tracks is fully correlated, the jitter goesdown to 3% and in practice one finds values of 5.5 to 6% in optimum CD read-outconditions.
A further reduction in jitter is possible when the residual spherical aberration presentover the central area is corrected in the objective by tailoring the surface profile ofthe first aspheric surface of the single element objective lens. In this case, a wave-front correction is applied to the central 55% region while the outer region is leftunaltered and this leads to a further reduction of the jitterin the detected signal downto 5% for a CD-disc.
5.2 The effective optical transfer function
The changes at read-out by a reduction of the far-field detection area to e.g. 55 %of the total beam diameter can be expressed in terms of a modified MTF (modula-

31
tion transfer function) of the optical read-out system. A reduction of the detectionaperture is equivalent to a more coherent or partially coherent detection of the in-formation on the disc and this increases the response at the mid-spatial frequenciesalthough, simultaneously, the cut-off frequency of the optics is reduced. This lattereffect is not very important when reading a CD-disc atNA=0.60 andλ=650 nmbecause the cut-off frequency is far too high (1850mm−1 instead of 1150mm−1
for a standard CD-player).In Fig.(23) we observe that at the optimum focus setting the resulting MTF (curveswith triangles) is not much different from the standard MTF encountered in a classi-cal CD-player withNA=0.45 andλ=785nm (the cut-off frequency would be foundat an axial value of 1.15).In the figure we also show the slight improvement that is possible when the residual
Fig. 23.MTF-curves of the read-out with reducedNA value at the detection side. The hori-zontal axis is expressed in unitsNA/λ. In the figure the optimum MTF obtained by selectinga relative aperture of 55% in the reflected beam (triangles) is further improved by introduc-ing a correction for the residual spherical aberration overthe central section of the objective(drawn line). For comparison, the optimum transfer function at full detection aperture hasbeen sketched (dashed line).
spherical aberration present over the central area of the reading beam is corrected inthe objective (drawn line). Some 5 to 10% improvement in MTF-value is possibleat the mid CD-frequencies and this becomes visible also in the reduction of the bot-tom jitter. Moreover, the absence of residual spherical aberration over the effectivedetection area leads to a better symmetry of the read-out signal around the optimumfocus setting.
5.3 The two-wavelength light path
As we remarked before, recordable or rewritable CD-discs require a read-out at theappropriate wavelength ofλ=780-840nm and the corresponding numerical apertureamounts to 0.45 . The partially coherent read-out atNAD=55% that was possible atthe red wavelength with a slight objective modification at the most, does not yield

32
a sufficiently large optical bandwidth atλ=780 nm. A solution is found by a furthertailoring of a ring section of the surface profile of the first aspheric surface of the ob-jective, thereby reducing the spherical aberration at CD read-out. The objective thencan be considered to consist of three regions. The central paraxial region contributes
Fig. 24. The layout of an optical light path for DVD and CD with the possibility to injectan extra read/write beam of different colour via a second beam splitter (not shown in thefigure), either before the beam splitter of in the parallel beam section after the collimator. Thepolarisation-sensitive light path with quarter-wave plate and polarising beam splitter (PBS)is used to maximise writing power.
to both DVD and CD read-out. A relatively narrow annular region corrects the CDread-out but is effectively lost for the DVD read-out. The outer region is only usefulfor the DVD read-out; this part of the read-out bundle becomes heavily aberrated atCD read-out and is then lost for detection [26]. The rather low light efficiency at CDread-out that was observed in Fig.(22) does not occur once a second independentsource is used for CD read-out. The far-field of the second source can be adjustedto the maximum aperture (0.45 ≤ NA ≤ 0.50) needed for CD read-out.Other compatibility solutions have been proposed based on adiffractive structureapplied to the first aspheric surface of the objective and capable of correcting thespherical aberration in the first diffraction order [27]. More advanced solutions haverecently been described in [28].
6 Efficient calculation scheme for the detector signal
In this section we will treat the problem of the efficient calculation of the detectorsignal in an optical disc player. The reliable and numerically efficient modelling ofdetected signals is a very welcome addition to the experimental verification of newideas. With a reliable modelling tool, one obtains a quick estimate of tolerancesand robustness of new options for recording schemes and read-out methods. In thissection we present a numerical procedure that carries the mathematical analysis of

33
the read-out process as far as possible and thus gains precious time as compared tothe purely numerical approach. Especially in the case of optics with general pupilshape and aberrations, the analytical approach can bring animportant reduction incalculation time.
6.1 Optical configuration and the FFT-approach
The light path of an optical disc player is well represented by a scanning microscopeof Type I according to the terminology given in [20]. In the schematic drawing of alight path according to Fig.(25), the detector could also bepositioned at the locationof the aperture ofO
′
and in many modelling approaches, this is effectively done tominimize the numerical burden. But the way in which the high-frequency and the
S
O O’
FD
(X,Y)(u,v) (X’,Y’)
(x,y)
R
Fig. 25. Schematic drawing illustrating the progation of the light from the sourceS via theobjectiveO towards the disc surface in the focal planeF of O. The disc presents a (spatiallymodulated) reflection functionR(u, v). After reflection the diffracted light is captured by thesame objective (here denoted byO
′
) and an image of the disc is produced at the location ofthe detector planeD. The pupil coordinates(X, Y ) and(X
′
, Y′
) are commonly normalizedwith respect to the half-diameter of the objective aperture. The disc coordinates(u, v) andthe detector coordinates(x, y) are normalized with respect to the diffraction unitsλ/NA inboth planes.
optical error signals are derived is more complicated and the diffraction step fromthe aperture ofO
′
to the composite detectors in planeD is essential if a detailedknowledge of the intensity distribution on the detectors isneeded. As an examplewe take the hologram beamsplitter of Fig.(11) where each beam propagating to thedetector plane effectively originates from one half of the collecting aperture atO
′
.Another example is the light path introducing astigmatism in Fig.(8). The intensitydistribution on the detector in best focus is some 20 times larger in linear measure ascompared to the standard diffraction image. It is importantto know the distributionof the high-frequency signal in the various quadrants in both the in-focus situationand the defocused case.The standard way to calculate a detector signal is the repeated application of a prop-agation step from an object or image plane to an aperture and vice versa, in opticalterms by propagating from the near field to the far field and back. The degree ofsophistication with which the propagation is carried out isnot crucial in the sensethat each propagation step can be reduced to a Fourier transform. Especially when

34
a scalar diffraction approach is sufficient, a single Fourier transform operation perstep is adequate. For an efficient numerical implementation, the Fourier integral isreplaced by a Fast Fourier Transform (FFT) that is faster with respect to executiontime.The assessment of the digital signal is carried out by means of the digital jitter∆d.As a rule of thumb, one can say that therms jitter preferably should not exceed10% of the clock length. At a value of 15%, prolonged over large signal portions,the digital signal fully breaks down and cannot be reconstructed without errors. Thefact that some statistics are needed to calculate a reliablejitter value means that anextended track portion with a digitally modulated signal has to be scanned. For areliable reconstruction of the optical signal, the sample points where the detectorsignal is calculated should be rather densely spaced, e.g. with a spatial incrementof 0.05 to 0.1 of the diffraction unitλ/NA. For each sample point at the disc, thetwo FFT-steps from the disc to the apertureO
′
and to the detector planeD have tobe executed, provided that the incident amplitude distribution at the focal pointF isstored in memory. Several thousands of FFT-steps can be needed for obtaining onesingle value of∆d.
6.2 The analytic approach
The analysis given in this subsection uses the material presented in references [29]and [2]. In order to accommodate for more general signal sequences without loosingthe advantage of dealing with periodic structures, we definea larger unit cell (lengthp) that contains several optical effects in the tangential direction and, if needed,several neighbouring tracks in the radial direction with a formal radial period ofq(see Fig.(26)).In the presence of the double periodic disc structure, the complex amplitude in theentrance aperture of the collecting objectiveO
′
(see Fig.(25)) is given by the sumof a certain number of diffracted waves according to
A′(X ′, Y ′) =∑
m,n
ρm,n exp
{
2πi
[(
m
p
)
u+
(
n
q
)
v
]}
f (X ′ − m
p, Y ′ − n
q) , (17)
wherem is the tangential order number and the quantityn equals the radial ordernumber(n −ms/p) of a disc with a track-to-track shifts of the information. Theargument of the exponential function is proportional to themutual displacement(u, v) of the scanning spot and the disc structure in, respectively, the tangential andradial direction. The factorρm,n is equal to the complex amplitude of the diffractedwave with the corresponding order number(m, n). The complex functionf(X
′
, Y′
)stands for the lens function and carries the information about the lens transmissionfunction (e.g. pupil shape, gaussian filling factor of the incoming beam) and the lensaberration.Figure (27) shows the zeroth diffracted order and a general diffracted order (dotted

35
p
s
qu
v-1
0
+1
f
S(f)
Fig. 26.The disc structure possesses a double periodicity. The fundamental frequency in theradial direction is given by1/q with q in principle being equal to the pitch of the informa-tion track. The periodicity in the tangential direction is a‘synthetic’ one. Within one periodof lengthp several optical effects are present that obey the modulation rule of the opticalstructure with respect to the lengths of the optical effectsand the land sections in between.The tangential information is repeated in the neighbouringtracks but a shift (distances) hasbeen provided to avoid directly correlated cross-talk. Thetangential repetition with periodpleads to a typical sampled power spectrumS(f) of the digital information on the disc (lowergraph); the distance between the frequency sample points along the normalised frequencyaxis is given by∆f = λ/p(NA).
circles) as they are located in the pupil of the collecting objectiveO′
. The coordi-nates(X
′
, Y′
) in the exit pupil are linearly related to the sines of the angles in thefar-field of the disc structure if the collecting objectiveO
′
satisfies the sine condi-tion of geometrical optics [30].The imaging step from the exit pupil ofO
′
to the detector plane is another Fouriertransform from the coordinates(X
′
, Y′
) to the detector plane coordinates(x, y).The lens function ofO
′
is denoted byg(X′
, Y′
); in the special case of a reflectivesystem, we putg(X
′
, Y′
) = f(−X,−Y ). The complex amplitudeA′′
(X′
, Y′
) inthe exit pupil of the collecting objective becomes the product ofA
′
(X′
, Y′
) and thelens functiong(X
′
, Y′
). If the disc is uniformly rotated, resulting in a local linearspeed ofs0, the period1/p is transformed into a temporal frequencyft = s0/p. We

36
X’
Y’
ρ0,0
m,nρ
1 rO’
rO=
Fig. 27. Position of the diffracted orders of the disc structure withdouble periodicity in theexit pupil of the collecting objectiveO
′
with half diameterrO
′ . The zeroth order with com-plex amplitudeρ0,0 has been shown and a general diffraction order(m, n). The hatched areaindicates which part of the order(m, n) is transmitted to the detector plane.
finally find for the complex amplitude in the detector plane
B(x, y; t) =
∫ ∫
O′
A′′
(X ′, Y ′) exp {2πi (X ′x+ Y ′y)} dX ′dY ′
=∑
m,n
ρm,n exp
{
2πi
[
m
(
ftt−sv
pq
)
+nv
q
]}
∫ ∫
O′
g (X ′, Y ′)f
(
X ′ − m
p, Y ′ −
n− msp
q
)
exp {2πi (X ′x+ Y ′y)} dX ′dY ′ , (18)
where the integral is formally carried out over the full areaof the exit pupil ofO′
.In Eq.(18) we separate the integral over the exit pupil areaO
′
, that only dependson the imaging properties of the lenses, from the part that isscanning-dependentand carries information about the structure of the disc via the factorsρm,n. Theexpression forB(x, y; t) now reads
B(x, y; t) =∑
m,n
ρm,n exp
{
2πi
[(
m
(
ftt−sv
pq
)
+nv
q
)]}
Fm,n(x, y) , (19)
where the factorFm,n(x, y) equals the integral overX ′ andY ′ in Eq.(18).The detected quantity is the intensity, obtained by multiplying B(x, y; t) with itscomplex conjugate and this yields
I(x, y; t) = |B(x, y; t)|2 =∑
m,n
∑
m′,n′
ρm,n ρ∗
m′,n′ Fm,n(x, y) F ∗
m′,n′(x, y)
37
exp
{
2πi
[
(m−m′)
(
ftt−sv
pq
)
+(n− n′)v
q
]}
. (20)
In an optical disc system we use special detector geometries, e.g. a quadrant de-tector. The detector signal is obtained by integrating the intensity over the detectorarea, taking into account a locally varying detection sensitivity functionS(x, y) andthis yields akth detector signal according to
SDk(t) =
∑
m,n
∑
m′,n′
ρm,n ρ∗
m′,n′
exp
{
2πi
[
(m−m′)
(
ftt−sv
pq
)
+(n− n′)v
q
]}
∫ ∫
Dk
S(x, y) Fm,n(x, y) F ∗
m′,n′(x, y)dxdy , (21)
whereDk denotes the area of thekth detector. In the expression for the detectorsignal we have separated the quantities related to the disc structure from the integralthat only contains information on the imaging process by theobjective and col-lecting lens. This means that one single effort in evaluating the integral in Eq.(21)can serve for the many times repeated calculation of detector signals correspondingto different structures on the disc that fit into the basic period of lengthp. In thisway we can gather statistical data on the digital jitter∆d with a seriously reducednumerical effort; in practice, a factor of the order of hundred is observed.
6.3 The harmonic components of the detector signal
With the double periodicity present on the disc, the detector signal can be writtenas a double Fourier series where the uniform scanning speeds0 transforms the peri-odic components in the tangential direction into time harmonic components with afundamental frequencyft = s0/p.Using Eq.(21), we formally obtain the temporal harmonic componentsAµ,k andBµ,k from detectorDk according to
A0,k(v) = P1,k(0, 0) (22)
+2∑κmax
κ=1
{
P1,k(0, κ) cos
(
2πκ
qv
)
+ P2,k(0, κ) sin
(
2πκ
qv
)}
Aµ,k(v) = 2
{
P1,k(µ, 0) cos
(
2πs
p
κ
qµ
)
+ P2,k(µ, 0) sin
(
2πs
p
κ
qµ
)}
+2∑κmax
κ=1
{[
{P1,k(µ, κ) +Q1,k(µ, κ)} cos
(
2πs
p
v
qµ
)
+{P2,k(µ, κ) +Q2,k(µ, κ)} sin
(
2πs
p
v
qµ
)]
cos
(
2πκ
qv
)
+
[
{P2,k(µ, κ) −Q2,k(µ, κ)} cos
(
2πs
p
v
qµ
)

38
−{P1,k(µ, κ) −Q1,k(µ, κ)} sin
(
2πs
p
v
qµ
)]
sin
(
2πκ
qv
)}
Bµ,k(v) = 2
{
−P2,k(µ, 0) cos
(
2πs
p
κ
qµ
)
+ P1,k(µ, 0) sin
(
2πs
p
κ
qµ
)}
+2∑κmax
κ=1
{[
{−P2,k(µ, κ) −Q2,k(µ, κ)} cos
(
2πs
p
v
qµ
)
+{P1,k(µ, κ) +Q1,k(µ, κ)} sin
(
2πs
p
v
qµ
)]
cos
(
2πκ
qv
)
+
[
{P1,k(µ, κ) −Q1,k(µ, κ)} cos
(
2πs
p
v
qµ
)
+{P2,k(µ, κ) −Q2,k(µ, κ)} sin
(
2πs
p
v
qµ
)]
sin
(
2πκ
qv
)}
,
where the harmonic coefficientsA andB, that depend on the off-track distancev ofthe scanning spot, generate the detector signal with the aidof the expression
SDk(t, v) = A0,k(v) +
µmax∑
µ=1
{Aµ,k(v) cos (µftt) +Bµ,k(v) sin (µftt)} , (23)
whereµmaxft is the maximum frequency transmitted by the optical read-out sys-tem.The calculation of the detector signalSDk
(t, v) requires the evaluation of the coef-ficientsPj,k(µ, κ) andQj,k(µ, κ), j = 1, 2, that can be written as
P1,k(µ, κ) = Re
{
∑
m
∑
n
ρµ+m,κ+nρ∗
m,nZk(µ+m, κ+ n;m, n)
}
P2,k(µ, κ) = Im
{
∑
m
∑
n
ρµ+m,κ+nρ∗
m,nZk(µ+m, κ+ n;m, n)
}
Q1,k(µ, κ) = Re
{
∑
m
∑
n
ρµ+m,nρ∗
m,κ+nZk(µ+m, n;m, κ+ n)
}
Q2,k(µ, κ) = Im
{
∑
m
∑
n
ρµ+m,nρ∗
m,κ+nZk(µ+m, n;m, κ+ n)
}
(24)
The factorZk(m, n;m′, n′) is the integral that was present in Eq.(21) and is written
Zk(m, n;m′, n′) =
∫ ∫
Dk
S(x, y) Fm,n(x, y) F ∗
m′,n′(x, y)dxdy . (25)
The efficient calculation of theZk-functions is the subject of the remainder of thischapter. Especially the numerical evaluation of the basic functionFm,n(x, y) canbe time consuming and we will show how a further analysis of this function canimprove the efficiency of the final evaluation.

39
6.4 The representation of the functionFm,n(x, y)
The functionFm,n(x, y) is the Fourier Transform of the product of the displacedobjective lens functionf(X
′ − m/p, Y′ − n/q) and the collecting lens function
g(X′
, Y′
) where the integration area is defined by the half diameterrO′ of thecollecting objective (rO′ is commonly normalised to unity). The standard way tocalculate the Fourier transform is using a numerical two-dimensional fast FourierTransform (FFT). In this paragraph we will show that the use of orthogonal func-tions in the diffracting exit pupil and in the image plane where the detectors aresituated can lead to an explicit expression for the detectorintensity. This expressionis then readily integrated over the detector area defined byDk.The function to be Fourier transformed generally is a complex function that isnonzero on a typical domain within the exit pupil ofO
′
like the hatched area inFig.(27). Orthogonal functions with uniform weighting on the circular exit pupilarea ofO
′
(pupil radius normalised to unity) are the well-known Zernike polyno-mials [31]. These polynomials are normally used to represent the argument of thecomplex pupil function, in particular the aberration or thefocus defect of an imagingoptical system. Here we propose to extend the use of the Zernike polynomials and torepresent the complete complex functionA(ρ, θ) exp[iΦ(ρ, θ)] in the exit pupil bya set of Zernike polynomials yielding complex expansion coefficientsakl accordingto
A(ρ, θ) exp[iΦ(ρ, θ)] =∑
k,l
αkl Rlk(ρ) cos lθ , (26)
where(ρ, θ) are the polar coordinates in the exit pupil,A(ρ, θ) the amplitude andΦ(ρ, θ) the phase of the pupil function.Rl
k(ρ) is the radial part of the Zernike poly-nomial with radial degreek and azimuthal degreel (k ≥ l ≥ 0, k − l even). Wehave limited ourselves to the cosine-polynomials, thus restricting the functions tothose that are symmetric with respect toθ = 0. The expansion of a general functionwould require an extra set of coefficientsbkl associated with the sine-polynomials.The expansion in Eq.(26) ofA exp(iΦ) can be obtained, for instance, by a leastsquares fit with a finite series of polynomials, a procedure which is common prac-tice for expandingΦ itself. It can be shown that, with the transition from cartesiancoordinates(x, y) to normalised polar coordinates(r, φ), the complex amplitudeUin the detector plane is given by
U(r, φ) = 2∑
k,l
akl il Vkl cos lφ , (27)
where
Vkl =
∫ 1
0
ρ exp(ifzρ2)Rl
k(ρ)Jl(2πρr)dρ (28)
for integersk, l ≥ 0 with k − l ≥ 0 and even (Jl denotes the Bessel function ofthe first kind of orderl). A quadratic phase factorexp(ifzρ
2) has been added that isneeded in the case of a defocusing of the image plane with respect to the optimum

40
(paraxial) focus.The Bessel series representation ofVkl is given in [32], [33] and reads
Vkl = exp(ifz)∞∑
s=1
(−2ifz)s−1
pz∑
j=0
vsj
Jl+s+2j(t)
sts(29)
with vsj given by
vsj = (−1)pz(l + s+ 2j)(
l + j + s− 1
s− 1
)(
j + s− 1
s− 1
)(
s− 1
pz − j
)/(
qz + s+ j
s
)
, (30)
for s = 1, 2, . . . ; j = 0, . . . , pz. In Eq.(29) we have set
t = 2πr , pz =k − l
2, qz =
k + l
2. (31)
For the numberS of terms to be included in the infinite series overs we have thefollowing rule. It can be shown that, whenS=25, the absolute truncation error is ofthe order 10−6 for all fz, t, k, l specified by
|fz| ≤ 2π, t ≤ 20, 0 ≤ pz ≤ qz ≤ 6 . (32)
In the absence of defocusing (fz = 0), the expansion of the complex pupil functionin terms of Zernike polynomials leads to the relationship
U(r, φ) = 2∑
k,l
akl il (−1)
k−l
2Jk+1(2πr)
2πrcos lφ . (33)
This analytic result for the in-focus amplitude can be obtained using formula (39),p. 772 in [31]
∫ 1
0
ρRlk(ρ)Jl(2πρr)dρ = (−1)
k−l
2Jk+1(2πr)
2πr. (34)
but it also follows as the limiting case forfz → 0 of Eqs.(28)-(29).
6.5 Orthogonality in pupil and image plane
Having seen the one-to-one relationship between the orthogonal Zernike polynomi-als in the pupil and the corresponding Bessel functions of the first kind in the imageplane (in-focus situation), we are left with the evaluationof the inner products of theBessel functions to check their orthogonality and establish a normalisation factor.We define the inner product of two functions from the series inEq.(33) as
Ik,l;k′,l′ = C
∫ 2π
0
∫
∞
0
UklUk′l′ rdrdφ
= 4C ik+k′
∫ 2π
0
∫
∞
0
Jk+1(2πr)Jk′+1(2πr)
4π2r2cos lφ cos l
′
φ rdrdφ
=C
πik+k
′
∫
∞
0
Jk+1(2πr)Jk′+1(2πr)
rdr δ(l, l
′
) , (35)

41
with δ(l, l′
) the Kronecker symbol (= 2 if l = l′
=0, = 1 if l = l′ 6=0 and equals0
if l 6= l′
). The common conditions for the indices of Zernike polynomials apply too(bothk − l andk
′ − l′
are even).For the calculation of the definite integral overr we use the special result for theintegral of the product of two Bessel functions in paragraph11.4.6 of [34]
∫
∞
0
t−1Jν+2n+1(t)Jν+2m+1(t)dt = 0 (m 6= n)
=1
2(2n+ ν + 1)(m = n) , (36)
with the restrictionν + n+m > −1.Applied to Eq.(35) withν + 2n = k, ν + 2m = k
′
andt = 2πr, we find the result
Ik,l;k′,l′ = C
π(k = k
′
= l = l′
= 0)
= (−1)k
2(k+1) (k = k′ 6= 0; l = l
′ 6= 0) (37)
For normalisation purposes, we multiply the basic functions with√π so that the
value ofI00;00 equals unity.
The evaluation of the functionZk(m, n; m′, n′)The quantityZk(m, n;m′, n′) was the key quantity to be calculated for the evalu-
ation of the harmonic signal components (see Eq.(25)).Using the orthogonal expansion for the functionsFm,n(x, y) in the exit pupil of theobjectiveO
′
according to Eq.(33) we obtain
Zj(m, n;m′, n′) =∑
kl
∑
k′l′
akla′∗
k′l′ il−l
′
(−1)k+k
′
−l−l′
2
∫ ∫
Dj
Sr(r, φ)Jk+1(2πr)Jk
′+1(2πr)
4π2r2cos lφ cos l
′
φ rdrdφ . (38)
where the asterisk denotes the complex conjugate function and the detector sensi-tivity functionSr has been written in polar coordinates.In the general situation with an arbitrary detector sensitivity function, the integralsabove have to be evaluated numerically. In the whole analytic process describeduntil now, the calculation of the coefficientsakl of the Zernike expansion of thecomplex function in the exit pupil ofO
′
is the crucial step with respect to speed andconvergence and this aspect is actively researched at this moment.
7 Conclusion
In this chapter, we have described some important aspects ofthe optical disc sys-tems that are actually widely used, the CD- and the DVD-system. The subject ofoptical storage being vast, we have treated some restrictedtopics that are of interest

42
for the understanding of the CD- and DVD-system themselves and the exchangeof media between these two standardized platforms of optical recording. A detailedanalysis has been given of the signal detection in an opticaldisc system. This isof particular interest when simulations are used as a predictive tool, in parallel toexperimental research. The efficiency of the calculations is greatly enhanced whenthe data belonging to the information structure on the disc are separated from theimaging process in the optical recording unit; a procedure to achieve this separationhas been described in this chapter and an important reduction in calculation timeis obtained. We have also indicated that, by using Zernike polynomials to representcomplex amplitude functions, the analytic calculation process can be pursued fur-ther and the speed in evaluating the detector signal is againimproved.Because of space limitations, we have not discussed recent developments in opticalstorage like the blue laser DVR-system and still other research activities like near-field optical recording that aim at super high-density discs. With respect to thesenew developments, the analyses given in this chapter have tobe adapted to the vec-torial diffraction aspects of high-aperture image formation.
References
[1] G. Bouwhuis and J. Braat: ”Recording and reading of information on optical disks” inApplied Optics and Optical Engineering, Vol. 9, ed. by R.R. Shannon and J.C. Wyant(Academic, New York 1983)
[2] G. Bouwhuis, J. Braat, A. Huijser, J. Pasman, G. van Rosmalen and K. SchouhamerImmink: Principles of optical disc systems (Adam Hilger, Bristol 1984)
[3] J. Isailovic: Videodisc and optical memory systems (Prentice Hall, Englewood Cliffs1985)
[4] A. Marchant:Optical recording; a technical overview (Addison Wesley 1990)[5] Selected Papers on Optical Storage, in SPIE Milestone Series, Vol. MS 49, ed. G. Sin-
cerbox and J. Zavislan (SPIE Optical Engineering Press, Bellingham 1992)[6] K. Schwartz:The physics of optical recording (Springer, Berlin 1993)[7] M. Mansuripur:The physical principles of magneto optical data recording (Cambridge
University Press, Cambridge 1995)[8] E.W. Williams: Textbooks in electrical and electronic engineering Vol 2, The CD-ROM
and optical recording systems (Oxford Univ. Press 1996)[9] S. Stan:The CD-ROM drive, a brief system description (Kluwer Academic Publishers,
Dordrecht 1998)[10] M. Minsky: Microscopy Apparatus U.S. Patent 3,013,467 (1961)[11] Ph. Rice et al.: J. Soc. Motion Pict. Telev. Eng.79, 997 (1970)[12] K. Compaan, P. Kramer: Philips Tech. Rev.33, 178 (1973)[13] G. Broussaud, E. Spitz, C. Tinet and F. LeCarvenec: IEEETrans. Broadcast Telev. Re-
ceiversBTR-20, 332 (1974)[14] G.W. Hrbek: J. Soc. Motion Pict. Telev. Eng.83, 580 (1974)[15] J. Braat: Appl. Opt.22, 2196 (1983)

43
[16] J. Haisma, E. Hugues and C. Babolat: Opt. Lett.4(2), 70 (1979)[17] M. Terao, T. Nishida, Y. Miyauchi, S. Horigome, T. Kaku and N. Ohta: Proc. Soc.
Photo-Opt. Instrum. Eng.695, 105 (1986)[18] T. Ohta, K. Inoue et al.: Jpn. J. Appl. Phys.28 (Suppl. 28-3), 123 (1989)[19] W.T. Welford: Journal of Microscopy96, 105 (1972)[20] T. Wilson, C.J.R. Sheppard:Theory and practice of the scanning optical microscope
(Cambridge Univ. Press, Cambridge 1984)[21] C. Bricot, J. Lehureau, C. Puech and F. Le Carvennec: IEEE Trans. Consum. Electron.
CE-22, 304 (1976)[22] M. Mansuripur and C. Pons: Proc. Soc. Photo-Opt. Instrum. Eng.899, 56 (1988)[23] G. Bouwhuis and P. Burgstede: Philips Tech. Rev.33, 186 (1973)[24] J. Braat, G. Bouwhuis: Appl. Opt.17, 2013 (1978)[25] J. Heemskerk, K. Schouhamer Immink: Philips Tech. Rev.40, 157 (1982)[26] N. Arai,H.Yamazaki, S. Saito: U.S. Patent 6,243,349 B1[27] Y. Komma, K. Kasazumi, S. Nishino and S. Mizumo: Proc. Soc. Photo-Opt. Instrum.
Eng.2338282-288 (1994)[28] B.H.W. Hendriks, J.E. de Vries and H.P. Urbach: Appl. Opt. 40, 6548 (2001)[29] H.H. Hopkins: J. Opt. Soc. Am69, 4 (1979)[30] W.T. Welford:The aberrations of optical systems (Adam Hilger, Bristol 1986)[31] M. Born, E. Wolf:Principles of Optics (Pergamon Press, Oxford 1970)[32] A.J.E.M. Janssen: J. Opt. Soc. Am. A19, May issue (2002)[33] J. Braat, P. Dirksen, A.J.E.M. Janssen: J. Opt. Soc. Am.A 19, May issue (2002)[34] M. Abramowitz, I. Stegun:Handbook of Mathematical Functions (9th printing, Dover,
New York 1970)