![Student Session Topic: Average and Instantaneous Rates of Change · 2015. 2. 27. · Average rate of change o The average rate of change of fx() on [a, b] is the slope of the line](https://static.fdocuments.net/doc/165x107/60e8fe0b04d1937f286ead96/student-session-topic-average-and-instantaneous-rates-of-change-2015-2-27.jpg)
Differentiation Purpose- to determine instantaneous rate of change Eg: instantaneous rate of change...
39
Differentiation • Purpose- to determine instantaneous rate of change Eg: instantaneous rate of change in total cost per unit of the good We will learn • Marginal Demand, Marginal Revenue, Marginal Cost, and Marginal Profit
-
date post
21-Dec-2015 -
Category
Documents
-
view
213 -
download
0
Transcript of Differentiation Purpose- to determine instantaneous rate of change Eg: instantaneous rate of change...

Differentiation
• Purpose- to determine instantaneous rate of change
Eg: instantaneous rate of change in total cost per unit of the good
We will learn• Marginal Demand, Marginal Revenue, Marginal
Cost, and Marginal Profit

Marginal Cost : MC(q)
• What is Marginal cost?
The cost per unit at a given level of production
EX:
Recall Dinner problem
C(q) = C0 + VC(q). = 9000+177*q0.633
MC(q)- the marginal cost at q dinners
MC(100)- gives us the marginal cost at 100 dinners
This means the cost per unit at 100 dinners
How to find MC(q) ? We will learn 3 plans

Marginal Analysis
• First Plan
• Cost of one more unit
•
qCqCqMC 1

Marginal Analysis
• Ex. Suppose the cost for producing a particular item is given by where q is quantity in whole units. Approximate MC(500).
•
607.01278000 qqC
unitper 70.6$
77255.1352147335.13528
50012780005011278000
500501500607.0607.0
CCMC

Marginal Analysis
• Second Plan
• Average cost of one more and one less unit
•
2
11
qCqCqMC
2
11 from derived
qCqCqCqC

Marginal Analysis
• Ex. Suppose the cost for producing a particular item is given by where q is quantity in whole units. Approximate MC(500).
•
607.01278000 qqC
unitper 70.6$2
06648.1351547335.135282
49912780005011278000
2
499501500
607.0607.0
CCMC

Marginal Analysis
• Final Plan
• Average cost of fractionally more and fractionally less units
difference quotients
•
• Typically use with h = 0.001
2lim
0 h
hqChqCqMC
h
2h
hqChqCqMC

Marginal Analysis
• Ex. Suppose the cost for producing a particular item is given by where q is quantity in whole units. Approximate MC(500).
•
607.01278000 qqC
unitper 71.6$002.0
76585.1352177926.13521002.0
999.4991278000001.5001278000
001.02
999.499001.500500
607.0607.0
CC
MC
In terms of money, the marginal cost at the production level of 500, $6.71 per unit

Marginal Analysis
• Use “Final Plan” to determine answers
• All marginal functions defined similarly
•
h
hqPhqPqMP
h
hqChqCqMC
h
hqRhqRqMR
h
h
h
2lim
2lim
2lim
0
0
0
Marginal Analysis
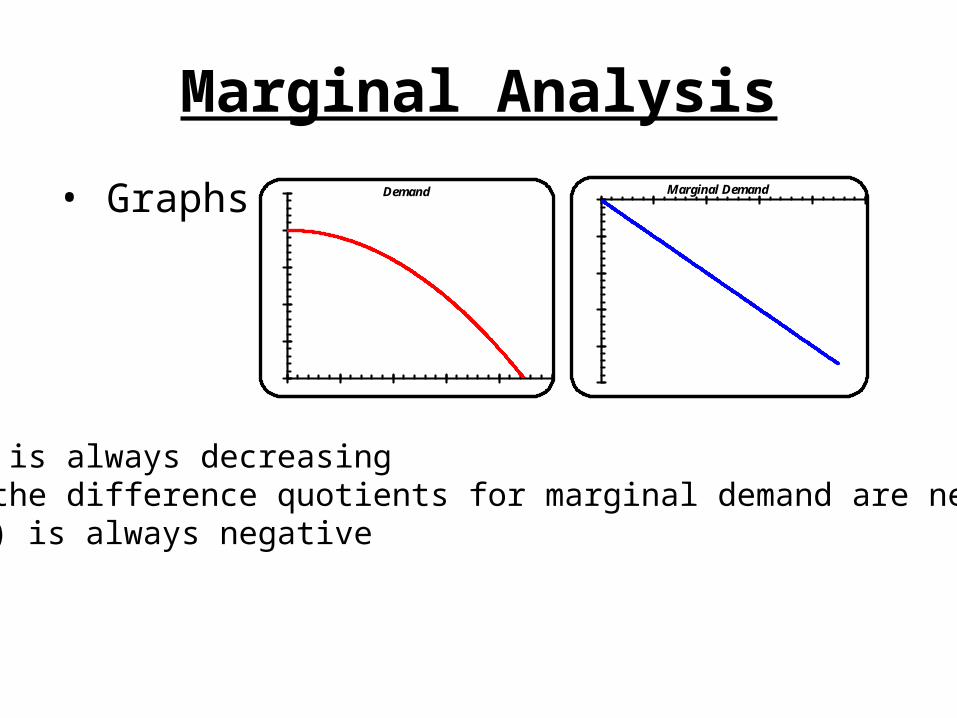
• Graphs
29303132333435
Demand Marginal Demand
D(q) is always decreasingAll the difference quotients for marginal demand are negativeMD(q) is always negative

Marginal Analysis
• Graphs
29303132333435
Revenue Marginal Revenue
R(q) is increasing • difference quotients for marginal revenue are positive•MR(q) is positive
R(q) is decreasing• difference quotients for marginal revenue are negative•MR(q) is negative
Maximum revenue
Marginal revenue 0
q1
q1

Marginal Analysis
• Graphs
29303132333435
Profit Marginal Profit
29303132333435
Cost Marginal Cost

Derivatives-part 2
• Difference quotients
•
• Called the derivative of f(x)
h
hxfhxfxfm
h 2lim
0

Derivatives
• Ex1. Evaluate if
62 xxf
5452.5002.0
0110903561.0002.0
99445674.130055471.14001.02
62623
999.2001.3
f
3f

Derivatives
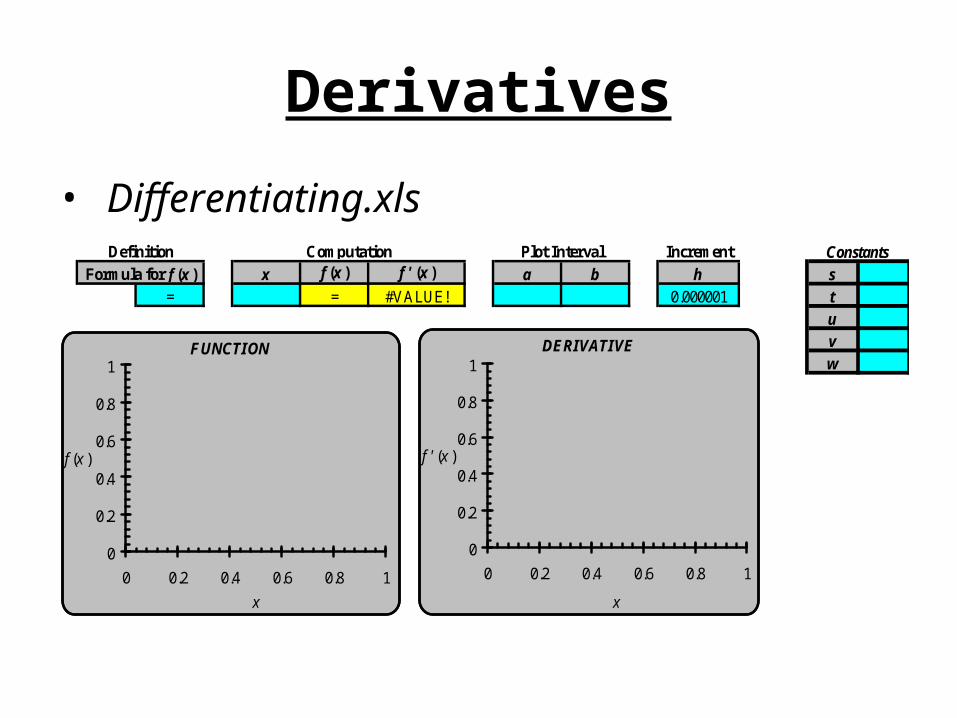
• Differentiating.xls file
• Graphs both function and derivative
• Can evaluate function and derivative
Derivatives
• Differentiating.xlsIncrement
x f (x ) f ' (x ) a b h s
= = #VALUE! 0.000001 t
u
v
w
29303132333435
ConstantsDefinition Plot Interval
Formula for f (x )
Computation
FUNCTION
0
0.2
0.4
0.6
0.8
1
0 0.2 0.4 0.6 0.8 1
x
f (x )
DERIVATIVE
0
0.2
0.4
0.6
0.8
1
0 0.2 0.4 0.6 0.8 1
x
f ' (x )
Derivatives
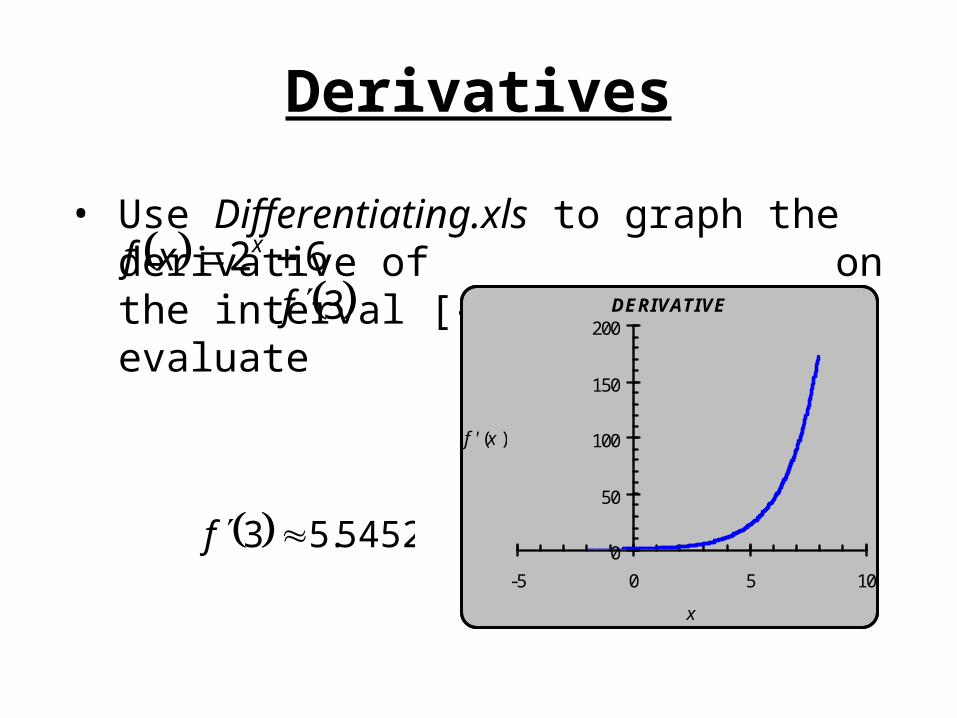
• Use Differentiating.xls to graph the derivative of on the interval [-2, 8]. Then
evaluate . 62 xxf
3f DERIVATIVE
0
50
100
150
200
-5 0 5 10
x
f ' (x )
5452.53 f

62 xxf

Differentiating.xslm
Incrementx f (x ) f ' (x ) a b h
7 3 14 5.545 -2 8 0.000001
Definition Plot IntervalFormula for f (x )
Computation
Key points1)Formula for the function in x2)Plot Interval is ESSENTIAL3)You can use the computation cells to evaluate the f(x) & f’(x) at different values4)If using Office 2007, save it as a macro enabled file
Derivatives
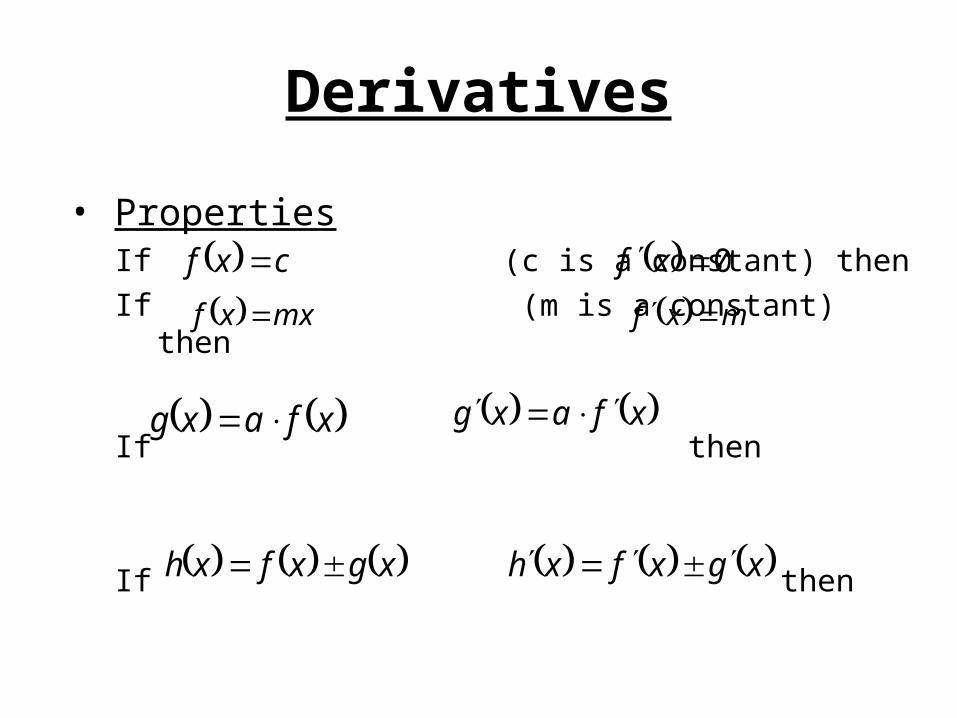
• PropertiesIf (c is a constant) then
If (m is a constant) then
If then
If then
xfaxg xfaxg
xgxfxh xgxfxh
cxf 0 xf
mxxf mxf

Derivatives
• Tangent line approximations
• Useful for easy approximations to complicated functions
• Need a point and a slope (a derivative)
• Use y = mx +b

Derivatives
• Ex. Determine the equation of the tangent line to at x = 3.
• Recall and we have the point (3, 14)
• Tangent line is y = 5.5452x – 2.6356
62 xxf
5452.53 f

Derivatives
• Project (Marginal Revenue)
- Typically
- In project,
- units are
qRqMR
qRqMR 1000
h
hqRhqRqR
2
units thousand
dollarsmillion

24
Recall:Revenue function-R(q)
• Revenue in million dollars R(q)
• Why do this conversion?Marginal Revenue in dollars per drive
qRqMRtypically
qR
qRqMR
10001000
1000000

Derivatives
• Project (Marginal Cost)
- Typically
- In project,
- units are
qCqMC
qCqMC 1000
h
hqChqCqC
2
units thousand
dollarsmillion

Derivatives
• Project (Marginal Cost)
- Marginal Cost is given in original data
- Cost per unit at different production levels
- Use IF function in Excel

Derivatives
• Project (Marginal Profit)
MP(q) = MR(q) – MC(q)
- If MP(q) > 0, profit is increasing
- If MR(q) > MC(q), profit is increasing
- If MP(q) < 0, profit is decreasing
- If MR(q) < MC(q), profit is decreasing

Derivatives
• Project (Marginal Cost)- Calculate MC(q)
Nested If function, the if function using values for Q1-4 & 6- IF(q<=800,160,IF(q<=1200,128,72))
In the GOLDEN sheet need to use cell referencing for IF function because we will make copies of it, and do other project questions
=IF(B30<$E$20,$D$20,IF(B30<$E$22,$D$21,$D$22))

Recall -Production cost estimates
• Fixed overhead cost - $ 135,000,000
• Variable cost (Used for the MC(q) function)
1) First 800,000 - $ 160 per drive
2) Next 400,000- $ 128 per drive
3) All drives after the first 1,200,000-
$ 72 per drive

Derivatives
• Project (Maximum Profit)
- Maximum profit occurs when MP(q) = 0
- Max profit occurs when MR(q) = MC(q)
- Estimate quantity from graph of Profit
- Estimate quantity from graph of Marginal Profit

Derivatives-change
• Project (Answering Questions 1-3)
1. What price? $285.88
2. What quantity? 1262(K’s) units
3. What profit? $42.17 million

Derivatives
• Project (What to do)
- Create one graph showing MR and MC
- Create one graph showing MP
- Prepare computational cells answering your team’s questions 1- 3
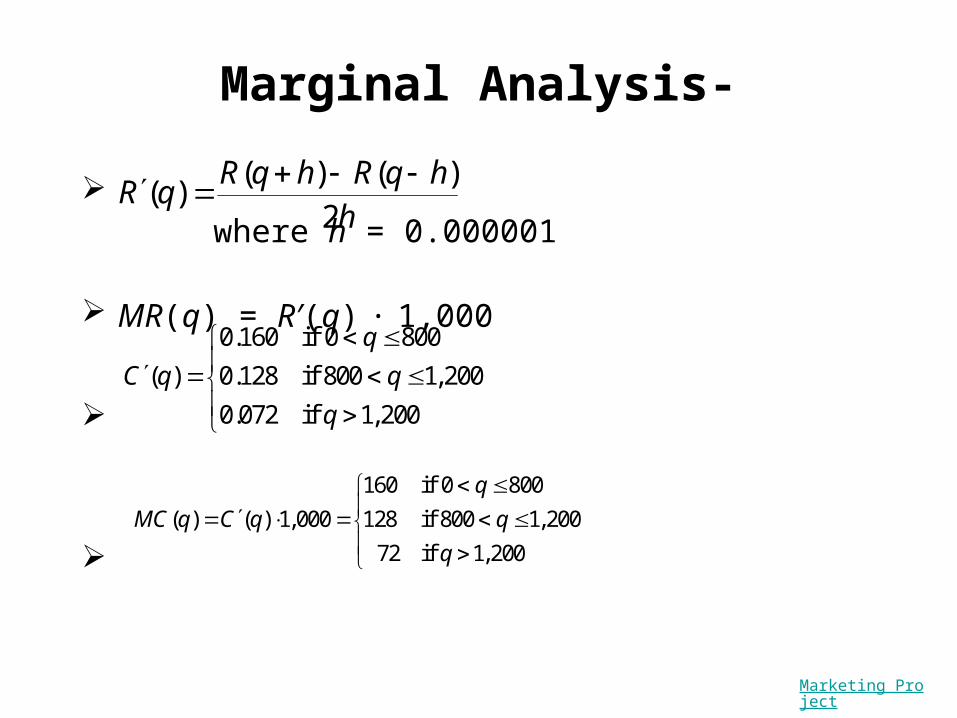
Marginal Analysis-
where h = 0.000001
MR(q) = R′(q) ∙ 1,000
hhqRhqR
qR2
)()()(
0.160 if 0 800
( ) 0.128 if 800 1,200
0.072 if 1,200
q
C q q
q
160 if 0 800
( ) ( ) 1,000 128 if 800 1,200
72 if 1, 200
q
MC q C q q
q
Marketing Project
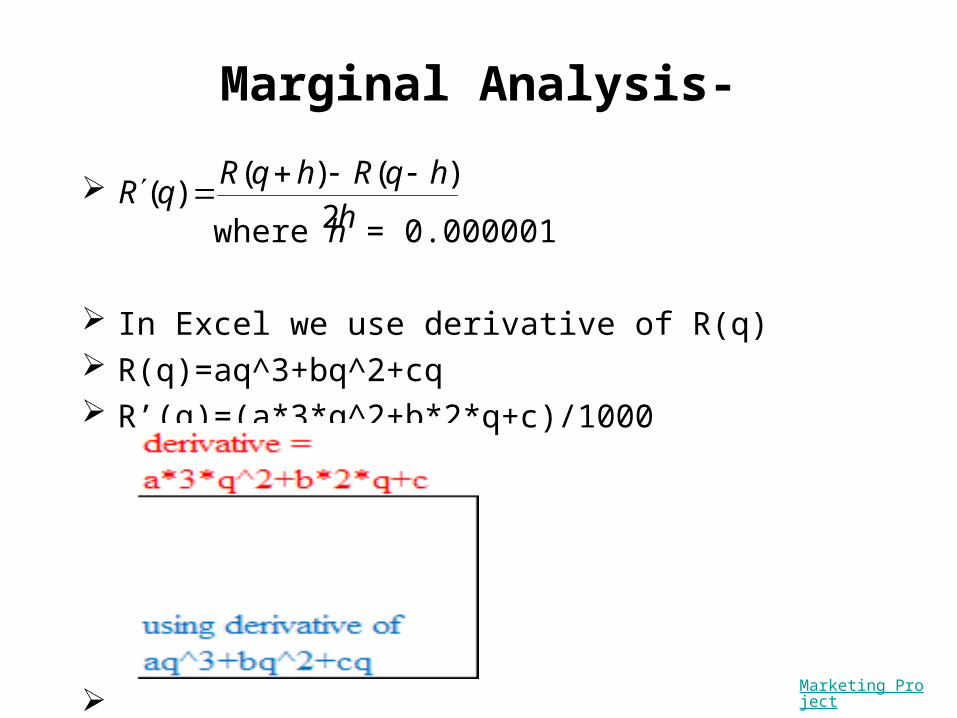
Marginal Analysis-
where h = 0.000001
In Excel we use derivative of R(q) R(q)=aq^3+bq^2+cq R’(q)=(a*3*q^2+b*2*q+c)/1000
hhqRhqR
qR2
)()()(
Marketing Project

Marginal Analysis (continued)-
Marketing Project
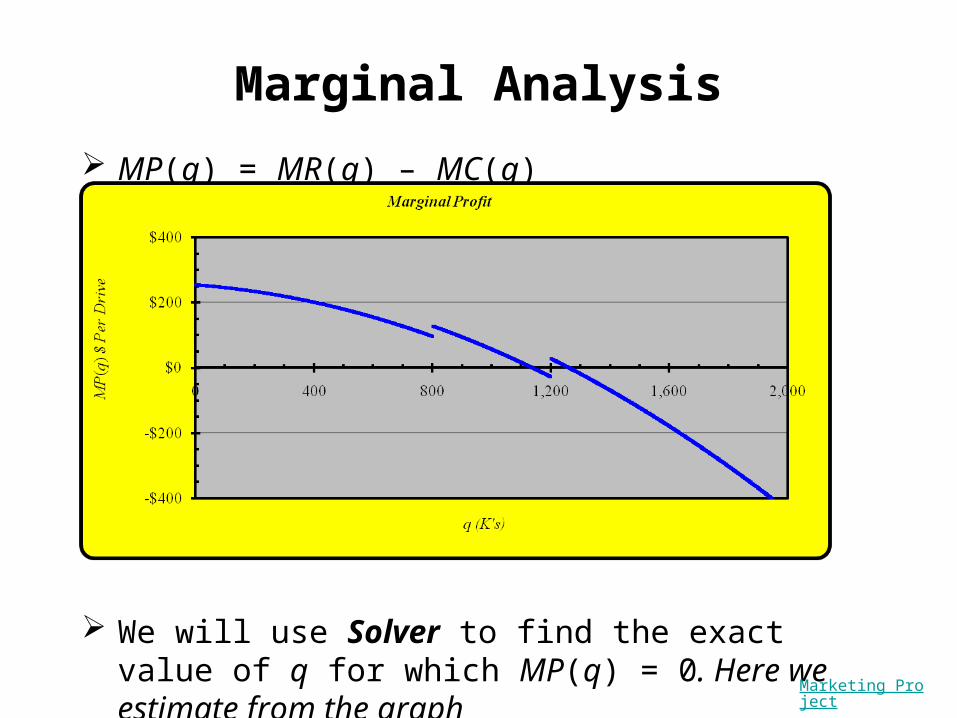
Marginal Analysis
MP(q) = MR(q) – MC(q)
We will use Solver to find the exact value of q for which MP(q) = 0. Here we estimate from the graph
Marketing Project

Profit Function
The profit function, P(q), gives the relationship between the profit and quantity produced and sold.
P(q) = R(q) – C(q)
Profit Function
-$20-$10
$0$10$20$30$40$50$60$70
0 400 800 1,200 1,600 2,000
q (K's)
P(q
) (M
's)
38
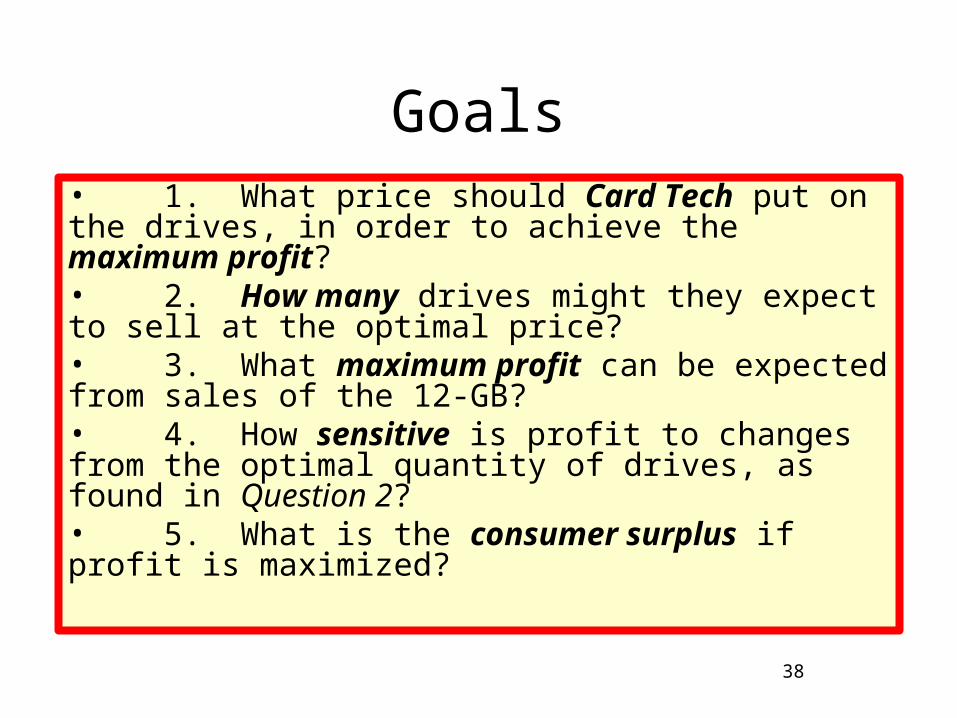
Goals• 1. What price should Card Tech put on the drives, in order to achieve the maximum profit?• 2. How many drives might they expect to sell at the optimal price?• 3. What maximum profit can be expected from sales of the 12-GB?• 4. How sensitive is profit to changes from the optimal quantity of drives, as found in Question 2?• 5. What is the consumer surplus if profit is maximized?

39
Goals-Contd.• 6. What profit could Card Tech expect, if they price the drives at $299.99?• 7. How much should Card Tech pay for an advertising campaign that would increase demand for the 12-GB drives by 10% at all price levels?• 8. How would the 10% increase in demand effect the optimal price of the drives?• 9. Would it be wise for Card Tech to put $15,000,000 into training and streamlining which would reduce the variable production costs by 7% for the coming year?