Differentiating malignant and benign necrotic lung lesions ...
9
Li et al. BMC Med Imaging (2021) 21:81 https://doi.org/10.1186/s12880-021-00611-6 RESEARCH Differentiating malignant and benign necrotic lung lesions using kVp-switching dual-energy spectral computed tomography Qi Li 1† , Xiao Fan 2† , Tian‑You Luo 1 , Fa‑Jin Lv 1 and Xing‑Tao Huang 3* Abstract Background: Necrotic pulmonary lesions manifest as relatively low‑density internally on contrast‑enhanced com‑ puted tomography (CT). However, using CT to differentiate malignant and benign necrotic pulmonary lesions is challenging, as these lesions have similar peripheral enhancement. With the introduction of dual‑energy spectral CT (DESCT), more quantitative parameters can be obtained and the ability to differentiate material compositions has been highly promoted. This study investigated the use of kVp‑switching DESCT in differentiating malignant from benign necrotic lung lesions. Methods: From October 2016 to February 2019, 40 patients with necrotic lung cancer (NLC) and 31 with necrotic pulmonary mass‑like inflammatory lesion (NPMIL) were enrolled and underwent DESCT. The clinical characteristics of patients, CT morphological features, and DESCT quantitative parameters of lesions were compared between the two groups. Binary logistic regression analysis was performed to identify the independent prognostic factors differentiat‑ ing NPMIL from NLC. Receiver operating characteristic (ROC) curves were used to assess the diagnostic performance of single‑parameter and multiparametric analyses. Results: Significant differences in age, C‑reactive protein concentration, the slope of the spectral curve from 40 to 65 keV (K 40–65 keV ) of necrosis in non‑contrast‑enhanced scanning (NCS), arterial phase (AP) and venous phase (VP), effective atomic number of necrosis in NCS, and iodine concentration (IC) of the solid component in VP were observed between groups (all p < 0.05). The aforementioned parameters had area under the ROC curve (AUC) values of 0.747, 0.691, 0.841, 0.641, 0.660, 0.828, and 0.754, respectively, for distinguishing between NLC and NPMIL. Mul‑ tiparametric analysis showed that age, K 40–65 keV of necrosis in NCS, and IC of the solid component in VP were the most effective factors for differentiating NLC from NPMIL, with an AUC of 0.966 and percentage of correct class of 88.7%. Conclusions: DESCT can differentiate malignant from benign necrotic lung lesions with a relatively high accuracy. Keywords: Lung neoplasms, Inflammation, Necrosis, Dual‑energy computed tomography, Quantitative imaging © The Author(s) 2021. Open Access This article is licensed under a Creative Commons Attribution 4.0 International License, which permits use, sharing, adaptation, distribution and reproduction in any medium or format, as long as you give appropriate credit to the original author(s) and the source, provide a link to the Creative Commons licence, and indicate if changes were made. The images or other third party material in this article are included in the article’s Creative Commons licence, unless indicated otherwise in a credit line to the material. If material is not included in the article’s Creative Commons licence and your intended use is not permitted by statutory regulation or exceeds the permitted use, you will need to obtain permission directly from the copyright holder. To view a copy of this licence, visit http://creativecommons.org/licenses/by/4.0/. The Creative Commons Public Domain Dedication waiver (http://creativeco mmons.org/publicdomain/zero/1.0/) applies to the data made available in this article, unless otherwise stated in a credit line to the data. Background Necrotic pulmonary lesions manifest as relatively low- density internally on contrast-enhanced computed tomography (CT) [1, 2]. However, the use of conven- tional CT to differentiate malignant from benign necrotic pulmonary lesions is challenging as these lesions have similar peripheral enhancements. Clinically, the absence of hyperthermia and/or infectious symptoms in necrotic Open Access *Correspondence: [email protected] † Qi Li and Xiao Fan contributed equally to this work and share the first authorship. 3 Department of Radiology, University of Chinese Academy of Sciences Chongqing Renji Hospital (Fifth People’s Hospital of Chongqing), No. 24 Renji Road, Nan’an District, Chongqing, China Full list of author information is available at the end of the article
Transcript of Differentiating malignant and benign necrotic lung lesions ...

Li et al. BMC Med Imaging (2021) 21:81 https://doi.org/10.1186/s12880-021-00611-6
RESEARCH
Differentiating malignant and benign necrotic lung lesions using kVp-switching dual-energy spectral computed tomographyQi Li1†, Xiao Fan2†, Tian‑You Luo1, Fa‑Jin Lv1 and Xing‑Tao Huang3*
Abstract
Background: Necrotic pulmonary lesions manifest as relatively low‑density internally on contrast‑enhanced com‑puted tomography (CT). However, using CT to differentiate malignant and benign necrotic pulmonary lesions is challenging, as these lesions have similar peripheral enhancement. With the introduction of dual‑energy spectral CT (DESCT), more quantitative parameters can be obtained and the ability to differentiate material compositions has been highly promoted. This study investigated the use of kVp‑switching DESCT in differentiating malignant from benign necrotic lung lesions.
Methods: From October 2016 to February 2019, 40 patients with necrotic lung cancer (NLC) and 31 with necrotic pulmonary mass‑like inflammatory lesion (NPMIL) were enrolled and underwent DESCT. The clinical characteristics of patients, CT morphological features, and DESCT quantitative parameters of lesions were compared between the two groups. Binary logistic regression analysis was performed to identify the independent prognostic factors differentiat‑ing NPMIL from NLC. Receiver operating characteristic (ROC) curves were used to assess the diagnostic performance of single‑parameter and multiparametric analyses.
Results: Significant differences in age, C‑reactive protein concentration, the slope of the spectral curve from 40 to 65 keV (K40–65 keV) of necrosis in non‑contrast‑enhanced scanning (NCS), arterial phase (AP) and venous phase (VP), effective atomic number of necrosis in NCS, and iodine concentration (IC) of the solid component in VP were observed between groups (all p < 0.05). The aforementioned parameters had area under the ROC curve (AUC) values of 0.747, 0.691, 0.841, 0.641, 0.660, 0.828, and 0.754, respectively, for distinguishing between NLC and NPMIL. Mul‑tiparametric analysis showed that age, K40–65 keV of necrosis in NCS, and IC of the solid component in VP were the most effective factors for differentiating NLC from NPMIL, with an AUC of 0.966 and percentage of correct class of 88.7%.
Conclusions: DESCT can differentiate malignant from benign necrotic lung lesions with a relatively high accuracy.
Keywords: Lung neoplasms, Inflammation, Necrosis, Dual‑energy computed tomography, Quantitative imaging
© The Author(s) 2021. Open Access This article is licensed under a Creative Commons Attribution 4.0 International License, which permits use, sharing, adaptation, distribution and reproduction in any medium or format, as long as you give appropriate credit to the original author(s) and the source, provide a link to the Creative Commons licence, and indicate if changes were made. The images or other third party material in this article are included in the article’s Creative Commons licence, unless indicated otherwise in a credit line to the material. If material is not included in the article’s Creative Commons licence and your intended use is not permitted by statutory regulation or exceeds the permitted use, you will need to obtain permission directly from the copyright holder. To view a copy of this licence, visit http:// creat iveco mmons. org/ licen ses/ by/4. 0/. The Creative Commons Public Domain Dedication waiver (http:// creat iveco mmons. org/ publi cdoma in/ zero/1. 0/) applies to the data made available in this article, unless otherwise stated in a credit line to the data.
BackgroundNecrotic pulmonary lesions manifest as relatively low-density internally on contrast-enhanced computed tomography (CT) [1, 2]. However, the use of conven-tional CT to differentiate malignant from benign necrotic pulmonary lesions is challenging as these lesions have similar peripheral enhancements. Clinically, the absence of hyperthermia and/or infectious symptoms in necrotic
Open Access
*Correspondence: [email protected]†Qi Li and Xiao Fan contributed equally to this work and share the first authorship.3 Department of Radiology, University of Chinese Academy of Sciences Chongqing Renji Hospital (Fifth People’s Hospital of Chongqing), No. 24 Renji Road, Nan’an District, Chongqing, ChinaFull list of author information is available at the end of the article

Page 2 of 9Li et al. BMC Med Imaging (2021) 21:81
pulmonary mass-like inflammatory lesion (NPMIL) may usually lead to a misdiagnosis. The procedures used to treat NPMIL and necrotic lung cancer (NLC) differ substantially. Necrosis evaluation is inarguably part of necrotic lung mass assessment through which quanti-tative information of the necrotic area can be obtained. Conventional CT has been widely known to provide val-uable morphological information regarding pulmonary lesions [1, 3], but it is unable to supply sufficient quan-titative parameters concerning necrosis, except for con-ventional CT attenuation values, which are not always helpful in determining whether necrotic lung masses are benign or malignant. Therefore, additional tests such as percutaneous lung biopsy and empirical anti-infective therapy are often required.
A novel kVp-switching dual-energy spectral CT (DESCT) imaging mode functioning in a single rota-tion by completing instantaneous switching between low (80 kVp) and high (140 kVp) voltages to collect data was introduced in 2008 [4]. DESCT can produce vir-tual monochromatic spectral images at different energy levels, spectral curves, effective atomic numbers, and material decomposition images, thereby improving its ability to differentiate the material compositions [5–12]. Some studies have indicated that benign and malignant necrotic lesions present distinct histological components [13–16]. Therefore, we believe that NPMIL and NLC might be better characterized using DESCT.
To our knowledge, the characteristics of NPMIL and NLC on DESCT images have not yet been established. This study investigates the use of kVp-switching DESCT in the differential diagnosis between benign and malig-nant necrotic lung lesions.
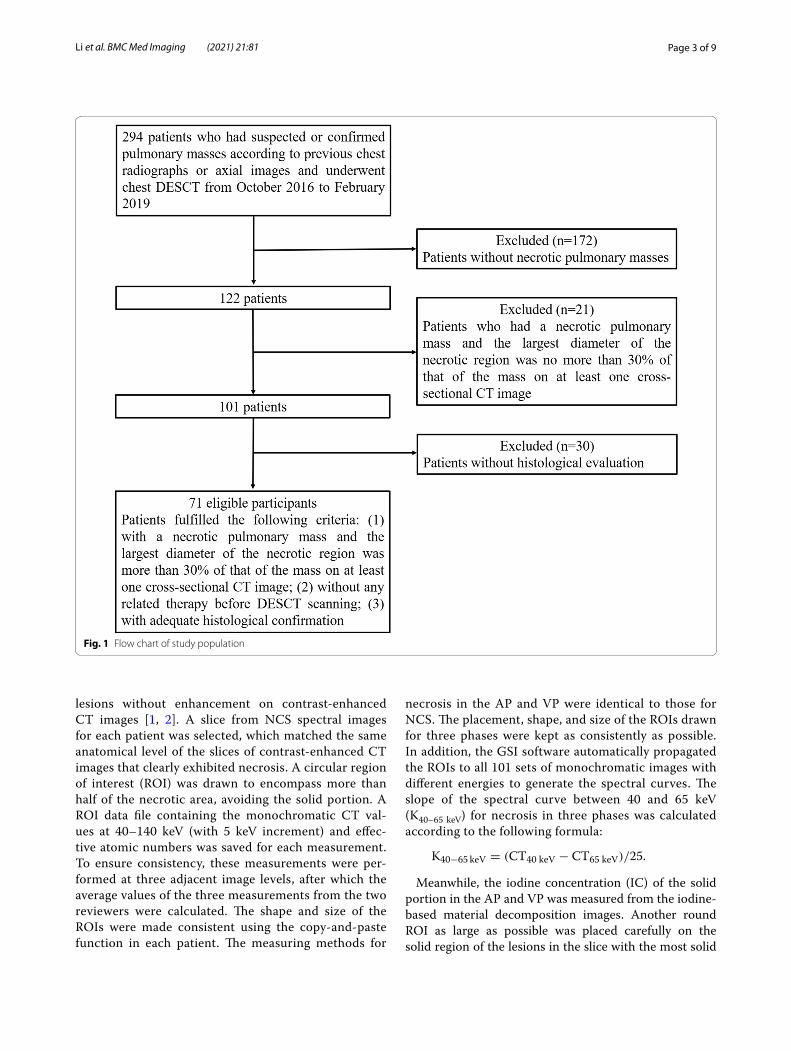
Materials and methodsPatientsThe ethics committee of the First Affiliated Hospital of Chongqing Medical University approved this prospec-tive study, and all patients signed an informed consent for participating in the research at the time of admis-sion. All methods were carried out in accordance with relevant guidelines and regulations. From October 2016 to February 2019, 294 consecutive patients with sus-pected or confirmed pulmonary masses according to previous chest radiographs or axial images underwent chest DESCT. Subsequently, 223 patients (75.85%) were excluded from the study as 172 patients did not have necrotic lung masses, 21 patients had a necrotic pulmo-nary mass and the largest diameter of the necrotic region was no more than 30% of that of the mass on at least one cross-sectional CT image, and 30 patients lacked his-tological evaluation. Finally, the remaining 71 patients (24.15%) participated in this study. These patients
fulfilled the following inclusion criteria: (1) patients who had a necrotic pulmonary mass and the largest diam-eter of the necrotic region was more than 30% of that of the mass on at least one cross-sectional CT image, (2) patients without any related therapy before DESCT scan-ning, and (3) patients with adequate histological confir-mation (obtained through surgical resection, CT-guided percutaneous biopsy, or transbronchoscopic biopsy). The flow chart of study population is shown in Fig. 1. Patients were divided into the following two groups for analysis: Group I consisted of 40 patients with NLC (40 lesions, 12 adenocarcinomas, and 28 squamous cell carcinomas), and Group II consisted of 31 patients (31 lesions, 20 lung abscesses, and 11 tuberculosis). Patients’ clinical charac-teristics, including age, sex, smoking history, respiratory symptoms, and laboratory results, were recorded.
CT protocolsAll patients were examined using a Discovery CT750HD scanner (GE Healthcare, Milwaukee, WI, USA). Each patient underwent non-contrast-enhanced scanning (NCS) and two-phase contrast-enhanced scanning using the gemstone spectral imaging (GSI) mode. The scanning range of NCS included the whole chest from the first ribs to the diaphragm. Parameters included a detector cov-erage of 64 × 0.625 mm, tube voltage of 80 kV/140 kV (instantaneous switching), tube current of 260 mA, pitch of 1.375, and CT dose index volume of 10.30 mGy. The patients were then injected with 80–110 mL (1.50 mL/kg of body weight) of nonionic iodinated contrast material (iohexol, 300 mg iodine/mL; Omnipaque, GE Healthcare, Milwaukee, WI, USA) at a rate of 3 mL/s during the arte-rial phase (AP) and venous phase (VP), which had scan delays of 30 and 60 s, respectively, after contrast medium injection. The scanning range for the AP included the entire chest, whereas that for the VP encompassed only the lesion. The acquisition parameters for the AP and VP were identical to those for NCS [17, 18].
Imaging analysisAll NCS and two-phase contrast-enhanced scan-ning images were reconstructed using a slice thick-ness and interval of 0.625 and 0.625 mm, respectively, for imaging analysis. Two radiologists with > 10 years of experience in chest imaging blinded to patient data interpreted the images and measured the quantitative parameters using the GSI Viewer (GE Healthcare, Mil-waukee, WI, USA) together on a workstation (AW4.6; GE Healthcare, Milwaukee, WI, USA). They had several disagreements on six patients when analyzing the CT morphological features of lesions, which were resolved by discussion to reach a consensus. Necrosis was defined as a relatively low-density area within the lung
Page 3 of 9Li et al. BMC Med Imaging (2021) 21:81
lesions without enhancement on contrast-enhanced CT images [1, 2]. A slice from NCS spectral images for each patient was selected, which matched the same anatomical level of the slices of contrast-enhanced CT images that clearly exhibited necrosis. A circular region of interest (ROI) was drawn to encompass more than half of the necrotic area, avoiding the solid portion. A ROI data file containing the monochromatic CT val-ues at 40–140 keV (with 5 keV increment) and effec-tive atomic numbers was saved for each measurement. To ensure consistency, these measurements were per-formed at three adjacent image levels, after which the average values of the three measurements from the two reviewers were calculated. The shape and size of the ROIs were made consistent using the copy-and-paste function in each patient. The measuring methods for
necrosis in the AP and VP were identical to those for NCS. The placement, shape, and size of the ROIs drawn for three phases were kept as consistently as possible. In addition, the GSI software automatically propagated the ROIs to all 101 sets of monochromatic images with different energies to generate the spectral curves. The slope of the spectral curve between 40 and 65 keV (K40–65 keV) for necrosis in three phases was calculated according to the following formula:
Meanwhile, the iodine concentration (IC) of the solid portion in the AP and VP was measured from the iodine-based material decomposition images. Another round ROI as large as possible was placed carefully on the solid region of the lesions in the slice with the most solid
K40−65 keV = (CT40 keV − CT65 keV)/25.
Fig. 1 Flow chart of study population

Page 4 of 9Li et al. BMC Med Imaging (2021) 21:81
components, avoiding necrosis, vessels, or calcification. Similarly, the measurements for IC were performed three times on three consecutive axial images, and the average values were calculated for each patient. Furthermore, the locations, sizes, and CT morphological features of the tumors were observed and recorded.
Statistical analysisStatistical analyses were performed using Statistical Package for the Social Sciences, version 19.0 (IBM Corp., Armonk, New York, USA). Single-sample Kolmogorov–Smirnov analysis was performed to test the variance homogeneity of the measurements. Normally distributed quantitative data were expressed as means ± standard deviations, whereas non-normally distributed data were presented as medians ± interquartile ranges. Two-inde-pendent-samples Student’s t-test was conducted to assess the parameters consistent with normal distribution; oth-erwise, the Mann–Whitney U test was used. A two-tailed P value < 0.05 was considered statistically significant [17, 18].
Receiver operating characteristic (ROC) analyses of the parameters that differed significantly between groups were performed, which further evaluated their abil-ity to identify NPMIL and NLC by calculating the area under the ROC curve (AUC). Sensitivity, specificity, and Youden Index (YI) (YImax = sensitivity + specificity − 1) were calculated to establish the optimal threshold values. Binary logistic regression was performed using clinical characteristics, CT morphological features, and DESCT quantitative parameters that differed significantly
between groups to identify independent prognostic fac-tors of differentiating NLC and NPMIL. The final regres-sion model was selected using the forward condition method, and the AUC was used to evaluate its diagnostic performance.
ResultsComparison of clinical characteristics between patients with NLC and those with NPMILFifty-eight men and 13 women were evaluated (age range, 34–84 years; mean age, 58 ± 11 years), of whom 56 (78.87%) were smokers. The clinical characteristics of the patients in both groups are shown in Table 1. The patients with NLC were older than those with NPMIL (p < 0.001). Compared to the NLC group, more patients in the NPMIL group had elevated C-reactive protein con-centration (p < 0.05). However, no significant differences in sex; smoking history; respiratory symptoms, including fever, cough, and chest pain; and white blood cell count were observed between groups (all p > 0.05).
Comparison of CT morphological features between NLC and NPMILThe CT morphological features of the lesions in both groups are shown in Table 2. For both groups, the upper lobe was the most common location (63.38%, 45/71), fol-lowed by the lower upper lobe (32.39%, 23/71) and the right middle lobe (4.23%, 3/71). However, no significant differences in the locations, lesion and necrotic foci sizes, lesion shapes and margins, and adjacent consolidation
Table 1 Comparison of patients’ clinical characteristics between groups
NLC, necrotic lung cancer; NPMIL, necrotic pulmonary mass-like inflammatory lesiona Chi-squared testb Two-independent-samples Student’s t-test
Characteristics NLC (n = 40) NPMIL (n = 31) p value
Gender
Men 34 (85.00%) 24 (77.42%) 0.413a
Women 6 (15.00%) 7 (22.58%)
Age (years)
Mean ± standard deviation 63 ± 9 53 ± 11 < 0.001b
Range 43–84 34–79
Smokers 31 (77.50%) 25 (80.65%) 0.747a
Respiratory symptoms
Fever 4 (10.00%) 6 (19.35%) 0.435a
Cough 31 (77.50%) 21(67.74%) 0.357a
Chest pain 12 (30.00%) 16 (51.61%) 0.065a
Laboratory results
Elevation of white blood cell count 10 (25.00%) 8 (25.81%) 0.938a
Elevation of C‑reactive protein concentration 17 (42.50%) 25 (80.65%) 0.001a
Page 5 of 9Li et al. BMC Med Imaging (2021) 21:81
or ground-glass opacity were found between groups (all p > 0.05).
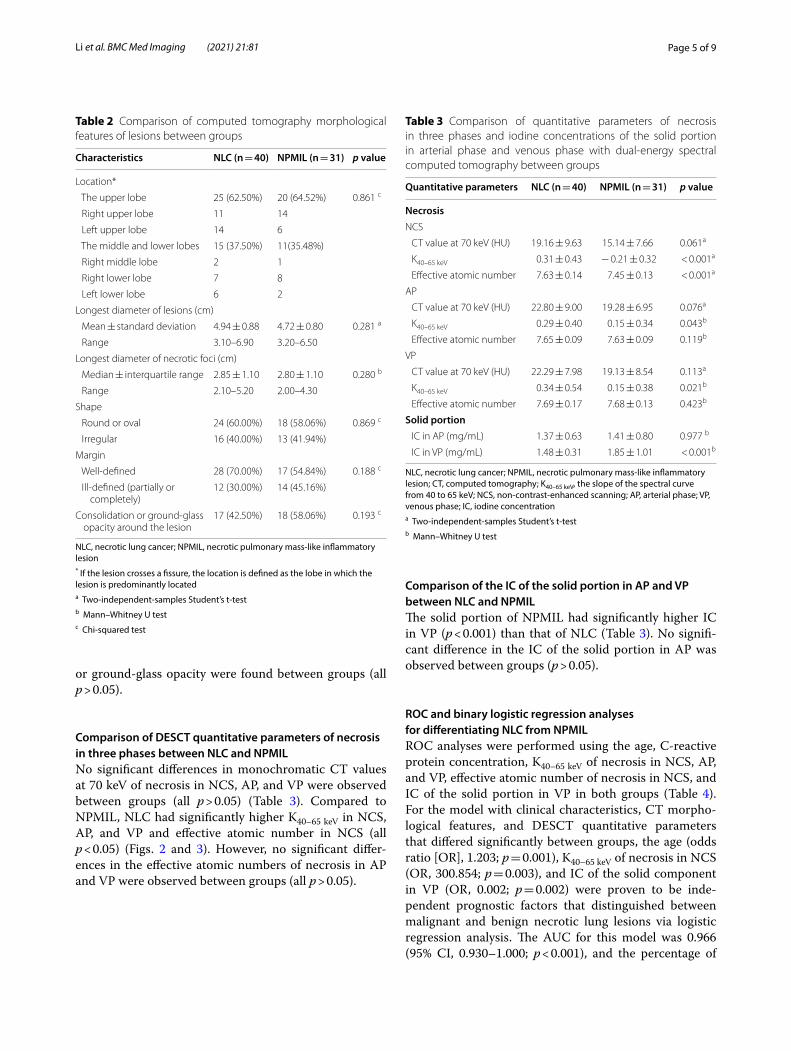
Comparison of DESCT quantitative parameters of necrosis in three phases between NLC and NPMILNo significant differences in monochromatic CT values at 70 keV of necrosis in NCS, AP, and VP were observed between groups (all p > 0.05) (Table 3). Compared to NPMIL, NLC had significantly higher K40–65 keV in NCS, AP, and VP and effective atomic number in NCS (all p < 0.05) (Figs. 2 and 3). However, no significant differ-ences in the effective atomic numbers of necrosis in AP and VP were observed between groups (all p > 0.05).
Comparison of the IC of the solid portion in AP and VP between NLC and NPMILThe solid portion of NPMIL had significantly higher IC in VP (p < 0.001) than that of NLC (Table 3). No signifi-cant difference in the IC of the solid portion in AP was observed between groups (p > 0.05).
ROC and binary logistic regression analyses for differentiating NLC from NPMILROC analyses were performed using the age, C-reactive protein concentration, K40–65 keV of necrosis in NCS, AP, and VP, effective atomic number of necrosis in NCS, and IC of the solid portion in VP in both groups (Table 4). For the model with clinical characteristics, CT morpho-logical features, and DESCT quantitative parameters that differed significantly between groups, the age (odds ratio [OR], 1.203; p = 0.001), K40–65 keV of necrosis in NCS (OR, 300.854; p = 0.003), and IC of the solid component in VP (OR, 0.002; p = 0.002) were proven to be inde-pendent prognostic factors that distinguished between malignant and benign necrotic lung lesions via logistic regression analysis. The AUC for this model was 0.966 (95% CI, 0.930–1.000; p < 0.001), and the percentage of
Table 2 Comparison of computed tomography morphological features of lesions between groups
NLC, necrotic lung cancer; NPMIL, necrotic pulmonary mass-like inflammatory lesion* If the lesion crosses a fissure, the location is defined as the lobe in which the lesion is predominantly locateda Two-independent-samples Student’s t-testb Mann–Whitney U testc Chi-squared test
Characteristics NLC (n = 40) NPMIL (n = 31) p value
Location*
The upper lobe 25 (62.50%) 20 (64.52%) 0.861 c
Right upper lobe 11 14
Left upper lobe 14 6
The middle and lower lobes 15 (37.50%) 11(35.48%)
Right middle lobe 2 1
Right lower lobe 7 8
Left lower lobe 6 2
Longest diameter of lesions (cm)
Mean ± standard deviation 4.94 ± 0.88 4.72 ± 0.80 0.281 a
Range 3.10–6.90 3.20–6.50
Longest diameter of necrotic foci (cm)
Median ± interquartile range 2.85 ± 1.10 2.80 ± 1.10 0.280 b
Range 2.10–5.20 2.00–4.30
Shape
Round or oval 24 (60.00%) 18 (58.06%) 0.869 c
Irregular 16 (40.00%) 13 (41.94%)
Margin
Well‑defined 28 (70.00%) 17 (54.84%) 0.188 c
Ill‑defined (partially or completely)
12 (30.00%) 14 (45.16%)
Consolidation or ground‑glass opacity around the lesion
17 (42.50%) 18 (58.06%) 0.193 c
Table 3 Comparison of quantitative parameters of necrosis in three phases and iodine concentrations of the solid portion in arterial phase and venous phase with dual‑energy spectral computed tomography between groups
NLC, necrotic lung cancer; NPMIL, necrotic pulmonary mass-like inflammatory lesion; CT, computed tomography; K40–65 keV, the slope of the spectral curve from 40 to 65 keV; NCS, non-contrast-enhanced scanning; AP, arterial phase; VP, venous phase; IC, iodine concentrationa Two-independent-samples Student’s t-testb Mann–Whitney U test
Quantitative parameters NLC (n = 40) NPMIL (n = 31) p value
NecrosisNCS
CT value at 70 keV (HU) 19.16 ± 9.63 15.14 ± 7.66 0.061a
K40–65 keV 0.31 ± 0.43 − 0.21 ± 0.32 < 0.001a
Effective atomic number 7.63 ± 0.14 7.45 ± 0.13 < 0.001a
AP
CT value at 70 keV (HU) 22.80 ± 9.00 19.28 ± 6.95 0.076a
K40–65 keV 0.29 ± 0.40 0.15 ± 0.34 0.043b
Effective atomic number 7.65 ± 0.09 7.63 ± 0.09 0.119b
VP
CT value at 70 keV (HU) 22.29 ± 7.98 19.13 ± 8.54 0.113a
K40–65 keV 0.34 ± 0.54 0.15 ± 0.38 0.021b
Effective atomic number 7.69 ± 0.17 7.68 ± 0.13 0.423b
Solid portion IC in AP (mg/mL) 1.37 ± 0.63 1.41 ± 0.80 0.977 b
IC in VP (mg/mL) 1.48 ± 0.31 1.85 ± 1.01 < 0.001b

Page 6 of 9Li et al. BMC Med Imaging (2021) 21:81
correct class was 88.7%. With a cut-off value of p ≧ 0.746 for diagnosing NLC, the sensitivity and specificity were 0.875 and 1.000, respectively.
DiscussionIn clinical practice, we have found that many NPMIL may mimic NLC, thus leading to unnecessary sur-gery in patients with inflammatory masses. Therefore, it is important to differentiate malignant from benign necrotic lung lesions radiographically before treatment. In this study, first, we compared the clinical data and CT morphological features between NPMIL and NLC. Chu et al. [1] found that patients with lung cancers were older than those with inflammatory lesions, which is consist-ent with our findings. Our results indicated that elevated levels of C-reactive protein were a useful indicator of NPMIL. This can be supported by the evidence that the C-reactive protein is a sensitive and nonspecific inflam-matory marker [19]. Furthermore, we found that the CT morphological findings of NLC were similar to those of NPMIL, indicating that conventional CT cannot provide enough information on necrosis, and it is desirable to develop a new imaging technique that can extract addi-tional quantitative information regarding necrosis.
Some investigators have indicated that the CT values on the 70 keV monochromatic images in the GSI mode are similar to those on the 120 kVp conventional poly-chromatic images [20]. Therefore, we compared the CT values at 70 keV of necrosis in three phases. Our results showed that no significant differences were observed in the CT values at 70 keV in three phases between both groups. Conventional CT generates polychromatic data under a single level of tube voltage. The average attenu-ation effect of polychromatic X-rays reduces the low-contrast resolution and makes it difficult to separate the materials with small density difference, such as the necrosis of different pulmonary diseases, which may be a good explanation to our findings presented here.
DESCT can supply the spectral curve which represents the changes of monochromatic CT values under different energy levels from 40 to 140 keV. The slope of the spec-tral curve can be used to evaluate the attenuation char-acteristics of the X-ray beam passing through different tissues, which are associated with the chemical composi-tion of the constituent substances [7]. Some researchers have used the spectral curve for the differential diagno-sis of diseases. A current study [8] indicated a significant difference in the slope of the spectral curve between
Fig. 2. 59‑year‑old male with squamous cell carcinoma. a Axial CT image of the lung window showing an oval mass in the right lower lobe. b–d Axial CT images of the mediastinal window in non‑contrast‑enhanced scanning (b) and arterial phase (c), and artificial color map of iodine concentration in venous phase (d) showing internal necrosis with ring enhancement. e An effective atomic number image showing that the effective atomic number for necrosis in non‑contrast‑enhanced scanning is 7.63. f The gradually declining spectral curve for necrosis in non‑contrast‑enhanced scanning showing a K40–65 keV of 0.24

Page 7 of 9Li et al. BMC Med Imaging (2021) 21:81
thymoma and mediastinal lymphoma. Another study [9] showed that the slope of the spectral curve could be used in distinguishing malignant from benign solitary pulmo-nary nodules. In our study, the slope for necrosis in three phases at low energy levels differed significantly between groups. The possible causes have been attributed to the differences in the histological components of necrotic
areas between malignant and benign lung lesions. Lung abscess and tuberculosis have been the most com-mon types of pulmonary benign necrotic lesions, of which necrosis has been associated with inflammatory responses caused by microbial infection [13, 14]. For lung abscesses, necrotic tissues mainly contain highly viscous pus composed of necrotic detritus, inflammatory cells,
Fig. 3. 54‑year‑old male with lung abscess. a Axial CT image of the lung window showing a round mass in the right lower lobe. b–d Axial CT images of the mediastinal window in non‑contrast‑enhanced scanning (b) and arterial phase (c), and artificial color map of iodine concentration in venous phase (d) showing internal necrosis with ring enhancement. e Effective atomic number image showing that the effective atomic number for necrosis in non‑contrast‑enhanced scanning is 7.44. f The gradually increasing spectral curve for necrosis in non‑contrast‑enhanced scanning showing a K40–65 keV of − 0.43
Table 4 Receiver operating characteristic analyses of clinical characteristics and dual‑energy spectral computed tomography quantitative parameters in necrotic lung cancer and pulmonary mass‑like inflammatory lesions
AUC, area under the receiver operating characteristic curve; CI: confidence interval; K40–65 keV, the slope of the spectral curve from 40 to 65 keV; NCS, non-contrast-enhanced scanning; AP, arterial phase; VP, venous phase; IC, iodine concentration
Characteristics AUC (95% CI) Optimal cut-off value
Sensitivity Specificity
Age (years) 0.747 (0.626–0.868) 59 0.750 0.742
Elevation of C‑reactive protein concentration 0.691 (0.566–0.815) – 0.806 0.575
Quantitative parameters of necrosis
K40–65 keV in NCS 0.841 (0.749–0.933) − 0.12 0.900 0.742
K40–65 keV in AP 0.641 (0.510–0.771) 0.22 0.650 0.645
K40–65 keV in VP 0.660 (0.531–0.790) 0.11 0.875 0.452
Effective atomic number in NCS 0.828 (0.731–0.926) 7.54 0.825 0.774
Quantitative parameters of solid portion
IC in VP (mg/mL) 0.754 (0.638–0.870) 1.85 0.516 0.925

Page 8 of 9Li et al. BMC Med Imaging (2021) 21:81
bacteria, proteinaceous exudate, and fibrinogen [14, 15]. Tuberculosis always uniquely exhibits caseous necrosis characterized by “cheese-like” overall appearance because of its rich lipid content, usually surrounded by lympho-cytes and activated macrophages [13]. Unlike inflam-matory necrosis, tumoral necrosis usually manifests as coagulative necrosis caused by chronic ischemic injury or hypoxia [13]. Therefore, compared with abscesses, tumoral necrosis is less viscous and contains some tumor cell debris and fewer inflammatory cells [16].
Furthermore, we analyzed the effective atomic number of necrosis, which, in NCS, was found to be significantly higher in the NLC group than in the NPMIL group. If the X-ray attenuation coefficient of the element is the same as that of a compound, the element’s atomic number is the effective atomic number, which can therefore be used to identify the material composition. Indeed, several stud-ies [10, 11] have shown that the effective atomic number plays an important role in differentiating materials, with our results showing the same.
DESCT can provide material decomposition images to quantitatively analyze the composition of a material, which can be manifested as an equal mixture of two basic materials (e.g., iodine and water) after quantitative den-sity measurements [12]. Because iodine is the main com-ponent of contrast agents, IC may be a good indicator reflecting the blood supply of pulmonary lesions. Gener-ally, IC and normalized iodine concentration (NIC) are the two most commonly used indicators of iodine con-centration in clinic. The IC was derived from the iodine-based material decomposition CT images, while the NIC refers to the ratio of the IC to that in the thoracic aorta [8, 17]. Our previous study showed that IC and NIC in three-phase contrast-enhanced scanning were positively associated with the microvessel density of lung cancer. Moreover, the correlation between IC and microvessel density were better than that between NIC and microves-sel density in the same scanning phase. Thus, we used IC to evaluate the blood supply of lesions [17]. This study found that the solid component of the inflammatory lesions showed a higher IC than the cancers in the VP. Previous studies have drawn the same conclusion that the blood supply toward inflammatory lesions is more abun-dant than that toward tumors [21, 22]. This finding could likely be attributed to the dilation of local vessels result-ing from active inflammatory responses or proliferation of inflammatory granulation tissue, whereas malignant tumors usually involve inappropriate angiogenesis and establishment of vascular networks, which may not sup-port the rapid growth of the mass and renders the tumor hypoxic [21, 22].
In this study, we found that the diagnostic performance of the quantitative parameters of necrosis in NCS was
much better than that in AP and VP. We speculated that the possible reason for this is that the obvious enhance-ment of the solid component during contrast-enhanced scanning may change the DESCT quantitative param-eters in the adjacent necrotic area because of the par-tial volume effect. Multiparametric analysis indicated that older age, larger K40–65 keV of necrosis in NCS, and smaller IC of the solid component in VP were the most important independent prognostic factors for diagnos-ing NLC with an AUC of 0.966. According to our results, the quantitative parameters of the lesions in AP were almost unhelpful in differentiating NLC from NPMIL. Thus, for necrotic lung lesions, we recommend additional NCS or NCS plus contrast-enhanced scanning in VP using the GSI mode, including only the lesion based on conventional scanning sequences.
This study has several limitations worth consider-ing. First, given the small number of patients evaluated here, future studies with larger sample sizes are needed to substantiate our findings. Second, the heterogeneity of the patients in each group was not evaluated because of the small sample size. We are planning to further com-pare the DESCT characteristics of necrosis between dif-ferent diseases in each group for a more comprehensive analysis.
ConclusionsIn conclusion, our preliminary results showed that DESCT could provide valuable quantitative informa-tion to differentiate malignant from benign necrotic lung lesions. In some cases where diagnosing is difficult, it may be useful for patients to undergo DESCT imag-ing and gain more quantitative information regarding necrosis, which may contribute to a correct diagnosis and reduction of unnecessary surgery.
AbbreviationsDESCT: Dual‑energy spectral computed tomography; CT: Computed tomogra‑phy; NLC: Necrotic lung cancer; NPMIL: Necrotic pulmonary mass‑like inflam‑matory lesion; GSI: Gemstone spectral imaging; NCS: Non‑contrast‑enhanced scanning; AP: Arterial phase; VP: Venous phase; ROI: Region of interest; IC: Iodine concentration; K40–65 keV: The slope of the spectral curve from 40 to 65 keV; ROC: Receiver operating characteristic; AUC : Area under the receiver operating characteristic curve; CI: Confidence interval; OR: Odds ratio; NIC: Normalized iodine concentration.
AcknowledgementsNot applicable.
Authors’ contributionsQL and XF contributed to the data analysis and manuscript writing. TY‑L and FJ‑L were involved in performing data collection and quality control. XT‑H was responsible for the study coordination. All authors have read and approved the manuscript, and ensure that this is the case.
FundingNo funding was received for conducting this study.
Page 9 of 9Li et al. BMC Med Imaging (2021) 21:81
Availability of data and materialsThe datasets used and/or analysed during the current study available from the corresponding author on reasonable request.
Declarations
Ethics approval and consent to participateThe ethics committee of the First Affiliated Hospital of Chongqing Medical University approved this prospective study. All methods were carried out in accordance with relevant guidelines and regulations. Informed consent was obtained from all individual participants included in the study.
Consent for publicationPatients signed informed consent regarding publishing their clinical data and images.
Competing interestsThe authors declare that they have no competing interests.
Author details1 Department of Radiology, The First Affiliated Hospital of Chongqing Medical University, No. 1 Youyi Road, Yuzhong District, Chongqing, China. 2 Depart‑ment of Radiology, Children’s Hospital of Chongqing Medical University, No. 136 Zhongshan Road Two, Yuzhong District, Chongqing, China. 3 Department of Radiology, University of Chinese Academy of Sciences Chongqing Renji Hospital (Fifth People’s Hospital of Chongqing), No. 24 Renji Road, Nan’an District, Chongqing, China.
Received: 24 November 2020 Accepted: 28 April 2021
References 1. Chu ZG, Sheng B, Liu MQ, Lv FJ, Li Q, Ouyang Y. Differential diagnosis of
solitary pulmonary inflammatory lesions and peripheral lung cancers with contrast‑enhanced computed tomography. Clinics (Sao Paulo). 2016;71:555–61.
2. Zhao F, Yan SX, Wang GF, Wang J, Lu PX, Chen B, Yuan J, Zhang SZ, Wang YX. CT features of focal organizing pneumonia: an analysis of consecutive histopathologically confirmed 45 cases. Eur J Radiol. 2014;83:73–8.
3. Winer‑Muram HT. The solitary pulmonary nodule. Radiology. 2006;239:34–49.
4. Zhang D, Li X, Liu B. Objective characterization of GE discovery CT750 HD scanner: gemstone spectral imaging mode. Med Phys. 2011;38:1178–88.
5. Zhang X, Duan H, Yu Y, Ma C, Ren Z, Lei Y, He T, Zhang M (2018) Dif‑ferential diagnosis between benign and malignant pleural effusion with dual‑energy spectral CT. PLoS One 13: e0193714.
6. Lin XZ, Wu ZY, Li WX, Zhang J, Xu XQ, Chen KM, Yan FH. Differential diagnosis of pancreatic serous oligocystic adenoma and mucinous cystic neoplasm with spectral CT imaging: initial results. Clin Radiol. 2014;69:1004–10.
7. Boll DT, Patil NA, Paulson EK, Merkle EM, Nelson RC, Schindera ST, Roessl E, Martens G, Proksa R, Fleiter TR, Schlomka JP. Focal cystic high‑attenuation lesions: characterization in renal phantom by using photon‑counting spectral CT‑improved differentiation of lesion composition. Radiology. 2010;254:270–6.
8. Xie Y, Zhang S, Liu J, Liang X, Zhang X, Zhang Y, Zhang Z, Zhou J. Value of CT spectral imaging in the differential diagnosis of thymoma and mediastinal lymphoma. Br J Radiol. 2019;92:20180598.
9. Zhang Y, Cheng J, Hua X, Yu M, Xu C, Zhang F, Xu J, Wu H (2016) Can spectral CT imaging improve the differentiation between malignant and benign solitary pulmonary nodules? PLoS One 11: e0147537.
10. González‑Pérez V, Arana E, Barrios M, Bartrés A, Cruz J, Montero R, González M, Deltoro C, Martínez‑Pérez E, De Aguiar‑Quevedo K, Arrarás M. Differentiation of benign and malignant lung lesions: dual‑energy computed tomography findings. Eur J Radiol. 2016;85:1765–72.
11. Goodsitt MM, Christodoulou EG, Larson SC. Accuracies of the syn‑thesized monochromatic CT numbers and effective atomic numbers obtained with a rapid kVp switching dual energy CT scanner. Med Phys. 2011;38:2222–32.
12. Johnson TR, Krauss B, Sedlmair M, Grasruck M, Bruder H, Morhard D, Fink C, Weckbach S, Lenhard M, Schmidt B, Flohr T, Reiser MF, Becker CR. Material differentiation by dual energy CT: initial experience. Eur Radiol. 2007;17:1510–7.
13. Adigun R, Basit H, Murray J (2019)Necrosis, Cell (Liquefactive, Coagulative,Caseous, Fat, Fibrinoid, and Gangrenous). StatPearls [Inter‑net]. Treasure Island (FL): StatPearls Publishing 2019.
14. Kuhajda I, Zarogoulidis K, Tsirgogianni K, Tsavlis D, Kioumis I, Kosmidis C, Tsakiridis K, Mpakas A, Zarogoulidis P, Zissimopoulos A, Baloukas D, Kuhajda D. Lung abscess‑etiology, diagnostic and treatment options. Ann Transl Med. 2015;3:183.
15. Desprechins B, Stadnik T, Koerts G, Shabana W, Breucq C, Osteaux M. Use of diffusion‑weighted MR imaging in differential diagnosis between intracerebral necrotic tumors and cerebral abscesses. AJNR Am J Neuro‑radiol. 1999;20:1252–7.
16. Nadal Desbarats L, Herlidou S, de Marco G, Gondry‑Jouet C, Le Gars D, Deramond H, Idy‑Peretti I. Differential MRI diagnosis between brain abscesses and necrotic or cystic brain tumors using the apparent diffu‑sion coefficient and normalized diffusion‑weighted images. Magn Reson Imaging. 2003;21:645–50.
17. Li Q, Li X, Li XY, Huo JW, Lv FJ, Luo TY. Spectral CT in lung cancer: useful‑ness of iodine concentration for evaluation of tumor angiogenesis and prognosis. AJR Am J Roentgenol. 2020;215:595–602.
18. Li Q, Li X, Li XY, He XQ, Chu ZG, Luo TY. Histological subtypes of solid‑dominant invasive lung adenocarcinoma: differentiation using dual‑energy spectral CT. Clin Radiol. 2020;S0009–9260(20):30390–1.
19. Hansen JG, Dahler‑Eriksen BS. C‑reactive protein and infections in general practice. Ugeskr Laeger. 2000;162:2457–60.
20. Li M, Zhang L, Tang W, Jin YJ, Qi LL, Wu N. Identification of epidermal growth factor receptor mutations in pulmonary adenocarcinoma using dual‑energy spectral computed tomography. Eur Radiol. 2019;29:2989–97.
21. Li Y, Yang ZG, Chen TW, Yu JQ, Sun JY, Chen HJ. First‑pass perfusion imag‑ing of solitary pulmonary nodules with 64‑detector row CT: comparison of perfusion parameters of malignant and benign lesions. Br J Radiol. 2010;83:785–90.
22. Zhang M, Kono M. Solitary pulmonary nodules: evaluation of blood flow patterns with dynamic CT. Radiology. 1997;205:471–8.
Publisher’s NoteSpringer Nature remains neutral with regard to jurisdictional claims in pub‑lished maps and institutional affiliations.