Differential Operator in Seizure Detectionkaushik/kaushik_files/detection.pdf · Differential...
15
Differential Operator in Seizure Detection Kaushik Majumdar Systems Science and Informatics Unit, Indian Statistical Institute, 8th Mile, Mysore Road, Bangalore 560059, India; E-mail: [email protected] Abstract – Differential operators can detect significant changes in signals. This has been utilized to enhance the contrast of the seizure signatures in depth EEG or ECoG. We have actually taken normalized exponential of absolute value of single or double derivative of epileptic ECoG. Variance operation has been performed to automatically detect seizures. A novel method for determining the duration of seizure has also been proposed. Since all operations take only linear time, the whole method is extremely fast. Seven novel parameters have been introduced whose patient specific thresholding brings down the rate of false detection to a bare minimum. Results of implementation on the ECoG data of four epileptic patients have been reported with an ROC curve analysis. High value of the area under the ROC curve indicates excellent detection performance. Keywords – Differentiation, electrocorticoencephalogram (ECoG), seizure detection, variance. I INTRODUCTION Second derivative based Laplacian operator is widely used for edge detection in an image [1]. An edge can be characterized by an abrupt change in intensity indicating the boundary between two regions of an image [2]. We have applied the same logic in this letter to detect the boundary between seizure and nonseizure in ECoG signals of epileptic patients which indicates a seizure onset or offset (for automatic seizure detection see [3] – [5]). Earlier first and second derivative of neonatal sleep EEG were used for feature extraction in order to automatically detect the sleep stages [6]. First and second derivative of EEG were also used to extract time domain features for automatic seizure detection in [7].
Transcript of Differential Operator in Seizure Detectionkaushik/kaushik_files/detection.pdf · Differential...
Differential Operator in Seizure Detection
Kaushik Majumdar
Systems Science and Informatics Unit, Indian Statistical Institute, 8th Mile, Mysore Road,
Bangalore 560059, India; E-mail: [email protected]
Abstract – Differential operators can detect significant changes in signals. This has been utilized to
enhance the contrast of the seizure signatures in depth EEG or ECoG. We have actually taken
normalized exponential of absolute value of single or double derivative of epileptic ECoG. Variance
operation has been performed to automatically detect seizures. A novel method for determining the
duration of seizure has also been proposed. Since all operations take only linear time, the whole
method is extremely fast. Seven novel parameters have been introduced whose patient specific
thresholding brings down the rate of false detection to a bare minimum. Results of implementation
on the ECoG data of four epileptic patients have been reported with an ROC curve analysis. High
value of the area under the ROC curve indicates excellent detection performance.
Keywords – Differentiation, electrocorticoencephalogram (ECoG), seizure detection, variance.
I INTRODUCTION
Second derivative based Laplacian operator is widely used for edge detection in an image [1]. An
edge can be characterized by an abrupt change in intensity indicating the boundary between two
regions of an image [2]. We have applied the same logic in this letter to detect the boundary
between seizure and nonseizure in ECoG signals of epileptic patients which indicates a seizure
onset or offset (for automatic seizure detection see [3] – [5]). Earlier first and second derivative
of neonatal sleep EEG were used for feature extraction in order to automatically detect the sleep
stages [6]. First and second derivative of EEG were also used to extract time domain features for
automatic seizure detection in [7].
In the next section we will describe the method. In section 3 data acquisition will be described.
In section 4 will contain the results of implementation on depth EEG or ECoG of four epileptic
patients. We will use EEG and ECoG interchangeably throughout this letter. The last section
contains some concluding remarks.
II METHOD
In this letter we will be dealing with digital signals only. Derivative is discrete derivative or
difference operation. Let a , b and c are successive time points. If a spike occurs at b then
statistically )()( axbx − and )()( axcx − both have high numerical value, where ()x is the signal.
The second derivative )(2)()( bxcxax −+ has an even higher numerical value. Whereas these
values for the back ground signal won’t be much higher. Let us take the transformation
xD
w
21exp , where 2D is the second derivative, . is absolute value and w is a positive
valued normalization constant.
xD
w
21exp acts as a spike enhancement filter with respect to
the back ground EEG (spike enhancement through appropriate filter for the detection purpose
has also been accomplished in [8]).
Dx
w
1exp too acts the same way, where D denotes the
first order derivative. Depending on the data set one gives better results than the other.
Success of variance in seizure detection is well established [9]. In section 4 we will see that
the above filtering can significantly improve the seizure detection accuracy by variance. In order
to minimize false detection patient specific threshold needs to be set for the following parameters
introduced in this paper. For the detail of implementation see the MATLAB programs with
elaborate documentation along with supplementary materials in the author’s website [10]. The

implementation results for particular patients at any given time slot and channel are summarized
in Fig. 1 (for single derivative filter or SDF) and Fig. 2 (for double derivative filter or DDF).
(a) Maximum windowed variance (B) of the filtered data (in the above sense).
(b) Maximum windowed variance of absolute value of the data (C).
(c) )1()max( mmB − , where )1(mm is the variance of filtered data in the window next to the
window of the maximum variance.
(d) )(imm is the variance of filtered data at the i th window after the maximum window.
Number of windows after the maximum is stipulated (typically at 16). )1(1n is the
position of the first of the windows with minimum variance among the stipulated number
of windows. If M is the position of )max(B then += MN1 window* )1(n . M has been
treated as the onset of seizure in this paper (in majority of the cases it is several seconds
after the actual onset) and 1N is the offset (usually several seconds after the actual
offset). E is an array consisting of windowed variance of the filtered data starting from
two windows before M up to 1N . x is an array consisting of maximum values of E . F
is another array consisting of values of E which are greater than or equal to )max(4
3E .
And now we are in a position to say that )1()( xFmean − is a quantity whose threshold
distinguishes between seizure and nonseizure EEG.
(e) )(Fstd , where std stands for standard deviation.
(f)
= ED
vDE 21
exp , where v is a positive valued normalization constant. K is an array
consisting of values of DE , which are greater than or equal to )max(*999.0 DE . Length
of K , whose threshold distinguishes between seizure and nonseizure EEG.

(g) For seizure EEG )max(DE must lie within an interval.
Let us mention once again that all the thresholding in the above parameters and the interval in (g)
are patient specific. In this work duration of seizure has been calculated as described in (d). Each
of the operations executes in linear time. The whole method is extremely fast – takes less than 4
second for a one hour long signal with 625.15 second window length and 234.15 second overlap
on an Intel Core 2 Duo Processor T8100 ( MHzGHz 800/1.2 FSB, 3M L2 cache), Ubuntu
machine with 4GB RAM. The implementation was in MATLAB.
III DATA ACQUISITION
Four medically intractable focal epileptic patients’ ECoG data that have been analyzed in this
work have been provided by the Seizure Prediction Project of the Albert-Ludwig-Universitat
Freiburg, Germany [11]. In order to obtain a high signal to noise ratio (SNR), fewer artifacts and
to record directly from focal areas intracranial grid, strip and depth electrodes were utilized. The
ECoG data were acquired using Neurofile NT digital video EEG system (It-med, Usingen,
Germany) with 128 channels, 256 Hz sampling rate, and a 16 bit analog to digital converter. In
all cases the ECoG from only six sites have been analyzed. Three of them from the focal areas
and the other three from out side the focal areas. See Table 1 for the patient details. A superset of
the patient population has been studied in [12].
IV RESULTS
A) Preprocessing
Since the data were collected over couple of years, the conditions under which the data had
been collected are likely to be different from patient to patient. We have performed different

preprocessing for different patients for the optimum results. We have chosen the method by trial
and error. Gaussian low pass filter, with cut off frequencies either 50 or 100 Hz depending on
the patient, has been used to remove muscle contraction artifacts. Montage change from common
reference to bipolar has helped to suppress chewing artifacts in patient 4 to some extent. See
Table 2 for the details. For patient 4 the three in-focus electrodes have been put in bipolar
reference among themselves and three out-focus electrodes have been put in bipolar reference
among themselves (Although intensity of seizure decreases due to subtracting one channel from
another which may result in detection failure, in this particular case it helped to eliminate
artifacts to a large extent while still preserving the strength of the signal, which has turned out to
be sufficient for the detection purpose).
B) Automatic Detection
The detection algorithm was run on one hour long segments of ECoG of the patients
containing one seizure per segment. Window length of 4000 time points ( 625.15 second) with
3900 ( 234.15 second) time points overlap (i.e., sliding by 100 points) has been used. Seizure
portions were identified by certified epileptologists at the place of origin of the data at each given
time slot, but not for individual channels. The algorithm was implemented on each channel to
automatically detect onset and offset of a seizure. Onset of the seizure has been taken to be the
earliest point detected as onset among all the channels. For offset also the earliest point detected
among the channels has been taken to be the offset.
The SDF has been applied on patients 1 and 4. The DDF has been applied on patients 2 and 3.
Data of 1 and 4 contain more artifacts or noise than those of 2 and 3. DDF could not detect some
of the seizures of patient 1. In relatively artifact free signals DDF usually gave more accurate
measure of the seizure onset than SDF. In the ECoG of patient 1 windowed variance could not
detect seizures in the preprocessed signals. But after filtering with the SDF all the seizures could
be detected by windowed variance.
For the first three patients seizures were detected with cent percent accuracy. Data of the last
four out of five seizures of patient 4 were heavily contaminated by chewing artifact. First seizure
has been detected nicely on all channels. Second and fourth seizures have been detected on all
focal channels. The third and the fifth seizures have been detected in two out of three focal
channels and in one the seizure could not be detected although it showed up clearly in the plot
(see supplementary materials in [6]). The fifth seizure ECoG of patient 4 required a very special
and unique preprocessing (suppression of all values 15.0≥ of the maximum value irregardless
of sign), and therefore we will treat it as a failure to detection. For patients 1, 3 and 4 seizure free
data for 24 hours were available on which the detection algorithm was run to test for false
positives. There were 4 false detections for patient 1, 5 for patient 3 and 0 for patient 4. Since the
available seizure ECoG was rather scarce for each patient, thresholds were set at the time of
detection. Then the effectiveness of the method was tested by the number of false positives on
the 24 hour long seizure free signals. Performance measure has been given in terms of the area
under the ROC curve in the next subsection. The average seizure detection time lag is 45.20
second after the epileptologist determined onset, which is 3.9 second in [4]. The average seizure
offset detection time lag is 49.26 second after the epileptologist determined offset.
C) ROC Curve Analysis
ECoG recording of 28 hours for patient 1 is available. For patient 2 the recording is of 3
hours duration (the 24 hours seizure free data is not available). For patients 3 and 4 it is for 29

hours each. The receiver operator characteristic (ROC) curve has been plotted as true positive
rate (TPR, plotted along the Y-axis) vs. false positive rate (FPR, plotted along the X-axis)
following [13] (Fig. 3). For the purpose of the ROC curve plotting we have assigned 5 false
detections to patient 2 in 24 hours, which is the highest in the poll of patients under study. For a
discussion on missing values conventions see ref. [14]. FPR = 1 – specificity = FPTN
TN
+−1
and TPR = sensitivity = FNTP
TP
+ [13]. The area under the curve is 98.0≈ , which indicates
excellent identification accuracy.
CONCLUSION
In this letter the power of differential operators in detecting significant changes in one
dimensional signals such as single channel ECoG has been studied. Excellent accuracy has been
observed in detecting seizures with a small number of false detections. The method made up of
differential operators, exponentiation and variance has turned out to be extremely fast. Seven
parameters involving them have been identified whose patient specific threshold can distinguish
between seizure and nonseizure signals for a given patient with impressively high detection and
low false detection rate. Further improvements in elimination of false detection are possible with
multidimensional statistical analysis of these parameters. Wavelet feature detection of the filtered
signal followed by appropriate clustering techniques may result in further improvement in
reducing the gap between the detection time and the actual onset time.
The current method has shown promising success on ECoG, which is relatively noise free, but
not artifact free. The proposed filter can greatly enhance isolated spikes with respect to the back
ground and therefore may be a potential tool for spike detection in single cell recordings. It can

also suppress low frequency artifacts like those generated by eye blinks. The same is true for low
intensity noise. It is yet to be tested for strong event related potential (ERP) detection in scalp
EEG. However it is likely to give good results for automatic quake detection in seismological
signals. Particularly many low intensity quakes are difficult to detect, yet they contain important
information about the inside of our planet. At times they may even be precursor to an impending
major earth quake.
ACKNOWLEDGMENT
The author is grateful to the Freiburg Seizure Prediction Project, Freiburg, Germany, for
generously providing the ECoG data. He also likes to thank Hinnerk Feldwisch for helping with
the data transfer and answering some questions to better understand it. Dipti P. Mukherjee is
acknowledged for some helpful suggestions.
References
1. D. Marr and E. Hildrath, “Theory of edge detection,” Proc. Royal Soc. London, Series B,
Biol. Sc., vol. 207, no. 1167, pp. 187 – 217, Feb 1980.
2. X. Wang, “Laplacian operator-based edge detectors,” IEEE Trans. Patt. Anal. Mach.
Intel., vol. 29(5), pp. 886 – 890, May 2007.
3. A. A. Dingle, R. D. Jones, G. J. Carroll, and W. R. Fright, “A multistage system to detect
epileptiform activity in EEG,” IEEE Trans. Biomed. Eng., vol. 40(12), pp. 1260 – 1268,
Dec 1993.
4. H. Qu, and J. Gotman, “A patient-specific algorithm for the detection of seizure onset in
long-term EEG monitoring: Possible use as a warning device,” IEEE Trans. Biomed.
Eng., vol. 44(2), pp. 115 – 122, Feb 1997.
5. H. C. Lee, W. van Drongelen, A. B. McGee, D. M. Frim, and M. H. Kohrman,
“Comparison of seizure detection algorithms in continuously monitoring pediatric
patients,” J. Clin. Neurophysiol., vol. 24(2), pp. 137 – 146, Apr 2007.
6. V. Krajca, S. Petranek, J. Mohylova, K. Paul, V. Gerla, and L. Lhotska, “Neonatal EEG
sleep stages modeling by temporal profiles,” In: LNCS 4739, R. Moreno-Diaz (ed),
Springer-Verlag, Berlin, Heidelberg, 2007, pp. 195 – 201.
7. N. Paivinen, S. Lammi, A. Pitkanen, J. Nissinen, M. Penttonen, and T. Gronfors,
“Epileptic seizure detection: A nonlinear viewpoint,” Comp. Meth. Progr. Biomed., vol.
79(2), pp. 151 – 159, 2005.
8. D.-M. Ward, R. D. Jones, P. J. Bones, and G. J. Carroll, “Enhancement of deep
epileptiform activity in the EEG via 3-D adaptive spatial filtering,” IEEE Trans. Biomed.
Eng., vol. 46(6), pp. 707 – 716, Jun 1999.
9. P. E. McSharry, T. He, L. A. Smith, and L. Tarassenko, “Linear and non-linear methods
for automatic seizure detection in scalp electro-encephalogram recordings,” Med. Biol.
Eng. Comp., vol. 40, pp. 447 – 461, 2002.
10. K. Majumdar, MATLAB code and supplementary materials, available at
http://www.isibang.ac.in/~kaushik, 2009.
11. Freiburg Seizure Prediction Project, Freiburg, Germany, https://epilepsy.uni-freiburg.de/,
2008.

12. R. Aschenbrenner-Scheibe, T. MAiwald, M. Winterhalder, H. U. Voss, J. Timmer and A.
Schulze-Bonhage, “How well can epileptic seizures be predicted? An evaluation of a
nonlinear method,” Brain, vol. 126, pp. 2616 – 2626, 2003.
13. W. Chaovalitwongse, L. D. Iasemidis, P. M. Pardalos, P. R. Carney, D.-S. Shiau, J. C.
Sackellares, “Performance of a seizure warning algorithm based on the dynamics of
intracranial EEG,” Epilepsy Res., vol. 64, pp. 93 – 113, 2005.
14. W. J. Krzanowski, and D. J. Hand, ROC Curves for Continuous Data, CRC Press, Boca
Raton, 2009.
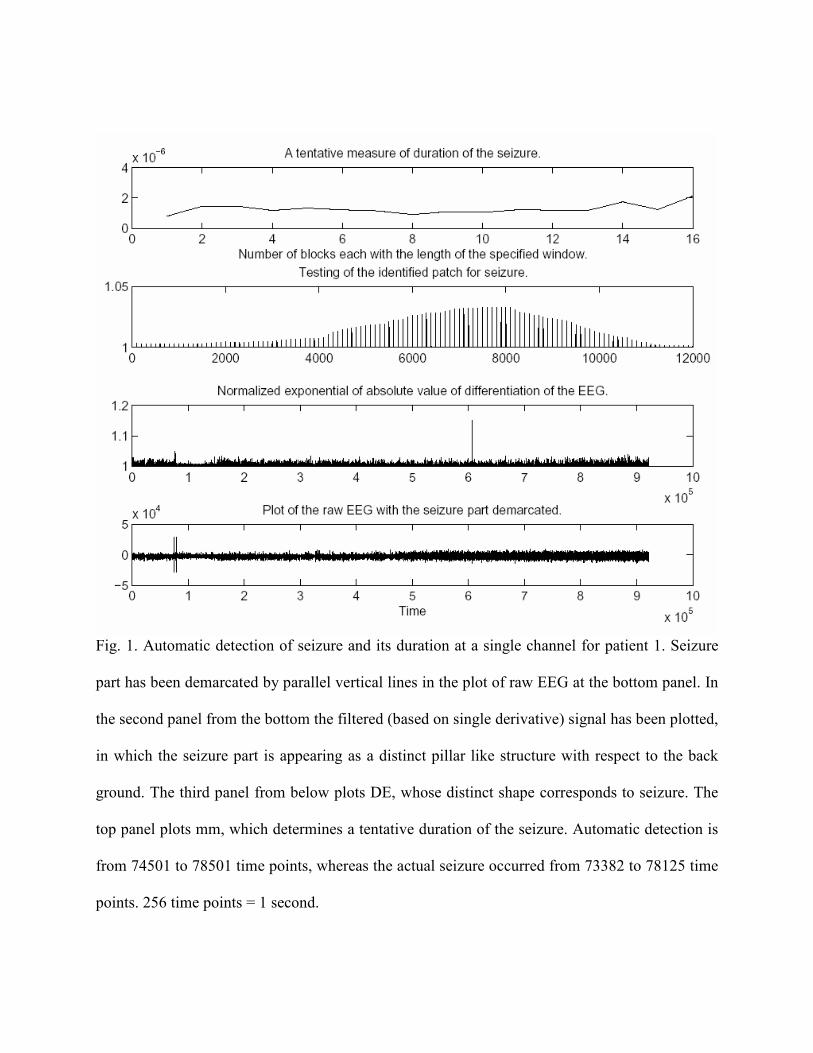
Fig. 1. Automatic detection of seizure and its duration at a single channel for patient 1. Seizure
part has been demarcated by parallel vertical lines in the plot of raw EEG at the bottom panel. In
the second panel from the bottom the filtered (based on single derivative) signal has been plotted,
in which the seizure part is appearing as a distinct pillar like structure with respect to the back
ground. The third panel from below plots DE, whose distinct shape corresponds to seizure. The
top panel plots mm, which determines a tentative duration of the seizure. Automatic detection is
from 74501 to 78501 time points, whereas the actual seizure occurred from 73382 to 78125 time
points. 256 time points = 1 second.

Fig. 2. Same as in Fig. 1, but for patient 2. In this case the filter is based on double derivative of
the signal. Automatic detection is from 827901 to 859901 time points, whereas the seizure has
been identified by epileptologist is from 819373 to 857094 time points. 256 time points = 1
second.

Fig. 3. The ROC curve of seizure detection. TPR = true positive rate and FPR = false positive
rate. The area under the curve is 98.0≈ .

TABLE I
PATIENT DETAILS
Patient Sex Age Seizure type H/NC Origin # seizures
1 F 15 SP,CP NC Frontal 4
2 M 38 SP,CP,GTC H Temporal 3
3 M 14 SP,CP NC Frontal 5
4 F 26 SP,CP,GTC H Temporal 5
SP = simple parietal, CP = complex parietal, GTC = generalized tonic-clonic, H = hippocampal,
NC = neocortical.
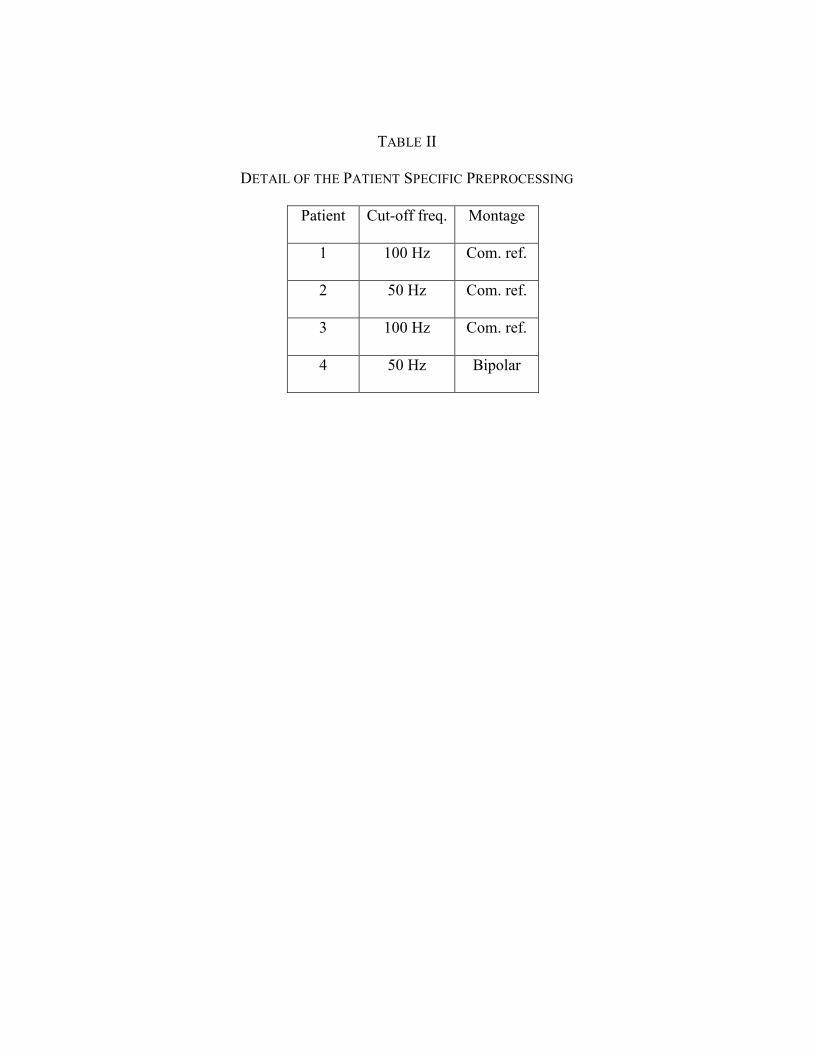
TABLE II
DETAIL OF THE PATIENT SPECIFIC PREPROCESSING
Patient Cut-off freq. Montage
1 100 Hz Com. ref.
2 50 Hz Com. ref.
3 100 Hz Com. ref.
4 50 Hz Bipolar