Differential effects of brand, ratings and region on ... effects of brand, ratings and region on...
18
Differential effects of brand, ratings and region on willingness to pay: a hedonic price approach Steven S. Cuellar a∗ and Marianna Claps b a Department of Economics, Sonoma State University, 1801 East Cotati Avenue, Rohnert Park, CA, 94928, USA; b Department of Agricultural Economics, and Land Resources, University of Florence, Piazzale Delle Cascine, 18, 50144 Florence, Italy (Received 13 January 2012; final version received 8 January 2013) How consumers respond to signals of a products quality plays an integral role in marketing strategy. While the effects of product characteristics such as brand, region of origin, and ratings have been studied extensively, research on how they interact with each other and the differential effects of these by market segment has not been studied. This paper provides a unique insight into the purchasing behavior of US wine consumers and shows how brand, region and ratings interact and how each has a different effect dependent on price segments and varietal. We attribute these differences to unobserved heterogeneity across consumers who respond differently to different signals of quality. Using data on retail wine purchases in the USA combined with third-party ratings, we used a fixed-effects model to analyze willingness to pay for wine. Our findings provide marketers with a guide to which product characteristics in terms of brand, ratings, and region are the most effective signals of quality to different consumer market segments. Keywords: consumer behavior; market segmentation; brand effects; region effects; ratings effect Introduction Perhaps no concept is more important to practitioners of marketing and advertising than a sound understanding of who your customers are and what factors affect their purchasing decisions. While a simple enough concept in theory, in practice, consumers of most products do not rep- resent a homogeneous group but rather a heterogeneous group of market segments, each respond- ing differently to different marketing, promotion, and advertising efforts. As such, pricing, marketing, promotion, and advertising aimed at the average consumer are likely to result in less than optimal outcomes. This paper investigates the factors affecting the consumer decision-making process and underscores the importance of thorough market research by provid- ing quantitative evidence of (1) heterogeneity of consumer market segments within- and across- product categories of a single product, (2) differential responses by consumers to various signals of a products quality across product categories of a single product, and (3) differential responses to various signals of quality within narrowly defined product categories. The practical appli- cations of this are clear. Efficient allocation of scarce marketing, promotion, and advertising dollars requires a comprehensive understanding of consumer heterogeneity. # 2013 Taylor & Francis ∗ Corresponding author. Email: [email protected] Journal of Wine Research, 2013 http://dx.doi.org/10.1080/09571264.2013.766160 Downloaded by [Sonoma State University], [Steven S. Cuellar] at 09:06 04 February 2013
Transcript of Differential effects of brand, ratings and region on ... effects of brand, ratings and region on...

Differential effects of brand, ratings and region on willingness to pay:a hedonic price approach
Steven S. Cuellara∗ and Marianna Clapsb
aDepartment of Economics, Sonoma State University, 1801 East Cotati Avenue, Rohnert Park, CA, 94928,USA; bDepartment of Agricultural Economics, and Land Resources, University of Florence, Piazzale Delle
Cascine, 18, 50144 Florence, Italy
(Received 13 January 2012; final version received 8 January 2013)
How consumers respond to signals of a products quality plays an integral role in marketingstrategy. While the effects of product characteristics such as brand, region of origin, andratings have been studied extensively, research on how they interact with each other and thedifferential effects of these by market segment has not been studied. This paper provides aunique insight into the purchasing behavior of US wine consumers and shows how brand,region and ratings interact and how each has a different effect dependent on price segmentsand varietal. We attribute these differences to unobserved heterogeneity across consumerswho respond differently to different signals of quality. Using data on retail wine purchasesin the USA combined with third-party ratings, we used a fixed-effects model to analyzewillingness to pay for wine. Our findings provide marketers with a guide to which productcharacteristics in terms of brand, ratings, and region are the most effective signals of qualityto different consumer market segments.
Keywords: consumer behavior; market segmentation; brand effects; region effects; ratingseffect
Introduction
Perhaps no concept is more important to practitioners of marketing and advertising than a soundunderstanding of who your customers are and what factors affect their purchasing decisions.While a simple enough concept in theory, in practice, consumers of most products do not rep-resent a homogeneous group but rather a heterogeneous group of market segments, each respond-ing differently to different marketing, promotion, and advertising efforts. As such, pricing,marketing, promotion, and advertising aimed at the average consumer are likely to result inless than optimal outcomes. This paper investigates the factors affecting the consumerdecision-making process and underscores the importance of thorough market research by provid-ing quantitative evidence of (1) heterogeneity of consumer market segments within- and across-product categories of a single product, (2) differential responses by consumers to various signalsof a products quality across product categories of a single product, and (3) differential responsesto various signals of quality within narrowly defined product categories. The practical appli-cations of this are clear. Efficient allocation of scarce marketing, promotion, and advertisingdollars requires a comprehensive understanding of consumer heterogeneity.
# 2013 Taylor & Francis
∗Corresponding author. Email: [email protected]
Journal of Wine Research, 2013http://dx.doi.org/10.1080/09571264.2013.766160
Dow
nloa
ded
by [
Sono
ma
Stat
e U
nive
rsity
], [
Stev
en S
. Cue
llar]
at 0
9:06
04
Febr
uary
201
3

Background
In markets characterized by a high degree of competition, differentiated products, and incompleteinformation, consumers will seek and firms will promote different signals of a products quality.These signals include price, brand, region, ratings, and prior experience. How consumers interpretthese signals determines whether and how much they are willing to pay for the respective product.From the firm’s perspective, determining the efficacy of these signals is vital to an efficient allo-cation of scarce resources.
Using data on retail wine purchases in the USA combined with third-party ratings, we use afixed-effects model to analyze the differential effects of brand, region, and ratings on willingnessto pay for wine both across- and within-product categories (varietal). The wine industry pro-vides a nearly ideal example of a highly competitive industry with differentiated products,asymmetric information, and heterogeneous consumers. As such, we feel that the results ofthis study are generalizable to other industries that contain a high degree of consumer hetero-geneity and product differentiation. In addition to market composition, the wine industry alsorepresents a market with a large number of competing brands as well as competition amongcompeting wine-producing regions. Two regions of particular interest in this study are the adja-cent Napa and Sonoma Counties in Northern California. Despite their close proximity, Napawines routinely command higher average prices than Sonoma wines. These price differencesprovide an opportunity to exploit a natural experiment to analyze region effects by comparingconsumers’ willingness to pay for wines from two similar regions in close proximity. Finally,another beneficial characteristic of the wine industry is the robust network of third-partyratings that exist in the industry. These ratings provide an unbiased means of controlling forquality among competing wines.
Review of literature
In an interesting paper, Hoch, Kim, Montgomery, and Rossi (1995) use store-level data to identifyconsumer demographic characteristics that influence the price elasticity of demand for a broadcategory of products. While Hoch et al. provides an important template for identifying consumersegments by regional demographic characteristics, our paper provides a template for identifyingconsumer segments within a product category. In particular, we examine how brand, region, andratings have differential effects within a single-product category.
Brands play a central role in differentiated product markets. Park, MacInnis, Priester, Eisin-gerich, and Iacobucci (2010) provide a very good review of brand effects across a several dimen-sions (brand attachment and brand attitude strength) for three product groups: oatmeal, digitalmusic players, and universities. Of particular relevance for this research, Milgrom and Roberts(1986) show that branding can act as a signal of quality for goods which can only be experiencedafter purchase. Additionally, Landes and Posner (1987) show that brands can help in the selectionprocess by reducing search costs, which can be substantial in selecting among literally dozens ofwines. One particular problem in analyzing brands is controlling for differences in productquality. Sullivan (1998) controls for quality by analyzing ‘twin’ automobiles, cars produced bythe same manufacturer under different brands. In the wine industry, Schamel (2009) finds statisti-cally significant effects of ‘brands reputation’, or how a brand rates relative to other brands in thesame region, on price. Similarly, Carew and Florkowski (2008) examine the effect of branding onwillingness to pay for Australian wines in British Columbia and find positive and statistically sig-nificant brand effects.
In a market characterized by terroir, appellation, region, state, and country distinctions, it is nosurprise that regional effects have been a significant part of the literature as well. Al-Sulaiti andBaker (1998) provide an exhaustive review of country of origin effect, geographic branding, and
2 S.S. Cuellar and M. Claps
Dow
nloa
ded
by [
Sono
ma
Stat
e U
nive
rsity
], [
Stev
en S
. Cue
llar]
at 0
9:06
04
Febr
uary
201
3

the effects on consumer perceptions on a variety of products from a multitude of countries. Withrespect to wine, Schamel (2009) examines regional and brand reputation effects controlling fortasting score, varietal, and the age of the wine and finds that brand effects dominate regionaleffects for brands with a reputation greater than their regional cohorts, but regional effects dom-inate brand effects for brands with a reputation less than that of their regional cohorts.
Interestingly, Veale and Quester (2008) find a statistically significant effect of country oforigin on consumers’ perception of wine quality, the effect on price has varied. In their reviewof regional effects, San Martın, Brummer, and Troncoso (2008) note that Nerlove (1995) andSteiner (2004) find little or no effect of country of origin on price, while Schamel (2000,2004), Schamel and Anderson (2003) and Troncoso and Aguirre (2006) find significant effectsof region on price.
In this research, we control for quality by examining third-party ratings. There is a well estab-lished body of literature surrounding the affect of ratings on wine prices. Despite the unreliability ofwine judges to rank wines consistently,1 there is a consistent body of research indicating that winerankings positively affect wine prices. Most recently, Gibbs, Tapia, and Warzynski (2009) find thatwine prices are positively and significantly correlated with Parker ratings, although this effectdiminishes when controlled for reputation and age. Gibbs et al. (2009) also find that the effect ofratings increases as they move from lower to higher quality wines. Hadj Ali, Lecocq, and Visser(2007) exploit a natural experiment to examine the affect of Robert Parker ratings on Bordeauxwine prices. The authors find a positive and statistically significant affect of ratings on wineprices. Hadj Ali et al. (2007) find differential effects of ratings associated with different regionsand ratings rating levels. In an earlier paper, Hadj Ali and Nauges (2004) examine the affect ofratings on Bordeaux prices using Parker and Wine Spectator ratings. In this instance, the authorsfind a small but statistically significant affect of ratings on price. In a re-examination of the HadjAli and Nauges (2004) data, Dubois and Nauges (2005) correct for potential endogeneity andfind evidence of a positive and statistically significant effect of ratings on price. Jones and Storch-mann (2001) examine the effect of Parker ratings on Bordeaux wine prices and find a positive andstatistically significant effect of the ratings on wine prices at auction.
Finally, consider price. Price is often used as a signal of quality in a variety of products andwine is no exception. For example, while Goldstein et al. (2008) show that in blind tastings, con-sumers did not consider more expensive wines to taste better, Plassmann, O’Doherty, Shiv, andRangel (2008) showed that when told a wine is more expensive, consumers consistently ratedwines perceived as more expensive as better than wines perceived as less expensive. Moreover,even in the face of more complete information, for example, actual tastings, Veale and Quester(2008) show that consumers used external signals such as price and country of origin to evaluatewines more than their own actual evaluations from tastings. As the literature on brand, region,ratings, and price clearly indicates, signals of quality play an integral role in both the decisionto purchase and the price consumers are willingness to pay for products.
Our analysis differs significantly from the prior research in a number of ways. First, most ofthe data analyzed in the wine studies above examine wine prices at auctions or suggested retailprices that accompany ratings. Our data examine actual purchases by a broad set of US consumersat major food, drug, and liquor retail outlets. We believe this is more reflective of overall consu-mer demand than auction prices. For example, wines selected for auction may not be representa-tive of wines available to most wine consumers nor are wine auction participants likely torepresent a cross section of wine consumers of varying levels of sophistication.
Second, as far as we can tell, no one has integrated ratings data with scan data to examine theaffect of ratings on price.2,3Third, while there is a substantial amount of research examining theindividual effect of ratings, or the individual effect of brand, or the individual effect of region, ourpaper integrates all these dimensions simultaneously, thus allowing us to control for each effect
Journal of Wine Research 3
Dow
nloa
ded
by [
Sono
ma
Stat
e U
nive
rsity
], [
Stev
en S
. Cue
llar]
at 0
9:06
04
Febr
uary
201
3

individually and thereby eliminate any confounding affects among ratings, brand, and region. Forexample, if one region produces more highly rated wines than another region and ratings posi-tively affect price, then any observed regional price premium may actually be attributed toratings and not region. Finally, by examining the effects of brand, ratings and region bymarket segment, we show that different product characteristics have different effects on differentmarket segments.
The rest of the paper proceeds as follows: An overview of the data is provided. Next, we testthe relationship between ratings and prices. This is important since ratings will be used to controlfor quality. We then progress through a series of models to examine the effects of brand and regionon willingness to pay. Finally, we summarize our results.
Data
To identify the effects of ratings, brand, and region on willingness to pay, we selected wines fromNapa and Sonoma counties. Napa and Sonoma counties provide a nearly ideal opportunity toexamine wines from similar adjacent regions. Despite their close proximity, Napa wines routinelycommand higher average prices than Sonoma wines. These price differences provide an oppor-tunity to exploit a natural experiment to analyze regional brand effects by comparing consumers’willingness to pay for wines from two similar regions in close proximity.
The data used for this analysis are Nielsen Scantrack data, which consist of a cross-section ofsku (store-keeping unit) level monthly purchases of wine scanned at US retail outlets fromDecember 2004 through February 2009. The data are for sales throughout the entire USA andfor comparability we concentrate on traditional glass, 750 ml bottles. To examine the regionaleffects, we identified wines in the sample produced from the Napa and Sonoma Counties. Tocontrol for quality, we used ratings scores taken from Wine Spectator magazine’s websitewhich contains a database of past ratings. To control for varietal, we chose to examine onlytwo varietals, cabernets sauvignon and zinfandel. These were chosen because they representthe top-selling varietals of Napa and Sonoma, respectively, and thus best reflect the regionalaffiliation of wines from these two regions. Based on our sampling criteria, we then searchedfor Napa and Sonoma cabernet sauvignon’s and zinfandels wines that were ranked in Wine Spec-tator database.4 We then identified those wines that were both ranked by Wine Spectator and con-tained in the Nielsen Scantrack data set. While there are approximately 400 wineries in NapaCounty, not all wines are sold through the retail channel and captured in the Nielsen data norare all wines rated by Wine Spectator. We were able to match 83 different wines that wereboth captured in the scanner data and ranked by Wine Spectator. Similarly, for the approximately200 Sonoma County wineries, we were able to match 71 different wines captured in both datasets. In total, we were able to match 154 Wine Spectator ratings with their equivalent sku orproduct descriptions in the scan data over 55 four-week periods to produce a panel of 8470 obser-vations. We were able to further disaggregate each observation by promotional activity (i.e.whether the product was promoted through a feature, in store display, a feature and display, ora temporary price reduction), thereby increasing the number of observations with prices greaterthan zero and who sold a positive number of cases to over 30,000.
While we believe scan data are more reflective of a broad cross-section of wine consumers’willingness to pay than auction data, there are some shortcomings of scan data. One drawback ofscan data is that they only reflect purchases made in major US retail chains and do not representwine sold at small retailers and liquor stores. Another drawback of scan data is that they do notcontain a variable for vintage; only the date of purchase is noted in the data description. However,if the scores of wines have spillover effects, then high scores for one vintage can be expected toraise the demand for subsequent vintages. Likewise, low scores of one vintage are likely to
4 S.S. Cuellar and M. Claps
Dow
nloa
ded
by [
Sono
ma
Stat
e U
nive
rsity
], [
Stev
en S
. Cue
llar]
at 0
9:06
04
Febr
uary
201
3

decrease the price consumers are willing to pay for other vintages.5 While this is less than optimal,it is the next best solution when merging rankings and scan data.6 Table 1 provides the summarystatistics for cabernet sauvignons from both Napa and Sonoma, while Figure 1 shows the distri-bution of prices of the cabernet sauvignons for the two regions. The summary statistics show thatNapa cabernet sauvignons are on average more expensive and higher rated than cabernet sau-vignons from Sonoma County.
The summary statistics for zinfandels is shown in Table 2, with the distribution of pricesshown in Figure 2. Again, Napa zinfandels are on average more expensive and higher ratedthan Sonoma zinfandels.
Table 1. Summary statistics for cabernet sauvignon.
Cabernet sauvignon
Napa Sonoma
Price Rating Price Rating
Mean 35.24 85.80 18.67 83.5875th Percentile 41.57 88 20.42 8650th Percentile 29.59 87 16.98 8325th Percentile 20.40 83 13.51 82Maximum 232.00 94 72.67 90Minimum 2.00 78 1.00 78Standard deviation 23.64 4.21 8.92 3.07Observations 11,760 11,760 8078 8078
Figure 1. Distribution of prices for cabernet sauvignon from Sonoma and Napa counties.
Journal of Wine Research 5
Dow
nloa
ded
by [
Sono
ma
Stat
e U
nive
rsity
], [
Stev
en S
. Cue
llar]
at 0
9:06
04
Febr
uary
201
3

Figure 3 shows the distribution of ratings between Napa and Sonoma wines. The distributionreinforces the summary statistics shown in Tables 2 and 3. Specifically, the distribution of ratingsfor Napa wines is generally above that of wines from Sonoma.
Ratings and price
Because we use ratings to control for quality, we want to first establish a relationship betweenratings and price. Table 3 shows the regression results of a simple linear regression betweenprice and Wine Spectator ratings while Figure 4 shows these results graphically. Table 3 indicatesthat ratings alone explain 21% of the variation in log price. Furthermore, the coefficient on ratingsfrom the simple linear regression is relatively large and statistically significantly. Specifically, the
Table 2. Summary statistics for zinfandel.
Zinfandel
Napa Sonoma
Price Rating Price Rating
Mean 19.21 85.79 15.74 84.3175th Percentile 26.00 87 18.23 8750th Percentile 15.79 86 13.77 8425th Percentile 13.03 85 11.79 83Maximum 58.50 89 80.13 92Minimum 4.93 78 1.81 71Standard deviation 8.43 1047 6.03 13.00Observations 1865 1865 9641 9641
Figure 2. Distribution of prices for zinfandel from Sonoma and Napa counties.
6 S.S. Cuellar and M. Claps
Dow
nloa
ded
by [
Sono
ma
Stat
e U
nive
rsity
], [
Stev
en S
. Cue
llar]
at 0
9:06
04
Febr
uary
201
3

regression results show that a one point increase in the Wine Spectator rating results in nearly a7% increase in price.
The model
We begin first with an examination of region effects. Specifically, we want to determine whetheror not there is a premium paid for Napa wines over equivalently rated Sonoma wines. To answerthis question, we estimate the following fixed-effects model:
Priceijt = b0 + b1Scoreijt + b2Napai + b3Caberneti
+∑
lX +∑
k
g Promotion +∑
t
d Timet + uijt(1)
Figure 3. Distribution of ratings scores of wines from Sonoma and Napa counties.
Table 3. Simple linear regression between price and ratings.
lnprice
Score 0.069(104.84)∗∗
Constant 22.847(51.07)∗∗
Observations 40320R2 0.21
Note: Absolute value of t-statistics in parentheses.∗Significant at 5% level.∗∗Significant at 1% level.
Journal of Wine Research 7
Dow
nloa
ded
by [
Sono
ma
Stat
e U
nive
rsity
], [
Stev
en S
. Cue
llar]
at 0
9:06
04
Febr
uary
201
3

where Priceijt represents the log price per 750 ml bottle of wine i produced in region j and sold inperiod t.
Scoreijt represents the Wine Spectator ratings score of wine i, produced in region j and sold inperiod t.
Napa is a dummy that equals 1 if the wine is produced in Napa and 0 if the wine is produced inSonoma.
Cabernet is a dummy that equals 1 if the wine is a cabernet sauvignon and 0 if the wine is azinfandel.
X is a vector of interaction terms among the independent variables score, Napa and varietal.Promotion is a vector of dummies indicating the type of promotional activity occurring in
period t. That is, whether the wine was sold with a feature, display, feature and display, or tem-porary price reduction.
Tt is a vector of dummies for the years 2005–2009.
Model 1 results
A summary of the regression results for the main variables of interest in Equation 1 is shown inTable 5 and shown graphically in Figure 5. From Table 5 and Figure 5, a few observations can bemade. First and foremost, the hedonic price-ratings functions for Napa wines are above those forSonoma wines for both zinfandel and cabernet sauvignon. That is, there appears to be a regionalpremium for Napa for both zinfandel and cabernet sauvignon over equivalently rated wines of thesame varietal from Sonoma. Table 4 converts the regression coefficients to regional and marginaleffects. As Table 4 shows, when evaluated at the mean score of 85 for wines from both regions, aNapa cabernet sauvignon receives a premium of 34% over a similarly rated cabernet sauvignonfrom Sonoma. This premium is statistically significant at the 1% level. Put differently, for anexpenditure of $20, you could either buy a Napa cabernet sauvignon rated at 80 by Wine Spectatoror a Sonoma County cabernet sauvignon rated at 86.
Figure 4. The effect of ratings score on the price of wine.
8 S.S. Cuellar and M. Claps
Dow
nloa
ded
by [
Sono
ma
Stat
e U
nive
rsity
], [
Stev
en S
. Cue
llar]
at 0
9:06
04
Febr
uary
201
3
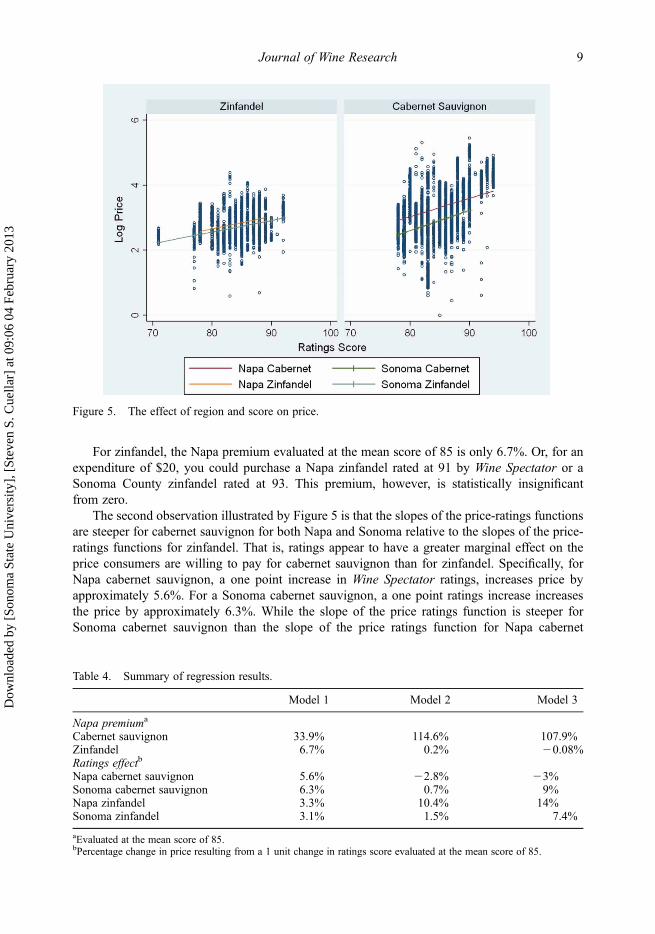
For zinfandel, the Napa premium evaluated at the mean score of 85 is only 6.7%. Or, for anexpenditure of $20, you could purchase a Napa zinfandel rated at 91 by Wine Spectator or aSonoma County zinfandel rated at 93. This premium, however, is statistically insignificantfrom zero.
The second observation illustrated by Figure 5 is that the slopes of the price-ratings functionsare steeper for cabernet sauvignon for both Napa and Sonoma relative to the slopes of the price-ratings functions for zinfandel. That is, ratings appear to have a greater marginal effect on theprice consumers are willing to pay for cabernet sauvignon than for zinfandel. Specifically, forNapa cabernet sauvignon, a one point increase in Wine Spectator ratings, increases price byapproximately 5.6%. For a Sonoma cabernet sauvignon, a one point ratings increase increasesthe price by approximately 6.3%. While the slope of the price ratings function is steeper forSonoma cabernet sauvignon than the slope of the price ratings function for Napa cabernet
Figure 5. The effect of region and score on price.
Table 4. Summary of regression results.
Model 1 Model 2 Model 3
Napa premiuma
Cabernet sauvignon 33.9% 114.6% 107.9%Zinfandel 6.7% 0.2% 20.08%Ratings effectb
Napa cabernet sauvignon 5.6% 22.8% 23%Sonoma cabernet sauvignon 6.3% 0.7% 9%Napa zinfandel 3.3% 10.4% 14%Sonoma zinfandel 3.1% 1.5% 7.4%
aEvaluated at the mean score of 85.bPercentage change in price resulting from a 1 unit change in ratings score evaluated at the mean score of 85.
Journal of Wine Research 9
Dow
nloa
ded
by [
Sono
ma
Stat
e U
nive
rsity
], [
Stev
en S
. Cue
llar]
at 0
9:06
04
Febr
uary
201
3
sauvignon, the difference between the two is not statistically significant. These results are similarto those obtained by Jones and Storchmann (2001) who find an average affect of 7%, but less thanthose obtained by Hadj Ali et al. (2007) who find a relatively large affect of nearly 15% and lessthan Hadj Ali and Nauges (2004) and Dubois and Nauges (2005) who find marginal affects of 1%and 1.38%, respectively.
For Napa zinfandel, a one point increase in the Wine Spectator ratings increases the price byapproximately 3.3% while a similar one point ratings increase for Sonoma zinfandel increases theprice by approximately 3.1%. Once again, while the marginal effects of the ratings are statisticallysignificant, the difference in the marginal effects of ratings between Napa and Sonoma is not stat-istically significant.
Brand versus region
The model, represented by Equation (1), assumes that the signal consumers perceive is region.However, what consumers may be using as a signal of quality is brand recognition. The 154 sep-arate products represent 107 different brands. To distinguish between the effect of brand recog-nition and regional association, we add a vector of brand dummies to Equation (1). v inEquation (2) represents the effect of each brand (m) on the price consumers are willing to pay.
Priceijt = b0 + b1Scoreijt + b2Napai + b3Caberneti∑
lX
+∑
k
g Promotion +∑
m
v Brand +∑
t
dTt + uijt(2)
Model 2 results
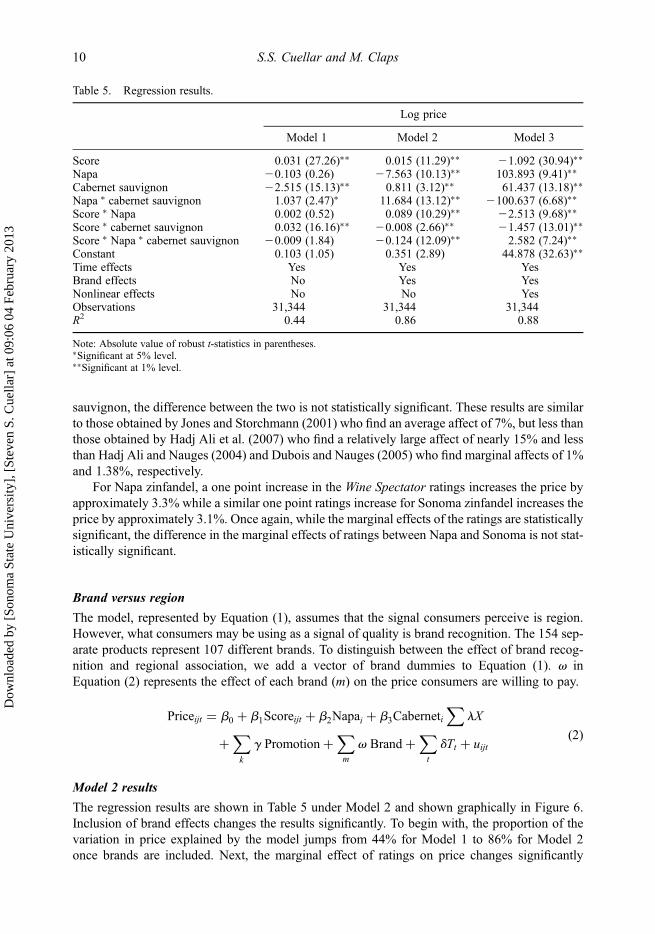
The regression results are shown in Table 5 under Model 2 and shown graphically in Figure 6.Inclusion of brand effects changes the results significantly. To begin with, the proportion of thevariation in price explained by the model jumps from 44% for Model 1 to 86% for Model 2once brands are included. Next, the marginal effect of ratings on price changes significantly
Table 5. Regression results.
Log price
Model 1 Model 2 Model 3
Score 0.031 (27.26)∗∗ 0.015 (11.29)∗∗ 21.092 (30.94)∗∗
Napa 20.103 (0.26) 27.563 (10.13)∗∗ 103.893 (9.41)∗∗
Cabernet sauvignon 22.515 (15.13)∗∗ 0.811 (3.12)∗∗ 61.437 (13.18)∗∗
Napa ∗ cabernet sauvignon 1.037 (2.47)∗ 11.684 (13.12)∗∗ 2100.637 (6.68)∗∗
Score ∗ Napa 0.002 (0.52) 0.089 (10.29)∗∗ 22.513 (9.68)∗∗
Score ∗ cabernet sauvignon 0.032 (16.16)∗∗ 20.008 (2.66)∗∗ 21.457 (13.01)∗∗
Score ∗ Napa ∗ cabernet sauvignon 20.009 (1.84) 20.124 (12.09)∗∗ 2.582 (7.24)∗∗
Constant 0.103 (1.05) 0.351 (2.89) 44.878 (32.63)∗∗
Time effects Yes Yes YesBrand effects No Yes YesNonlinear effects No No YesObservations 31,344 31,344 31,344R2 0.44 0.86 0.88
Note: Absolute value of robust t-statistics in parentheses.∗Significant at 5% level.∗∗Significant at 1% level.
10 S.S. Cuellar and M. Claps
Dow
nloa
ded
by [
Sono
ma
Stat
e U
nive
rsity
], [
Stev
en S
. Cue
llar]
at 0
9:06
04
Febr
uary
201
3

for both regions and varietals. For example, the marginal effect of score on price for Napa caber-net sauvignon goes down from a positive 5.6% to a relatively small negative 2.8%. For Sonomacabernet sauvignon, the marginal effect of score goes down from 6.3% to 0.7%. However, forNapa zinfandel, the marginal effect of score goes up from 3.3% to 10.4%, while for Sonoma zin-fandel, the marginal effect goes down from 3.1% to 1.5%.
In addition to the change in the marginal effect of ratings on price, the effect of region on pricealso changes drastically. For cabernet sauvignon, the Napa premium increases from 33.9% at amean rating of 85 to a large and statistically significant 114.6% at the same rating.
While these appear large, they are consistent with the brand effects obtained by Carew andFlorkowski (2008), who found brand effects that ranged from 288% to 215%.
For zinfandels, the results are mixed. At scores of 85 and below, Sonoma zinfandels enjoy asmall premium; while at scores above 85 Napa zinfandels enjoy a small premium. At a mean scoreof 85, the Napa premium virtually falls to zero.7
The regression results indicate that consumers of cabernet sauvignon and zinfandel do not usebrand, region, and score in the same manner as signals of quality. For example, the regressionresults indicate that consumers use brand and region as signals of quality for cabernet sauvignon.While for zinfandel, consumers appear to use brand and score as signals of quality for Napa zin-fandels and brand as the main determinant affecting their willingness to pay for Sonomazinfandels.
Nonlinear effects of ratings on price
To examine whether the effects of score ratings and region differ by market segment, we add anonlinear term to our hedonic price function to allow for any differential effects within varietals
Figure 6. The effect of region and score on price with brand effects.
Journal of Wine Research 11
Dow
nloa
ded
by [
Sono
ma
Stat
e U
nive
rsity
], [
Stev
en S
. Cue
llar]
at 0
9:06
04
Febr
uary
201
3

and regions. This is shown in Equation (3):
Priceijt = b0 + b1Scoreijt + b2Napai + b3Caberneti + b4Score2ijt
∑lX
+∑
k
g Promotion +∑
m
v Brand +∑
t
dTt + uijt(3)
The nonlinear term is also included in the vector X of interaction terms to allow for differencesin the effect of ratings by region and varietal.
Model 3 results
The regression results are given in Table 5 as Model 3 and shown graphically in Figure 7. Whilethe proportion of the variation in price explained by the model increases slightly (from 86% to88%), all the nonlinear terms are statistically significant. Moreover, including nonlinear effectsprovides a more nuanced view of consumer behavior.
For example, as Figure 7 illustrates, while Napa cabernet sauvignons still enjoy a significantadvantage over Sonoma produced cabernet sauvignons, this advantage diminishes as ratingsincrease. For example, at a rating of 80, Napa cabernet sauvignon enjoys a premium of 165%over equivalently ranked cabernet sauvignon from Sonoma. However, for cabernet sauvignonrated at 90, the Napa premium falls to 45%. And, as the ratings increases to 94, the Napapremium virtually disappears. Moreover, as the effect of region diminishes, the effect ofratings on price increases as you move up to higher price segments. This last effect is similarto that of Gibbs et al. (2009) who find that the effects of ratings on price is greater for higherquality wines.
Figure 7. The effect of region and score on price with brand and nonlinear effects.
12 S.S. Cuellar and M. Claps
Dow
nloa
ded
by [
Sono
ma
Stat
e U
nive
rsity
], [
Stev
en S
. Cue
llar]
at 0
9:06
04
Febr
uary
201
3

Table 6. Fixed brand effects: Napa cabernet sauvignon.
Coefficient Brand
2.13 Opus One1.65 Beaulieu Vineyard BV1.64 Far Niente1.51 Diamond Creek1.47 Etude1.44 Caymus Vineyards1.43 Bennett Lane1.37 Hewitt Vineyard1.34 Darioush1.16 Chateau Montelena1.14 Shafer1.01 Chimney Rock0.93 Chateau Potelle0.88 Groth0.88 Luna Vineyards0.85 Newton0.80 Chappellet0.74 Turnbull0.72 Whitehall Lane Winery0.61 Sbragia Family Vineyards0.59 Mount Veeder0.59 Provenance Vineyards0.55 Hall0.55 Cuvaison0.49 Honig0.48 Terra Valentine0.48 Merryvale0.47 Steltzner0.46 Signorello0.46 Clos Pegase0.45 Stags’ Leap0.42 Buehler0.39 St Clement0.39 Artesa0.37 Rutherford Ranch0.32 Monticello0.30 Sterling Vineyards0.26 Burgess0.22 Conn Creek0.12 Flora Springs0.08 Franciscan0.02 Bennett Family20.02 White Oak Vineyards20.04 Martin Ray20.04 Summers20.09 Hawkstone20.10 Louis M Martini20.21 Hess20.50 Big Ass Cab20.64 Pavilion20.68 Castle Rock21.14 Kirkland RanchBase Andretti
Journal of Wine Research 13
Dow
nloa
ded
by [
Sono
ma
Stat
e U
nive
rsity
], [
Stev
en S
. Cue
llar]
at 0
9:06
04
Febr
uary
201
3

Two explanations can be posited for the nonlinear effects. Consumers could view brand,region, and ratings differently at lower prices than at higher prices. Or alternatively, consumersdiffer at lower prices than at higher prices. That is, the differential effects of ratings, region,and brand are attributed to unobserved heterogeneity among wine consumers at different pricesegments. This would be true if, for example, at the lower price segments consumers are relativelyuninformed about wine ratings and brands and view ‘Napa’ as the main signal of quality.However, as wine consumers become more informed about their wine purchases, brand andratings become more influential in affecting willingness to pay.
For zinfandels, the nonlinear regression results are similar to the results we obtained pre-viously. Although the nonlinear terms are statistically significant, they do not meaningfullychange the relationship between the Napa and Sonoma hedonic price–score functions. Thehedonic price–score function for Sonoma zinfandel is flatter than the hedonic price–score func-tion for Napa zinfandel indicating that the marginal effect of score exerts a greater influence on theprice for Napa zinfandels than on Sonoma zinfandels. Similar to the linear model, the hedonicprice–score functions cross at a score of approximately 86 compared to 85 in the linear model.Specifically, at scores of 86 and below, Sonoma zinfandels enjoy a small premium; while for zin-fandels rated above 86, Napa zinfandels enjoy a premium.
The results for zinfandel are consistent with the idea that zinfandel consumers represent anentirely different market segment of consumers than cabernet sauvignon consumers. For instance,while cabernet sauvignon consumers represent a relatively heterogeneous group of consumers,zinfandel consumers represent a much more homogeneous group of relatively well informed con-sumers whose willingness to pay is based more on knowledge of individual brands than on ratingsand region.
Table 7. Fixed brand effects: Sonoma cabernet sauvignon.
Coefficient Brand
2.12 Chalk Hill1.66 Mantra1.64 Wattle Creek1.48 Moon Mountain1.47 Souverain1.46 Ferraricarano1.33 Schug1.32 Fritz Winery1.28 Simi1.18 Clos DU Bois1.18 Frei Brothers1.08 Lake Sonoma1.04 Kendall-Jackson1.03 Benziger1.03 Dry Creek Vineyard1.01 Franciscoppola0.96 Sebastiani0.92 Geyser Peak0.89 Parkers Estate0.77 Pedroncelli0.62 Angeline0.43 Stonehedge0.33 Sonoma Creek
14 S.S. Cuellar and M. Claps
Dow
nloa
ded
by [
Sono
ma
Stat
e U
nive
rsity
], [
Stev
en S
. Cue
llar]
at 0
9:06
04
Febr
uary
201
3

Finally, Tables 6–9 include the regression coefficients for the brand fixed effects ordered bymagnitude. As can be seen, Opus One has the strongest brand effect for the Napa cabernetsincluded in the sample, while Chalk Hill has the strongest brand effect among Sonoma cabernet
Table 8. Fixed brand effects: Napa zinfandel.
Coefficient Brand
1.66 Grgich Hills1.65 Beaulieu Vineyard BV1.64 Storybook Mountain Vineyards1.59 Brown Estate1.49 Frank Family Vineyards1.16 Chateau Montelena1.08 Girard1.00 Napa Cellars0.97 Screw Kappa Napa0.42 Buehler0.37 Rutherford Ranch
Table 9. Fixed brand effects: Sonoma zinfandel.
Coefficient Brand
2.16 Martinelli1.63 Rosenblum Cellars1.48 Ridge1.47 Hartford1.46 Ferrari-Carano1.32 Dashe1.32 Fritz Winery1.19 Quivira1.19 Haywood1.18 Sausal1.18 Clos Du Bois1.17 St Francis1.14 Artezin1.08 Ravenswood1.08 Lake Sonoma1.03 Plungerhead1.03 Dry Creek Vineyard1.02 Cline1.02 Kenwood1.01 Francis Coppola1.01 Rancho Zabaco1.00 Mia’s Playground0.98 Big Ass Zin0.96 Pezzi King0.94 Valley of the Moon0.93 Hayman & Hill0.89 Parkers Estate0.80 Rodney Strong0.77 Pedroncelli0.76 Mazzocco0.56 De Loach
Journal of Wine Research 15
Dow
nloa
ded
by [
Sono
ma
Stat
e U
nive
rsity
], [
Stev
en S
. Cue
llar]
at 0
9:06
04
Febr
uary
201
3

sauvignons. For zinfandels, Grgich Hills has the strongest brand effect among Napa brands whileMartinelli has the strongest brand effect among Sonoma zinfandels in the sample.
Discussion
Our results show that product characteristics can have vastly different effects on consumers’ will-ingness to pay both across and within product categories for a single good. In particular, we showthat product characteristics such as brand, ratings, and region can have either a large and signifi-cant effect on willingness to pay or no effect at all, when examined by market segment
We use a unique data set to quantify the effects of brand, region, and ratings on the willingnessto pay for wines produced from Napa and Sonoma Counties. To isolate the effect of brand andregion on price, we use Wine Spectator ratings to control for quality and compare wines producedin Napa with similarly ranked wines produced in Sonoma. With respect to region, we consistentlyfind a positive and statistically significant premium for Napa cabernet sauvignon over equiva-lently rated Sonoma County cabernet sauvignon, although this premium diminishes once weinclude brand and nonlinear effects. We attribute the differential effects of ratings, region, andbrand to unobserved heterogeneity among wine consumers at different price segments andacross varietals. Specifically, we posit that wine consumers at the lower price segments are lessfamiliar with wine ratings and brands and use ‘Napa’ as the main signal of quality. However,as we move up the price spectrum, we posit that wine consumers become more informedabout individual brands and ratings and thus these become more influential in affecting willing-ness to pay.
We also find that zinfandels consumers represent a separate market segment unto themselves.That is, zinfandel consumers appear to represent a relatively well-informed market segmentaffected more by individual brand than by ratings or region. This is in contrast with either lowor high priced cabernet sauvignon consumers who respond more to region and ratingsrespectively.
While our methodology is quite general, our results are limited in their application: tworegions and two varietals. In addition to the number of regions and varietals, the choice ofNapa and Sonoma themselves are unique and our results may not be generalizable to otherregions and varietals. A further limitation is the exclusion of appellation. Within Napa andSonoma are sub-appellations or American Viticultural Areas which may also affect price.Future research using the same methodology can examine difference among other regions, differ-ence among other varietals, and difference among smaller sub-appellations within regions.
Conclusion
From a practical standpoint, the managerial implications of this study are clear and are importantto wine producers and marketers who operate in markets with significant product differentiationand consumer heterogeneity. Our results show that product characteristics can have vastly differ-ent effects on consumers’ willingness to pay both across- and within-product categories for asingle good. While product characteristics such as brand, ratings, and region can have oneeffect on willingness to pay in one market segment, those effects can differ drastically inanother market segment.
AcknowledgementsThe authors would like to thank participants at Sonoma State University’s Department of EconomicsSeminar Series as well as participants at the Fourth Annual Meeting of the American Association of Wine
16 S.S. Cuellar and M. Claps
Dow
nloa
ded
by [
Sono
ma
Stat
e U
nive
rsity
], [
Stev
en S
. Cue
llar]
at 0
9:06
04
Febr
uary
201
3
Economists at the University of California at Davis in Davis, California, for helpful comments. We wouldalso like to thank Sonoma State University’s Wine Business Institute for funding this research.
Notes1. Hodgson (2008).2. Carew and Florkowski (2008) use retail level data provided by a distributor to examine the affect of
weather on price and ratings of wines.3. Steiner (2004) uses similar Nielsen scan data to estimate hedonic price functions but does not include
ratings data.4. www.winespectator.com5. This may be especially true for Napa and Sonoma wines if there is very little year to year variation. See
Ramirez (2008) for an elaboration on this point.6. Private correspondence with scan data providers reveal that they are unable to provide vintage in the
product description because wine producers often re-use sku’s for subsequent vintages.7. The actual Napa premium at a score of 85 is 0.2%.
ReferencesAl-Sulaiti, K.I., & Baker, M.J. (1998). Country of origin effects: A literature review. Marketing Intelligence
& Planning, 16(3), 150–184.Carew, R., & Florkowski, W.J. (2008). The importance of Australian corporate brand and grape varietal
wines: Hedonic pricing in the British Columbia wine market. Journal of Wine Economics, 3(2),194–204.
Dubois, P. & Nauges, C. (2005). Identifying the effect of unobserved quality and experts’ reviews in thepricing of experience goods: Empirical application on Bordeaux wine (Working Paper). Toulouse,France: University of Toulouse.
Gibbs, M., Tapia, M., & Warzynski, F. (2009). Globalization, superstars and reputation: Theory and evidencefrom the wine industry. Journal of Wine Economics, 4(1), 46–61.
Goldstein, R., Almenberg, J., Dreber, A., Emerson, J., Herschkowitsch, A., & Katz, J. (2008). Do moreexpensive wines taste better? Evidence from a large sample of blind tastings. Journal of WineEconomics, 3(1), 1–9.
Hadj Ali, H., Lecocq, S. & Visser, M. (2007). The impact of gurus: Parker grades and En Primeur wineprices. (AAWE Working Paper No. 1). New York, NY: American Association of Wine Economists.
Hadj Ali, H. & Nauges, C. (2004). Reputation and quality effects in the pricing of experience goods: Thecase of En Primeur wine (Working Paper). Toulouse, France: INRA-LEERNA. University ofToulouse. INRA-LEERNA.
Hoch, S.J., Kim, B.D., Montgomery, A.L., & Rossi, P.E. (1995). Determinants of store-level price elasticity.Journal of Marketing Research, 32, 17–29.
Hodgson, R.T. (2008). An examination of judge reliability at a major U.S. wine competition. Journal of WineEconomics, 3(2), 105–113.
Jones, G.V., & Storchmann, K.H. (2001). Wine market prices and investment under uncertainty: An econo-metric model for bordeaux crus classes. Agricultural Economics, 26, 115–133.
Landes, W.M., & Posner, R.A. (1987). Trademark law: An economic perspective. Journal of Law andEconomics, 30(October), 265–309.
Milgrom, P., & Roberts, J. (1986). Price and advertising signals of product quality. Journal of PoliticalEconomy, 94(August), 796–821.
Park, C.W., MacInnis, D.J., Priester, J., Eisingerich, A.B., & Iacobucci, D. (2010). Brand attachment andbrand attitude strength: Conceptual and empirical differentiation of two critical brand equity drivers.Journal of Marketing, 4(1), 1–17.
Plassmann, H., O’Doherty, J., Shiv, B., & Rangel, A. (2008). Marketing actions can modulate neural rep-resentations of experienced pleasantness. Proceedings of the National Academy of Sciences of theUnited States, 105(3), 1050–1054.
Ramirez, C.D. (2008). Wine quality, wine prices and the weather: Is Napa ‘different’. Journal of WineEconomics, 3(2), 114–131.
Journal of Wine Research 17
Dow
nloa
ded
by [
Sono
ma
Stat
e U
nive
rsity
], [
Stev
en S
. Cue
llar]
at 0
9:06
04
Febr
uary
201
3

San Martın, G.J., Brummer, B., & Troncoso, J.L. (2008). Determinants of argentinean wine prices in theU.S. market (AAWE Working Paper No. 15). New York, NY: American Association of WineEconomists.
Schamel, G. (2000). Individual and collective reputation indicators of wine quality (CIES Policy DiscussionPaper No. 0009). Adelaide, South Australia: University of Adelaide, Centre for International EconomicStudies.
Schamel, G. (2004, September 27–29). German wine: Measurement and evaluation of product quality.Paper presented at 44th annual meeting of the GeWiSoLa, Berlin.
Schamel, G., & Anderson, K. (2003). Wine quality and varietal, regional, and winery reputations: Hedonicprices for Australia and New Zealand. Economic Record, 79(246), 357–369.
Schamel, G. (2009). Dynamic analysis of brand and regional reputation: The case of wine. Journal of WineEconomics, 4(1), 62–80.
Steiner, B.E. (2004). Australian wines in the British market: A hedonic price analysis. Agribusiness, 20,287–307.
Sullivan, M.W. (1998). How brand names affect the demand for twin automobiles. Journal of MarketingResearch, 35(2), 154–165.
Troncoso, J.L., & Aguirre, M. (2006). Price determinants of Chilean wines in the U.S. market: A hedonicapproach. The Spanish Journal of Agricultural Research, 4(2), 124–129.
Veale, R., & Quester, P. (2008). Consumer sensory evaluations of wine quality: The respective influence ofprice and country of origin. Journal of Wine Economics, 3(1), 10–28.
18 S.S. Cuellar and M. Claps
Dow
nloa
ded
by [
Sono
ma
Stat
e U
nive
rsity
], [
Stev
en S
. Cue
llar]
at 0
9:06
04
Febr
uary
201
3