Differences in Surplus-value Rates between Developed and Underdeveloped · PDF...
31
Differences in Surplus-value Rates between Developed and Underdeveloped Countries 175 Previous findings by Martínez have raised an important question, which this work contributes to solve: if over time a positive correspondence between productivity and surplus-value rate can be observed ¿why then do under- developed countries show higher surplus-value rates than developed countries? Based on econometric analysis, cluster analysis and fixed effect panel analysis evidence is supporting that groups of less productive countries have higher or at least not lower surplus-value rates than those corresponding to more productive groups of countries. Nevertheless, it is also shown that over time or within the groups there is a correlation between productivity and surplus-value rate. A feasible explanation of such national differences of surplus-value rate is examined considering organic composition of capital. ¿How does importing means of production affect such a composition and hence surplus-value rate in underdeveloped countries? An account is examined based on value theory and such composition is estimated in the case that means of production are imported. MARXISM 21 Feature Differences in Surplus-value Rates between Developed and Underdeveloped Countries : An analysis based on differences in productivity and capital composition * B. Gloria Martínez González ** and Alejandro Valle Baeza *** Keywords: Exploitation, value, surplus, productivity, organic composi- tion of capital. * Special thanks are due to anonymous referies. As usual all the remaining errors are our responsibility. This research was developed in the context of the project “Differences in surplus-value rates between countries and their relation to differences in productivity. New evidence: Brasil, Argentina, and Chile”, sponsored by the Program
Transcript of Differences in Surplus-value Rates between Developed and Underdeveloped · PDF...

Differences in Surplus-value Rates between Developed and Underdeveloped Countries 175
Previous findings by Martiacutenez have raised an important question which this work contributes to solve if over time a positive correspondence between productivity and surplus-value rate can be observed iquestwhy then do under-developed countries show higher surplus-value rates than developed countries
Based on econometric analysis cluster analysis and fixed effect panel analysis evidence is supporting that groups of less productive countries have higher or at least not lower surplus-value rates than those corresponding to more productive groups of countries Nevertheless it is also shown that over time or within the groups there is a correlation between productivity and surplus-value rate
A feasible explanation of such national differences of surplus-value rate is examined considering organic composition of capital iquestHow does importing means of production affect such a composition and hence surplus-value rate in underdeveloped countries An account is examined based on value theory and such composition is estimated in the case that means of production are imported
MARXISM 21
Feature
Differences in Surplus-value Rates between Developed and Underdeveloped Countries
An analysis based on differences
in productivity and capital composition
B Gloria Martiacutenez Gonzaacutelez and Alejandro Valle Baeza
Keywords Exploitation value surplus productivity organic composi-
tion of capital 3)4 )5)
Special thanks are due to anonymous referies As usual all the remaining errors are our responsibility This research was developed in the context of the project ldquoDifferences in surplus-value rates between countries and their relation to differences in productivity New evidence Brasil Argentina and Chilerdquo sponsored by the Program
176 2011년 제8권 제1호
1 Introduction
Previous findings by Martiacutenez and other authors have shown that sur-
plus-value rate in underdeveloped is higher or at least similar to that in de-
veloped countries The higher productivity in developed countries should
produce a clearly superior surplus-value rate compared to underdeveloped
countries there should be a correspondence between productivity and sur-
plus-value rate That kind of correspondence exists over time or between
productivity and surplus-value rate within blocks of developed and under-
developed countries but not between blocks This works is a contribution to
the explanation of this inconsistency
The second section of this work discusses why surplus-value rate should
increase over time or be higher in developed countries than in under-
developed countries The third and fourth sections examine the empirical
evidence of the differences in surplus-value rate between countries with dif-
ferent degrees of productivity The fifth section presents the empirical evi-
dence found to sustain the explanation of the higher surplus-value rate in un-
derdeveloped countries value composition of capital is much higher than
price composition of capital Because underdeveloped countries import a
great share of their means of production a value should be imputed to them
So section 5 explains how and why such an imputation is calculated Value
composition measures the difficulty to accumulate and therefore labor force
is harder to absorb in underdeveloped countries where a higher surplus-value
towards the Improvement of the Faculty SEP (Federal Public Education Agency) Mexico
Professor and researcher at the Economics Department of the Universidad Autoacutenoma Metropolitana unidad Iztapalapa bglormprodigynetmx
Professor and researcher at the Posgraduate Division of the Economics School of the Universidad Nacional Autoacutenoma de Mexico valleservidorunammx
Differences in Surplus-value Rates between Developed and Underdeveloped Countries 177
rate is thus required and made possible Finally in the last section con-
clusions are presented
2 Surplus-value rate and productivity according to general law
of capitalist accumulation
In his ldquoGeneral Law of Capitalist Accumulationrdquo Marx stated that there is
a trend towards increasing organic composition of capital and consequently a
relative overpopulation follows Capitalism produces massive quantities of
available unemployed workers an industrial reserve army (IRA) allowing
for accumulation in the branches where an accelerated growth is possible
without the restraint a shortage of labor force would impose Furthermore
IRA is crucial in limiting wages and regulating active labor force If accu-
mulation were to occur with a steady or decreasing organic composition nat-
ural growth of labor force would limit capital growth because capitalists
would have to accumulate adjusting capital increase to labor force growth In
short ldquoGeneral Law of Capitalist Accumulationrdquo (GLCA) states that a capi-talist raise in productivity calls for an increased organic composition of
capital
An increase in organic composition will decrease the profit rate unless a
raise in surplus-value rate results in compensating the effect Then growth in
organic composition turns into an obstruction to accumulation whilst in-
creases in surplus-value rate encourage it Debates on the behavior of profit
rate have not yet been settled in Marxist theory and go beyond the aim of
this work Nonetheless it must be made clear that tendencies which work
against the falling rate of profit belong to a more concrete level of analysis
For example the relationship between productivity in wage goods and
changes in real wage remains within the behavior of surplus-value rate
178 2011년 제8권 제1호
This interpretation of the GLCA explains Marxist assumption on sur-
plus-value rate and productivity among different countries capital accumu-
lation entails a growth in productivity organic composition and surplus-val-
ue rate Capitalist development requires an increase in organic composition
of capital which itself calls for a growth in surplus-value rate in order to bal-
ance its negative effect on profit rate Therefore it is reasonable to expect a
direct correspondence between surplus-value rate and productivity because it
is perfectly possible to assume that more productive countries have a higher
volume of means of production in value against living labor and thus they
require a higher surplus-value rate than the one prevailing in less productive
countries with a lower organic composition Consequently according to our
interpretation Marxrsquo assumption is a necessary conclusion to the GLCA
To say that in mathematical terms
When there is no fixed capital it can be proved that
gt rarr acute gt acuteWhere θi is VCC value composition of capital of country i defined as
c(p+v) and not as the usual way sacutei is the rate of surplus value of country i1)
Thus a country with a higher VCC requires a higher rate of surplus value
1) In order to prove that gt rarr acute gt acute it is necessary to rewrite the rate of profit as = + 1 minus
where θ and sacute are as defined in the text and σ=s(s+v) s is the surplus value and v is the variable capital Assuming equal profit rates between countries the following is obtained
σA(θB+1)= σB(θA+1) from which followsFrom this inequity it easily follows the inequity looked after since
Differences in Surplus-value Rates between Developed and Underdeveloped Countries 179
to attain the same rate of profit than a country with a lower VCC
We will now explain how in certain circumstances capitalist reality con-
tradicts a direct correspondence between productivity and surplus-value rate
even though other circumstances do allow for that kind of behavior
3 Previous findings on the relationship between surplus-value
rate and productivity between different countries
1) Background
Mexico and the United StatesMartiacutenez compared surplus-value rates between a developed country and
an underdeveloped country She used her own calculations of monetary sur-
plus-value rate for non-agricultural economy in Mexico as well as calcu-
lations made by Fred Mosely (1991) of the surplus-value rate in the United
Statesrsquo economy as a whole She showed that surplus-value rate in the
United States was lower than that of Mexico between 1960 and 1987 as
shown in Figure 1 The ratio between both rates remained 2 to 1 until 1982
This ratio increased to 3 to 1 in the following years until 1987
ManufacturingMartinez (1999b) assessed surplus-value rates in the manufacturing in-
dustry in 20 countries throughout a year Based on contingence tables she
sorted out two blocks of countries one with high productivity and low sur-
plus-value rate and another one with low productivity and high surplus-val-
ue rate She found that between blocks the higher the productivity the lower gt rarr acute gt acute
180 2011년 제8권 제1호
Figure 1
Source Own elaboration based on Gloria Martiacutenez (1996 and 1999)
surplus-value rate and within blocks a higher productivity corresponded to
a higher surplus-value rate Accordingly the results suggested that workers
in underdeveloped countries were submitted to more exploitation than work-
ers in developed countries Based on square chi tests which will be dealt
with below those results would later be reinforced
It must be stressed that these results do not fully contradict the validity of
Marxrsquo idea that the higher the productivity the higher the surplus-value rate
rather they partially confirm it because this relationship is found within
blocks of countries
Whole economiesIn the same work of Martiacutenez (1999b) surplus-value rates of whole econo-
mies were assessed Only five countries were studied for a period of several
years including just Mexico as an underdeveloped country The results con-
Differences in Surplus-value Rates between Developed and Underdeveloped Countries 181
Figure 2
Source Taken from Gloria Martiacutenez (199b167)
Figure 3
Source Taken from Gloria Martiacutenez (1999b168)
182 2011년 제8권 제1호
firmed the findings attained in manufacturing that Mexico the under-
developed country was detached from developing countries as a country
with low productivity and high surplus-value rate and that among developed
countries the most productive ones had higher surplus-value rates than less
productive countries This can be observed in figures 2 and 3
2) Statistical tests
Square chi tests from the relationship between wage share and productivityAs above mentioned the inverse relationship between productivity and
surplus-value rates in countries with very unequal productivity levels oc-
curred in the economies of Mexico and the United States From this evalua-
tion an apparently useful idea came up maybe wage share would allow for
similar conclusions comparable to the ones drawn from surplus-value rate
Wage share could be a proxy variable of relative wage which maintains an
inverse correspondence with surplus-value rate So Martiacutenez (2006) decided
to use wage share a variable inversely related to surplus-value rate
Because the analysis was redirected towards the relationship between
wage share and productivity it was possible to include many more countries
With that approach observations increased dramatically since it was possible
to use data collected by the United Nations from national accounts of 63 to
100 countries depending on the year of the research The relationship be-
tween productivity and wage share has been assessed a relationship that was
assumed to be positive between blocks of countries defined by productivity
levels That relationship is considered a sign showing that workers in under-
developed countries endure more exploitation or that surplus-value rate is
higher than in developed countries
The results based on square chi tests show that statistically low pro-
ductivity countries have low wage shares while high productivity countries
Differences in Surplus-value Rates between Developed and Underdeveloped Countries 183
High productivity Low productivity
Low wage share 8 23
High wage share 24 8
Source Own elaboration based o Penn World Table Mark 51 y 61 and United Nations (1978 and 1999)
Table 1 Contingency Table
wage share and high or low productivity in 63 countries 1994
have high wage shares These results are coincidental with the previous
ones which clearly show that the relationship between productivity and
wage share between blocks of countries with low or high productivity is the
opposite of what would be expected according to Marxist theory of
accumulation That is to say assuming that wage share is an approximate
variable of the reciprocal of surplus-value rate this turns out to be higher in
countries with low productivity and low wage share as compared to that of
countries with high productivity and high wage share These results are
shown in Table 1
Furthermore based on three productivity levels the following differences
in wage share between countries have been found (1) countries with high
productivity and high wage shares (2) countries with low productivity and
low wage shares and (3) countries with medium productivity equally dis-
tributed between countries with high or low wage shares
Cluster analysis of the relationship between wage share and productivityThe grouping of countries given by the cluster analysis matches the one
based on purely economic criteria used in square chi analysis especially
with regard to developed countries So results of the cluster analysis are con-
sistent with the previous assuming that wage share is an approximate varia-
184 2011년 제8권 제1호
ble of the reciprocal of surplus-value rate wage share is lower (or the recip-
rocal of wage share surplus-value rate is higher) in countries with low pro-
ductivity than in countries with high productivity
According to the analysis of the 1994 data there are three clusters the
first two correspond almost totally to both groups countries with high pro-
ductivity and high wage share and countries with low productivity and low
wage share The third cluster includes countries that combine high or low
productivity with high or low wage share (The dendrogram and the corre-
sponding lists of countries are shown in the appendix)
A regression panel analysis with fixed effects of the relationship between
surplus-value rate and productivitySurplus-value rates and productivities have been assessed directly An
econometric analysis was made based on estimates of surplus-value rate by
different authors for the corresponding seven countries studied and on esti-
mates of purchasing power parity productivity taken from Penn World Table
Mark 61 The technique of fixed effects panel for a sample of seven coun-
tries was used
The analysis proves that there is a positive relationship between sur-
plus-value rate and productivity over time On the other hand it supports
previous findings by Martiacutenez what should be consistent with accumulation
theory is not so Surplus-value rate in underdeveloped and less productive
countries (Mexico and Venezuela) is not lower than that in developed coun-
tries (United States United Kingdom New Zealand and Japan) except for
Canada and Japan with respect to Venezuela This is shown in the corre-
sponding section of Figure 5
Differences in Surplus-value Rates between Developed and Underdeveloped Countries 185
a) Including unadjusted surplus-value rate in Mexico
Based on this model a positive relationship can be found between sur-
plus-value rate and productivity in all the assessed countries over time Also
levels of surplus-value rate differ individually in particular the one corre-
sponding to Mexico with respect to that of the other countries Assuming the
same changes in surplus-value rate facing productivity changes in each
country surplus-value rate in Mexico turns out to be considerably higher
than those of other countries Therefore both assumptions are supported the
positive relationship between surplus-value rate and productivity according
to Marxist accumulation theory and our assumption that underdeveloped
countries with low productivity have a high surplus-value rate in the group
of countries formed by Mexico the United States Canada United Kingdom
New Zealand and Japan
b) Including adjusted surplus-value rate in Mexico and Venezuela
According to Martiacutenez (2005) in order to adjust operation surplus in
Mexican national accounts through the exclusion of the income of self-em-
ployed workers it has been considered convenient to deal with National
Accounts by Institutional Sectors It has been found that in a disaggregated
level by economy sectors there is not a perfect match with the National
Accounts System so the data from this system had to be adjusted according
to the Institutional Accounts System
Regarding Venezuela the non-oil surplus-value rate was taken and an ad-
justment was made similar to Mexicorsquos based on estimates by Juan Mateo
(2003)
According to the results of this analysis the existence of self-employed
workers changes the level of surplus-value rate in Mexico Nonetheless a
previous conclusion still stands Mexico the underdeveloped country is
186 2011년 제8권 제1호
USA Canada UK New Zealand Japan Mexico Venezuelaα 047 181 035 047 14 24 066αMex αi 511 133 686 511 171 1 363Source Gloria Martiacutenez (2006 table 2 in appendix 5)
Table 2 Regression panel analysis with fixed effects α estimate
Period 1950-2000
more exploited than the United States the developed country The results
based in the regression panel analysis with fixed effects confirm the positive
relationship between surplus-value rate and productivity over time in line
with Marxist theory of accumulation but they do not confirm the assump-
tion inferred from the same theory according to which underdeveloped coun-
tries less productive have a lower surplus-value rate than developed coun-
tries more developed the results partially confirm our assumption that the
underdeveloped countries with low productivity have a high surplus-value
rate proven by the case of Mexico and only partially supported by the case
of Venezuela since it is confirmed with respect to the United States the
United Kingdom and New Zealand but not regarding Canada and Japan
(see Table 2)
Martiacutenez (2005) assesses some theoretical and empirical aspects of the
problem of the income of self-employed workers in the estimates of sur-
plus-value rates The methodology in Shaikh and Tonak (1994) is examined
stating that such an approach is mistaken with regard to that income because
it allocates it between variable capital and surplus in order to estimate sur-
plus-value rate Authors using that methodology handle independent work as
exploited work based on practical considerations and not on theoretical
reasons The present study shares the alternative approach the one used by
`Guerrero (1989) and Caacutemara (2003) according to which independent work-
Differences in Surplus-value Rates between Developed and Underdeveloped Countries 187
Figure 4
Source own elaboration based on Penn World Table Mark 63
ersrsquo income is neither variable capital nor surplus value so in order to esti-
mate surplus-value rate it is necessary to leave that income out of the
analysis
The results seem to contradict Marxrsquo faultless logic higher productivity
needs a higher organic composition and that requires a higher surplus-value
rate Why then are surplus-value rates empirically higher than those of coun-
tries with significantly higher productivity This question came out much
more firmly stated after the previously explained tests
In what follows we will advance in verifying if previous results presented
here are a norm and not an exception in contemporary capitalism as well as
in giving an answer to the above question in order to try to understand why
capitalism works that way
188 2011년 제8권 제1호
Figure 5
Source Own elaboration based on Martiacutenez (2006 chap V) Moseley (1991) Murray (1993) Cockshott (1995) Kalmans (1992) Cronin (1998) Mateo (2003) Bahena (2010) and Ocantildea (2010)
4 About new evidence Argentina and Chile
It has been found that productivities in Argentina and in Chile correspond
to the pattern of differences observed between Mexico Venezuela and de-
veloped countries (Martiacutenez 2006) Differences in productivity are clear be-
tween Latin American underdeveloped countries and developed countries
(discontinuous lines) the gap between both groups has become wider more
notably in the 1980s as shown in Figure 42)
On the other hand estimations of the rate of surplus-value by Bahena
2) We wish to thank Bernardo Bahena for his support in gathering and systematizing in-formation on productivity for the analysis presented here
Differences in Surplus-value Rates between Developed and Underdeveloped Countries 189
(2010) and Ocantildea (2010)3) in Argentina and Chile respectively support the
findings by Martiacutenez (1999 2005 2006) according to which surplus-value
rate in underdeveloped countries is higher than that of developed countries con-
trary to what might be assumed according to the theory The reason of this
will be advanced in the next section
Such estimations of surplus-value rate in Argentina and Chile are analo-
gous to those of Mexico as to non-productive labor and independent labor
That is they are consistent with the adjusted surplus-value rate in Mexico
The results are shown in Figure 5
5 An explanation based on differences in capital composition
1) Capital composition in underdeveloped countries
Valle (2008) gives empirical evidence of the size of the industrial reserve
army and its growing pauperization in underdeveloped countries Character-
istic of this gap is that IRA is larger in underdeveloped countries Theory of
value is used as a basis to state that the value composition of capital is likely
to be higher in an underdeveloped country than in a developed one that it
costs more to exploit a worker in the former than in the latter Importing a
great percentage of its means of production and exporting products made in con-
ditions of less productivity make means of production more expensive in labor in
the underdeveloped country than in the developed one This means that in under-
3) These investigations as well as that of Vicario (2010) referred to below have been de-veloped in the context of the project ldquoDifferences in surplus-value rates between countries and their relation to differences in productivity New evidence Brasil Argentina and Chilerdquo under the direction of B Gloria Martiacutenez Gonzaacutelez with the collaboration of Alejandro Valle Baeza
190 2011년 제8권 제1호
developed countries capitalism faces greater difficulties to exploit all the
available working force than in developed countries
According to Valle (2008 117) the relationship between market price and
value is defined in equation 1
μελ i
iiP=
(1)
where λi is the value of the commodity i μ is the monetary expression of
value and εi is the divergence or error due to organic composition and to
disparities between supply and demand Following that definition the price
divided by the monetary expression of value gives the approximate value of
a commodity Estimating the value of a basket of commodities makes errors
disappear to a certain degree
So value composition of capital can be estimated based on price composi-
tion of capital divided by monetary expression of value4)
The above is true for any commodity produced in a national economy
What happens on the international level Perhaps a complete approach to
this problem should be the subject of a book Here only part of the problem
will be approached ie what do disparities in productivity mean when a com-
modity is imported An example with numbers can show the central ideas
Consider two countries An advanced one A and an underdeveloped one
B Both produce grain with values of 1 and 2 labor units per grain unit re-
spectively (λGA and λGB) Country A also produces fertilizers with a value
of 3 labor units per each fertilizer unit λFA Grain prices in each country are
10 and 5 monetary units of each country per grain unit (pGA pGB) The price
of fertilizers in country A is 30 pFA The exchange rate which equals grain
4) A development on monetary expression of value values and prices is shown in Valle (1997)
Differences in Surplus-value Rates between Developed and Underdeveloped Countries 191
Variable A Country B CountryλG 1 2μ 10 25pg 10 5pf 30 15λf 3 6
Table 3
prices is a monetary unit from B which amounts to two monetary units from
A This exchange rate illustrates a fact in international economy national
prices can not differ much from international prices This exchange rate is
the rate of purchasing power parity (PPP) because with it the monetary unit
in each country can purchase the same amount of commodity in both
countries
With this exchange rate monetary expression of value in country B is 5
monetary units from A And as Marx clearly foresaw this variable is the
maximum wage in which profit would be zero In our example maximum
wage in country B is half the one in country A both of course in the same
monetary unit This shows that productivity in country B is half the one in A
country
If we estimate the value of the fertilizer with the monetary expression of B
and the price of the imported fertilizer with PPP we get an imputed value of
the imported product which is twice the value of the fertilizer in country A
That is matching prices mean that the purchasing power of the residents in
each country reflect the differences in productivity even in imported goods
Thus we can see why means of production must be more expensive in an un-
derdeveloped country that imports them The following table resumes the
data and results from the example
192 2011년 제8권 제1호
Generalization of the above for n commodities does not give further in-
sight nor offers insurmountable difficulties so we put it aside It is a very
simple idea but it bears important implications to understand international
economics Let us now see how it works in the empirical domain
2) A previous analysis of differences in composition of capital
In order to estimate value composition of capital (VCC) the definition of
Valle (2008) is adopted and data in Penn Word Table 56 are used the real
GDP per worker (rgdpw) series as an estimation of the monetary expression
of value and capital stock per worker (kpw)
⎟⎟
⎠
⎞
⎜⎜
⎝
⎛=
trgdpwtkpw
CVCt (2)
That is to say in terms of theory of value we have a ratio total dead la-
borliving labor (See Sources and method estimation of value composition
of capital in Appendix)
In this work it was found that value compositions of capital and Bolivia in
1985 were notably higher in terms of prices they were 91 and 140 of
that of the United States while in terms of prices they barely represented
40 and 23 respectively as shown in Table 4 Next section shows the re-
sults of a larger analysis
Differences in Surplus-value Rates between Developed and Underdeveloped Countries 193
Country Year
Real gross domestic
product per worker (1)
Capital per
worker (2)CVC=21
KL to US ratio
value
KL to US ratio price
Internationaldollars per worker
USA 1985 33783 29925 088580055 100 100Argentina 1985 14955 12084 080802407 912 40
Bolivia 1985 5623 6987 124257514 1403 23Source Valle 2008 120
Table 4 Gross calculation of VCC 1985 (selected countries)
3) An analysis of the differences in composition of capital between
developed and underdeveloped countries
The results of the comparative analysis demonstrate the findings of Valle
(2008) according to which the extent of the differences in compositions of
capital between underdeveloped and developed countries decrease and are
even reversed when such compositions are considered in terms of value5)
Figure 6 shows that price composition of capital (discontinuous lines) in
Mexico Argentina and Chile represented between 30 and 40 of that of
the United States from 1965 to 1992 while the one from Venezuela was be-
tween 70 and 80 of that of the US before the 1980s In contrast value
compositions in the former represented between 70 and 90 of that of the
US while in Venezuela it was up to 20 higher since the late seventies
Even more relevant is that the pattern of the differences in the value com-
position of capital between these Latin American countries and the United
5) We wish to thank Liliana Vicario Subdiacuteaz for her support in gathering and systematiz-ing information for the estimations of compositions of capital included here
194 2011년 제8권 제1호
Figure 6
Source Own elaboration based on Penn World Table Mark 56
Figure 7
Source Own elaboration based on Penn World Table Mark 56
Differences in Surplus-value Rates between Developed and Underdeveloped Countries 195
Figure 8
Source Own elaboration based on Penn World Table Mark 56
States is demonstrated in a larger sample of countries
On the basis of the evidence examined so far price composition of capital
is lower in underdeveloped countries than in developed countries
(discontinuous lines) with a growing gap as shown in Figure 7 On the con-
trary value compositions of capital in underdeveloped countries are notably
similar to those of developed countries as shown in Figure 8
6 Conclusions
This paper advances an explanation of why a reasonable expectation is not
happening Why is there no positive correspondence between productivity
196 2011년 제8권 제1호
and surplus-value rate between countries with considerable differences in
productivity
Summing up the basic idea is between countries a higher productivity is
obtained through a higher value of the means of production used
Accordingly to maintain the rate of profit capital requires a higher sur-
plus-value rate So a higher productivity should correspond with a higher
surplus-value rate
As has been shown that does not occur the blocks of less productive
countries have a higher surplus-value rate or at least not lower than the more
productive countries However within blocks a correspondence does occur
between productivity and surplus-value rate Therefore between blocks of
countries there is at least one variable working which does not work within
blocks
Underdeveloped countries do not manufacture an important part of the
means of production they use This paper has examined Vallersquos assumption
(2008) according to which importing results in more expensive means of
production in the underdeveloped country due to its lower medium
productivity A seemingly difficult aspect is approached within the theory of
value what is the imputed value of imported commodities It is obviously
an imputed value because they are imported commodities why then are they
not worth the same in the exporting and in the importing country
Theoretically the reason is because international differences in productivity
are not mirrored in the prices which should be relatively homogeneous but
in the purchasing power of the populations This is similar to what happens
in a national economy within branches firms producing with different pro-
ductivities have similar or even the same prices but their rates of profit in-
crease with productivity
Here it has been demonstrated that in prices developed countries have
more capital per worker than underdeveloped countries that explains their
Differences in Surplus-value Rates between Developed and Underdeveloped Countries 197
higher productivity At the same time the value of capital per worker in de-
veloped countries is not as high or is even lower than the corresponding vari-
able in underdeveloped countries The value of the imported means of pro-
duction is an imputed value expressing the real purchasing power of capitals
in underdeveloped countries which is the measure of the effort societies
must undertake in order to accumulate Using the terminology from Capital
we could say that technical composition of capital is lower in under-
developed countries than in developed countries but their relationship
changes dramatically with value composition of capital
There is an explanation to why surplus-value rate is higher or similar than
in developed countries the higher composition of capital requires a higher
surplus-value rate which is favored when the ability to absorb working force
is weakened thus producing a larger IRA The existence of a large industrial
reserve army efficiently contributes to raise that rate
(received 2010-12-20 revised 2011-01-11 accepted 2011-01-11)
198 2011년 제8권 제1호
phigh plow All
wshigh 24 8 321625 1575 3200192 -195 -
wslow 8 23 311575 1525 3100-195 198 -
All 32 31 633200 3100 6300
- - -
983787 Appendix
Square chi tests from the relationship between wage share and produc-
tivity 1994
Variableswslevel wage share level
plevel productivity level
Tabulated Statistics wslevel plevel
Rows wsnivel Columns pnivel
Diagnostic Chi-Square = 15246 DF = 1 P-Value = 0000
Differences in Surplus-value Rates between Developed and Underdeveloped Countries 199
Cluster analysisrsquo dendrogram and classified countries
Three clusters Sample of countries in 1994
200 2011년 제8권 제1호
Countries with high productivity and high wage share 1994
Countries with low productivity and low wage share 1994
1 Luxembourg 25 Bostwana 2 The United States 26 Tunisia3 Belgium 27 Panama4 Norway 28 Jordan5 Austria 29 Fiji6 France 30 Namibia7 Switzerland 31 Ecuador8 Canada 32 El Salvador9 Australia 33 Colombia10 Ireland 34 Thailand11 Denmark 35 Paraguay 12 Israel 36 Peru13 United Kingdom 37 Romania14 Sweden 38 Philippines15 Iceland 39 Honduras16 Spain 40 Bolivia17 Finland 41 Papua New Guinea18 Japan 42 Ivory Coast19 Luxembourg 43 Sierra Leone20 Portugal 44 Kenya21 Islands Cayman 45 Nigeria22 Trinidad and Tobago 46 Burundi23 Sudan 47 Tanzania24 UruguayCountries with high productivity and
low wage shareCountries with low productivity and high wage share
48 Italy 56 Poland 49 Greece 57 Turkey 50 Mauritius 58 Costa Rica 51 Mexico 59 Bulgaria 52 Venezuela 60 Iran 53 New Zealand 61 Hungary 54 Slovenia 62 Sri Lanka 55 Russia 63 French Guinea
Table 1A Numbers of countries classified
according to productivity and wage share level
Differences in Surplus-value Rates between Developed and Underdeveloped Countries 201
Regression panel analysis with fixed effects of the relationship
between surplus-value rate and productivity
Dependent variable rate of surplus value Method GLS (Cross Section Weights)Independent variable productivity (P)Sample 1950 2000Included observations 51Number of cross-sections used 7Total panel (balanced) observations 182White Heteroskedasticity-Consistent Standard Errors amp CovarianceVariable Coefficient Std Error t-Statistic ProbP 0032956 0001490 2211974 00000Fixed EffectsEU―C 0475398CAN--C 1813681RU―C 0348390NZ―C 0470685JAP--C 1405849MEX--C 2397509VEN--C 0657718Weighted StatisticsR-squared 0909785 Mean dependent var 2343662Adjusted R-squared 0906155 SD dependent var 1544416SE of regression 0473117 Sum squared resid 3894815
Log likelihood-7032730
Durbin-Watson stat 0193128
Unweighted StatisticsR-squared 0556934 Mean dependent var 1699236Adjusted R-squared 0539110 SD dependent var 0778609SE of regression 0528589 Sum squared resid 4861676Durbin-Watson stat 0116717
Table 2A Estimates and diagnostic
202 2011년 제8권 제1호
Sources and method estimation of value composition of capital
The ratio capital work is generally considered at current prices or at prices
of a basis year When it is divided by the monetary expression of value a
gross estimation of the value composition of capital is obtained
Price composition of capital capital stock per worker (kpw) is taken from
Penn World Table Mark 52 (table 4) or 56 (figures 6-8)
Monetary expression of value real gross domestic product per worker
(rgdpw) is taken from Penn World Table Mark 52 (table 4) or 56 (figures
6-8)
Value composition of capital (VCCt) is calculated according to the follow-
ing equation
⎟⎟
⎠
⎞
⎜⎜
⎝
⎛=
trgdpwtkpw
VCCt
where the subscript t stands for time
Differences in Surplus-value Rates between Developed and Underdeveloped Countries 203
983787 References
Bahena Aguilar B 2010 ldquoProductividad y tasa de Plusvalor en Ameacuterica Latina El caso de Argentinardquo Dissertation for a B A degree Licenciatura en Economiacutea Universidad Autoacutenoma Metropolitana unidad Iztapalapa y ponencia en las III Jornadas de Economiacutea Criacutetica Rosario Argentina
Caacutemara Izquierdo S 2003 ldquoTendencias de la Rentabilidad y de la Acumulacioacuten de Capital en Espantildea 1954-2001rdquo PhD dissertation Universidad Complutense de Madrid Facultad de Ciencias Poliacuteticas y Sociologiacutea Departamento De Economiacutea Aplicada V
Cockshott P Cottrell A and Michaelson G 1995 ldquoTesting Marx Some New Results from UK Datardquo Capital and Class vol 55 Spring pp 103-29
Cronin B 2001 ldquoProductive and Unproductive Capital a Mapping of the New Zealand System of National Accounts to Classical Economic Categories 1972-1995rdquo Review of Political Economy vol 13 no 3 pp 309-27
Devine J 2005 ldquoMarxrsquos Law of Capitalist Accumulationrdquo Loyola Marymount University httpmyweblmuedujdevine January 18 2005
Guerrero Jimeacutenez D 1989 ldquoAcumulacioacuten de capital distribucioacuten de la renta y crisis de rentabilidad en Espantildea (1954-1987)rdquo PhD dissertation Universidad Complutense de Madrid Madrid Editorial de la Universidad Complutense de Madrid Coleccioacuten Tesis Doctorales no 8689
_____ 2006 La explotacioacuten Trabajo y capital en Espantildea Chap I Ed Maia Barcelona Spain
Kalmans R 1992 ldquoThe Political Economy of Exploitation A Comparative Study of The Rate of Surplus Value in Japan and The United States 1950-1980rdquo PhD dis-sertation Department of Economics New School for Social Research New York
Martiacutenez Gonzaacutelez B Gloria 1996 ldquoUna comparacioacuten del salario relativo entre Meacutexico y Estados Unidos 1960-1990rdquo Economiacutea Teoriacutea y Praacutectica Nueva Eacutepoca no 6 UAM-X pp 77-86
_____ 1999 ldquoThe Industrial Relative Wage in Mexico 1960-1990rdquo International Journal of Political Economy vol 27 no 4 Winter 1997-98 pp 80-95 ME Sharpe Inc
_____ 1999b ldquoAlgunas evidencias de la superexplotacioacuten em los paiacuteses subdesarrollados Actualidad del pensamento de Marinirdquo Investigacioacuten econoacutemica no 230 vol LIX pp 149-68
_____ 2005 ldquoPlusvalor ingreso de trabajadores autoacutenomos y diferencias nacionales de ta-
204 2011년 제8권 제1호
sas de plusvalorrdquo Problemas del Desarrollo Revista Latinoamericana de Economiacutea vol 35 No 142 July-September pp 11-35
_____ 2006 ldquoDiferencias de tasas de plusvalor entre paiacuteses Su relacioacuten con las diferencias de productividadrdquo PhD dissertation Doctorado en Ciencias Econoacutemicas Universidad Autoacutenoma Metropolitana
Mateo T Juan P 2003 ldquoAnaacutelisis de la evolucioacuten y el papel de la relacioacuten salarial en la econ-omiacutea de Venezuela durante el periacuteodo de crisis y reestructuracioacuten (1979-96)rdquo Research report to receive the Diploma de Estudios Desarrollados from the Dpto de Economiacutea Aplicada Doctorado en Economiacutea Internacional y Desarrollo Facultad de Ciencias Econoacutemicas y Empresariales Universidad Complutense de Madrid
Moseley F 1991 The Falling Rate of Profit in the Postwar United States Economy chapters 2-4 and appendix B New York Macmillan
Ocantildea R C 2010 ldquoTasa de plusvalor en Chilerdquo Dissertation for a BA degree Licenciatura en Economiacutea Universidad Autoacutenoma Metropolitana unidad Iztapalapa
Penn World Table Mark 52 56 61 y 63Shaikh A M and Tonak 1994 Measuring the Wealth of Nations Cambridge University
Press USASmith M E G 1993 ldquoProductivity Valorization and Crisis Socially Necessary
Unproductive Labor in Contermporary Capitalismrdquo Science and Society vol 57 no 3 Fall 1993 pp162-293
United NationsValle B A 1997 ldquoPrices as means of regulating and measuring labor valuesrdquo Research in
Political Economy vol 16 pp 215-241_____ 2008 ldquoWhy capitalism in not exploiting all available labor forcerdquo MARXISM 21
vol 5 no 4 Winter pp 107-123Vicario S L 2010 ldquoPrecarizacioacuten del trabajo en Ameacuterica Latina y su relacioacuten con la com-
posicioacuten de capital El caso de Argentinardquo Dissertation for a B A degree Licenciatura en Economiacutea Universidad Autoacutenoma Metropolitana unidad Iztapalapa and paper for the III Jornadas de Economiacutea Criacutetica Rosario Argentina
Differences in Surplus-value Rates between Developed and Underdeveloped Countries 205
983787 국문 록
선진국과 개발국 사이의 잉여가치율 격차
생산성 자본의 유기 구성의 격차에 기 한 분석
로리아 마르티네스 곤잘 스 middot 알 한드로 바 바에사
이 논문은 마르티네즈의 기존 연구가 제기한 요한 문제를 해결하고자 한
다 즉 시간에 걸쳐 생산성과 잉여가치율 사이에 양의 상 계가 존재한다면
왜 개발국들은 선진국에 비해 높은 잉여가치율을 나타내는가 하는 것이다
계량경제학 분석에 기 하여 클러스터 분석 고정효과패 분석의 증거
는 덜 생산 인 국가들의 그룹이 더욱 생산 인 국가들의 그룹에 비해 잉여가
치율이 더 높거나 최소한 낮지는 않다는 사실을 보여 다 그럼에도 불구하고
한 시간에 걸쳐서 는 그룹 내부에서 생산성과 잉여가치율 사이에 상 계
가 존재함을 보여 다
자본의 유기 구성을 고려함으로써 그러한 국가 잉여가치율의 차이에
해 가능한 한 가지 설명을 검토한다 수입된 생산수단이 그러한 구성 따라서
개발국가들에서의 잉여가치율에 어떠한 향을 미치는가 가치론에 입각한
설명이 검토되며 생산수단이 수입되는 경우에 그러한 구성을 추정한다
주요 용어 착취 가치 잉여 생산성 자본의 유기 구성
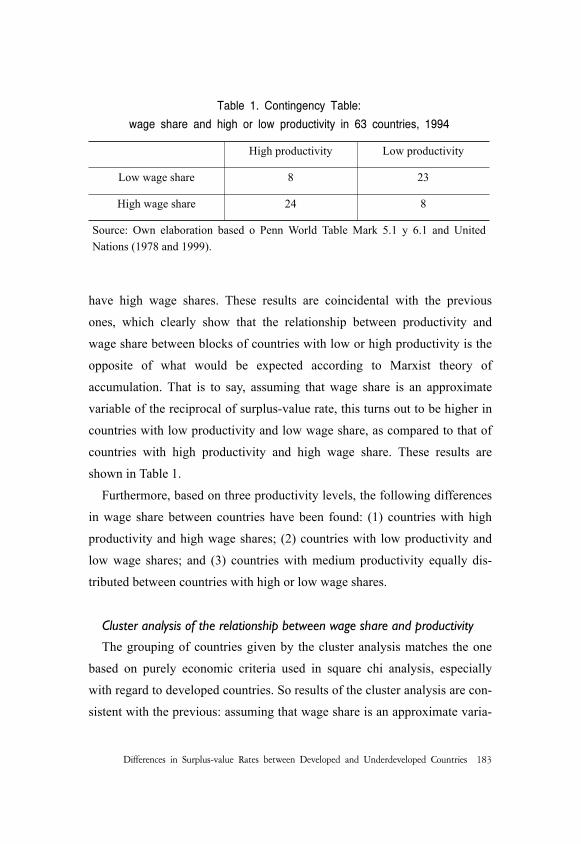
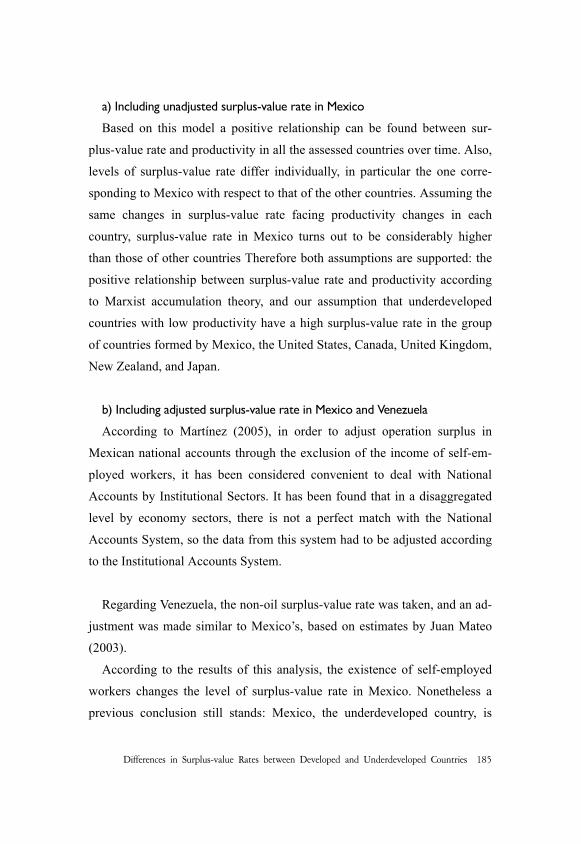
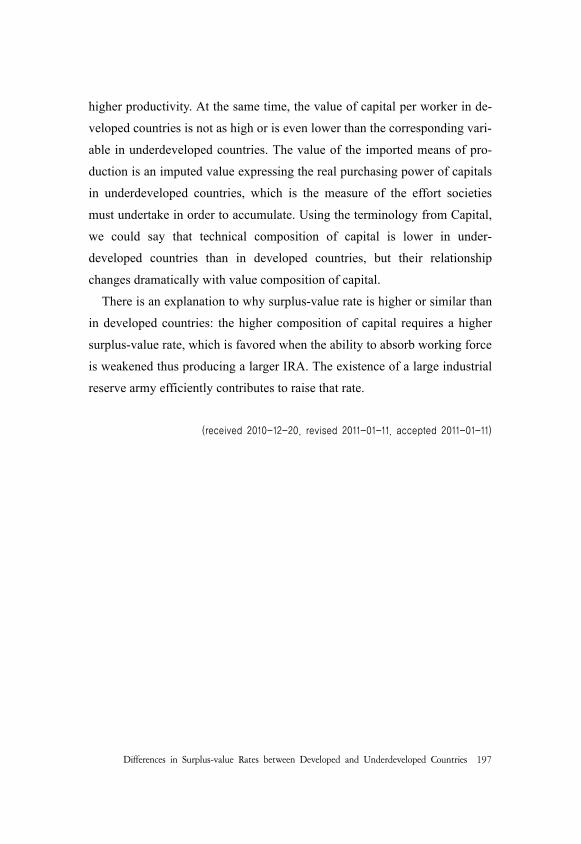