Differences in signalling by directly and indirectly...
12
Differences in signalling by directly and indirectly binding ligands in bacterial chemotaxis Silke Neumann 1 , Clinton H Hansen 2,3 , Ned S Wingreen 2, * and Victor Sourjik 1, * 1 Zentrum fu ¨r Molekulare Biologie der Universita ¨t Heidelberg, DKFZ-ZMBH Alliance, Heidelberg, Germany and 2 Department of Molecular Biology, Princeton University, Princeton, NJ, USA In chemotaxis of Escherichia coli and other bacteria, extra- cellular stimuli are perceived by transmembrane receptors that bind their ligands either directly, or indirectly through periplasmic-binding proteins (BPs). As BPs are also in- volved in ligand uptake, they provide a link between chemotaxis and nutrient utilization by cells. However, signalling by indirectly binding ligands remains much less understood than signalling by directly binding ligands. Here, we compared intracellular responses mediated by both types of ligands and developed a new mathematical model for signalling by indirectly binding ligands. We show that indirect binding allows cells to better control sensitivity to specific ligands in response to their nutrient environment and to coordinate chemotaxis with ligand transport, but at the cost of the dynamic range being much narrower than for directly binding ligands. We further demonstrate that signal integration by the chemo- sensory complexes does not depend on the type of ligand. Overall, our data suggest that the distinction between signalling by directly and indirectly binding ligands is more physiologically important than the traditional dis- tinction between high- and low-abundance receptors. The EMBO Journal (2010) 29, 3484–3495. doi:10.1038/ emboj.2010.224; Published online 10 September 2010 Subject Categories: signal transduction; microbiology & pathogens Keywords: bacterial chemotaxis; FRET; signal integration; signal transduction; transport Introduction Chemotactic bacteria follow chemical gradients in their en- vironment by performing temporal comparisons of chemoef- fector concentrations (Berg and Brown, 1972; Macnab and Koshland, 1972). In Escherichia coli, sensing and processing of stimuli are performed by complexes that consist of four types of attractant-specific chemoreceptors, a histidine kinase CheA, and an adaptor protein CheW (Gegner et al, 1992). Attractant binding to the periplasmic part of a receptor homodimer, the functional chemoreceptor unit—hereafter simply referred to as a ‘receptor’—inhibits CheA autopho- sphorylation, thus reducing phosphotransfer to the motor regulator CheY. The signal transduction pathway also in- cludes a phosphatase CheZ, and an adaptation system that consists of a methyltransferase, CheR, and a methylesterase, CheB. Adaptation to a persistent attractant stimulus works through receptor methylation on four specific glutamate residues, which increases CheA activity and decreases sensi- tivity to the attractant (Borkovich et al, 1992; Li and Weis, 2000; Levit and Stock, 2002). Although all E. coli chemoreceptors are homologous, two classes of ligands can be distinguished based on their binding properties. Amino acids bind directly to the periplasmic domains of the so-called major receptors Tar and Tsr, and constitute one class. A second class is represented by sugars and dipeptides, which bind to minor receptors Trg and Tap, respectively, through periplasmic substrate-binding proteins (BPs) of ATP-binding cassette (ABC) transporters. An inter- esting exception is the sugar maltose, which binds indirectly to the major receptor Tar (Hazelbauer, 1975; Manson and Kossmann, 1986). Early studies of chemotaxis that relied on accumulation of bacteria into attractant-filled microcapil- laries already indicated differences in the magnitude and concentration range of responses mediated by the two types of ligands (Mesibov and Adler, 1972; Adler et al, 1973; Mesibov et al, 1973), but the origin of those differences remained largely unclear. Apart from the mode of ligand binding, major and minor receptors differ in their copy numbers, with the total number of minor receptors previously estimated to be o1000 copies per cell compared with B10000 for major receptors (Li and Hazelbauer, 2004), and this difference was frequently assumed to explain the apparently weaker responses mediated by minor receptors. Yet another difference lies in the truncation for the minor receptors of the last 20 amino acids of the C-terminus, which includes the binding site for the adaptation enzymes, making minor receptors dependent on the proximity of neighbouring major receptors for efficient adaptation (Li and Hazelbauer, 2005). The receptor–kinase sensory complexes are organized in large clusters that localize at the cell poles and in smaller clusters along the cell body (Maddock and Shapiro, 1993; Sourjik and Berg, 2000), where receptors of different ligand specificities are intermixed (Ames et al, 2002). Activities of neighbouring receptors are allosterically coupled, resulting in amplification of receptor-mediated stimuli (Li and Weis, 2000; Gestwicki and Kiessling, 2002; Sourjik and Berg, 2002, 2004; Lai et al, 2005), and thus allowing E. coli to generate highly sensitive responses that approach physical limits of sensitivity (Berg and Purcell, 1977; Bialek and Setayeshgar, 2005). The allosteric interactions between Received: 17 March 2010; accepted: 16 August 2010; published online: 10 September 2010 *Corresponding authors. NS Wingreen, Department of Molecular Biology, Princeton University, Princeton, NJ 08544-1014, USA. Tel.: þ 1 609 258 8476; Fax þ 1 609 258 8616; E-mail: [email protected] or V Sourjik, Zentrum fu ¨r Molekulare Biologie der Universita ¨t Heidelberg, Im Neuenheimer Feld 282, Heidelberg 69120, Germany. Tel.: þ 49 6221 54 6858; Fax: þ 49 6221 54 5894; E-mail: [email protected] 3 Present address: Biophysics Program, Harvard University, Cambridge, MA 02138, USA The EMBO Journal (2010) 29, 3484–3495 | & 2010 European Molecular Biology Organization | All Rights Reserved 0261-4189/10 www.embojournal.org The EMBO Journal VOL 29 | NO 20 | 2010 & 2010 European Molecular Biology Organization EMBO THE EMBO JOURNAL THE EMBO JOURNAL 3484
Transcript of Differences in signalling by directly and indirectly...

Differences in signalling by directly and indirectlybinding ligands in bacterial chemotaxis
Silke Neumann1, Clinton H Hansen2,3,Ned S Wingreen2,* and Victor Sourjik1,*1Zentrum fur Molekulare Biologie der Universitat Heidelberg,DKFZ-ZMBH Alliance, Heidelberg, Germany and 2Department ofMolecular Biology, Princeton University, Princeton, NJ, USA
In chemotaxis of Escherichia coli and other bacteria, extra-
cellular stimuli are perceived by transmembrane receptors
that bind their ligands either directly, or indirectly through
periplasmic-binding proteins (BPs). As BPs are also in-
volved in ligand uptake, they provide a link between
chemotaxis and nutrient utilization by cells. However,
signalling by indirectly binding ligands remains much
less understood than signalling by directly binding ligands.
Here, we compared intracellular responses mediated by
both types of ligands and developed a new mathematical
model for signalling by indirectly binding ligands. We
show that indirect binding allows cells to better control
sensitivity to specific ligands in response to their nutrient
environment and to coordinate chemotaxis with ligand
transport, but at the cost of the dynamic range being
much narrower than for directly binding ligands. We
further demonstrate that signal integration by the chemo-
sensory complexes does not depend on the type of ligand.
Overall, our data suggest that the distinction between
signalling by directly and indirectly binding ligands is
more physiologically important than the traditional dis-
tinction between high- and low-abundance receptors.
The EMBO Journal (2010) 29, 3484–3495. doi:10.1038/
emboj.2010.224; Published online 10 September 2010
Subject Categories: signal transduction; microbiology &
pathogens
Keywords: bacterial chemotaxis; FRET; signal integration;
signal transduction; transport
Introduction
Chemotactic bacteria follow chemical gradients in their en-
vironment by performing temporal comparisons of chemoef-
fector concentrations (Berg and Brown, 1972; Macnab and
Koshland, 1972). In Escherichia coli, sensing and processing
of stimuli are performed by complexes that consist of four
types of attractant-specific chemoreceptors, a histidine kinase
CheA, and an adaptor protein CheW (Gegner et al, 1992).
Attractant binding to the periplasmic part of a receptor
homodimer, the functional chemoreceptor unit—hereafter
simply referred to as a ‘receptor’—inhibits CheA autopho-
sphorylation, thus reducing phosphotransfer to the motor
regulator CheY. The signal transduction pathway also in-
cludes a phosphatase CheZ, and an adaptation system that
consists of a methyltransferase, CheR, and a methylesterase,
CheB. Adaptation to a persistent attractant stimulus works
through receptor methylation on four specific glutamate
residues, which increases CheA activity and decreases sensi-
tivity to the attractant (Borkovich et al, 1992; Li and Weis,
2000; Levit and Stock, 2002).
Although all E. coli chemoreceptors are homologous, two
classes of ligands can be distinguished based on their binding
properties. Amino acids bind directly to the periplasmic
domains of the so-called major receptors Tar and Tsr, and
constitute one class. A second class is represented by sugars
and dipeptides, which bind to minor receptors Trg and Tap,
respectively, through periplasmic substrate-binding proteins
(BPs) of ATP-binding cassette (ABC) transporters. An inter-
esting exception is the sugar maltose, which binds indirectly
to the major receptor Tar (Hazelbauer, 1975; Manson and
Kossmann, 1986). Early studies of chemotaxis that relied on
accumulation of bacteria into attractant-filled microcapil-
laries already indicated differences in the magnitude and
concentration range of responses mediated by the two types
of ligands (Mesibov and Adler, 1972; Adler et al, 1973;
Mesibov et al, 1973), but the origin of those differences
remained largely unclear.
Apart from the mode of ligand binding, major and minor
receptors differ in their copy numbers, with the total number
of minor receptors previously estimated to be o1000 copies
per cell compared with B10 000 for major receptors (Li
and Hazelbauer, 2004), and this difference was frequently
assumed to explain the apparently weaker responses
mediated by minor receptors. Yet another difference lies in
the truncation for the minor receptors of the last 20 amino
acids of the C-terminus, which includes the binding site for
the adaptation enzymes, making minor receptors dependent
on the proximity of neighbouring major receptors for efficient
adaptation (Li and Hazelbauer, 2005).
The receptor–kinase sensory complexes are organized in
large clusters that localize at the cell poles and in smaller
clusters along the cell body (Maddock and Shapiro, 1993;
Sourjik and Berg, 2000), where receptors of different ligand
specificities are intermixed (Ames et al, 2002). Activities of
neighbouring receptors are allosterically coupled, resulting in
amplification of receptor-mediated stimuli (Li and Weis,
2000; Gestwicki and Kiessling, 2002; Sourjik and Berg,
2002, 2004; Lai et al, 2005), and thus allowing E. coli to
generate highly sensitive responses that approach physical
limits of sensitivity (Berg and Purcell, 1977; Bialek and
Setayeshgar, 2005). The allosteric interactions betweenReceived: 17 March 2010; accepted: 16 August 2010; publishedonline: 10 September 2010
*Corresponding authors. NS Wingreen, Department of Molecular Biology,Princeton University, Princeton, NJ 08544-1014, USA. Tel.: þ 1 609 258 8476;Fax þ 1 609 258 8616; E-mail: [email protected] orV Sourjik, Zentrum fur Molekulare Biologie der Universitat Heidelberg,Im Neuenheimer Feld 282, Heidelberg 69120, Germany.Tel.: þ 49 6221 54 6858; Fax: þ 49 6221 54 5894;E-mail: [email protected] address: Biophysics Program, Harvard University, Cambridge,MA 02138, USA
The EMBO Journal (2010) 29, 3484–3495 | & 2010 European Molecular Biology Organization | All Rights Reserved 0261-4189/10
www.embojournal.org
The EMBO Journal VOL 29 | NO 20 | 2010 &2010 European Molecular Biology Organization
EMBO
THE
EMBOJOURNAL
THE
EMBOJOURNAL
3484
receptors have been described using a number of mathema-
tical models (Bray et al, 1998; Duke et al, 2001; Sourjik and
Berg, 2004; Mello and Tu, 2005; Keymer et al, 2006). The
most commonly applied are Monod–Wyman–Changeux type
(MWC) models, which assume that receptors within clusters
exist in tightly coupled allosteric signalling complexes, or
teams, of 10–20 receptors, with all receptors in one team
switching synchronously between inactive (off) and active
(on) states (Sourjik and Berg, 2004; Mello and Tu, 2005;
Keymer et al, 2006). As receptors of different types are
intermixed within clusters (Ames et al, 2002), allosteric
interactions between receptors also provide a means of signal
integration (Sourjik and Berg, 2004).
So far, most of the effort to investigate signal processing by
allosteric chemoreceptor teams has concentrated on the
directly binding ligands of the major receptors Tar and Tsr,
L-aspartate (or its non-metabolizable analogue a-methyl-DL-
aspartate, MeAsp) and L-serine (or its non-metabolizable
analogue a-aminoisobutyrate, AiBu), respectively. The goal
of this work was to systematically compare intracellular
signalling by the directly binding ligands of major receptors
with that mediated by the indirectly binding sugars D-maltose
(specific for Tar), D-ribose and D-galactose (specific for Trg),
and the dipeptide Pro-Leu (specific for Tap). To quantify
signalling parameters of individual ligands, we determined
relative expression levels of the corresponding receptors and
extended the MWC model of allosteric teams to describe
indirect ligand binding through BPs. Our results show that
the signalling strength and dynamic range of a specific ligand
are determined both by its binding properties and by the
expression levels of its receptor and the respective BP. We
conclude that the indirect mode of ligand binding allows
greater flexibility in the modulation of response sensitivity,
but at a cost of a narrower dynamic range. Chemotactic
response to mixtures of effectors showed that simultaneous
stimulation by ligands of different receptors is additive, and
that adaptation to ligands of one receptor does not interfere
with signalling by other receptors. On the basis of these and
other data, we discuss possible evolutionary origins of the
two modes of ligand binding in relation to strategies of
coupling between chemotaxis and transport.
Results
Responses towards directly and indirectly binding
ligands
To measure intracellular responses, we used a FRET reporter
based on the CheY-YFP/CheZ-CFP pair (Sourjik and Berg,
2002; Sourjik et al, 2007). The FRET assay determines the
relative intracellular level of the complex formed by phos-
phorylated CheY-YFP and CheZ-CFP. As the amount of this
complex is proportional to the rate of CheY phosphorylation,
it provides a direct readout of the intracellular kinase activity
(Supplementary Figure S1). It has been shown before that
CheY-YFP/CheZ-CFP FRET changes linearly with the kinase
activity within the physiological activity range (Sourjik and
Berg, 2002; Sourjik et al, 2007; Endres et al, 2008). As wild
type for our experiments, we used a cheY cheZ derivative
of E. coli K-12 strain LJ110 (Zeppenfeld et al, 2000) whose
parent W3110 was used for early studies on sugar taxis
(Hazelbauer et al, 1969; Adler et al, 1973). This strain
shows saturating expression of galactose BP (GBP) (see
below), which makes it convenient for comparative study
of amino acid and sugar taxis.
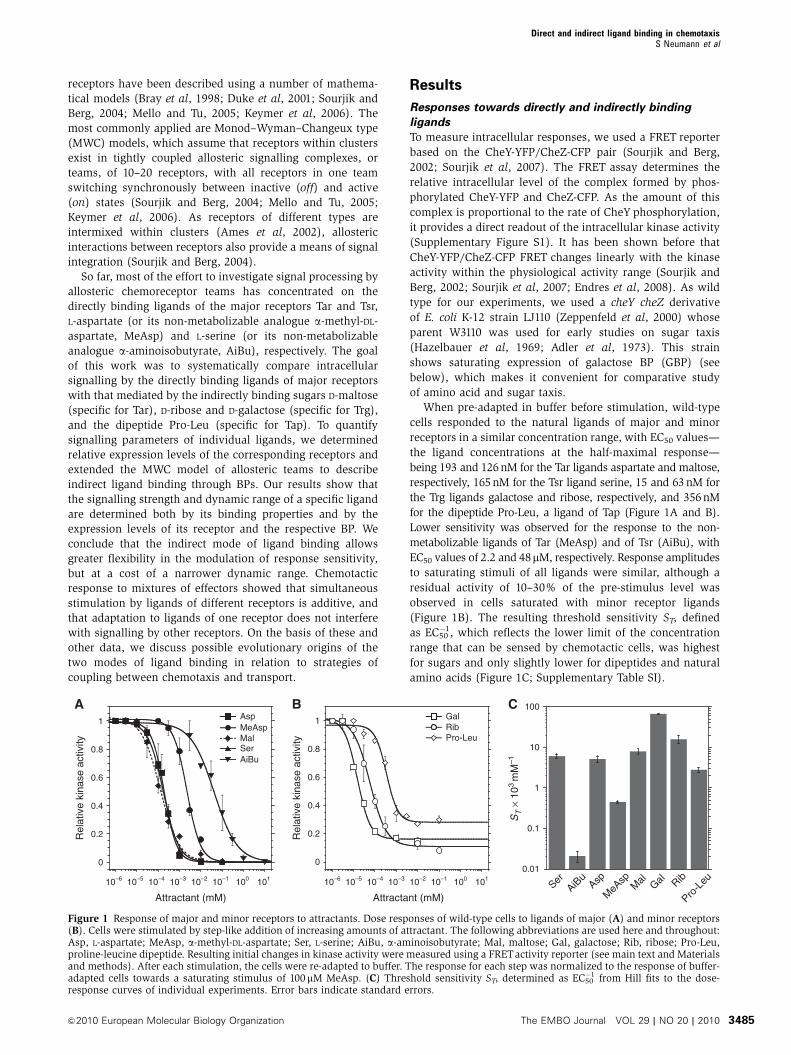
When pre-adapted in buffer before stimulation, wild-type
cells responded to the natural ligands of major and minor
receptors in a similar concentration range, with EC50 values—
the ligand concentrations at the half-maximal response—
being 193 and 126 nM for the Tar ligands aspartate and maltose,
respectively, 165 nM for the Tsr ligand serine, 15 and 63 nM for
the Trg ligands galactose and ribose, respectively, and 356 nM
for the dipeptide Pro-Leu, a ligand of Tap (Figure 1A and B).
Lower sensitivity was observed for the response to the non-
metabolizable ligands of Tar (MeAsp) and of Tsr (AiBu), with
EC50 values of 2.2 and 48mM, respectively. Response amplitudes
to saturating stimuli of all ligands were similar, although a
residual activity of 10–30% of the pre-stimulus level was
observed in cells saturated with minor receptor ligands
(Figure 1B). The resulting threshold sensitivity ST, defined
as EC50�1, which reflects the lower limit of the concentration
range that can be sensed by chemotactic cells, was highest
for sugars and only slightly lower for dipeptides and natural
amino acids (Figure 1C; Supplementary Table SI).
B
Rel
ativ
e ki
nase
act
ivity
Attractant (mM)
10–6 10–5 10–4 10–3 10–2 10–1 100 101
Attractant (mM)
10–6 10–5 10–4 10–3 10–2 10–1 100 101
A
0
0.2
0.4
0.6
0.8
1 AspMeAspMalSerAiBu
C
ST ×
103
mM
–1
Ser
AiBu
MeA
sp M
al Gal Rib
Pro-L
euAsp
0
0.2
0.4
0.6
0.8
1
Rel
ativ
e ki
nase
act
ivity
RibPro-Leu
Gal
0.01
0.1
1
10
100
Figure 1 Response of major and minor receptors to attractants. Dose responses of wild-type cells to ligands of major (A) and minor receptors(B). Cells were stimulated by step-like addition of increasing amounts of attractant. The following abbreviations are used here and throughout:Asp, L-aspartate; MeAsp, a-methyl-DL-aspartate; Ser, L-serine; AiBu, a-aminoisobutyrate; Mal, maltose; Gal, galactose; Rib, ribose; Pro-Leu,proline-leucine dipeptide. Resulting initial changes in kinase activity were measured using a FRETactivity reporter (see main text and Materialsand methods). After each stimulation, the cells were re-adapted to buffer. The response for each step was normalized to the response of buffer-adapted cells towards a saturating stimulus of 100mM MeAsp. (C) Threshold sensitivity ST, determined as EC50
�1 from Hill fits to the dose-response curves of individual experiments. Error bars indicate standard errors.
Direct and indirect ligand binding in chemotaxisS Neumann et al
&2010 European Molecular Biology Organization The EMBO Journal VOL 29 | NO 20 | 2010 3485
To minimize the effect of ligand depletion by cells at low-
ligand concentrations, these experiments were performed at
the highest flow rate possible in our setup, whereby the
content of the entire flow chamber was constantly exchanged
nearly every second (see Materials and methods). Although
such a high flow rate generally increased measurement
errors, it resulted in a significant increase in response ampli-
tudes to the lowest concentrations of some ligands when
compared with a five-fold lower flow rate (Supplementary
Figure S2), and led to modestly higher estimates of the
effective threshold sensitivity (Supplementary Table SI).
Such reduction of the response threshold by ligand uptake
is consistent with previous observations made in capillary
assays (Ordal and Adler, 1974; Hazelbauer, 1975; Zhang et al,
1999), and its extent was ligand-dependent as expected from
differences in the rates of ligand uptake. Only minor effects
were observed for aspartate or galactose, whereas depletion
effects for serine or ribose were substantially larger. However,
in all cases, the effective reduction in ligand concentration
was on the order of EC50, meaning that ligand depletion
should not affect the response behaviour at higher ligand
concentrations.
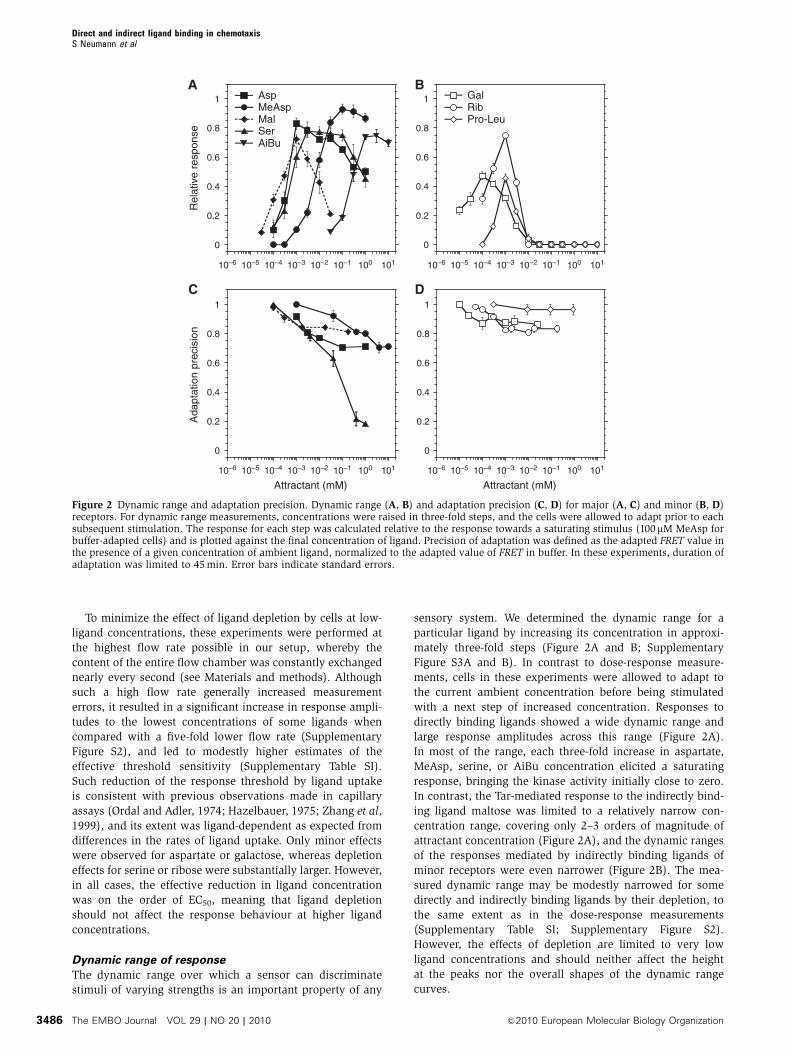
Dynamic range of response
The dynamic range over which a sensor can discriminate
stimuli of varying strengths is an important property of any
sensory system. We determined the dynamic range for a
particular ligand by increasing its concentration in approxi-
mately three-fold steps (Figure 2A and B; Supplementary
Figure S3A and B). In contrast to dose-response measure-
ments, cells in these experiments were allowed to adapt to
the current ambient concentration before being stimulated
with a next step of increased concentration. Responses to
directly binding ligands showed a wide dynamic range and
large response amplitudes across this range (Figure 2A).
In most of the range, each three-fold increase in aspartate,
MeAsp, serine, or AiBu concentration elicited a saturating
response, bringing the kinase activity initially close to zero.
In contrast, the Tar-mediated response to the indirectly bind-
ing ligand maltose was limited to a relatively narrow con-
centration range, covering only 2–3 orders of magnitude of
attractant concentration (Figure 2A), and the dynamic ranges
of the responses mediated by indirectly binding ligands of
minor receptors were even narrower (Figure 2B). The mea-
sured dynamic range may be modestly narrowed for some
directly and indirectly binding ligands by their depletion, to
the same extent as in the dose-response measurements
(Supplementary Table SI; Supplementary Figure S2).
However, the effects of depletion are limited to very low
ligand concentrations and should neither affect the height
at the peaks nor the overall shapes of the dynamic range
curves.
0
0.2
0.4
0.6
0.8
1
Ada
ptat
ion
prec
isio
n
Attractant (mM)
C
0
0.2
0.4
0.6
0.8
1
10–6 10–5 10–4 10–3 10–2 10–1 100 101 10–6 10–5 10–4 10–3 10–2 10–1 100 101
10–6 10–5 10–4 10–3 10–2 10–1 100 10110–6 10–5 10–4 10–3 10–2 10–1 100 101
0
0.2
0.4
0.6
0.8
1B
RibPro-Leu
Gal
0
0.2
0.4
0.6
0.8
1
D
Attractant (mM)
Rel
ativ
e re
spon
se
AAspMeAspMalSerAiBu
Figure 2 Dynamic range and adaptation precision. Dynamic range (A, B) and adaptation precision (C, D) for major (A, C) and minor (B, D)receptors. For dynamic range measurements, concentrations were raised in three-fold steps, and the cells were allowed to adapt prior to eachsubsequent stimulation. The response for each step was calculated relative to the response towards a saturating stimulus (100 mM MeAsp forbuffer-adapted cells) and is plotted against the final concentration of ligand. Precision of adaptation was defined as the adapted FRET value inthe presence of a given concentration of ambient ligand, normalized to the adapted value of FRET in buffer. In these experiments, duration ofadaptation was limited to 45 min. Error bars indicate standard errors.
Direct and indirect ligand binding in chemotaxisS Neumann et al
The EMBO Journal VOL 29 | NO 20 | 2010 &2010 European Molecular Biology Organization3486
In the high-concentration regime, the dynamic range of
the directly binding ligands was apparently limited by the
gradually decreasing value of the adapted kinase activity,
that is by the imprecision of adaptation (Figure 2A and C;
Supplementary Figure S3A and E). The imprecision of adap-
tation was particularly pronounced for serine, consistent
with previous observations (Berg and Brown, 1972). In
contrast, adaptation to the indirectly binding ligand maltose
(Figure 2C) and minor-receptor ligands (Figure 2D; Supple-
mentary Figure S3B) was relatively precise, indicating that
the dynamic range of these ligands was limited by saturation
of the sensory system rather than by failure of adaptation,
as illustrated in Supplementary Figure S3C–F.
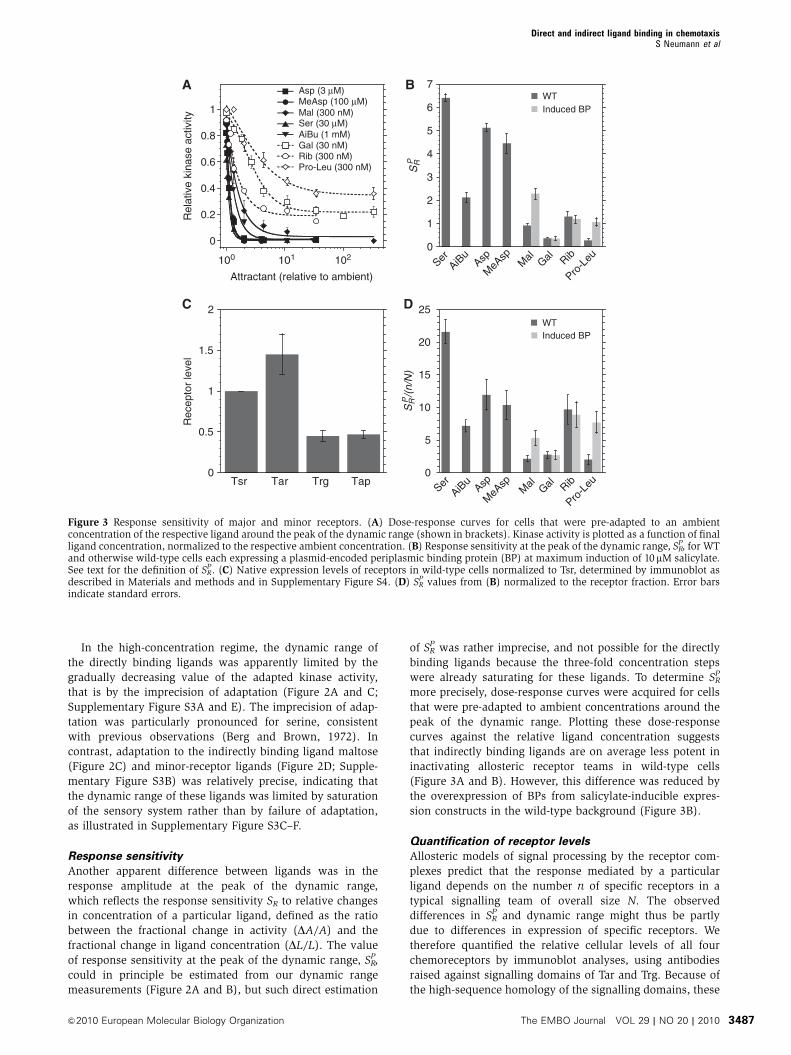
Response sensitivity
Another apparent difference between ligands was in the
response amplitude at the peak of the dynamic range,
which reflects the response sensitivity SR to relative changes
in concentration of a particular ligand, defined as the ratio
between the fractional change in activity (DA/A) and the
fractional change in ligand concentration (DL/L). The value
of response sensitivity at the peak of the dynamic range, SRP,
could in principle be estimated from our dynamic range
measurements (Figure 2A and B), but such direct estimation
of SRP was rather imprecise, and not possible for the directly
binding ligands because the three-fold concentration steps
were already saturating for these ligands. To determine SRP
more precisely, dose-response curves were acquired for cells
that were pre-adapted to ambient concentrations around the
peak of the dynamic range. Plotting these dose-response
curves against the relative ligand concentration suggests
that indirectly binding ligands are on average less potent in
inactivating allosteric receptor teams in wild-type cells
(Figure 3A and B). However, this difference was reduced by
the overexpression of BPs from salicylate-inducible expres-
sion constructs in the wild-type background (Figure 3B).
Quantification of receptor levels
Allosteric models of signal processing by the receptor com-
plexes predict that the response mediated by a particular
ligand depends on the number n of specific receptors in a
typical signalling team of overall size N. The observed
differences in SRP and dynamic range might thus be partly
due to differences in expression of specific receptors. We
therefore quantified the relative cellular levels of all four
chemoreceptors by immunoblot analyses, using antibodies
raised against signalling domains of Tar and Trg. Because of
the high-sequence homology of the signalling domains, these
Ser
AiBu
MeA
sp
Mal Gal Rib
Pro-L
euAsp
Ser AiB
u
MeA
sp
Mal Gal Rib
Pro-L
euAsp
0
0.5
1
1.5
2
Rec
epto
r le
vel
Tsr Tar Trg Tap
C
0
5
10
15
20
25DWTInduced BP
Attractant (relative to ambient)
A
Rel
ativ
e ki
nase
act
ivity
100 101 102
B
0
1
2
3
4
5
6
7WTInduced BP
SRP
SRP/(n/N)
0
0.2
0.4
0.6
0.8
1
Asp (3 µM)
Mal (300 nM)
AiBu (1 mM)Ser (30 µM)
Rib (300 nM)Pro-Leu (300 nM)
Gal (30 nM)
MeAsp (100 µM)
Figure 3 Response sensitivity of major and minor receptors. (A) Dose-response curves for cells that were pre-adapted to an ambientconcentration of the respective ligand around the peak of the dynamic range (shown in brackets). Kinase activity is plotted as a function of finalligand concentration, normalized to the respective ambient concentration. (B) Response sensitivity at the peak of the dynamic range, SR
P, for WTand otherwise wild-type cells each expressing a plasmid-encoded periplasmic binding protein (BP) at maximum induction of 10mM salicylate.See text for the definition of SR
P. (C) Native expression levels of receptors in wild-type cells normalized to Tsr, determined by immunoblot asdescribed in Materials and methods and in Supplementary Figure S4. (D) SR
P values from (B) normalized to the receptor fraction. Error barsindicate standard errors.
Direct and indirect ligand binding in chemotaxisS Neumann et al
&2010 European Molecular Biology Organization The EMBO Journal VOL 29 | NO 20 | 2010 3487
antibodies recognize all chemoreceptors, but with varying
specificity. To calibrate the relative antibody specificity for
individual receptors, we compared signal intensities in im-
munoblots with defined amounts of receptor fusions to YFP,
adjusted using both the YFP fluorescence and immunoblot-
ting with GFP-specific antibody that equally well recognizes
YFP (see Supplementary Figure S4, Materials and methods,
and Supplementary data). The aTar antibody was found to
recognize Tar and Tsr with comparable specificity (Tar/
TsraTar: 1.39±0.23), and was therefore used to determine
the relative levels of these receptors. The aTrg antibody has
similar specificity for minor receptors and Tsr (Trg/TsraTrg:
1.64±0.13; Tap/TsraTrg: 1.23±0.08) and was used for the
relative quantification of the minor receptors.
Our results showed that Tap and Trg are less abundant
than Tar and Tsr, but in contrast to previous estimates
(Li and Hazelbauer, 2004), we only observed a two- to
three-fold difference in their levels (Figure 3C; Supplemen-
tary Figure S4D). The absolute expression level of Tsr was
estimated to be around 6000 copies per cell (Supplementary
Figure S5). Comparable receptor ratios were observed for
the more conventionally used chemotaxis strain RP437
(Supplementary Figure S4E). It should be noted that the
ratio between the levels of major receptors is known to
depend on the optical density of the culture (Salman and
Libchaber, 2007; Kalinin et al, 2010), and we demonstrated a
similarly steep dependence for the relative levels of Trg and
Tap to Tsr (Supplementary Figure S6). Nevertheless, as the
same growth conditions were used to evaluate receptor levels
and response parameters in our experiments, we could use
the obtained relative receptor amounts to normalize the
response sensitivity for respective ligands. Assuming that
the relative expression levels reflect the receptor fraction
in a signalling team (n/N), we can normalize SRP by that
fraction to obtain values that are independent of n and thus
directly reflect the signalling properties of individual ligands
(Figure 3D). Such normalization confirmed that minor and
major receptor ligands can signal with similar strengths,
although some indirectly binding ligands showed weaker
responses even after normalization. Surprisingly, sensitivity
of the response to serine was markedly higher than for other
directly binding ligands, including the Tsr ligand AiBu. This
could not be explained solely by binding properties of serine
to Tsr, but was apparently due to a Tsr-independent response
to serine in the range of concentrations used to determine SRP
(Supplementary Figure S7). This Tsr-independent response
was also observed in a Tar-only strain (data not shown),
indicating that the response may be mediated by Tar, but its
exact nature remains to be investigated.
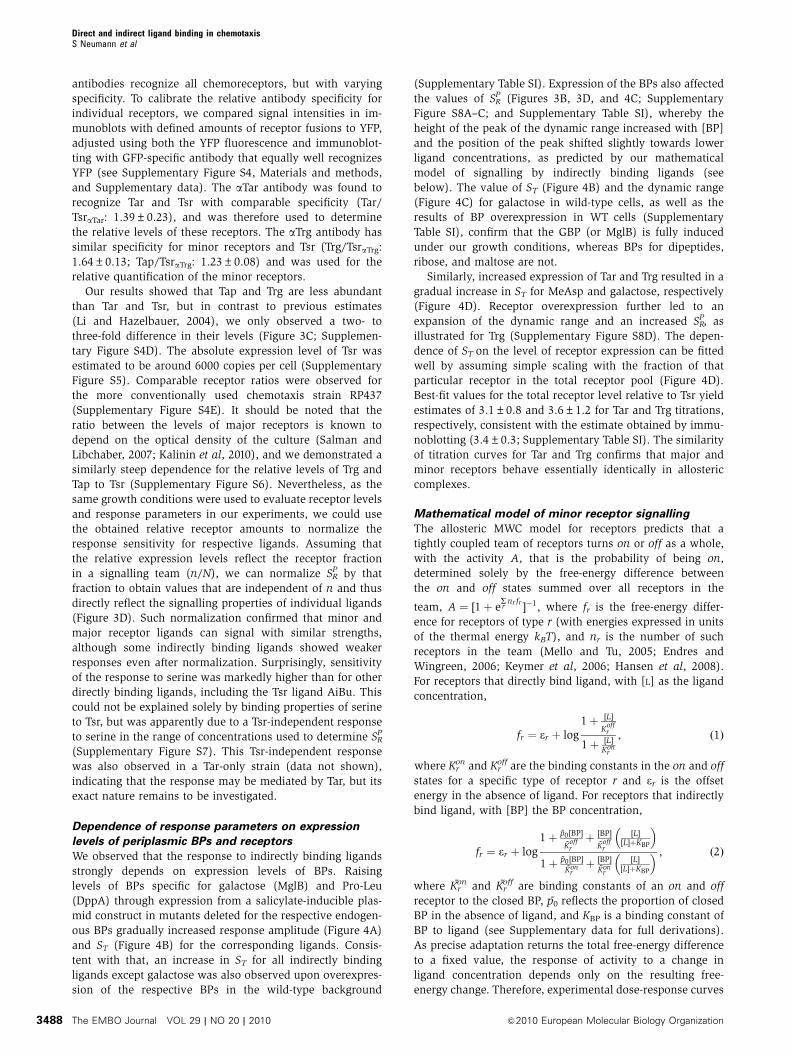
Dependence of response parameters on expression
levels of periplasmic BPs and receptors
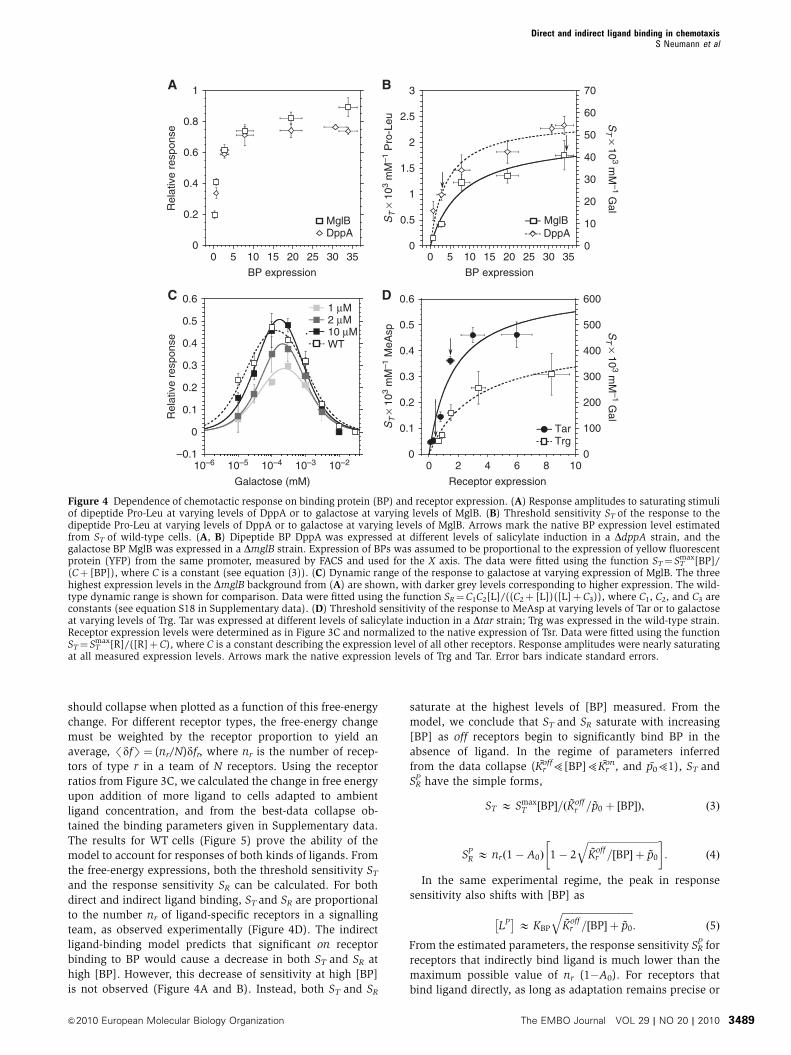
We observed that the response to indirectly binding ligands
strongly depends on expression levels of BPs. Raising
levels of BPs specific for galactose (MglB) and Pro-Leu
(DppA) through expression from a salicylate-inducible plas-
mid construct in mutants deleted for the respective endogen-
ous BPs gradually increased response amplitude (Figure 4A)
and ST (Figure 4B) for the corresponding ligands. Consis-
tent with that, an increase in ST for all indirectly binding
ligands except galactose was also observed upon overexpres-
sion of the respective BPs in the wild-type background
(Supplementary Table SI). Expression of the BPs also affected
the values of SRP (Figures 3B, 3D, and 4C; Supplementary
Figure S8A–C; and Supplementary Table SI), whereby the
height of the peak of the dynamic range increased with [BP]
and the position of the peak shifted slightly towards lower
ligand concentrations, as predicted by our mathematical
model of signalling by indirectly binding ligands (see
below). The value of ST (Figure 4B) and the dynamic range
(Figure 4C) for galactose in wild-type cells, as well as the
results of BP overexpression in WT cells (Supplementary
Table SI), confirm that the GBP (or MglB) is fully induced
under our growth conditions, whereas BPs for dipeptides,
ribose, and maltose are not.
Similarly, increased expression of Tar and Trg resulted in a
gradual increase in ST for MeAsp and galactose, respectively
(Figure 4D). Receptor overexpression further led to an
expansion of the dynamic range and an increased SRP, as
illustrated for Trg (Supplementary Figure S8D). The depen-
dence of ST on the level of receptor expression can be fitted
well by assuming simple scaling with the fraction of that
particular receptor in the total receptor pool (Figure 4D).
Best-fit values for the total receptor level relative to Tsr yield
estimates of 3.1±0.8 and 3.6±1.2 for Tar and Trg titrations,
respectively, consistent with the estimate obtained by immu-
noblotting (3.4±0.3; Supplementary Table SI). The similarity
of titration curves for Tar and Trg confirms that major and
minor receptors behave essentially identically in allosteric
complexes.
Mathematical model of minor receptor signalling
The allosteric MWC model for receptors predicts that a
tightly coupled team of receptors turns on or off as a whole,
with the activity A, that is the probability of being on,
determined solely by the free-energy difference between
the on and off states summed over all receptors in the
team, A ¼ ½1þ eSr
nr fr ��1; where fr is the free-energy differ-
ence for receptors of type r (with energies expressed in units
of the thermal energy kBT), and nr is the number of such
receptors in the team (Mello and Tu, 2005; Endres and
Wingreen, 2006; Keymer et al, 2006; Hansen et al, 2008).
For receptors that directly bind ligand, with [L] as the ligand
concentration,
fr ¼ er þ log1þ L½ �
Koffr
1þ L½ �Kon
r
; ð1Þ
where Kron and Kr
off are the binding constants in the on and off
states for a specific type of receptor r and er is the offset
energy in the absence of ligand. For receptors that indirectly
bind ligand, with [BP] the BP concentration,
fr ¼ er þ log1þ ~p0 ½BP�
~Koffr
þ ½BP�~Koffr
½L�½L�þKBP
� �
1þ ~p0 ½BP�~Konrþ ½BP�
~Konr
½L�½L�þKBP
� � ; ð2Þ
where Kron and Kr
off are binding constants of an on and off
receptor to the closed BP, p0 reflects the proportion of closed
BP in the absence of ligand, and KBP is a binding constant of
BP to ligand (see Supplementary data for full derivations).
As precise adaptation returns the total free-energy difference
to a fixed value, the response of activity to a change in
ligand concentration depends only on the resulting free-
energy change. Therefore, experimental dose-response curves
Direct and indirect ligand binding in chemotaxisS Neumann et al
The EMBO Journal VOL 29 | NO 20 | 2010 &2010 European Molecular Biology Organization3488
should collapse when plotted as a function of this free-energy
change. For different receptor types, the free-energy change
must be weighted by the receptor proportion to yield an
average, /dfS¼ (nr/N)dfr, where nr is the number of recep-
tors of type r in a team of N receptors. Using the receptor
ratios from Figure 3C, we calculated the change in free energy
upon addition of more ligand to cells adapted to ambient
ligand concentration, and from the best-data collapse ob-
tained the binding parameters given in Supplementary data.
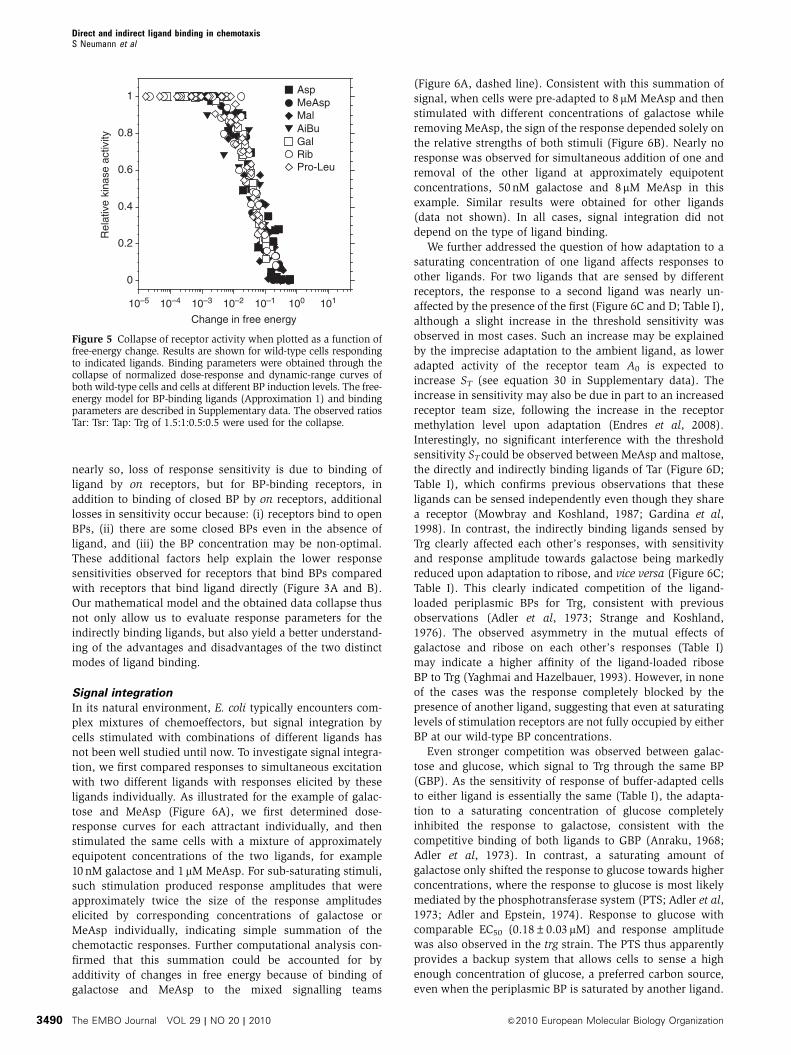
The results for WT cells (Figure 5) prove the ability of the
model to account for responses of both kinds of ligands. From
the free-energy expressions, both the threshold sensitivity ST
and the response sensitivity SR can be calculated. For both
direct and indirect ligand binding, ST and SR are proportional
to the number nr of ligand-specific receptors in a signalling
team, as observed experimentally (Figure 4D). The indirect
ligand-binding model predicts that significant on receptor
binding to BP would cause a decrease in both ST and SR at
high [BP]. However, this decrease of sensitivity at high [BP]
is not observed (Figure 4A and B). Instead, both ST and SR
saturate at the highest levels of [BP] measured. From the
model, we conclude that ST and SR saturate with increasing
[BP] as off receptors begin to significantly bind BP in the
absence of ligand. In the regime of parameters inferred
from the data collapse (Kroff5[BP]5Kr
on, and p051), ST and
SRP have the simple forms,
ST � SmaxT ½BP�=ð ~Koff
r = ~p0 þ ½BP�Þ; ð3Þ
SPR � nrð1� A0Þ 1� 2
ffiffiffiffiffiffiffiffiffiffiffiffiffiffiffiffiffiffiffiffiffiffiffiffiffiffiffiffiffi~Koffr =½BP� þ ~p0
q� �: ð4Þ
In the same experimental regime, the peak in response
sensitivity also shifts with [BP] as
LP� �
� KBP
ffiffiffiffiffiffiffiffiffiffiffiffiffiffiffiffiffiffiffiffiffiffiffiffiffiffiffiffiffi~Koffr =½BP� þ ~p0
q: ð5Þ
From the estimated parameters, the response sensitivity SRP for
receptors that indirectly bind ligand is much lower than the
maximum possible value of nr (1�A0). For receptors that
bind ligand directly, as long as adaptation remains precise or
A 1
DppAMglB
Rel
ativ
e re
spon
se
0
0.2
0.4
0.6
0.8
0 5 10 15 20 25 30 35
BP expression
B
C D
ST × 10
3 mM
–1 Gal
BP expression
0
0.5
1
1.5
2
2.5
3
0
10
20
30
40
50
60
70
0 5 10 15 20 25 30 35
MglBDppA
ST ×
103
mM
–1 P
ro-L
eu
2 µM1 µM
10 µMWT
–0.1
0
0.1
0.2
0.3
0.4
0.5
0.6
10–6 10–5 10–4 10–3 10–2
Rel
ativ
e re
spon
se
Galactose (mM)
ST × 10
3 mM
–1 Gal
0
0.1
0.2
0.3
0.4
0.5
0.6
0
100
200
300
400
500
600
0 2 4 6 8 10
Receptor expression
ST
× 1
03 m
M–1
MeA
sp
TarTrg
Figure 4 Dependence of chemotactic response on binding protein (BP) and receptor expression. (A) Response amplitudes to saturating stimuliof dipeptide Pro-Leu at varying levels of DppA or to galactose at varying levels of MglB. (B) Threshold sensitivity ST of the response to thedipeptide Pro-Leu at varying levels of DppA or to galactose at varying levels of MglB. Arrows mark the native BP expression level estimatedfrom ST of wild-type cells. (A, B) Dipeptide BP DppA was expressed at different levels of salicylate induction in a DdppA strain, and thegalactose BP MglB was expressed in a DmglB strain. Expression of BPs was assumed to be proportional to the expression of yellow fluorescentprotein (YFP) from the same promoter, measured by FACS and used for the X axis. The data were fitted using the function ST¼ ST
max[BP]/(Cþ [BP]), where C is a constant (see equation (3)). (C) Dynamic range of the response to galactose at varying expression of MglB. The threehighest expression levels in the DmglB background from (A) are shown, with darker grey levels corresponding to higher expression. The wild-type dynamic range is shown for comparison. Data were fitted using the function SR¼C1C2[L]/((C2þ [L])([L]þC3)), where C1, C2, and C3 areconstants (see equation S18 in Supplementary data). (D) Threshold sensitivity of the response to MeAsp at varying levels of Tar or to galactoseat varying levels of Trg. Tar was expressed at different levels of salicylate induction in a Dtar strain; Trg was expressed in the wild-type strain.Receptor expression levels were determined as in Figure 3C and normalized to the native expression of Tsr. Data were fitted using the functionST¼ ST
max[R]/([R]þC), where C is a constant describing the expression level of all other receptors. Response amplitudes were nearly saturatingat all measured expression levels. Arrows mark the native expression levels of Trg and Tar. Error bars indicate standard errors.
Direct and indirect ligand binding in chemotaxisS Neumann et al
&2010 European Molecular Biology Organization The EMBO Journal VOL 29 | NO 20 | 2010 3489
nearly so, loss of response sensitivity is due to binding of
ligand by on receptors, but for BP-binding receptors, in
addition to binding of closed BP by on receptors, additional
losses in sensitivity occur because: (i) receptors bind to open
BPs, (ii) there are some closed BPs even in the absence of
ligand, and (iii) the BP concentration may be non-optimal.
These additional factors help explain the lower response
sensitivities observed for receptors that bind BPs compared
with receptors that bind ligand directly (Figure 3A and B).
Our mathematical model and the obtained data collapse thus
not only allow us to evaluate response parameters for the
indirectly binding ligands, but also yield a better understand-
ing of the advantages and disadvantages of the two distinct
modes of ligand binding.
Signal integration
In its natural environment, E. coli typically encounters com-
plex mixtures of chemoeffectors, but signal integration by
cells stimulated with combinations of different ligands has
not been well studied until now. To investigate signal integra-
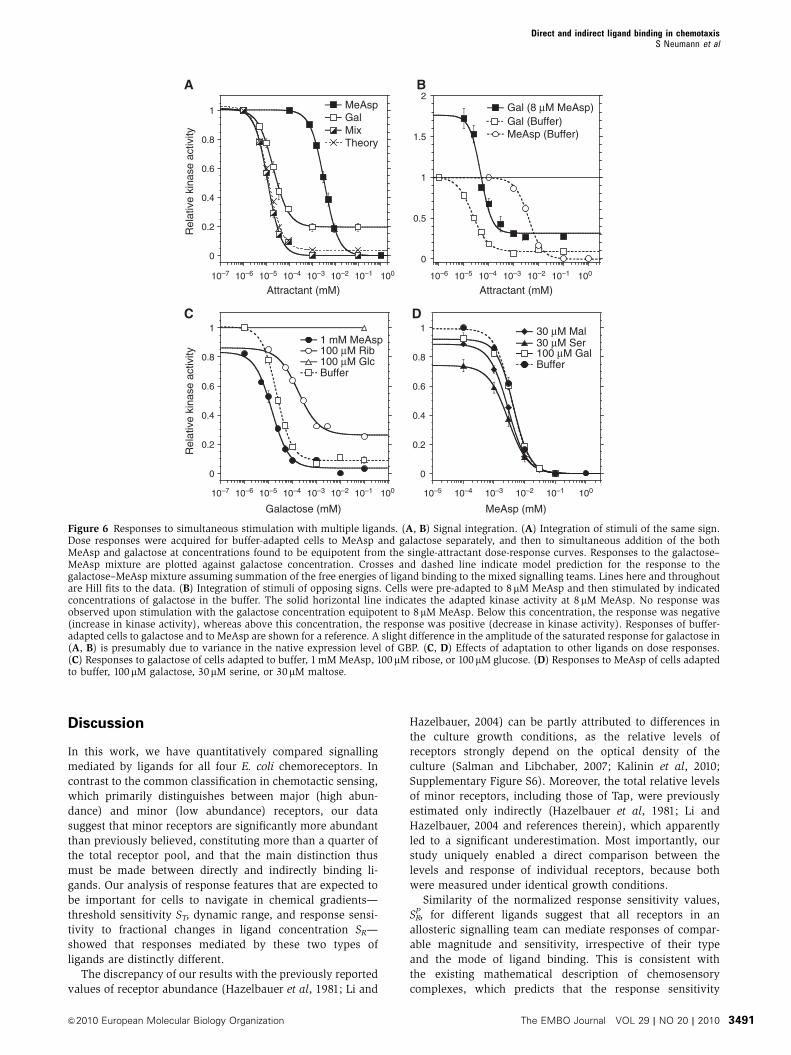
tion, we first compared responses to simultaneous excitation
with two different ligands with responses elicited by these
ligands individually. As illustrated for the example of galac-
tose and MeAsp (Figure 6A), we first determined dose-
response curves for each attractant individually, and then
stimulated the same cells with a mixture of approximately
equipotent concentrations of the two ligands, for example
10 nM galactose and 1mM MeAsp. For sub-saturating stimuli,
such stimulation produced response amplitudes that were
approximately twice the size of the response amplitudes
elicited by corresponding concentrations of galactose or
MeAsp individually, indicating simple summation of the
chemotactic responses. Further computational analysis con-
firmed that this summation could be accounted for by
additivity of changes in free energy because of binding of
galactose and MeAsp to the mixed signalling teams
(Figure 6A, dashed line). Consistent with this summation of
signal, when cells were pre-adapted to 8mM MeAsp and then
stimulated with different concentrations of galactose while
removing MeAsp, the sign of the response depended solely on
the relative strengths of both stimuli (Figure 6B). Nearly no
response was observed for simultaneous addition of one and
removal of the other ligand at approximately equipotent
concentrations, 50 nM galactose and 8 mM MeAsp in this
example. Similar results were obtained for other ligands
(data not shown). In all cases, signal integration did not
depend on the type of ligand binding.
We further addressed the question of how adaptation to a
saturating concentration of one ligand affects responses to
other ligands. For two ligands that are sensed by different
receptors, the response to a second ligand was nearly un-
affected by the presence of the first (Figure 6C and D; Table I),
although a slight increase in the threshold sensitivity was
observed in most cases. Such an increase may be explained
by the imprecise adaptation to the ambient ligand, as lower
adapted activity of the receptor team A0 is expected to
increase ST (see equation 30 in Supplementary data). The
increase in sensitivity may also be due in part to an increased
receptor team size, following the increase in the receptor
methylation level upon adaptation (Endres et al, 2008).
Interestingly, no significant interference with the threshold
sensitivity STcould be observed between MeAsp and maltose,
the directly and indirectly binding ligands of Tar (Figure 6D;
Table I), which confirms previous observations that these
ligands can be sensed independently even though they share
a receptor (Mowbray and Koshland, 1987; Gardina et al,
1998). In contrast, the indirectly binding ligands sensed by
Trg clearly affected each other’s responses, with sensitivity
and response amplitude towards galactose being markedly
reduced upon adaptation to ribose, and vice versa (Figure 6C;
Table I). This clearly indicated competition of the ligand-
loaded periplasmic BPs for Trg, consistent with previous
observations (Adler et al, 1973; Strange and Koshland,
1976). The observed asymmetry in the mutual effects of
galactose and ribose on each other’s responses (Table I)
may indicate a higher affinity of the ligand-loaded ribose
BP to Trg (Yaghmai and Hazelbauer, 1993). However, in none
of the cases was the response completely blocked by the
presence of another ligand, suggesting that even at saturating
levels of stimulation receptors are not fully occupied by either
BP at our wild-type BP concentrations.
Even stronger competition was observed between galac-
tose and glucose, which signal to Trg through the same BP
(GBP). As the sensitivity of response of buffer-adapted cells
to either ligand is essentially the same (Table I), the adapta-
tion to a saturating concentration of glucose completely
inhibited the response to galactose, consistent with the
competitive binding of both ligands to GBP (Anraku, 1968;
Adler et al, 1973). In contrast, a saturating amount of
galactose only shifted the response to glucose towards higher
concentrations, where the response to glucose is most likely
mediated by the phosphotransferase system (PTS; Adler et al,
1973; Adler and Epstein, 1974). Response to glucose with
comparable EC50 (0.18±0.03 mM) and response amplitude
was also observed in the trg strain. The PTS thus apparently
provides a backup system that allows cells to sense a high
enough concentration of glucose, a preferred carbon source,
even when the periplasmic BP is saturated by another ligand.
Rel
ativ
e ki
nase
act
ivity
Change in free energy
0
0.2
0.4
0.6
0.8
1
10–5 10–4 10–3 10–2 10–1 100 101
AspMeAspMal
RibPro-Leu
GalAiBu
Figure 5 Collapse of receptor activity when plotted as a function offree-energy change. Results are shown for wild-type cells respondingto indicated ligands. Binding parameters were obtained through thecollapse of normalized dose-response and dynamic-range curves ofboth wild-type cells and cells at different BP induction levels. The free-energy model for BP-binding ligands (Approximation 1) and bindingparameters are described in Supplementary data. The observed ratiosTar: Tsr: Tap: Trg of 1.5:1:0.5:0.5 were used for the collapse.
Direct and indirect ligand binding in chemotaxisS Neumann et al
The EMBO Journal VOL 29 | NO 20 | 2010 &2010 European Molecular Biology Organization3490
Discussion
In this work, we have quantitatively compared signalling
mediated by ligands for all four E. coli chemoreceptors. In
contrast to the common classification in chemotactic sensing,
which primarily distinguishes between major (high abun-
dance) and minor (low abundance) receptors, our data
suggest that minor receptors are significantly more abundant
than previously believed, constituting more than a quarter of
the total receptor pool, and that the main distinction thus
must be made between directly and indirectly binding li-
gands. Our analysis of response features that are expected to
be important for cells to navigate in chemical gradients—
threshold sensitivity ST, dynamic range, and response sensi-
tivity to fractional changes in ligand concentration SR—
showed that responses mediated by these two types of
ligands are distinctly different.
The discrepancy of our results with the previously reported
values of receptor abundance (Hazelbauer et al, 1981; Li and
Hazelbauer, 2004) can be partly attributed to differences in
the culture growth conditions, as the relative levels of
receptors strongly depend on the optical density of the
culture (Salman and Libchaber, 2007; Kalinin et al, 2010;
Supplementary Figure S6). Moreover, the total relative levels
of minor receptors, including those of Tap, were previously
estimated only indirectly (Hazelbauer et al, 1981; Li and
Hazelbauer, 2004 and references therein), which apparently
led to a significant underestimation. Most importantly, our
study uniquely enabled a direct comparison between the
levels and response of individual receptors, because both
were measured under identical growth conditions.
Similarity of the normalized response sensitivity values,
SRP, for different ligands suggest that all receptors in an
allosteric signalling team can mediate responses of compar-
able magnitude and sensitivity, irrespective of their type
and the mode of ligand binding. This is consistent with
the existing mathematical description of chemosensory
complexes, which predicts that the response sensitivity
A
0
0.2
0.4
0.6
0.8
1
Rel
ativ
e ki
nase
act
ivity
Attractant (mM)
0
1
0.5
1.5
2
Attractant (mM)
MeAsp (Buffer)Gal (Buffer)Gal (8 µM MeAsp)
B
Rel
ativ
e ki
nase
act
ivity
0
0.2
0.4
0.6
0.8
1
Galactose (mM)
C D
MeAsp (mM)
Buffer100 µM Gal
30 µM Mal30 µM Ser
0
0.2
0.4
0.6
0.8
1
MixGalMeAsp
100 µM Rib
Buffer100 µM Glc
1 mM MeAsp
10–7 10–6 10–5 10–4 10–3 10–2 10–1 100 10–6 10–5 10–4 10–3 10–2 10–1 100
10–7 10–6 10–5 10–4 10–3 10–2 10–1 100 10–5 10–4 10–3 10–2 10–1 100
Theory
Figure 6 Responses to simultaneous stimulation with multiple ligands. (A, B) Signal integration. (A) Integration of stimuli of the same sign.Dose responses were acquired for buffer-adapted cells to MeAsp and galactose separately, and then to simultaneous addition of the bothMeAsp and galactose at concentrations found to be equipotent from the single-attractant dose-response curves. Responses to the galactose–MeAsp mixture are plotted against galactose concentration. Crosses and dashed line indicate model prediction for the response to thegalactose–MeAsp mixture assuming summation of the free energies of ligand binding to the mixed signalling teams. Lines here and throughoutare Hill fits to the data. (B) Integration of stimuli of opposing signs. Cells were pre-adapted to 8 mM MeAsp and then stimulated by indicatedconcentrations of galactose in the buffer. The solid horizontal line indicates the adapted kinase activity at 8mM MeAsp. No response wasobserved upon stimulation with the galactose concentration equipotent to 8mM MeAsp. Below this concentration, the response was negative(increase in kinase activity), whereas above this concentration, the response was positive (decrease in kinase activity). Responses of buffer-adapted cells to galactose and to MeAsp are shown for a reference. A slight difference in the amplitude of the saturated response for galactose in(A, B) is presumably due to variance in the native expression level of GBP. (C, D) Effects of adaptation to other ligands on dose responses.(C) Responses to galactose of cells adapted to buffer, 1 mM MeAsp, 100mM ribose, or 100 mM glucose. (D) Responses to MeAsp of cells adaptedto buffer, 100mM galactose, 30mM serine, or 30mM maltose.
Direct and indirect ligand binding in chemotaxisS Neumann et al
&2010 European Molecular Biology Organization The EMBO Journal VOL 29 | NO 20 | 2010 3491

primarily depends on the fraction of ligand-specific recep-
tors in a signalling team, and further validates our estimates
of the relative expression levels of individual receptors.
In addition, response sensitivity for both modes of binding
is influenced by the ratio of binding affinities of the ligand
towards on and off states of receptors (equation S16 in
Supplementary data), explaining the residual variation of
sensitivity towards directly binding ligands after normaliza-
tion for the level of receptor expression. An exception was
the response towards serine, which showed distinctly higher
sensitivity, apparently because of a second, Tsr independent,
sensory system.
Stimulation with different ligand combinations demon-
strated that responses mediated by different receptors in the
sub-saturating stimulus range are additive. This confirms
predictions of allosteric models of signalling, which suggest
that the sign and the magnitude of the response are deter-
mined by the net change in the stimulus strength, that is by
the free-energy change due to ligand binding. Receptors in
clusters thus integrate signals using ‘majority voting’ to
navigate in mixed gradients, consistent with early analyses
of chemotaxis using capillary assays (Adler and Tso, 1974).
Moreover, we observed that the response to a given ligand is
not substantially affected by the adaptation to saturating levels
of other ligands, which apparently allows the chemotaxis
system to maintain high sensitivity at high levels of back-
ground stimulation. An exception is signalling by ligands that
compete for the same receptor or for the same BP, in which
case the response is reduced or even entirely abolished by
high levels of competing ligands.
How can cells regulate their ligand preferences? Our ex-
periments confirmed that the response sensitivity for both
modes of binding grows in proportion to the receptor fraction
in a signalling team. For the indirectly binding ligands,
however, the response further depends on the binding char-
acteristics and availability of the associated periplasmic BP,
and a response with maximal sensitivity is only observed
when BPs are expressed in excess of receptors, which is
consistent with previous studies (Manson et al, 1985). The
effects of BP expression on response are unlikely to be related
to the depletion of free ligand-bound BPs from the periplasm
by their association with membrane transporters, because the
expression levels of BPs are believed to be much higher than
the levels of their transporters (Manson et al, 1985; Higgins
et al, 1990). Rather, our analysis suggests that the uninduced
expression of most BPs under our growth conditions is not
sufficient to saturate receptors upon ligand binding.
Furthermore, we observed that, even when BPs are over-
expressed, the response sensitivity for some indirectly bind-
ing ligands can be significantly lower. This is illustrated by
the comparison of two Trg ligands, galactose and ribose:
whereas SRP for ribose is essentially the same as for the
directly binding ligands, the value for galactose is nearly
three-fold lower. Our mathematical model of signalling by
the indirectly binding ligands suggests that such loss of
sensitivity can be explained by the residual BP binding to
receptor even in the absence of ligand, as this would reduce
the signalling effect of ligand binding.
The dependence of response towards a particular ligand on
the relative expression levels of receptors and of BPs means
that sensitivity can be dynamically controlled by cells, de-
pendent on growth or environmental conditions. From this
perspective, indirect ligand binding provides an additional
flexibility in regulation. This flexibility comes, however, at
the cost of a narrower dynamic range. Although the extension
of the dynamic range towards low concentrations is likely to
have been modestly underestimated for some ligands be-
cause of their depletion, the dynamic range of the indirectly
binding ligands is clearly much narrower than that of the
directly binding ligands. For direct ligand binding, the major
extension of the dynamic range is achieved by the adapta-
tion system (Supplementary Figure S3C and E). Adaptive
receptor methylation maintains the sensitivity of the system
at high-ligand concentrations and returns the kinase activity
to a preset level by means of effectively tuning the ligand
affinity of receptors between Kroff and Kr
on (Endres and
Wingreen, 2006; Mello and Tu, 2007; Hansen et al, 2008).
Thus, the response range for major receptors extends until
either (i) receptors become fully methylated and can no
longer adapt to added ligand, or (ii) receptors become fully
saturated with ligand (i.e. [L]4Kron) and can no longer
respond to added ligand. Consistent with this picture, the
dynamic range for the directly binding ligands spans 4–5
orders of magnitude (Mesibov and Adler, 1972; Sourjik and
Berg, 2002). Our data suggest that for serine, the dynamic
range is indeed limited by the range of receptor adaptation
Table I Effects of adaptation to a saturating level of an ambient ligand on responses to other ligands
Condition Attractant Ambient EC50 (withoutambient) (mM)a,b
EC50 (withambient) (mM)
Directly binding ligands sensed bydifferent receptors
MeAsp 30mM Ser 4.0±0.4 3.0±0.2Ser 1 mM MeAsp 0.47±0.06 0.40±0.03
Indirectly and directly binding ligandsensed by different receptors
Gal 1 mM MeAsp30mM Ser
0.023±0.002 0.014±0.002
Gal 1 mM MeAsp 0.015±0.002MeAsp 100 mM Gal 4.0±0.4 4.4±0.15
Indirectly and directly binding ligandsensed by the same receptor
MeAsp 30mM Mal 4.0±0.4 3.0±0.2Mal 1 mM MeAsp 0.18±0.01 0.23±0.01
Indirectly binding ligands recognizedby the same receptor via different BPs
Gal 100 mM Rib 0.023±0.002 0.18±0.03Rib 100 mM Gal 0.16±0.02 0.34±0.02
Indirectly binding ligands recognizedvia the same BP
Gal 100 mM Glc 0.023±0.002 No responseGlc 100 mM Gal 0.026±0.004 0.19±0.02
aExperiments were performed at a flow rate of 500ml/min.bError bars indicate standard errors.
Direct and indirect ligand binding in chemotaxisS Neumann et al
The EMBO Journal VOL 29 | NO 20 | 2010 &2010 European Molecular Biology Organization3492

(case i). In contrast, the dynamic range for aspartate appears
to be restricted instead by receptor saturation (case ii), given
the estimated value for Kron of 20mM of Tar receptors for
aspartate and the observed relatively precise adaptation up to
1 mM aspartate.
In contrast, the dynamic range for indirect binding cannot
be extended by adaptation, because the range is limited
by the occupancy of the BP, and the affinity of the latter
for its ligand cannot be adjusted by the adaptation system
working on the receptor (Supplementary Figure S3D and F).
As a result, cells respond to galactose, ribose, dipeptides,
or maltose over only about two orders of magnitude of
ligand concentration, consistent with the results of previ-
ous capillary assays (Mesibov et al, 1973). As a consequence,
adaptation to saturating concentrations of indirectly binding
ligands results in much smaller changes in receptor methyla-
tion than adaptation to directly binding ligands (Supplemen-
tary Figure S9).
Given the advantages and disadvantages of the two modes
of ligand sensing, what could have led to their evolutionary
fixation? For indirectly binding ligands, it can be speculated
that coupling of the ABC transport and chemotaxis systems
allows better coordination of the rate of ligand-specific nu-
trient uptake and the chemotactic response. This prevents cell
accumulation at excessively high concentrations of attrac-
tants and allows a concerted regulation of chemotaxis and
transport according to environmental conditions. The expres-
sion of periplasmic BPs is typically inducible (Koman et al,
1979), so that cells can simultaneously upregulate both
uptake and chemotaxis in the presence of the respective
ligand. In contrast to response regulation through the level
of receptor expression, such BP-dependent regulation allows
cells to specifically increase chemotaxis towards one parti-
cular ligand without upregulating responses to all other
ligands sensed by the same receptor. Moreover, cells would
chemotactically follow gradients of the indirectly binding
ligand only as long as the uptake system remained unsatu-
rated, and moving up the gradient increased the efficiency of
nutrient uptake. At concentrations above transporter satura-
tion, cells will be indifferent to the gradient of that ligand and
can instead follow gradients of other attractants. Taxis to
carbohydrates such as glucose is further connected to their
uptake through the PTS transporters in a receptor-indepen-
dent manner (Postma et al, 1993), which allows cells to
selectively extend the dynamic range of the chemotaxis
system, again in a tight coupling with the dynamic
range of the uptake. Taken together, the indirect sensing of
sugars and dipeptides appears to present an evolutionarily
optimal strategy to maximize the overall nutrient uptake by
specific systems.
This contrasts with the direct sensing of amino acids,
which allows cells to follow gradients over a much larger
span of concentrations. The physiological reason for this
difference remains unclear. In contrast to sugars, the uptake
of amino acids such as serine and aspartate in E. coli is
primarily performed by multiple symporters (Schellenberg
and Furlong, 1977; McFall and Newman, 1996; Kim et al,
2002), which are not known to mediate any chemotactic
responses. The broad dynamic range for these amino acids
may therefore enable cells to accumulate at concentrations
corresponding to the functional range of symporters without
a direct coupling to transport. In addition, the broader
dynamic range may be required for the nutrition-unrelated
function of chemotaxis towards amino acids, such as signal
exchange between bacteria (Budrene and Berg, 1991; Park
et al, 2003).
Materials and methods
AttractantsL-aspartic acid (499% purity), a-methyl-DL-aspartic acid (MeAsp),L-serine, 2-aminoisobutyric acid (98% purity), D-(þ )-maltosemonohydrate (min. 99% purity), D-(þ )-galactose (min. 99%purity), D-(þ )-glucose, D-(�)-ribose (min. 99% purity), and Pro-Leu were purchased from Sigma. At this purity grade, maltose andgalactose are declared to contain o0.3 and o0.1% glucose,respectively. This glucose contamination may lead to an unspecificTrg-mediated response at around 1 mM of these ligands, which setthe limits of the concentration range of maltose and galactose usedin this study.
Strains and plasmidsAll strains and respective genotypes, plasmids and primers used inthis study are listed in Supplementary Table SII. SN1 and VS275were generated by the pAMPts homologous recombination systemof allele exchange (Sourjik and Berg, 2000). SN11 was made by P1transduction with donor VS139 and recipient SN1.
SN27, SN28, and SN31 were made by P1 transduction usingrespective donor strains from the Keio collection (Baba et al, 2006)and SN1 as recipient. The l-Red system (Datsenko and Wanner,2000) was used to generate both SN25 and SN23. Here, the KanR
cassette was amplified from Keio strain JW1875 using primersVic113 and Vic146 and transformed into recipient strains SN1 andVS275 expressing the Red-System from the helper plasmid pKD46by electroporation. After selecting strains on kanamycin (50 mg/ml),the resistance cassette in all strains was flipped out usingthe curable temperature-sensitive plasmid pCP20 that encodesFLP recombinase.
Preparation of cellsE. coli K-12 strain LJ110 D(cheY cheZ) and its derivatives were usedfor all FRET measurements. Cells were grown in tryptone brothsupplemented with antibiotics (100mg/ml ampicillin; 34mg/mlchloramphenicol) depending on the plasmids present. IPTG wasadded to a final concentration of 50mM to induce expression ofCheY-YFP and CheZ-CFP from pVS88 (pTrc99a; AmpR; Sourjik andBerg, 2004). BP and receptor expression from pKG110 derivativeswas induced by salicylate in a range of 0–10 mM as indicated. Aftergrowth to OD600 of 0.45 at 341C and 275 r.p.m., cells were harvestedby centrifugation (10 min at 5000 g) and resuspended in the originalculture volume of tethering buffer (10 mM KPO4, 0.1 mM EDTA,1 mM methionine, 10 mM lactic acid, 67 mM NaCl, pH 7). Proteinexpression was shut down for at least 30 min at 81C, before cellswere attached to a polylysine-coated coverslip and placed into aflow chamber of 50 ml volume (Berg and Block, 1984; Sourjik et al,2007). The chamber was kept under constant flow of tetheringbuffer (300 ml/min for dynamic range and adaptation measure-ments, 500 ml/min for sensitivity measurements, and 2500 or500ml/min for dose-response measurements) by a syringe pump(Harvard Apparatus 22) that was stopped briefly to add and removeattractants.
Data acquisition and analysisMeasurements were done as described before (Sourjik and Berg,2002) on a Zeiss Axio Imager.Z1 microscope equipped with a40x/0.75 EC Plan-Neofluar objective and controlled by Axiovisionsoftware. CFP fluorescence of a dense monolayer was excited at436/20 nm through a 455 nm dichroic mirror by a 75 W Xenon lampattenuated 500-fold with neutral density filters. CFP and YFPemissions were detected through 480/40 nm band pass and 520 nmlong-pass emission filters, respectively, and signals were collectedwith an integration time of 1 s by Peltier-cooled photon counters(Hamamatsu) equipped with a PCI-6034 counting board connectedto a computer with custom written LabView7 software (both fromNational Instruments). FRET values were calculated as describedpreviously (Sourjik and Berg, 2002; Sourjik et al, 2007; seeSupplementary methods for details).
Direct and indirect ligand binding in chemotaxisS Neumann et al
&2010 European Molecular Biology Organization The EMBO Journal VOL 29 | NO 20 | 2010 3493
Receptor quantificationReceptor quantification was performed using immunoblot and FACSanalyses as described in Supplementary data and in SupplementaryFigures S4 and S5. For YFP quantification using FACScan (BectonDickinson), cells were prepared as for FRET and diluted 1:20. Forimmunoblots, cells were harvested by centrifugation and resuspendedin 1� Laemmli buffer to give the same YFP concentration, determinedby the FACS value, in all samples. Samples were boiled and separated by10% SDS–PAGE, with several consecutive dilutions of each samplebeing applied to each gel (Supplementary Figure S4). Proteins were thentransferred to a 0.2-mm pore-size Hybond ECL nitrocellulose membraneusing tank blotting. Receptor detection was performed using primarypolyclonal aTrg (kindly provided by G Hazelbauer) or aTar antibodyat 1:5000 dilution and IRDyes 800 conjugated secondary antibody(Rockland) at 1:10000 dilution. Membranes were scanned with anOdysseys Imager (LI-COR) and protein bands were quantified usingImageJ software (http://rsbweb.nih.gov/ij). The background signalfrom empty areas of the membrane was subtracted. Only bands in thelinear intensity range were used for subsequent analyses. Specificity ofaTrg and aTar antibodies for individual receptors was determined byusing YFP fusions to receptors as a reference. To check the consistencyof YFP loading in the reference samples, control immunoblotting wasperformed using aGFP monoclonal antibody (JL-8; Clontech) and IRDye700 conjugated secondary antibody (Rockland).
Estimation of relative BP expressionExpression of BPs was assumed to be proportional to the expressionof YFP controlled by the same promoter (pnahG), determined by the
FACScan analysis. For FACS, cells expressing eYFP from pVS118 andcarrying an empty pTrc99a vector were induced over a range of0–10 mM salicylate, and grown and prepared as for FRETexperiments.
Supplementary dataSupplementary data are available at The EMBO Journal Online(http://www.embojournal.org).
Acknowledgements
We thank GL Hazelbauer for the gift of aTrg antibody. This workwas supported by grants RGP66/2005 from the Human FrontierScience Program, SO 421/7-1 and SO 421/3-3 from the DeutscheForschungsgemeinschaft and GM082938 from the NationalInstitutes of Health. VS and NSW acknowledge the hospitality ofthe Aspen Center for Physics.
Author contributions: VS, SN, and NSW designed the research; SNperformed the experimental research; CH and NSW performed themathematical modelling; VS, SN, CH, and NSW wrote the paper.
Conflict of interest
The authors declare that they have no conflict of interest.
References
Adler J, Epstein W (1974) Phosphotransferase-system enzymes aschemoreceptors for certain sugars in Escherichia coli chemotaxis.Proc Natl Acad Sci USA 71: 2895–2899
Adler J, Hazelbauer GL, Dahl MM (1973) Chemotaxis toward sugarsin Escherichia coli. J Bacteriol 115: 824–847
Adler J, Tso WW (1974) ‘Decision’-making in bacteria: chemotacticresponse of Escherichia coli to conflicting stimuli. Science 184:1292–1294
Ames P, Studdert CA, Reiser RH, Parkinson JS (2002) Collaborativesignalling by mixed chemoreceptor teams in Escherichia coli.Proc Natl Acad Sci USA 99: 7060–7065
Anraku Y (1968) Transport of sugars and amino acids in bacteria. I.Purification and specificity of the galactose- and leucine-bindingproteins. J Biol Chem 243: 3116–3122
Baba T, Ara T, Hasegawa M, Takai Y, Okumura Y, Baba M, DatsenkoKA, Tomita M, Wanner BL, Mori H (2006) Construction ofEscherichia coli K-12 in-frame, single-gene knockout mutants:the Keio collection. Mol Syst Biol 2: 2006.0008
Berg HC, Block SM (1984) A miniature flow cell designed for rapidexchange of media under high-power microscope objectives. J GenMicrobiol 130: 2915–2920
Berg HC, Brown DA (1972) Chemotaxis in Escherichia coli analysedby three-dimensional tracking. Nature 239: 500–504
Berg HC, Purcell EM (1977) Physics of chemoreception. Biophys J20: 193–219
Bialek W, Setayeshgar S (2005) Physical limits to biochemicalsignaling. Proc Natl Acad Sci USA 102: 10040–10045
Borkovich KA, Alex LA, Simon MI (1992) Attenuation of sensoryreceptor signalling by covalent modification. Proc Natl Acad SciUSA 89: 6756–6760
Bray D, Levin MD, Morton-Firth CJ (1998) Receptor clusteringas a cellular mechanism to control sensitivity. Nature 393:85–88
Budrene EO, Berg HC (1991) Complex patterns formed by motilecells of Escherichia coli. Nature 349: 630–633
Datsenko KA, Wanner BL (2000) One-step inactivation of chromo-somal genes in Escherichia coli K-12 using PCR products. Proc NatlAcad Sci USA 97: 6640–6645
Duke TA, Le Novere N, Bray D (2001) Conformational spread in aring of proteins: a stochastic approach to allostery. J Mol Biol 308:541–553
Endres RG, Oleksiuk O, Hansen CH, Meir Y, Sourjik V, Wingreen NS(2008) Variable sizes of Escherichia coli chemoreceptor signalingteams. Mol Syst Biol 4: 211
Endres RG, Wingreen NS (2006) Precise adaptation in bacterialchemotaxis through ‘assistance neighborhoods’. Proc Natl AcadSci USA 103: 13040–13044
Gardina PJ, Bormans AF, Manson MD (1998) A mechanism forsimultaneous sensing of aspartate and maltose by the Tar che-moreceptor of Escherichia coli. Mol Microbiol 29: 1147–1154
Gegner JA, Graham DR, Roth AF, Dahlquist FW (1992) Assemblyof an MCP receptor, CheW, and kinase CheA complex inthe bacterial chemotaxis signal transduction pathway. Cell 70:975–982
Gestwicki JE, Kiessling LL (2002) Inter-receptor communicationthrough arrays of bacterial chemoreceptors. Nature 415: 81–84
Hansen CH, Endres RG, Wingreen NS (2008) Chemotaxis inEscherichia coli: a molecular model for robust precise adaptation.PLoS Comput Biol 4: e1
Hazelbauer GL (1975) Maltose chemoreceptor of Escherichia coli.J Bacteriol 122: 206–214
Hazelbauer GL, Engstrom P, Harayama S (1981) Methyl-acceptingchemotaxis protein III and transducer gene trg. J Bacteriol 145:43–49
Hazelbauer GL, Mesibov RE, Adler J (1969) Escherichia coli mutantsdefective in chemotaxis toward specific chemicals. Proc Natl AcadSci USA 64: 1300–1307
Higgins CF, Gallagher MP, Hyde SC, Mimmack ML, Pearce SR(1990) Periplasmic binding protein-dependent transport systems:the membrane-associated components. Philos Trans R Soc Lond BBiol Sci 326: 353–364
Kalinin Y, Neumann S, Sourjik V, Wu M (2010) Responsesof Escherichia coli bacteria to two opposing chemoattractantgradients depend on the chemoreceptor ratio. J Bacteriol 192:1796–1800
Keymer JE, Endres RG, Skoge M, Meir Y, Wingreen NS (2006)Chemosensing in Escherichia coli: two regimes of two-statereceptors. Proc Natl Acad Sci USA 103: 1786–1791
Kim YM, Ogawa W, Tamai E, Kuroda T, Mizushima T, Tsuchiya T(2002) Purification, reconstitution, and characterization ofNa(+)/serine symporter, SstT, of Escherichia coli. J Biochem132: 71–76
Koman A, Harayama S, Hazelbauer GL (1979) Relation of chemo-tactic response to the amount of receptor: evidence for differentefficiencies of signal transduction. J Bacteriol 138: 739–747
Lai RZ, Manson JM, Bormans AF, Draheim RR, Nguyen NT,Manson MD (2005) Cooperative signalling among bacterialchemoreceptors. Biochemistry 44: 14298–14307
Direct and indirect ligand binding in chemotaxisS Neumann et al
The EMBO Journal VOL 29 | NO 20 | 2010 &2010 European Molecular Biology Organization3494

Levit MN, Stock JB (2002) Receptor methylation controls themagnitude of stimulus-response coupling in bacterial chemo-taxis. J Biol Chem 277: 36760–36765
Li G, Weis RM (2000) Covalent modification regulates ligandbinding to receptor complexes in the chemosensory system ofEscherichia coli. Cell 100: 357–365
Li M, Hazelbauer GL (2004) Cellular stoichiometry of the compo-nents of the chemotaxis signalling complex. J Bacteriol 186:3687–3694
Li M, Hazelbauer GL (2005) Adaptational assistance in clusters ofbacterial chemoreceptors. Mol Microbiol 56: 1617–1626
Macnab RM, Koshland Jr DE (1972) The gradient-sensing mecha-nism in bacterial chemotaxis. Proc Natl Acad Sci USA 69:2509–2512
Maddock JR, Shapiro L (1993) Polar location of the chemo-receptor complex in the Escherichia coli cell. Science 259:1717–1723
Manson MD, Boos W, Bassford Jr PJ, Rasmussen BA (1985)Dependence of maltose transport and chemotaxis on the amountof maltose-binding protein. J Biol Chem 260: 9727–9733
Manson MD, Kossmann M (1986) Mutations in tar suppress defectsin maltose chemotaxis caused by specific malE mutations. J Bacteriol165: 34–40
McFall E, Newman EB (1996) Amino acids as carbon sources.In Escherichia coli and Salmonella: Cellular and MolecularBiology, Neidhardt FC, Curtiss III R, Ingraham JL, Lin ECC,Low KB, Magasanik B, Reznikoff WS, Riley M, Schaechter M,Umbarger HE (eds), pp 358–379. Washington, D.C: ASM Press
Mello BA, Tu Y (2005) An allosteric model for heterogeneousreceptor complexes: understanding bacterial chemotaxis res-ponses to multiple stimuli. Proc Natl Acad Sci USA 102:17354–17359
Mello BA, Tu Y (2007) Effects of adaptation in maintaining highsensitivity over a wide range of backgrounds for Escherichia colichemotaxis. Biophys J 92: 2329–2337
Mesibov R, Adler J (1972) Chemotaxis toward amino acids inEscherichia coli. J Bacteriol 112: 315–326
Mesibov R, Ordal GW, Adler J (1973) The range of attractantconcentrations for bacterial chemotaxis and the threshold andsize of response over this range. Weber law and related phenom-ena. J Gen Physiol 62: 203–223
Mowbray SL, Koshland Jr DE (1987) Additive and independentresponses in a single receptor: aspartate and maltose stimuli onthe tar protein. Cell 50: 171–180
Ordal GW, Adler J (1974) Properties of mutants in galactose taxisand transport. J Bacteriol 117: 517–526
Park S, Wolanin PM, Yuzbashyan EA, Lin H, Darnton NC, Stock JB,Silberzan P, Austin R (2003) Influence of topology on bacterialsocial interaction. Proc Natl Acad Sci USA 100: 13910–13915
Postma PW, Lengeler JW, Jacobson GR (1993) Phosphoenolpyruvate:carbohydrate phosphotransferase systems of bacteria. Microbiol Rev57: 543–594
Salman H, Libchaber A (2007) A concentration-dependent switch inthe bacterial response to temperature. Nat Cell Biol 9: 1098–1100
Schellenberg GD, Furlong CE (1977) Resolution of the multiplicityof the glutamate and aspartate transport systems of Escherichiacoli. J Biol Chem 252: 9055–9064
Sourjik V, Berg HC (2000) Localization of components of thechemotaxis machinery of Escherichia coli using fluorescent pro-tein fusions. Mol Microbiol 37: 740–751
Sourjik V, Berg HC (2002) Receptor sensitivity in bacterial chemo-taxis. Proc Natl Acad Sci USA 99: 123–127
Sourjik V, Berg HC (2004) Functional interactions between receptorsin bacterial chemotaxis. Nature 428: 437–441
Sourjik V, Vaknin A, Shimizu TS, Berg HC (2007) In vivo measure-ment by FRET of pathway activity in bacterial chemotaxis.Methods Enzymol 423: 365–391
Strange PG, Koshland Jr DE (1976) Receptor interactions in asignalling system: competition between ribose receptor andgalactose receptor in the chemotaxis response. Proc Natl AcadSci USA 73: 762–766
Yaghmai R, Hazelbauer GL (1993) Strategies for differential sensoryresponses mediated through the same transmembrane receptor.EMBO J 12: 1897–1905
Zeppenfeld T, Larisch C, Lengeler JW, Jahreis K (2000) Glucosetransporter mutants of Escherichia coli K-12 with changes insubstrate recognition of IICB(Glc) and induction behavior of theptsG gene. J Bacteriol 182: 4443–4452
Zhang Y, Gardina PJ, Kuebler AS, Kang HS, Christopher JA, MansonMD (1999) Model of maltose-binding protein/chemoreceptorcomplex supports intrasubunit signaling mechanism. Proc NatlAcad Sci USA 96: 939–944
Direct and indirect ligand binding in chemotaxisS Neumann et al
&2010 European Molecular Biology Organization The EMBO Journal VOL 29 | NO 20 | 2010 3495