Differences in Rust in Hearing Aid Batteries across … · Differences in Rust in Hearing Aid...
17
846 J Am Acad Audiol 18:846–862 (2007) *Washington University School of Medicine; †Saint Louis Children's Hospital, Saint Louis, MO; ‡Evans Analytical Group, Chanhassen, MN Michael Valente, Ph.D., Professor of Clinical Otolaryngology, Director of Adult Audiology, Washington University School of Medicine, Campus Box 8115, 4566 Scott Ave., St. Louis, MO 63110; Phone: 314-362-7457; Fax: 314-747-5593; E-mail: [email protected] Differences in Rust in Hearing Aid Batteries across Four Manufacturers, Four Battery Sizes, and Five Durations of Exposure Michael Valente* Jamie H. Cadieux† Laura Flowers* John G. Newman‡ Juergen Scherer‡ Greg Gephart‡ Abstract Three hundred twenty zinc-air batteries representing four manufacturers (Energizer, Power One, Duracell, and Ray-O-Vac) and four cell sizes (10, 312, 13, and 675) were exposed in a salt spray fog apparatus for 2.5, 5.5, 24, 48, and 72 hours. At the conclusion of each exposure, the batteries were rated blindly for the presence of rust by four experienced audiologists using a four point rating scale. Results revealed significant differences in the rating of rust across the four manufacturers and duration of exposure. No statistically significant difference was found across cell size. Also, the correlation between raters was exceptionally high indicating that each audiologist rated the presence of rust for each battery in a very similar manner. Scanning electron microscopy (SEM), energy dispersive x-ray spectroscopy (EDS), and Auger electron spectroscopy (AES) techniques were applied and provided answers for the observed differences in rust between the four manufacturers. Key Words: Auger electron spectroscopy, corrosion, Duracell, Energizer, energy dispersive x-ray spectroscopy, hearing aid battery, Power One, Ray- O-Vac, rust, salt spray fog apparatus, scanning electron microscopy, zinc air Abbreviations: AES = Auger electron spectroscopy; ASTM = American Society for Testing Materials; BTE = behind-the-ear; C = carbon; Cl = chlorine; Cr = chromium; D = depth; EDS = energy dispersive x-ray spectroscopy; ITE = in- the-ear; F = Fahrenheit; Fe = iron; H = height; KeV = kilo electron volts; N = nitrogen; Na = sodium; NaCl = sodium chloride; Ni = nickel; O = oxygen; PSI = pressure per square inch; RH = relative humidity; SEM = scanning electron microscopy; Si = silicon; W = width Sumario Trescientas veinte batería de aire-zinc, pertenecientes a cuatro fabricantes (Energizer, Power One, Duracell, and Ray-O-Vac) y cuatro tamaños de baterías (10, 312, 13, and 675) fueron expuesta a un aparato de neblina de atomización de sal durante 2.5, 5.5, 24, 48, y 72 horas. Al final de cada exposición, las baterías fueron evaluadas en forma ciega por cuatro audiólogos experimentados buscando la presencia de herrumbre, por medio de una escala de cuatro puntos. Los resultados revelaron diferencias significativas en la calificación del herrumbre en relación a los cuatro fabricantes y la duración de la exposición. No se encontraron diferencias estadísticamente significativas en cuanto al tamaño de las baterías. También, la correlación entre evaluadores fue
Transcript of Differences in Rust in Hearing Aid Batteries across … · Differences in Rust in Hearing Aid...
846
J Am Acad Audiol 18:846–862 (2007)
*Washington University School of Medicine; †Saint Louis Children's Hospital, Saint Louis, MO; ‡Evans AnalyticalGroup, Chanhassen, MN
Michael Valente, Ph.D., Professor of Clinical Otolaryngology, Director of Adult Audiology, Washington UniversitySchool of Medicine, Campus Box 8115, 4566 Scott Ave., St. Louis, MO 63110; Phone: 314-362-7457; Fax: 314-747-5593; E-mail: [email protected]
Differences in Rust in Hearing Aid Batteriesacross Four Manufacturers, Four Battery Sizes,and Five Durations of Exposure
Michael Valente*Jamie H. Cadieux†Laura Flowers*John G. Newman‡Juergen Scherer‡Greg Gephart‡
Abstract
Three hundred twenty zinc-air batteries representing four manufacturers(Energizer, Power One, Duracell, and Ray-O-Vac) and four cell sizes (10, 312,13, and 675) were exposed in a salt spray fog apparatus for 2.5, 5.5, 24, 48,and 72 hours. At the conclusion of each exposure, the batteries were rated blindlyfor the presence of rust by four experienced audiologists using a four point ratingscale. Results revealed significant differences in the rating of rust across thefour manufacturers and duration of exposure. No statistically significantdifference was found across cell size. Also, the correlation between raters wasexceptionally high indicating that each audiologist rated the presence of rustfor each battery in a very similar manner. Scanning electron microscopy(SEM), energy dispersive x-ray spectroscopy (EDS), and Auger electronspectroscopy (AES) techniques were applied and provided answers for theobserved differences in rust between the four manufacturers.
Key Words: Auger electron spectroscopy, corrosion, Duracell, Energizer,energy dispersive x-ray spectroscopy, hearing aid battery, Power One, Ray-O-Vac, rust, salt spray fog apparatus, scanning electron microscopy, zinc air
Abbreviations: AES = Auger electron spectroscopy; ASTM = American Societyfor Testing Materials; BTE = behind-the-ear; C = carbon; Cl = chlorine; Cr =chromium; D = depth; EDS = energy dispersive x-ray spectroscopy; ITE = in-the-ear; F = Fahrenheit; Fe = iron; H = height; KeV = kilo electron volts; N =nitrogen; Na = sodium; NaCl = sodium chloride; Ni = nickel; O = oxygen; PSI= pressure per square inch; RH = relative humidity; SEM = scanning electronmicroscopy; Si = silicon; W = width
Sumario
Trescientas veinte batería de aire-zinc, pertenecientes a cuatro fabricantes(Energizer, Power One, Duracell, and Ray-O-Vac) y cuatro tamaños de baterías(10, 312, 13, and 675) fueron expuesta a un aparato de neblina de atomizaciónde sal durante 2.5, 5.5, 24, 48, y 72 horas. Al final de cada exposición, lasbaterías fueron evaluadas en forma ciega por cuatro audiólogos experimentadosbuscando la presencia de herrumbre, por medio de una escala de cuatro puntos.Los resultados revelaron diferencias significativas en la calificación delherrumbre en relación a los cuatro fabricantes y la duración de la exposición.No se encontraron diferencias estadísticamente significativas en cuanto altamaño de las baterías. También, la correlación entre evaluadores fue

The first three authors are experiencedaudiologists who noticed differencesacross battery manufacturers in the
presence of rust in the battery compartment.An extensive search using the major searchengines and databases (SCOPUS, Web ofScience, PubMed, Google Scholar, WorldCat,ArticleFirst, CINAHL, ComDisDome,Applied Science, and INSPEC) and keywords such as “sweat,” “perspiration,” “corro-sion,” “corrosive,” “rust,” “hyperhidrosis,”“battery,” “batteries,” “hearing aid batteries,”“metals,” “high sweat production,” and “lowsweat production” could not locate any peer-reviewed studies investigating differences inrust production across battery manufactur-ers. It was these observations (i.e., presenceof a problem and little research available toprovide an answer) that served as the cata-lyst for this study.
A zinc-air battery is essentially a trans-ducer that converts one form of energy(chemical) to another form of energy (electri-cal). The magnitude of the converted energyis related to the size of the anode (negative)and cathode (positive) material, zinc metal,an electrode with a small amount of internalstored oxygen and access to additional oxy-gen from the air surrounding the battery.When the small amount of internal oxygen isused, the battery looks for oxygen outside thebattery. This is why air holes are in the bot-tom (positive side) of the zinc-air battery can.These holes allow air to access the cell toreplenish the oxygen supply which mixeswith the zinc metal and creates the electrical
discharge (McKenzie, 2003).One problem with hearing aid batteries is
their exposure to the environment, makingbatteries susceptible to the chemicals con-tained within sweat (predominantly sodiumchloride [NaCl], but also potassium, urea,creatine, creatinine, lactate, and phosphate).The “normal” concentration of NaCl in sweatat rest is approximately 1.8 grams/liter,where a liter is a little more than a quart(Lind, 1972). This amount of NaCl convertsto a concentration of approximately 0.2% byweight of NaCl in sweat. There is, however,significant inter and intra subject variationin the concentration of NaCl in sweat. Thisvariation can depend upon the intensity andduration of exercise, sweat rate, sodium lossratio, state of physical fitness, gender, age,diet, type and amount of clothing worn, tem-perature, relative humidity, acclimatization,level of hydration, and diseases such a pan-creatic cystic fibrosis which has a significant-ly higher concentration of NaCl in sweat. Forexample, sweat can contain 0.8 to 2.0grams/L (800 to 2000 milligrams) of NaCl ina heat-acclimatized individual and 3.0 to 4.0(approximately 0.3% to 0.4% by weight)grams/L (or more) in a non-acclimatized indi-vidual. Added to this is that sweat rates canvary by 1 to 3 liters per hour with subsequentgreater loss of NaCl. ISO 3160/2 (1982) is aninternational standard for the composition of“artificial sweat.” This standard calls for theamount of NaCl in sweat to be 20g/liter. Thiswould convert to a concentration of approxi-mately 2% of NaCl by weight per liter. The
RRuusstt iinn HHeeaarriinngg AAiidd BBaatttteerriieess/Valente et al
847
excepcionalmente alta, indicando que cada audiólogo valoró la presencia deherrumbre para cada batería en una forma muy similar. Se aplicaron técnicasde microscopía electrónica de escaneo (SEM), de espectroscopía de rayosx de energía dispersante (EDS) y de espectroscopía electrónica Auger (AES),y éstas aportaron respuestas para las diferencias observadas en el herrumbreentre los cuatro fabricantes.
Palabras Clave: Espectroscopía electrónica Auger, corrosión, Duracell,Energizer, espectroscopía de rayos x de energía dispersiva, batería de auxiliarauditivo, Power One, Ray-O-Vac, herrumbre, aparato de neblina por atomizaciónde sal, microscopia electrónica de escaneo, zinc-aire
Abreviaturas: AES = espectroscopía electrónica Auger; ASTM = SociedadAmericana de Evaluación de Materiales; BTE = retroauricular; C = carbón; Cl= cloruro; Cr = cromo; D = profundidad; EDS = espectroscopía de rayos x deenergía dispersante; F = Fahrenheit; ITE = intra-auricular; Fe = hierro; H = altura;KeV = voltio kilo electrónicos; N = nitrógeno; Na = sodio; NaCl = cloruro desodio; Ni = níquel; O = oxígeno; PSI = presión por pulgada cuadrada; RH =humedad relativa; SEM = microscopía electrónica de escaneo; Si = silicón;W = ancho
artificial sweat standardized in ISO 3160/2(1982) is used to assess the impact of sweaton products (jewelry; cosmetically treatedhair) that come into direct and prolongedcontact with the skin (Randin, 1988; Skoppet al, 1997). Thus, it can be stated that theconcentration of NaCl in sweat can vary fromas little as 0.2% to as great as 2% (Verde etal., 1982; Randin, 1988; Skopp et al., 1997).In addition, Buckley and Lewis (1960) report-ed that a concentration of as little as 0.5% to0.85% of NaCl in sweat can begin to corrodemild steel.
Unfortunately, NaCl in sweat serves as anelectrolyte promoting ionic conduction result-ing in rust (Carpenter, 2003). There are dif-ferences in the material used to manufactur-er the cathode can (positive side) of a zinc-airbattery as well as the manner in which thebattery is produced. These differences canvary considerably between manufacturerand may explain why some batteries aremore resistant to rust than others. For exam-ple, some manufacturers use stainless steelthat is less prone to corrosion, while othersuse steel and then plate (i.e., cover) the steelusing nickel (i.e., nickel plated) in a processcalled post-plating. Other manufacturerspre-plate the steel using nickel and thenmake the cathode can using a process calledpre-plating. There are also differences inplating methods. For example, some manu-facturers use an electro-less method thatdoes not use electricity as part of the process.This method tends to provide a relativelythin plate to cover the steel and it is not veryductile (i.e., can crack). Others use an elec-trolytic method where electrons are suppliedfrom a DC source. This method tends to yielda thicker plate to cover the steel that is moreductile (i.e., less prone to crack). Finally, mostmanufacturers use a tri-layer anode (nega-tive side) cup where nickel is on the outside,stainless steel in the middle and copper onthe inside that interfaces with the zinc anodemix on the inside of the battery. This materi-al, in combination with the nickel coveringthe steel, can provide good resistance to rust.
The process of forming the cathode maydamage the nickel plating leaving exposedcracks for moisture to come into contact withthe steel below the nickel covering. Thesecracks can also serve to expose the middlesteel layer of the anode cup causing a greaterprobability of producing rust. Finally, theedge where the can is punched from the strip
stock of steel is typically unplated and allthese spots can rust. Any crack present whena manufacturer closes the cathode can dur-ing production is a potential spot for corro-sion. Use of the thin plating technique (i.e.,electro-less) might not be sufficient to coverthese surface imperfections, whereas theelectrolytic method will provide greater pro-tection.
The impact of battery rust on hearing aidperformance is probably minimal at firstuntil the buildup, occurring over time, cor-rodes the battery contacts and/or wires with-in the battery compartment. This process cantake a considerable amount of time that caneventually lead to intermittency or a “dead”hearing aid. Although not studied in thepresent investigation, the presence of rustcould also act as a “stand-off,” pushing thebattery away from the contacts, resulting inloss of performance. This would be somewhatanalogous to a flashlight sometimes provid-ing a brighter light when the battery cap isscrewed on tighter. In a hearing aid, betterbattery contact could provide better clarityand longer battery life (Phil Cooper, pers.comm., 2007). Finally, the presence of rust inthe battery compartment, even if not impact-ing hearing aid performance, is simply unac-ceptable and unsightly just as the presence ofdirt on any consumer product is unacceptableeven though its presence has little or noimpact on performance. For some patients,rust in the battery compartment is a sourceof embarrassment because they feel the audi-ologist may question how well they care fortheir aids as well as being reflective of theiroverall personal hygiene.
The presence of battery rust can be of sig-nificant clinical importance for professionalsand patients dealing with issues related toamplification. Professionals and consumerswould be interested to know if differences inrust are present as duration of exposureincreases, as well as between battery manu-facturers and battery sizes. This informationmight be beneficial when professionals coun-sel their patients on the use and care of bat-teries as well as possibly “steering” patientsto one manufacturer or another because ofdifferences in the development of rust. Inaddition, this information might be of inter-est to patients who reside or visit regions ofthe world where humidity is higher becausegreater humidity typically results in greatersweat. This would be especially true for
JJoouurrnnaall ooff tthhee AAmmeerriiccaann AAccaaddeemmyy ooff AAuuddiioollooggyy/Volume 18, Number 10, 2007
848
patients who have a tendency to sweat exces-sively. For example, patients, or parents ofpatients, involved in athletics would be inter-ested because research has shown that thesodium concentration in sweat during exer-cise increases significantly relative to sodiumconcentration in sweat when at rest(Robinson et al, 1956; Kozlowski and Saltin,1964; Shirreffs et al, 2005). Another exampleof patients who sweat more than usual is asub-group of workers within industries mak-ing metal products that are known as“rusters” (Buckley and Lewis, 1960; Burtonet al., 1976; Jensen, 1979; Jensen andNielsen, 1979). In these workers, their NaClconcentration is so high that they can causemetal to rust in a short time by simply touch-ing any metal component used to make theproduct. For these workers, a screening testhas been developed and procedures madeavailable to reduce the concentration of NaClin their sweat while working.
In an attempt to determine how wide-spread the problem of rust in the batterycompartment may be, the primary authorcontacted eight major hearing aid manufac-turers to determine what percent of annualhearing aid repairs were related specificallyto rust in the battery compartment. Whileone manufacturer reported such data wasnot available because this problem is com-bined into the general category of “moisturerelated problems,” another manufacturerreported this problem was present in lessthan 1% of repairs. Still another manufac-turer stated it was present in about 3-5% ofbehind-the ear (BTE) aids and almost neverin in-the-ear (ITE) aids. Another manufac-turer reported battery rust was present inabout 35% of behind-the-ear (BTE) and 5% ofin-the-ear (ITE) repairs. Yet another manu-facturer stated that battery contacts arereplaced on almost all devices that are for-warded for repair because “any unit that hasbeen in use for any length of time will have atleast a little discoloration and the manufac-turer wants to ship the device back to thepatient looking new.” In addition, some man-ufacturers provide batteries when new hear-ing aids are shipped. Recently, at least onemanufacturer changed battery vendorsbecause use of a previous vendor resulted inbattery rust that resulted in excessiverepairs and a poorer than desired imageupon the manufacturer. Viewing the sum ofthe information derived from the manufac-
turers, as well as the other factors citedabove, it is the opinion of the authors thatbattery rust should not be dismissed as atrite or insignificant matter.
With these thoughts in mind, the authorsengaged in a study to investigate possible dif-ferences in rust across four battery sizes usedin hearing aids (10, 312, 13 and 675) andacross four major battery manufacturers(Energizer, Power One, Duracell, and Ray-O-Vac). To assess possible differences in rust, alarge sample of the four battery sizes fromthe four manufacturers were exposed to saltwater in a salt spray fog apparatus for dura-tions of 2.5, 5.5, 24, 48, and 72 hours. For theexperimental conditions (four manufactur-ers, four battery sizes and five durations ofexposure), four experienced audiologistsindependently rated the presence of rustusing a four point interval scale. At the con-clusion of the study, the investigators hopedto answer the following major questions:
1. Were significant differences present inrust as the duration of exposure increased forthe intervals investigated in this study?
2. Were significant differences present inrust between the four battery manufacturersinvestigated in this study?
3. Were significant differences present inrust for the four battery sizes investigated inthis study?
4. What was the relationship in rating thepresence or absence of rust between the fourraters across the four test runs?
5. If significant differences are presentthen what may account for those differences?
MMEETTHHOODDOOLLOOGGYY
BBaatttteerryy PPuurrcchhaassee
Ninety-nine individual packages of batter-ies were purchased by an independent firmfrom nine cities (Chicago, Minneapolis,Philadelphia, St. Louis, Houston, Seattle,Los Angeles, Miami, and Burr Ridge) andeleven sources (Osco, Meijer, Walmart, CVS,Menards, Target, Albertson’s, Longs,Walgreens, Micropower Battery Company,and HITEC group). These batteries were rep-resentative of the four sizes of zinc-air bat-teries (10, 312, 13, and 675) and the fourmanufacturers (Energizer, Power One, Ray-O-Vac, and Duracell) used in the currentstudy. The expiration date on each packageranged from January 2008 to December
RRuusstt iinn HHeeaarriinngg AAiidd BBaatttteerriieess/Valente et al
849

2009. Upon arrival, each package was pro-vided an identification number (ID) (1-99)and an Excel spreadsheet was created docu-menting the city, name of store, battery size,manufacturer, number of batteries withinthe package (four to 16), emboss-trackingnumber, and expiration date.
IIddeennttiiffiiccaattiioonn ooff BBaatttteerriieess aannddAAssssiiggnniinngg BBaatttteerriieess ffoorr TTeessttiinngg
The spreadsheet containing the ID num-bers for the 99 packages of batteries (repre-senting 1570 total purchased batteries fromthe four manufacturers and four cell sizes forsixteen possible combinations) were providedto a statistician. The statistician entered the99 ID numbers into a statistical softwarepackage that generated twenty randomorders of the sixteen possible combinations ofthe four manufacturers and four cell sizes.This ensured that each of the sixteen combi-nations was tested 20 times. The orders weregenerated using a Latin Square methodologyto ensure that no particular manufacturer orbattery size appeared consistently in a par-ticular ordinal position of a sequence of 16.These orders were then chained together togenerate the 320 (ID numbers of 1-99) posi-tions across eight cards. Figure 1 providesthe order for placement of each cell from thebatches 1-99 on the eight acrylic cards whereeach card contained 40 batteries across eightcolumns and five rows for a total of 320 cells.For example, in Figure 1, the numbers in thecells placed in the first row for Card #1 cor-responded to the battery pack ID 93, 94, 60,84, 34, 91, 20, and 67. In this example, thesecorresponded to Power One #675, Power One#10, Duracell #10, Duracell #312, Energizer#675, Power One 312, Energizer #10, andDuracell #312, respectively.
The authors carefully followed the outlinefor battery placement illustrated in Figure 1to place the 320 batteries onto the eightacrylic cards. First, five evenly spaced rows ofdouble sided tape were placed on each of theeight acrylic cards. When removing the bat-teries from their packs and placing them onthe cards, the positive side was placed on thetape so that the negative side was facing out.Also, when removing the batteries from thepacks and placing the batteries onto thecards, the authors used rubber gloves so oilor debris from our fingers did not contami-nate the batteries. Each card was then
placed into a plastic zip-lock bag after thebatteries were placed on the card. The cardwas not removed from the zip-lock bag untilplaced into the salt spray fog apparatus.
RRaattiinngg RRuusstt
RRaattiinngg SSccaallee
The following table is illustrative of the rat-ing scheme used by four experienced audiolo-gists to independently rate the magnitude ofrust on each battery once the batteries wereremoved from the salt spray fog apparatus.
Thus, a rating of “0” (None) meant thatno rust was observed via the naked eye orwhen observed under the microscope using10x magnification. A rating of “1” (Light)meant that light rust was not observed viathe naked eye, but was observed under themicroscope using 10x magnification. A rat-ing of “2” (Moderate) meant that rust wasnoticeable via the naked eye, while a ratingof “3” (Heavy) meant that rust was easilyobserved via the naked eye.
The photographs in Figure 2 were placedon the wall to the side of the microscopeused for rating as a reminder of the ratingscale. Also, the rating scale was repeated atthe bottom of each scoring sheet that theaudiologists used to rate each battery. Eachtest run contained two cards (80 batteries).Thus, two cards were placed in the saltspray fog apparatus each week. Each of thetwo cards was removed from the salt sprayfog apparatus at 2.5, 5.5, 24, 48, and 72hours of exposure. The total project ran forfour weeks. Cards #1 and #2 were placed inthe apparatus in the first week; Cards #3and #4 were placed in the apparatus thesecond week; Cards #5 and #6 were placedin the apparatus the third week; and Cards#7 and #8 were placed in the apparatus thefourth week.
JJoouurrnnaall ooff tthhee AAmmeerriiccaann AAccaaddeemmyy ooff AAuuddiioollooggyy/Volume 18, Number 10, 2007
850
Rating Corrosion0 = No rust observed at via the
naked eye or 10x magnification. None1 = Rust observed only at
10x magnification. Light2 = Rust noticeable via the
naked eye. Moderate3 = Rust easily observed via
the naked eye. Heavy

RRaatteerrss
Four experienced audiologists with three,five, 23 or 26 years of experience served asthe raters. Each audiologist independentlyobserved and rated each of the 320 batteriesat 2.5, 5.5, 24, 48, and 72 hours. Using a sin-gle blinded procedure, no rater had anyknowledge of the battery manufacturer thatwas being rated. In addition, no rater wasaware of the rating reported by any of theother raters.
SSaalltt SSpprraayy FFoogg AAppppaarraattuuss
Figure 3 illustrates and identifies themajor components of the MX-9208 Salt SprayFog apparatus used in this study. Not shownis the Panther Compact 106 compressor(115V/60 Hz) used to generate the pressurefor the line and water tower tank. On thecompressor were two gauges (line and tankpressure gauges). The line pressure gaugewas adjusted to 25 psi (red scale) or 1.75 µbar(black scale). A regulator was used and thegauge was set at 16.0 psi (+/- 0.5 psi). Thetypical compressor cycle for reference pur-poses was 17 seconds regeneration time(compressor on) with a 1 minute 20 seconddwell time (compressor off).
The MX-9208 Salt Spray Fog apparatus isa double-walled chamber used for corrosiveatmospheric tests and was operated duringthe course of the study as described in thestandard by the American Society for Testing
RRuusstt iinn HHeeaarriinngg AAiidd BBaatttteerriieess/Valente et al
851
FFiigguurree 11.. The battery identification (ID) numbers used toplace the 320 batteries on the eight acrylic cards.
FFiigguurree 22.. Four categories used to rate battery rust.

Materials (ASTM) B117 (2003). This appara-tus allows for the temperature between thetwo walls to provide warm air circulation, byblowers and a heater located at the base,between the inner and outer walls. The ther-mostat within the test area of the apparatusis factory set to control the temperature to95° F (+/- 2° F). When the chamber is operat-ed in accordance with the ASTM B117 prac-tice, the relative humidity (RH) within thechamber is between 95 and 98%. According toSection 6 of ASTM B117, RH is not a meas-ure that is recorded or necessary when theapparatus is properly maintained as indicat-ed by the psi, temperature, and accumulationmeasures.
The saturation water tower was adjustedfor a temperature of 112° F (+/- 2° F) and apressure reading of 12 psi (+/- 0.5 psi). Priorto each weekly run, the water level in thewater tower was filled with distilled water to2” below the cover.
For each of the four runs, two acrylic cardswith 40 batteries each (total of 80 batteries)were suspended on two lucite rods within theapparatus (negative side of the battery facingdown toward the inside of the apparatus).This prevented condensation of the salt sprayfog directly onto the battery which couldshort the anode and cathode thus promotinggalvanic corrosion. Clean, compressed airfrom the compressor was connected to an airvalve at the rear of the apparatus. This air at12 -15 psi was bubbled through a saturationtower containing distilled water and washeated to 112° F (+/- 2° F). The dry air thenbecomes humidified and enters the appara-tus. The saturated air passes over a siphontube that is immersed in a salt water reser-voir. By means of suction, the salt solution is
mixed with the air and atomized through thenozzle creating a “fog.” The preparation ofthe salt solution consists of sodium chloridecontaining no more than 0.1% of sodiumiodide and no more than 0.3% of total impu-rities. The 5% salt solution was purchased ina 50 gallon drum from National ExposureTesting Inc (NET) and is certified by NET tobe in compliance with ASTM B117 (2003)specifications. The solution was manufac-tured using Reagent Grade Size IV deionizedwater. During testing, the salt concentrationwas checked per ASTM B117-03 at 24, 48 and72 hours of exposure using a digital specificgravity hydrometer and measurements werealways within the specified range of 1.0255and 1.0400 g/mL with the water temperaturemeasured between 76-78° F. In addition, twoclean fog collectors were strategically placedwithin chamber so no drops of solution werecollected from the batteries. The atomizationand quantity of the fog was such that the col-lection rate was 1.0 to 2.0 mL of solution perhour within each collector based on an aver-age run of 16 hours. The inner working vol-ume of the apparatus is maintained at 95° Fby means of hot air being circulated in thecavity around the inner apparatus. There is awater trough along the top of the apparatuswhere the cover comes into contact with thetop of the apparatus. This trough is com-pletely filled with distilled water to create aseal so that the salt spray fog does not enterthe room where the salt spray fog apparatusresides.
The MX-9208 has a salt solution capacityof 11 gallons (41 liters). The saturation towerhas a capacity of 2 gallons (10 liters). Eachcan operate up to 72 continuous hours. Theinternal working dimension of the salt sprayfog apparatus is 24” (H) x 24” (W) x 24” (D).The external dimensions are 37” (H) x 48”(W) x 34” (D).
The MX-9208 and the procedures used inthis study adhere to the ASTM B117-03Standard Practice for Operating Salt Spray(Fog) Apparatus (ASTM, 2003).
SSccaannnniinngg EElleeccttrroonn MMiiccrroossccooppyy ((SSEEMM))//EEnneerrggyy DDiissppeerrssiivvee XX--rraayy SSppeeccttrroossccooppyy((EEDDSS))
SEM images of batteries were acquiredusing a JEOL Model 6300F field-emissioninstrument. An Oxford Model 6731 EDSattachment provided compositional analysis
JJoouurrnnaall ooff tthhee AAmmeerriiccaann AAccaaddeemmyy ooff AAuuddiioollooggyy/Volume 18, Number 10, 2007
852
FFiigguurree 33.. MX-9208 Salt Spray Fog apparatus and themajor components.
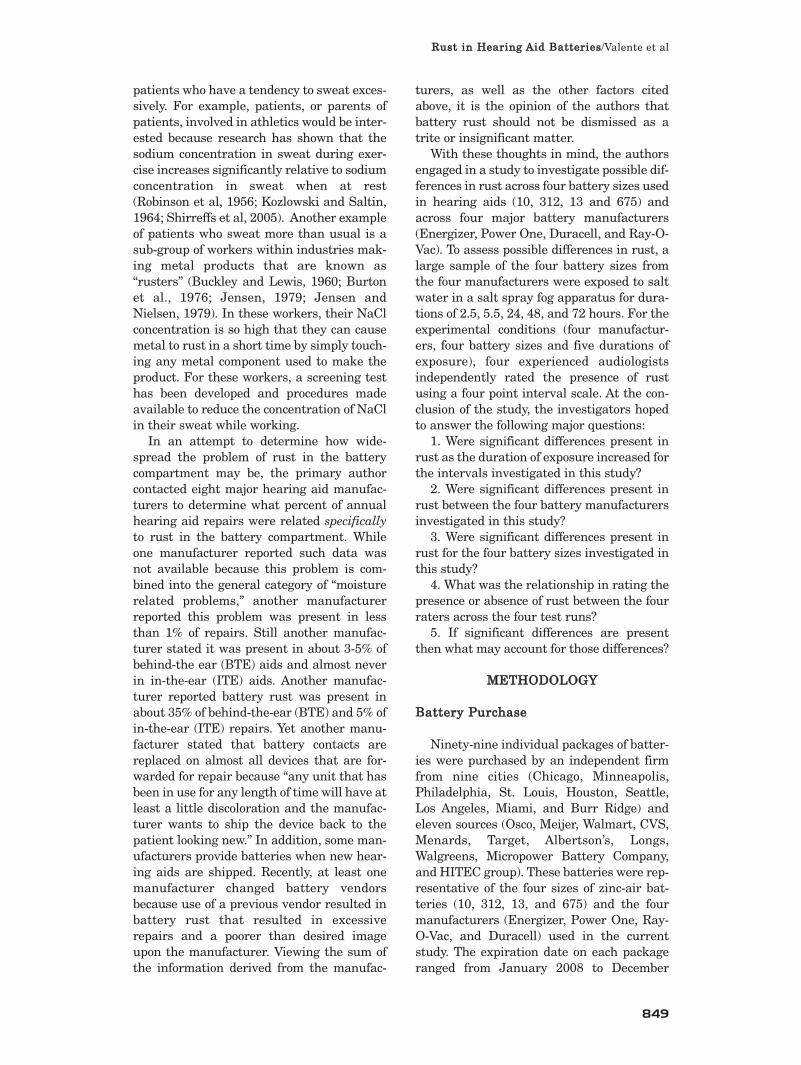
of the areas of interest. The depth of analy-sis of EDS is on the order of a few microns. Afresh unused sample of each of the fourbrands of batteries was removed from itspackaging and mounted directly onto a stan-dard 12 mm sample stub and introduced intothe high-vacuum chamber. The SEM andEDS analyses were performed using a 10KeV (kilo electron volts) primary electronbeam. Since the salt spray fog test showedcorrosion primarily in the cathode radius(Figure 4) this is the area that was studied.
AAuuggeerr EElleeccttrroonn SSppeeccttrroossccooppyy ((AAEESS))
Auger electron spectroscopy (AES) is anultra-high vacuum technique involving irra-diation of solid surfaces with a finely focusedbeam of electrons (primary electrons). As the
primary electrons strike the surface atoms,Auger electrons are emitted from the top ~5nm (nanometers) of the sample. The discreteenergies of the Auger electrons are measuredand are specific to the element from which itcame. The Auger data were acquired using aPhysical Electronics Model 680 Field-Emission Auger instrument. The same bat-teries as those analyzed with SEM and EDSwere used for the Auger studies. The pri-mary electron beam was operated at 10 KeVto obtain both secondary electron images andAuger data. The depth of analysis for theAuger technique is on the order of 5 nm. Toremove atmospheric contamination, a slightinert gas sputter cleaning of the samples wasperformed prior to Auger analysis. This wasaccomplished using a 2 KeV argon ion etchwithin the Auger system.
RREESSUULLTTSS
The ratings for rust for the three inde-pendent variables of duration of exposure
(five treatment levels of 2.5, 5.5, 24, 48, and72 hours), manufacturer (four treatment lev-els of Energizer, Power One, Duracell, andRay-O-Vac), and battery size (four treatmentlevels of 10, 312, 13, and 675) were analyzedusing a three-factor repeated randomizedanalysis of variance (ANOVA) and post-hocanalysis to identify any significant differ-ences. The magnitude of agreement betweenthe four raters across the four test runs wasanalyzed using Pearson product correlation.
Figures 5 to 7 summarize the major find-ings from this study achieving statistical sig-
RRuusstt iinn HHeeaarriinngg AAiidd BBaatttteerriieess/Valente et al
853
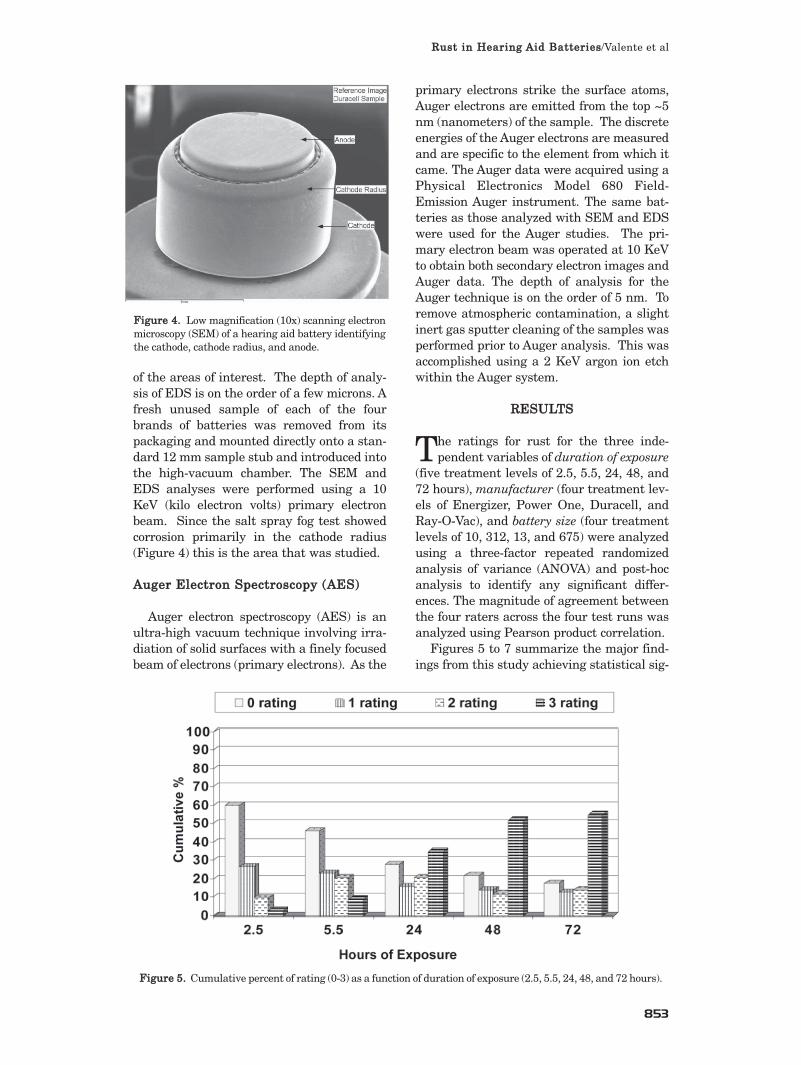
FFiigguurree 55.. Cumulative percent of rating (0-3) as a function of duration of exposure (2.5, 5.5, 24, 48, and 72 hours).
FFiigguurree 44.. Low magnification (10x) scanning electronmicroscopy (SEM) of a hearing aid battery identifyingthe cathode, cathode radius, and anode.
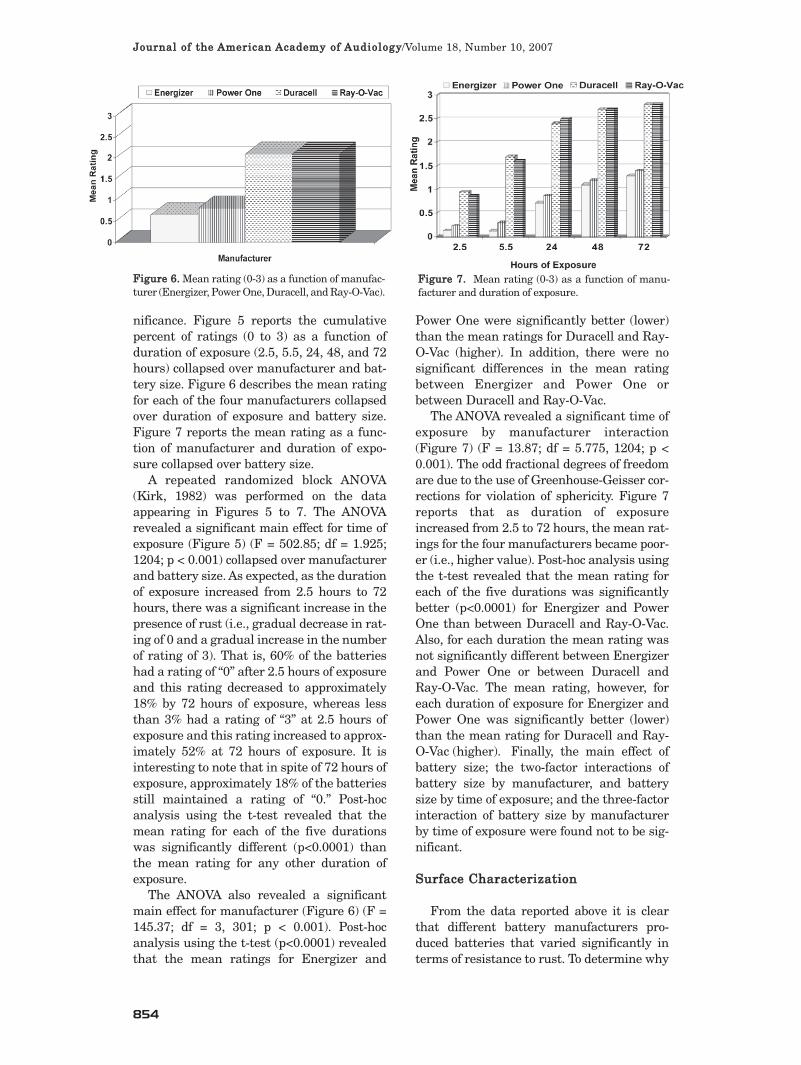
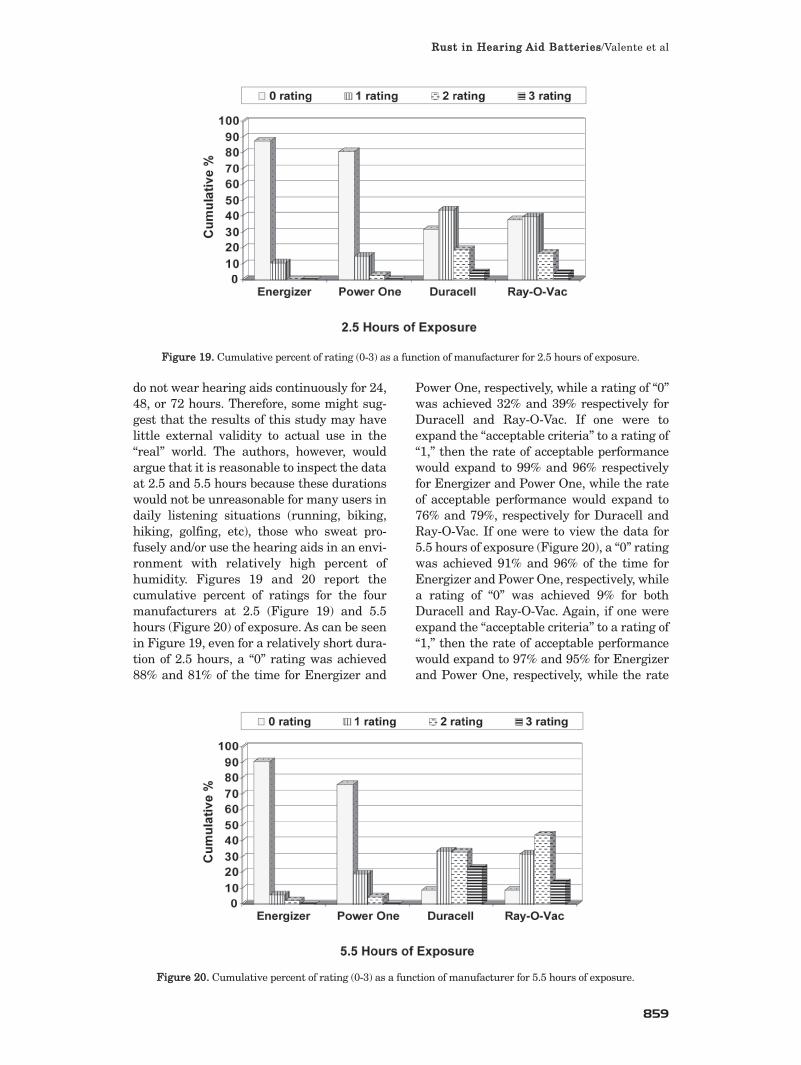
nificance. Figure 5 reports the cumulativepercent of ratings (0 to 3) as a function ofduration of exposure (2.5, 5.5, 24, 48, and 72hours) collapsed over manufacturer and bat-tery size. Figure 6 describes the mean ratingfor each of the four manufacturers collapsedover duration of exposure and battery size.Figure 7 reports the mean rating as a func-tion of manufacturer and duration of expo-sure collapsed over battery size.
A repeated randomized block ANOVA(Kirk, 1982) was performed on the dataappearing in Figures 5 to 7. The ANOVArevealed a significant main effect for time ofexposure (Figure 5) (F = 502.85; df = 1.925;1204; p < 0.001) collapsed over manufacturerand battery size. As expected, as the durationof exposure increased from 2.5 hours to 72hours, there was a significant increase in thepresence of rust (i.e., gradual decrease in rat-ing of 0 and a gradual increase in the numberof rating of 3). That is, 60% of the batterieshad a rating of “0” after 2.5 hours of exposureand this rating decreased to approximately18% by 72 hours of exposure, whereas lessthan 3% had a rating of “3” at 2.5 hours ofexposure and this rating increased to approx-imately 52% at 72 hours of exposure. It isinteresting to note that in spite of 72 hours ofexposure, approximately 18% of the batteriesstill maintained a rating of “0.” Post-hocanalysis using the t-test revealed that themean rating for each of the five durationswas significantly different (p<0.0001) thanthe mean rating for any other duration ofexposure.
The ANOVA also revealed a significantmain effect for manufacturer (Figure 6) (F =145.37; df = 3, 301; p < 0.001). Post-hocanalysis using the t-test (p<0.0001) revealedthat the mean ratings for Energizer and
Power One were significantly better (lower)than the mean ratings for Duracell and Ray-O-Vac (higher). In addition, there were nosignificant differences in the mean ratingbetween Energizer and Power One orbetween Duracell and Ray-O-Vac.
The ANOVA revealed a significant time ofexposure by manufacturer interaction(Figure 7) (F = 13.87; df = 5.775, 1204; p <0.001). The odd fractional degrees of freedomare due to the use of Greenhouse-Geisser cor-rections for violation of sphericity. Figure 7reports that as duration of exposureincreased from 2.5 to 72 hours, the mean rat-ings for the four manufacturers became poor-er (i.e., higher value). Post-hoc analysis usingthe t-test revealed that the mean rating foreach of the five durations was significantlybetter (p<0.0001) for Energizer and PowerOne than between Duracell and Ray-O-Vac.Also, for each duration the mean rating wasnot significantly different between Energizerand Power One or between Duracell andRay-O-Vac. The mean rating, however, foreach duration of exposure for Energizer andPower One was significantly better (lower)than the mean rating for Duracell and Ray-O-Vac (higher). Finally, the main effect ofbattery size; the two-factor interactions ofbattery size by manufacturer, and batterysize by time of exposure; and the three-factorinteraction of battery size by manufacturerby time of exposure were found not to be sig-nificant.
SSuurrffaaccee CChhaarraacctteerriizzaattiioonn
From the data reported above it is clearthat different battery manufacturers pro-duced batteries that varied significantly interms of resistance to rust. To determine why
JJoouurrnnaall ooff tthhee AAmmeerriiccaann AAccaaddeemmyy ooff AAuuddiioollooggyy/Volume 18, Number 10, 2007
854
FFiigguurree 66.. Mean rating (0-3) as a function of manufac-turer (Energizer, Power One, Duracell, and Ray-O-Vac).
FFiigguurree 77.. Mean rating (0-3) as a function of manu-facturer and duration of exposure.

this was true, morphological (SEM) and com-positional (EDS and AES) testing of the bat-tery surface was undertaken. To minimizeout-gassing of the batteries within the vacu-um test chambers, the #10 battery of eachmanufacturer was selected for testingbecause the salt spray fog tests clearlyreported that battery size was not a factor inthe degree of rust. As reported earlier, Figure4 shows a low magnification (10X) secondaryelectron image of one of the Duracell batter-ies. Since visually much of the rust appeared
to be located on the upper curved surface ofthe cathode (cathode radius), SEM imageswere obtained from this region on all fourbatteries. Figure 8 shows a higher magnifi-cation (100X) of the cathode radius on theDuracell battery. Several cracks or fissuresare readily observed in this curved section ofthe cathode. An even higher magnificationimage (2000X) of some of the representativefissures on the Duracell battery is shown inFigure 9. In this figure, “Spectrum 1” high-
RRuusstt iinn HHeeaarriinngg AAiidd BBaatttteerriieess/Valente et al
855
FFiigguurree 88.. SEM image (100x) of Duracell battery show-ing fissures in nickel plating along the cathode radiusregion.
FFiigguurree 99.. Increased magnification (2000x) of SEM ofa Duracell battery showing fissures along cathoderadius. Spectrum 1 points to a fissure, while Spectrum2 points to an area of nickel plating.
FFiigguurree 1100.. Energy dispersive x-ray spectroscopy (EDS) spectra of a Duracell battery for measurements made frominside the fissure (upper-spectrum 1) and on the nickel plating (lower- spectrum 2). Notice the peaks in Fe (iron),along with some Ni (nickel), found in the fissure (upper) and the peaks of predominantly nickel, along with someiron, found in the plating (lower). In EDS analysis, the ordinate is x-ray intensity and the abscissa is x-ray energy.

lights a fissure, while “Spectrum 2” highlightsa region of nickel plating. EDS analysis (inFigure 10) of an area (800 µm x 600 µm) out-side the fissure (lower curve of spectrum 2)shows a little Fe (iron), C (carbon), and P(phosphorus), but predominantly spikes of Ni(nickel). EDS analysis within a fissure (uppercurve of spectrum 1) shows a little Ni and P,but predominantly spikes of Fe. Since thedepth of analysis of EDS is on the order of afew micrometers, EDS cannot rule out thepossibility that a thin layer of protective nick-el is still present on top of the iron withinthese fissures, it is conceivable that the iron istotally exposed within the cracks and there-fore prone to corrosion. SEM (left image inFigure 11) and EDS (right in Figure 11)analysis of the Ray-O-Vac battery produced
results very similar to the Duracell batterywith deep narrow fissures observed along thecathode radius. EDS analysis of an area out-side the fissure shows O (oxygen), but pre-dominantly spikes of Ni. EDS analysis insidethe fissure show O and Ni, but predominant-ly spikes of Fe. The Power One battery alsoshowed cracks in the nickel plating (Figures12 and 13); however, the cracks were typical-ly wider and not as deep as those found on theDuracell and Ray-O-Vac batteries.Substantially more iron was again foundinside the cracks than outside the cracksusing EDS. The Energizer battery lookedquite different than the other batteries in thatthe SEM images showed no signs of crackingin the outer nickel plating and very little ironwas detected in the EDS spectra (Figure 14).
JJoouurrnnaall ooff tthhee AAmmeerriiccaann AAccaaddeemmyy ooff AAuuddiioollooggyy/Volume 18, Number 10, 2007
856
FFiigguurree 1111.. SEM (left) at 2000x magnification and Auger spectra (right) of a Ray-O-Vac battery where “1”is inside the fissure and “2” is on the nickel plating. Notice the large amounts of Fe and Ni found insidethe fissure (right-upper graph) and the high amounts of Ni found in the plating (right-lower graph). InAuger analysis, the ordinate is electron intensity and the abscissa is electron energy.
FFiigguurree 1122.. SEM (10x magnification) of Power One bat-tery showing fissures in nickel plating along the cathoderadius. Spectrum 1 points to the region of the nickel plat-ing, while Spectrum 2 points to an area of a fissure.
FFiigguurree 1133.. Increased magnification (2000x) of SEM ofPower One battery showing fissures along cathode radiusand noting the Fe base material exposed in the fissure.

The hypothesis that cracking of the pro-tective nickel plating of the batteries led toexposure of the underlying corrosion-proneiron fit the experimental salt spray fog rustresults for the Duracell, Ray-O-Vac, andEnergizer batteries. However, if cracking ofthe nickel plating is the problem, then thePower One batteries should also have per-formed poorly in the rust studies since crackswere also observed in the nickel plating onthis battery. At this point Auger electronspectroscopy (AES) was chosen to study thecompositions of the cracked regions of thebatteries in a much more surface sensitivemanner.
To determine if iron was present at thevery surface of the batteries, AES wereacquired from multiple areas, inside and out-side of cracks, on each of the batteries. Ironwas readily found within the cracks on theDuracell and Ray-O-Vac batteries, but wasnot readily observed on the Energizer orPower One batteries. Auger electron mapsfor iron were obtained on each of the samplesand show the lateral distribution of iron pres-ent in the field of view (800 µm x 600 µm).AES shows that the presence of iron (i.e.,“white spots”) follows the topography of thecracks on the Duracell (Figure 15) and Ray-O-Vac (Figure 16) batteries. On the PowerOne battery several small localized spots ofiron were detected (Figure 17); however, thespots are much more random in location andless in number than the Duracell or Ray-O-Vac batteries. For Energizer, only a few verysmall specs of iron were detected on the sur-face (Figure 18).
CCoorrrreellaattiioonn bbeettwweeeenn tthhee FFoouurr RRaatteerrssaanndd FFiivvee TTeesstt RRuunnss
Tables 1-4 report the Pearson correlationcoefficients between the four raters for thefour test runs. As can be seen, the correla-tions are remarkably high. This finding indi-cates that the same conclusion regardingrust would have been drawn regardless ofwhich audiologist made the rating. A couple
RRuusstt iinn HHeeaarriinngg AAiidd BBaatttteerriieess/Valente et al
857
FFiigguurree 1144.. Increased magnification (2000x) of SEM ofEnergizer battery showing no fissures along cathoderadius.
FFiigguurree 1155.. SEM (upper) andcorresponding Auger electronspectroscopy (AES) spectra(lower) iron map on a Duracellbattery. The white “specks”in the AES spectra iron mapreflect “spots” of iron detectedusing this procedure.
FFiigguurree 1166.. SEM (upper) andcorresponding Auger electronspectroscopy (AES) spectra(lower) iron map on a Ray-O-Vac battery. The white“specks” in the AES spectrairon map reflect “spots” of irondetected using this procedure.
FFiigguurree 1177.. SEM (upper) andcorresponding Auger electronspectroscopy (AES) spectra(lower) iron map on a PowerOne battery. The relativelyfew white “specks” in the AESspectra iron map reflect“spots” of iron detected usingthis procedure.
FFiigguurree 1188.. SEM (upper) andcorresponding Auger electronspectroscopy (AES) spectra(lower) iron map on an Ener-gizer battery. Notice only avery few white “specks” in theAES spectra iron map reflect“spots” of iron detected usingthis procedure.

of observations are worth noting. First, it canbe seen that the correlation between theRaters 1-3 after Test 1 was rather high (.75 to.82), but poorer between Raters 1-3 andRater 4 (.46 to .55). It became clear to thefirst author after reviewing the data from thefirst run that because of the wide discrepan-cy in the ratings reported by Rater 4 andRaters 1-3, (i.e., Rater 4 reported rust two tothree intervals poorer than Raters 1-3) thatperhaps it would be prudent to re-instructRater 4. As can be seen in Tables 2-4, the cor-relation between Rater 4 and Raters 1-3improved considerably for Tests 2-4. The sec-ond major observation is the general trend ofthe correlations gradually improving fromTests 1-4 for all four Raters. That is, inter-Rater consistency improved with greaterexperience. Finally, Table 5 reports thePearson pair-wise correlation after averagingthe Raters 1-4 for Tests 1-4. This illustratesthe high internal consistency of the four-judge composite rating for each time period.
DDiissccuussssiioonn
From the author’s perspective, the majorfinding of this study was the presence of sig-nificant differences between Energizer andPower One in revealing less rust thanDuracell or Ray-O-Vac under the same testconditions used in this study. One couldargue, however, that the durations of expo-sure in this study may be far greater thanusual when patients wear hearing aids dur-ing typical daily use. That is, users typically
JJoouurrnnaall ooff tthhee AAmmeerriiccaann AAccaaddeemmyy ooff AAuuddiioollooggyy/Volume 18, Number 10, 2007
858
Table 1. Pearson pair-wise correlations between Raters 1 to 4 for the first test of battery exposure.
Rater 1 2 3 4
1 1.00 0.82 0.75 0.55
2 1.00 0.80 0.46
3 1.00 0.55
4 1.00
Table 2. Pearson pair-wise correlations between Raters 1 to 4 for the second test of battery exposure.
Rater 1 2 3 4
1 1.00 0.87 0.83 0.76
2 1.00 0.86 0.78
3 1.00 0.79
4 1.00
Table 3. Pearson pair-wise correlations between Raters 1 to 4 for the third test of battery exposure.
Rater 1 2 3 4
1 1.00 0.88 0.88 0.82
2 1.00 0.87 0.85
3 1.00 0.82
4 1.00
Table 3. Pearson pair-wise correlations between Raters 1 to 4 for the fourth test of battery exposure.
Rater 1 2 3 4
1 1.00 0.92 0.91 0.88
2 1.00 0.91 0.88
3 1.00 0.88
4 1.00
Table 5. Pearson pair-wise correlation afteraveraging the four raters for each Test Run. This illustrates the internal consistency ofthe four-judge composite rating for eachtime period.
Test 1 0.88
Test 2 0.95
Test 3 0.96
Test 4 0.97
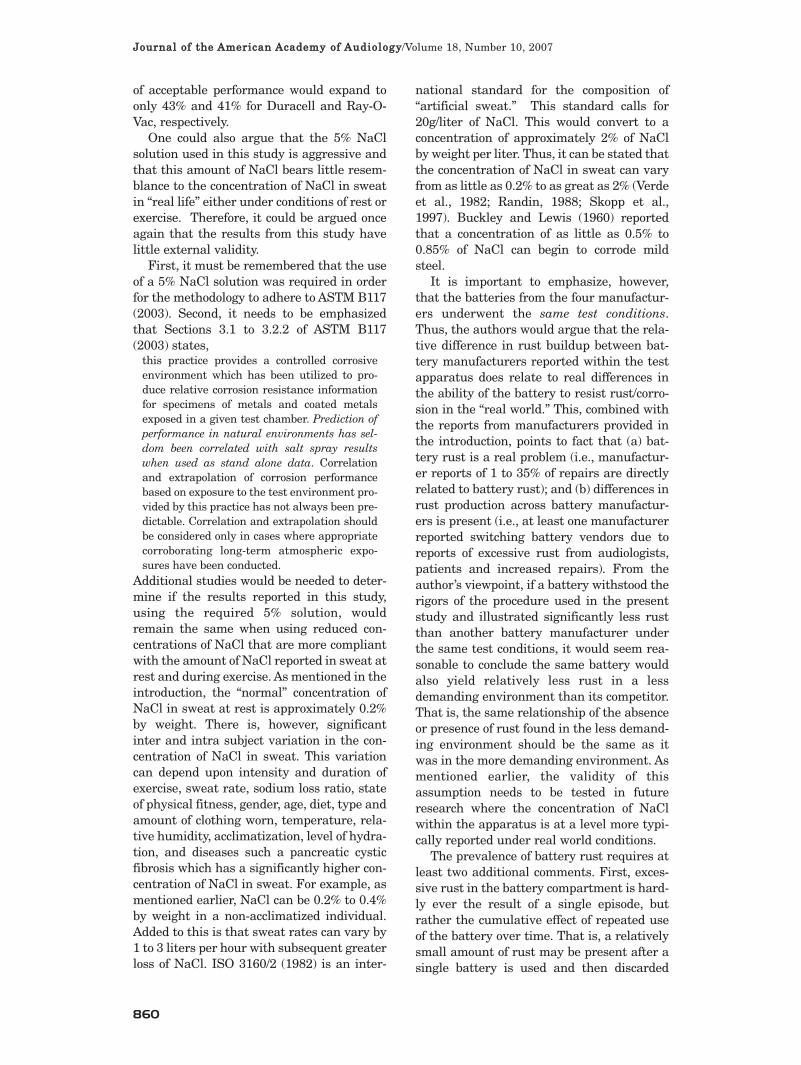
do not wear hearing aids continuously for 24,48, or 72 hours. Therefore, some might sug-gest that the results of this study may havelittle external validity to actual use in the“real” world. The authors, however, wouldargue that it is reasonable to inspect the dataat 2.5 and 5.5 hours because these durationswould not be unreasonable for many users indaily listening situations (running, biking,hiking, golfing, etc), those who sweat pro-fusely and/or use the hearing aids in an envi-ronment with relatively high percent ofhumidity. Figures 19 and 20 report thecumulative percent of ratings for the fourmanufacturers at 2.5 (Figure 19) and 5.5hours (Figure 20) of exposure. As can be seenin Figure 19, even for a relatively short dura-tion of 2.5 hours, a “0” rating was achieved88% and 81% of the time for Energizer and
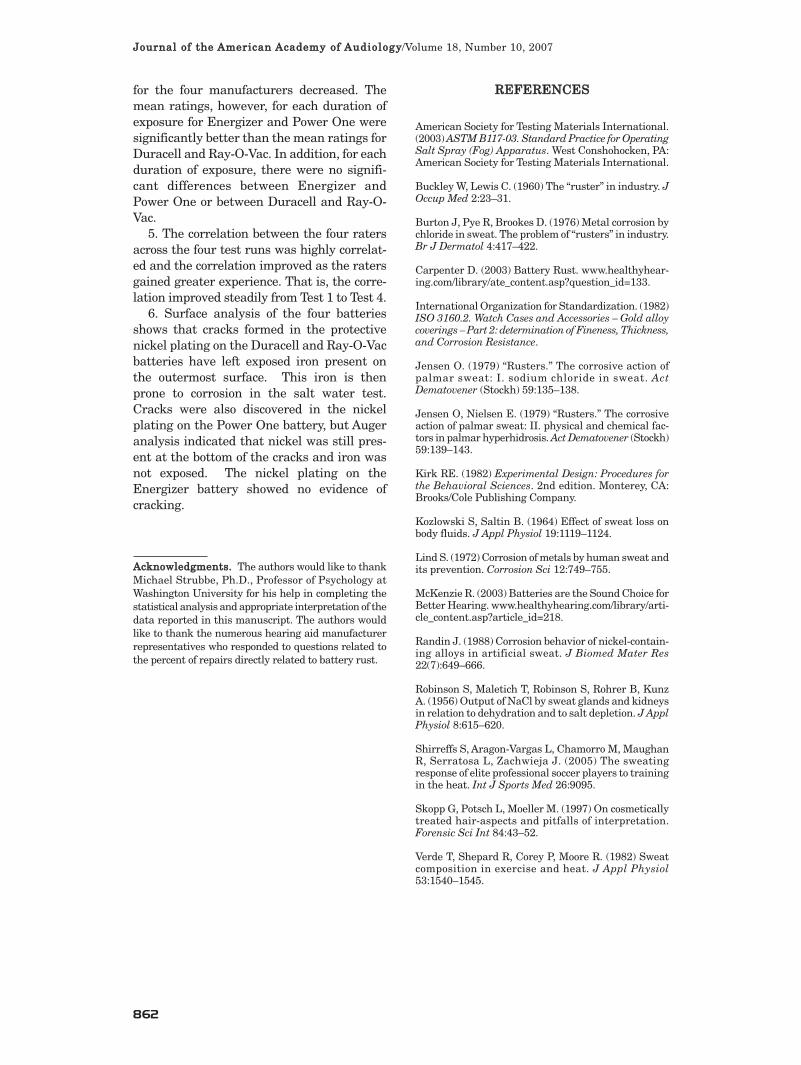
Power One, respectively, while a rating of “0”was achieved 32% and 39% respectively forDuracell and Ray-O-Vac. If one were toexpand the “acceptable criteria” to a rating of“1,” then the rate of acceptable performancewould expand to 99% and 96% respectivelyfor Energizer and Power One, while the rateof acceptable performance would expand to76% and 79%, respectively for Duracell andRay-O-Vac. If one were to view the data for5.5 hours of exposure (Figure 20), a “0” ratingwas achieved 91% and 96% of the time forEnergizer and Power One, respectively, whilea rating of “0” was achieved 9% for bothDuracell and Ray-O-Vac. Again, if one wereexpand the “acceptable criteria” to a rating of“1,” then the rate of acceptable performancewould expand to 97% and 95% for Energizerand Power One, respectively, while the rate
RRuusstt iinn HHeeaarriinngg AAiidd BBaatttteerriieess/Valente et al
859
FFiigguurree 1199.. Cumulative percent of rating (0-3) as a function of manufacturer for 2.5 hours of exposure.
FFiigguurree 2200.. Cumulative percent of rating (0-3) as a function of manufacturer for 5.5 hours of exposure.
of acceptable performance would expand toonly 43% and 41% for Duracell and Ray-O-Vac, respectively.
One could also argue that the 5% NaClsolution used in this study is aggressive andthat this amount of NaCl bears little resem-blance to the concentration of NaCl in sweatin “real life” either under conditions of rest orexercise. Therefore, it could be argued onceagain that the results from this study havelittle external validity.
First, it must be remembered that the useof a 5% NaCl solution was required in orderfor the methodology to adhere to ASTM B117(2003). Second, it needs to be emphasizedthat Sections 3.1 to 3.2.2 of ASTM B117(2003) states,
this practice provides a controlled corrosiveenvironment which has been utilized to pro-duce relative corrosion resistance informationfor specimens of metals and coated metalsexposed in a given test chamber. Prediction ofperformance in natural environments has sel-dom been correlated with salt spray resultswhen used as stand alone data. Correlationand extrapolation of corrosion performancebased on exposure to the test environment pro-vided by this practice has not always been pre-dictable. Correlation and extrapolation shouldbe considered only in cases where appropriatecorroborating long-term atmospheric expo-sures have been conducted.
Additional studies would be needed to deter-mine if the results reported in this study,using the required 5% solution, wouldremain the same when using reduced con-centrations of NaCl that are more compliantwith the amount of NaCl reported in sweat atrest and during exercise. As mentioned in theintroduction, the “normal” concentration ofNaCl in sweat at rest is approximately 0.2%by weight. There is, however, significantinter and intra subject variation in the con-centration of NaCl in sweat. This variationcan depend upon intensity and duration ofexercise, sweat rate, sodium loss ratio, stateof physical fitness, gender, age, diet, type andamount of clothing worn, temperature, rela-tive humidity, acclimatization, level of hydra-tion, and diseases such a pancreatic cysticfibrosis which has a significantly higher con-centration of NaCl in sweat. For example, asmentioned earlier, NaCl can be 0.2% to 0.4%by weight in a non-acclimatized individual.Added to this is that sweat rates can vary by1 to 3 liters per hour with subsequent greaterloss of NaCl. ISO 3160/2 (1982) is an inter-
national standard for the composition of“artificial sweat.” This standard calls for20g/liter of NaCl. This would convert to aconcentration of approximately 2% of NaClby weight per liter. Thus, it can be stated thatthe concentration of NaCl in sweat can varyfrom as little as 0.2% to as great as 2% (Verdeet al., 1982; Randin, 1988; Skopp et al.,1997). Buckley and Lewis (1960) reportedthat a concentration of as little as 0.5% to0.85% of NaCl can begin to corrode mildsteel.
It is important to emphasize, however,that the batteries from the four manufactur-ers underwent the same test conditions.Thus, the authors would argue that the rela-tive difference in rust buildup between bat-tery manufacturers reported within the testapparatus does relate to real differences inthe ability of the battery to resist rust/corro-sion in the “real world.” This, combined withthe reports from manufacturers provided inthe introduction, points to fact that (a) bat-tery rust is a real problem (i.e., manufactur-er reports of 1 to 35% of repairs are directlyrelated to battery rust); and (b) differences inrust production across battery manufactur-ers is present (i.e., at least one manufacturerreported switching battery vendors due toreports of excessive rust from audiologists,patients and increased repairs). From theauthor’s viewpoint, if a battery withstood therigors of the procedure used in the presentstudy and illustrated significantly less rustthan another battery manufacturer underthe same test conditions, it would seem rea-sonable to conclude the same battery wouldalso yield relatively less rust in a lessdemanding environment than its competitor.That is, the same relationship of the absenceor presence of rust found in the less demand-ing environment should be the same as itwas in the more demanding environment. Asmentioned earlier, the validity of thisassumption needs to be tested in futureresearch where the concentration of NaClwithin the apparatus is at a level more typi-cally reported under real world conditions.
The prevalence of battery rust requires atleast two additional comments. First, exces-sive rust in the battery compartment is hard-ly ever the result of a single episode, butrather the cumulative effect of repeated useof the battery over time. That is, a relativelysmall amount of rust may be present after asingle battery is used and then discarded
JJoouurrnnaall ooff tthhee AAmmeerriiccaann AAccaaddeemmyy ooff AAuuddiioollooggyy/Volume 18, Number 10, 2007
860

after 7-20 days of use. After repeated use,however, the accumulated rust will grow andbuild in the battery compartment causing, inextreme cases, poor or no contact with thebattery contacts (i.e., intermittency or a deadhearing aid). Although not the focus of thisstudy, up to that point, the presence of rustprobably has minimal or no impact on theperformance of the hearing aid. Second, thenumber of hearing aids sent to manufactur-ers for repairs due to battery compartmentrust is probably smaller than reportedbecause many audiologists implement atleast two preventive steps. That is, thesesteps do not eliminate battery rust, but canserve to prevent the buildup from impactinghearing aid performance that would eventu-ally require the need to send the aid forrepair. First, as is the case in our facility,when patients are scheduled for an annualaudiometric evaluation or services related torepair, one of the first actions taken by theaudiologist is to check the battery compart-ment. If rust is observed, as it often is, thecompartment is cleaned with a cotton appli-cator and contact cleaner. This finding leadsto additional patient counseling and preventsthe need to send the aid for repair. Second, aspart of our practice, the audiologist providesan electronic desiccant device to every patientwhen hearing aids are dispensed. The audi-ologist counsels the patient to use the deviceeach night and keep the battery in the deviceovernight to dry the hearing aid and battery.It is felt that if these practices (timely clean-ing of the battery compartment, counseling,and use of an electronic desiccant device)were not implemented, the number of hear-ing aids sent for repair from our facility dueto rust buildup would be significantly higher.Finally, assuming a lack of significant differ-ences in battery performance and cost acrossmanufacturers, it would seem reasonablethat clinicians might look at possible differ-ences in rust buildup as the decision relatedto battery purchase and recommendations totheir patients is formulated.
FFIINNAALL IIMMPPOORRTTAANNTT NNOOTTEE
Since the original submission of this man-uscript, the first author presented the
results at the American Auditory Society inMarch 2007. A short time later, the firstauthor was contacted by a representative ofRay-O-Vac. The author was informed that
significant manufacturing changes had beenmade to the Ray-O-Vac batteries since theproduction of those used in the present study.The author was informed that Ray-O-Vac willintroduce a new battery that uses post-plat-ing electrolytic techniques in their ProLineAdvanced battery. The author asked the rep-resentative to forward samples of the ProLineAdvanced 10, 312, 13, and 675 batteries.These batteries were sent to EAGLaboratories where the last three authorscompleted SEM, EDS, and AES measures.The results of those measures found that theProLine Advanced batteries revealed nocracks in the plating, and iron was not pres-ent as is reported for the original Ray-O-Vacbatteries used in this study. Later, these newbatteries were immersed in the salt spray fogchamber. The ratings were slightly higher butvery similar to those reported for Energizerand Power One in this study. Therefore, theauthors believe it is important that thischange in manufacturing techniques in theRay-O-Vac ProLine Advanced battery bebrought to the attention of the reader.
CCOONNCCLLUUSSIIOONNSS
The results of this study answered the fol-lowing questions that were addressed in
the introduction. That is:1. Significant differences were present in
rust as duration of exposure increased for theduration intervals used in this study. Asduration of exposure increased there was anincremental increase in the presence of rustcollapsed across manufacturer and batterysize.
2. Significant differences were present inrust between the four battery manufacturersused in this study where there was signifi-cantly less rust and or corrosion for batteriesmanufactured by Energizer and Power Onethan for Ray-O-Vac and Duracell. In addi-tion, within these two groups there were nosignificant differences in rust betweenEnergizer and Power One or between Ray-O-Vac and Duracell.
3. Significant differences were not presentin rust for the four battery sizes used in thisstudy collapsed across duration of exposureand manufacturer.
4. Significant differences were present inrust for the two factor interaction of durationof exposure and manufacturer. That is, asduration of exposure increased mean ratings
RRuusstt iinn HHeeaarriinngg AAiidd BBaatttteerriieess/Valente et al
861
for the four manufacturers decreased. Themean ratings, however, for each duration ofexposure for Energizer and Power One weresignificantly better than the mean ratings forDuracell and Ray-O-Vac. In addition, for eachduration of exposure, there were no signifi-cant differences between Energizer andPower One or between Duracell and Ray-O-Vac.
5. The correlation between the four ratersacross the four test runs was highly correlat-ed and the correlation improved as the ratersgained greater experience. That is, the corre-lation improved steadily from Test 1 to Test 4.
6. Surface analysis of the four batteriesshows that cracks formed in the protectivenickel plating on the Duracell and Ray-O-Vacbatteries have left exposed iron present onthe outermost surface. This iron is thenprone to corrosion in the salt water test.Cracks were also discovered in the nickelplating on the Power One battery, but Augeranalysis indicated that nickel was still pres-ent at the bottom of the cracks and iron wasnot exposed. The nickel plating on theEnergizer battery showed no evidence ofcracking.
AAcckknnoowwlleeddggmmeennttss.. The authors would like to thankMichael Strubbe, Ph.D., Professor of Psychology atWashington University for his help in completing thestatistical analysis and appropriate interpretation of thedata reported in this manuscript. The authors wouldlike to thank the numerous hearing aid manufacturerrepresentatives who responded to questions related tothe percent of repairs directly related to battery rust.
RREEFFEERREENNCCEESS
American Society for Testing Materials International.(2003) ASTM B117-03. Standard Practice for OperatingSalt Spray (Fog) Apparatus. West Conshohocken, PA:American Society for Testing Materials International.
Buckley W, Lewis C. (1960) The “ruster” in industry. JOccup Med 2:23–31.
Burton J, Pye R, Brookes D. (1976) Metal corrosion bychloride in sweat. The problem of “rusters” in industry.Br J Dermatol 4:417–422.
Carpenter D. (2003) Battery Rust. www.healthyhear-ing.com/library/ate_content.asp?question_id=133.
International Organization for Standardization. (1982)ISO 3160.2. Watch Cases and Accessories – Gold alloycoverings – Part 2: determination of Fineness, Thickness,and Corrosion Resistance.
Jensen O. (1979) “Rusters.” The corrosive action ofpalmar sweat: I. sodium chloride in sweat. ActDematovener (Stockh) 59:135–138.
Jensen O, Nielsen E. (1979) “Rusters.” The corrosiveaction of palmar sweat: II. physical and chemical fac-tors in palmar hyperhidrosis. Act Dematovener (Stockh)59:139–143.
Kirk RE. (1982) Experimental Design: Procedures forthe Behavioral Sciences. 2nd edition. Monterey, CA:Brooks/Cole Publishing Company.
Kozlowski S, Saltin B. (1964) Effect of sweat loss onbody fluids. J Appl Physiol 19:1119–1124.
Lind S. (1972) Corrosion of metals by human sweat andits prevention. Corrosion Sci 12:749–755.
McKenzie R. (2003) Batteries are the Sound Choice forBetter Hearing. www.healthyhearing.com/library/arti-cle_content.asp?article_id=218.
Randin J. (1988) Corrosion behavior of nickel-contain-ing alloys in artificial sweat. J Biomed Mater Res22(7):649–666.
Robinson S, Maletich T, Robinson S, Rohrer B, KunzA. (1956) Output of NaCl by sweat glands and kidneysin relation to dehydration and to salt depletion. J ApplPhysiol 8:615–620.
Shirreffs S, Aragon-Vargas L, Chamorro M, MaughanR, Serratosa L, Zachwieja J. (2005) The sweatingresponse of elite professional soccer players to trainingin the heat. Int J Sports Med 26:9095.
Skopp G, Potsch L, Moeller M. (1997) On cosmeticallytreated hair-aspects and pitfalls of interpretation.Forensic Sci Int 84:43–52.
Verde T, Shepard R, Corey P, Moore R. (1982) Sweatcomposition in exercise and heat. J Appl Physiol53:1540–1545.
JJoouurrnnaall ooff tthhee AAmmeerriiccaann AAccaaddeemmyy ooff AAuuddiioollooggyy/Volume 18, Number 10, 2007
862