Điều Tra Vụ bùng phát bệnh từ thực phẩm
49
Điều Tra Vụ bùng phát bệnh từ thực phẩm GS, Ts Lê Hoàng Ninh
-
Upload
luke-jensen -
Category
Documents
-
view
32 -
download
0
description
Điều Tra Vụ bùng phát bệnh từ thực phẩm. GS, Ts Lê Hoàng Ninh. Bùng phát là gì ?(outbreak). - PowerPoint PPT Presentation
Transcript of Điều Tra Vụ bùng phát bệnh từ thực phẩm

Điều Tra Vụ bùng phát
bệnh từ thực phẩm
GS, Ts Lê Hoàng Ninh

Epidemiology (Schneider)
Bùng phát là gì ?(outbreak)
Dịch ( epidemic) hay còn gọi là bùng phát ( outbreak)khi
số ca bệnh cao hơn số dự kiến xảy ra ( trị số bình
thường) tại một địa phương, khu vực nào đó, hay trên
một nhóm dân số nào đó trong một thời khoảng nhất
định

Epidemiology (Schneider)
Bệnh lưu hành địa phương (endemic)và dịch ( epidemic)
Lưu hành Dịch
Số
ca b
ệnh
Thời gian

Epidemiology (Schneider)
Tại sao phải điều tra bùng phát/ dịch?
Kiểm soát và phòng ngừa
Sự ác tính và nguy cơ lây truyền cho người khác
Cơ hội nghiên cứu để hiểu biết tốt hơn
Cơ hội đào tạo
Xem xét chương trình y tế
Cab quan ngại khác: luật, chính trị, công cộng…

Epidemiology (Schneider)
Step 1: Verify the outbreak
Determine whether there is an outbreak – an excess number of cases from what would be expected
Establish a case definition Non-ambiguous
Clinical / diagnostic verification
Person / place / time descriptions
Identify and count cases of illness

Epidemiology (Schneider)
Step 2: Plot an Epidemic Curve
Graph of the number of cases (y-axis) by their date or time of onset (x-axis)
Interpreting an epidemic curve
Overall pattern: increase, peak, decrease
Type of epidemic?
Incubation period?
Outliers:
Unrelated?
Early or late exposure?
Index case? Secondary cases?

• Starts slowly• Time between the first case and the peak is comparable
to the incubation period. • Slow tail
Vector-borne Disease

• This is the most common form of transmission in food-borne disease, in which a large population is exposed for a short period of time.
Point Source Transmission

• In this case, there are several peaks, and the incubation period cannot be identified.
Continuing Common Source or Intermittent Exposure

Salmonellosis in passengers on a flight from London to the United States,
by time of onset, March 13--14, 1984
Source: Investigating an Outbreak, CDC

Legionnaires' DiseaseBy date of onset, Philadelphia, July 1-August 18, 1976
Source: Investigating an Outbreak, CDC
Foodborne Outbreak (Propagated)
Source: CDC, unpublished data, 1978

Epidemiology (Schneider)
Step 3: Calculate attack rates
Attack rate = (ill / ill + well) x 100 during a time period
If there is an obvious commonality for the outbreak, calculate attack rates based on exposure status (a community picnic)
If there is no obvious commonality for the outbreak, calculate attack rates based on specific demographic variables (hepatitis cases in a community)

Epidemiology (Schneider)
Step 4: Determine the source of the epidemic
If there is an obvious commonality for the outbreak, identify the most likely cause and investigate the source to prevent future outbreaks
If there is no obvious commonality for the outbreak, plot the geographic distribution of cases by residence/ work/school/location and seek common exposures

Epidemiology (Schneider)
Control of present outbreak
Prevention of future similar outbreaks
Step 5: Recommend control measures

The vast majority of outbreaks
are food-borne
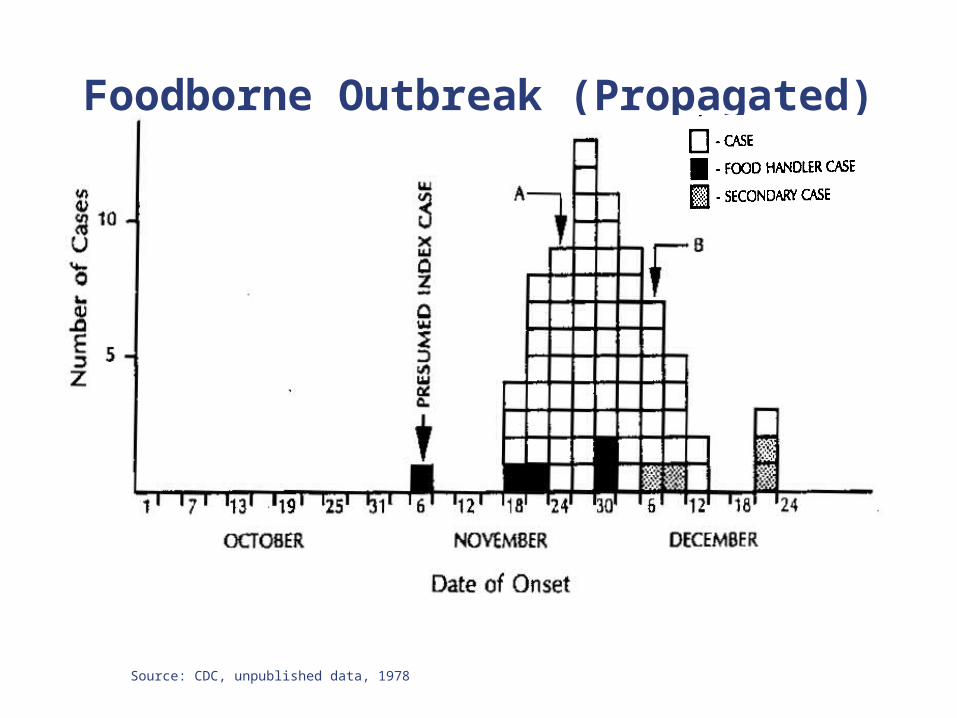
Foodborne Disease Outbreak
An incident in which (1) two or more persons experience a similar illness after ingestion of a common food, and (2) epidemiologic analysis implicates the food as the source of the illness
Intoxication – ingestion of foods withToxicants found in tissues of certain plants (Jimpson Weed) and animals (seal liver)Metabolic products (toxins) formed and excreted by microorganisms while they multiply (botulinum toxin)Poisonous substances introduced during production, processing, transportation or storage (chemicals, pesticides)

Foodborne Disease Outbreak (cont.)
Infections – Caused by the entrance of pathogenic microorganisms into the body and the reaction of the body tissues to their presence or to toxins they generate within the body
Rule of thumb – but not lawIntoxicants are rapid onset, no feverToxins in the stomach produce vomitingToxins in the intestines produce diarrheaInfections produce fever

Epidemiology (Schneider)
Types of Foodborne Contamination
Physical Glass, metal fragments, tacks, dirt, bone, etc.
Chemical Pesticides, cleaning compounds, poisonous metals,
additives and preservatives
Biological Bacteria, viruses, fungi, yeast, molds, parasites,
poisonous fish and plants, insect and rodents

Epidemiology (Schneider)
Bacterial Requirements
Food: Most bacteria require what is known as potentially hazardous food Milk or milk products, eggs, meat, poultry, fish,
shellfish, crustaceans, raw seed sprouts, heat treated vegetables and vegetable products (fruits?) Generally high protein, moist foods

Epidemiology (Schneider)
Bacterial Requirements (cont.)
Water: Bacteria require moisture to thrive The water activity (Aw) is the amount of water
available in food
The lowest Aw at which bacteria will grow is 0.85 Most potentially hazardous foods have a water activity of
0.97 to 0.99
pH: Best growth at neutral or slightly acidic pH Potentially hazardous foods have a pH of 4.6 – 7.0

Epidemiology (Schneider)
Bacterial Requirements (cont.)
Temperature: The danger zone for potentially hazardous foods is 45 to 140 degrees Fahrenheit This is the zone where most bacterial growth
occurs
Time: Potentially hazardous foods must not be allowed to remain in the danger zone for more than 4 hours
Oxygen: Some bacteria require oxygen while others are anaerobic and others are facultative

Epidemiology (Schneider)
Improper cooling of foods
Improper cooking of foods
Improper reheating of foods
Improper holding temperature of foods
Cross contamination
Infected food handlers, poor employee hygiene
Major Causes of Foodborne Disease

Temperature and Bacteria Control250240
Canning temperatures for low-acid vegetables, meat, and poultry in pressure canner
212
125120
- 20
165
140
98.6
60
45
32
0
0 F
Some bacterial growth; many bacteria survive
Canning temperatures for fruits, tomatoes, and pickles in waterbath canner
Water freezesGrowth of bacteria is stopped, but bacteria level before freezing
remains constant and not reduced
Keep frozen foods in this range
Water boils
Most bacteria destroyed
No growth, but survival of some bacteria
Hottest temperature hands can stand
Extreme DANGER ZONE. Rapid growth of bacteria and production of poisons by some bacteria
Body temperature – ideal for bacterial growth
40Slow growth of some bacteria that cause spoilage
Some growth of food poisoning bacteria may occur
DA
NG
ER
Z
ON
E
Source: Keeping Food Safe to Eat, USDA

Epidemiology (Schneider)
Bacterial Growth CurveN
umbe
r of
Cel
ls
Time
Decline Phase
Stationary Phase
Log Phase
Lag Phase

Epidemiology (Schneider)
Effect of Temperature in Salmonella Growth
Num
ber
of S
alm
onel
la p
er g
ram
Days
21 4 53
95oF (35o C)
50oF (10o C)
44oF (6.7o C)
42oF (5.5o C)

Incubation Periods
2-4 hours Staphylococcus aureus Cooked ham, meat, eggs, sauces and gravies
12 hours Clostridium perfringens Cooked meats, gravy
12-36 hours Salmonella* Meat, poultry, eggs
12-36 hours Clostridium botulinum Canned foods, smoked fish
12 hours Vibrio parahemolyticus* Raw fish, shellfish
24-48 hours Shigella* Contaminated by carrier, not foodborne
* Fever

National Data on Etiology of Foodborne IllnessAgent
Bacteria (40 agents) 68.7%
Salmonella 25.0%
Staph. aureus 12.7%
Clostridium perfringens 10.0%
Clostridium botulinum 9.5%
Viral (11 agents) 9.4%
Parasites (31 agents) 0.5%
Fungal (16 agents) 1.8%
Plants (36 agents) -
Fish (28 agents) 12.3%
Chemicals (28 agents) 7.3%

On April 19, 1940, the local health officer in the village of Lycoming, Oswego County, New York, reported the occurrence of an outbreak of acute gastrointestinal illness to the District Health Officer in Syracuse. Dr. A. M. Rubin, epidemiologist-in-training, was assigned to conduct an investigation.
When Dr. Rubin arrived in the field, he learned from the health officer that all persons known to be ill had attended a church supper the previous evening, April 18. Family members who had not attended the church supper had not become ill. Accordingly, the investigation was focused on the circumstances related to the supper. Source: CDC
Investigating an Epidemic: Oswego, NY

Epidemiology (Schneider)
Interviews regarding the presence of symptoms, including
the day and hour of onset, and the food consumed at the
church supper, were completed on 75 of the 80 persons
known to have been present. A total of 46 persons who
had experienced gastrointestinal illness were identified.
Q: Is this an Epidemic?
Endemic for the region?
Due to seasonal variation?
Due to random variation?
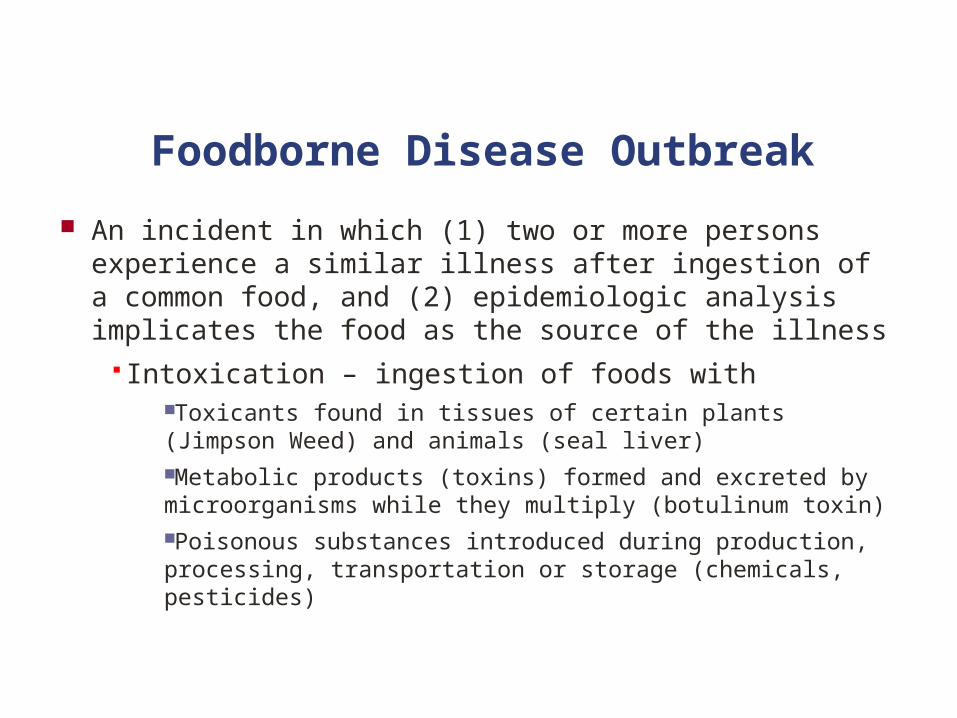
Select the correct case definition and find the error in the others:
1. All participants in the Oswego church supper held in the basement of the church in Lycoming, Oswego County, New York, on April 18, 1940, between 6:00 PM and 11:00 PM; whether they attended church or not; whether they participated in food preparation, transport, or distribution or not; whether they ate or not.
2. Persons who developed acute gastrointestinal symptoms within 72 hours of eating supper on April 18, 1940, and who were among attendees of the Lycoming, Oswego Church supper.
3. Church members who developed acute gastrointestinal symptoms within 72 hours of the church supper held in Lycoming, Oswego on April 18, 1940.

Select the correct case definition and find the error in the others:
1. All participants in the Oswego church supper held in the basement of the church in Lycoming, Oswego County, New York, on April 18, 1940, between 6:00 PM and 11:00 PM; whether they attended church or not; whether they participated in food preparation, transport, or distribution or not; whether they ate or not. Missing definition of sickness
2. Persons who developed acute gastrointestinal symptoms within 72 hours of eating supper on April 18, 1940, and who were among attendees of the Lycoming, Oswego Church supper. CORRECT
3. Church members who developed acute gastrointestinal symptoms within 72 hours of the church supper held in Lycoming, Oswego on April 18, 1940. Did not specify that they went to the dinner

Incidence of Cases of Diarrhea Among People Attending Lycoming,Oswego Church Supper, June 1940
Epidemiology (Schneider)
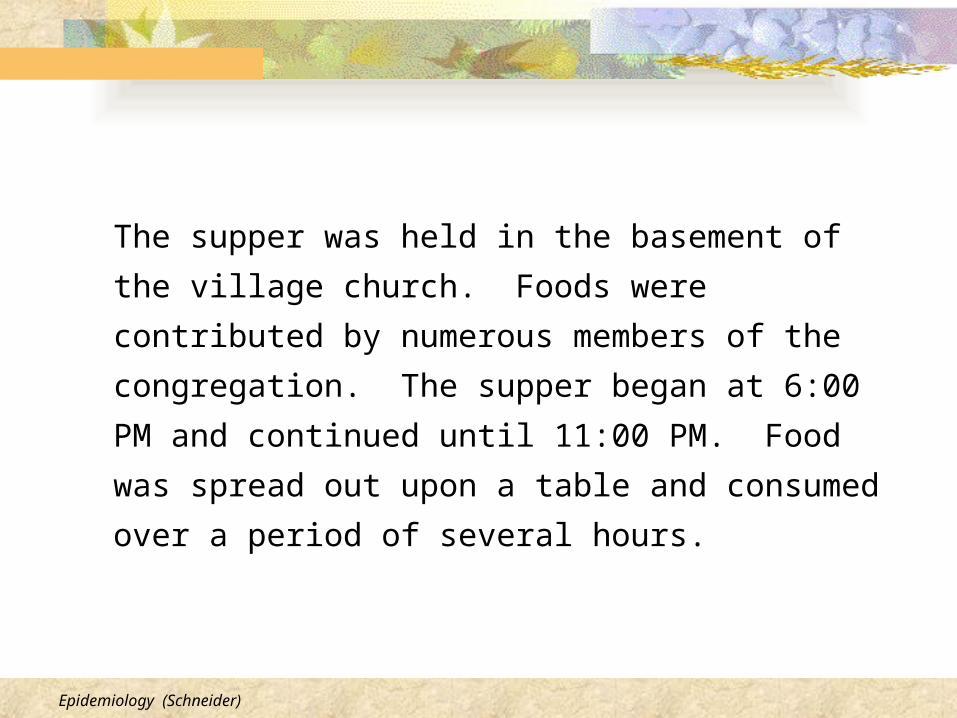
The supper was held in the basement of the village
church. Foods were contributed by numerous
members of the congregation. The supper began at
6:00 PM and continued until 11:00 PM. Food was
spread out upon a table and consumed over a period
of several hours.
Epidemiology (Schneider)
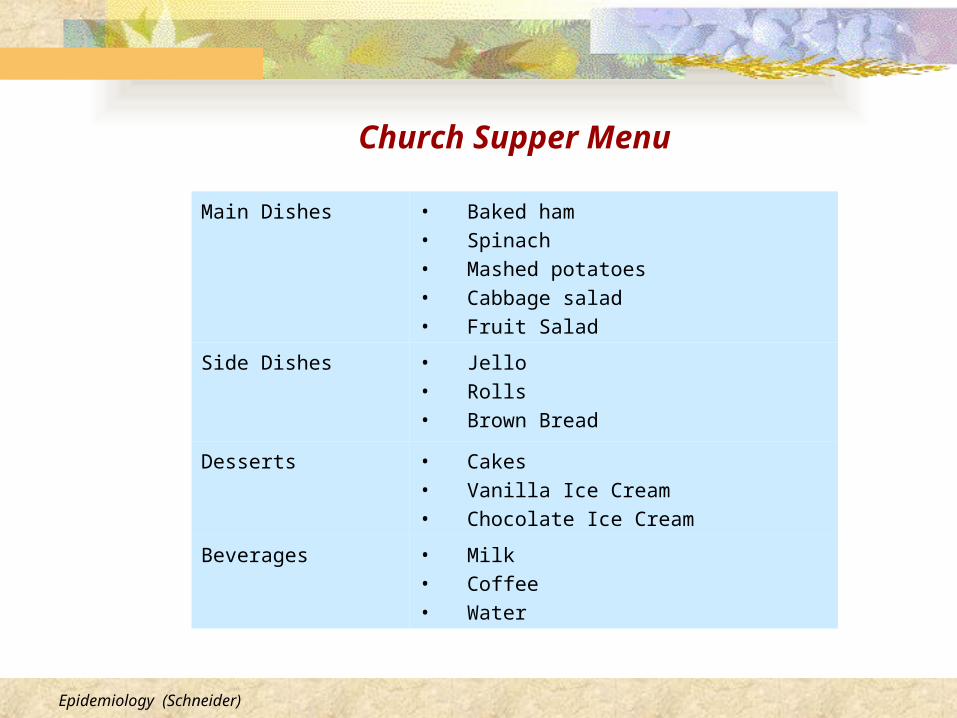
Main Dishes • Baked ham• Spinach• Mashed potatoes• Cabbage salad• Fruit Salad
Side Dishes • Jello• Rolls• Brown Bread
Desserts • Cakes• Vanilla Ice Cream• Chocolate Ice Cream
Beverages • Milk• Coffee• Water
Church Supper Menu

Epidemiology (Schneider)
Which menu item(s) is the potential culprit?
To find out, calculate attack rates.
The foods that have the greatest difference in attack
rates may be the foods that were responsible for the
illness.

Epidemiology (Schneider)
Attack Rates by Items Served: Church Supper, Oswego, New York; April 1940
Number of persons who ate
specified item
Number of persons who did not eat specified item
Ill Well Total Attack rate (%) Ill Well Total Attack rate %
Baked ham 29 17 46 17 12 29
Spinach 26 17 43 20 12 32
Mashed potato 23 14 37 23 14 37
Cabbage salad 18 10 28 28 19 47
Jello 16 7 23 30 22 52
Rolls 21 16 37 25 13 38
Brown bread 18 9 27 28 20 48
Milk 2 2 4 44 27 71
Coffee 19 12 31 27 17 44
Water 13 11 24 33 18 51
Cakes 27 13 40 19 16 35
Ice cream (van) 43 11 54 3 18 21
Ice cream (choc) 25 22 47 20 7 27
Fruit salad 4 2 6 42 27 69

Attack Rates by Items Served: Church Supper, Oswego, New York; April 1940
Number of persons who ate
specified item
Number of persons who did not eat specified item
Ill Well Total Attack rate (%) Ill Well Total Attack rate %
Baked ham 29 17 46 63 17 12 29 59
Spinach 26 17 43 60 20 12 32 62
Mashed potato 23 14 37 62 23 14 37 62
Cabbage salad 18 10 28 64 28 19 47 60
Jello 16 7 23 70 30 22 52 58
Rolls 21 16 37 57 25 13 38 66
Brown bread 18 9 27 67 28 20 48 58
Milk 2 2 4 50 44 27 71 62
Coffee 19 12 31 61 27 17 44 61
Water 13 11 24 54 33 18 51 65
Cakes 27 13 40 67 19 16 35 54
Ice cream (van) 43 11 54 80 3 18 21 14
Ice cream (choc) 25 22 47 53 20 7 27 74
Fruit salad 4 2 6 67 42 27 69 61
Attack Rates by Items Served: Church Supper, Oswego, New York; April 1940
Highlighted row indicates largest difference between attack rates

Attack Rate by Consumption of Vanilla Ice Cream, Oswego, New York; April 1940
Ill Well Total Attack Rate (%)
Ate vanilla ice cream?
Yes 43 11 54 79.6
No 3 18 21 14.3
Total 46 29 75 61.3
• The relative risk is calculated as 79.6/14.3 or 5.6
• The relative risk indicates that persons who ate vanilla ice cream were 5.6 times more likely to become ill than those who did not eat vanilla ice cream

Epidemiology (Schneider)
Conclusion
An attack of gastroenteritis occurred following a church supper at Lycoming
The cause of the outbreak was most likely contaminated vanilla ice cream
Epidemiology (Schneider)
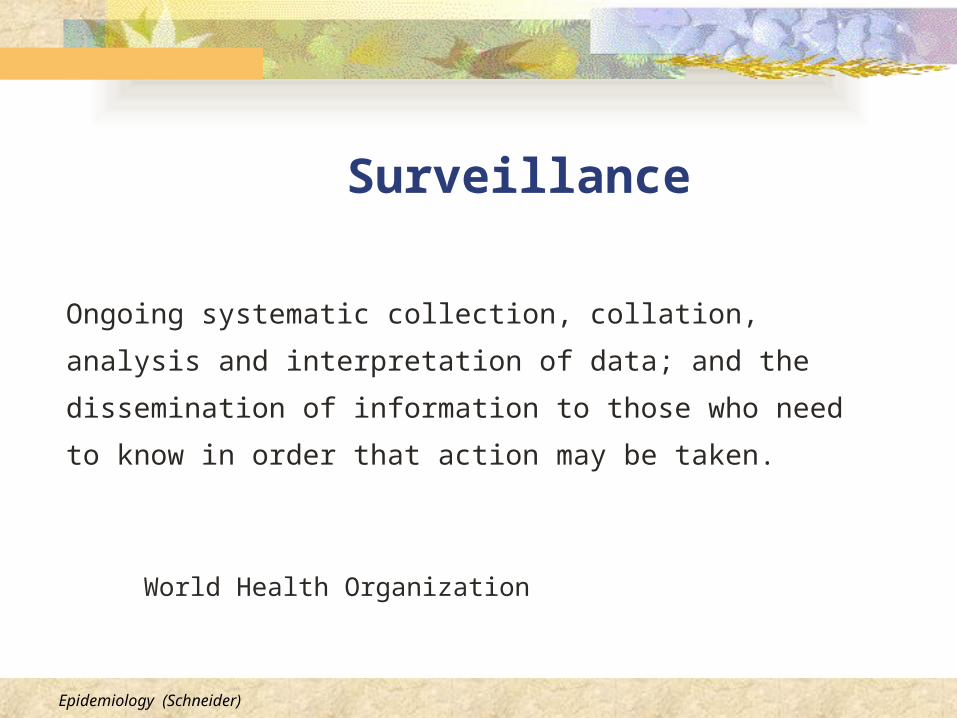
Surveillance
Ongoing systematic collection, collation, analysis
and interpretation of data; and the dissemination of
information to those who need to know in order that
action may be taken.
World Health Organization
Epidemiology (Schneider)
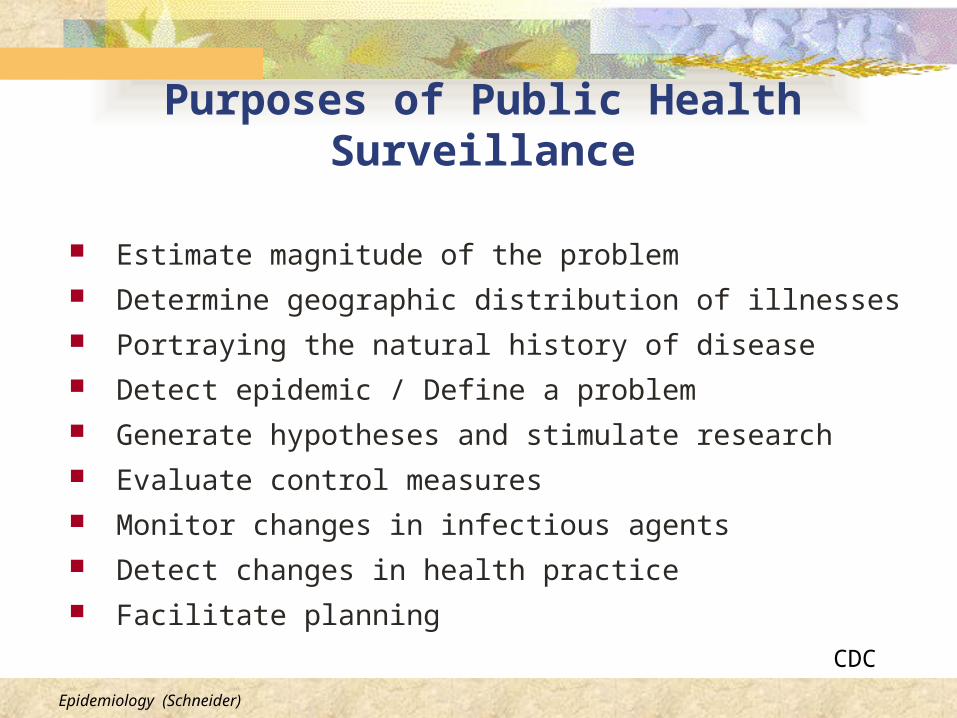
Purposes of Public Health Surveillance
Estimate magnitude of the problem Determine geographic distribution of illnesses Portraying the natural history of disease Detect epidemic / Define a problem Generate hypotheses and stimulate research Evaluate control measures Monitor changes in infectious agents Detect changes in health practice Facilitate planning
CDC

Epidemiology (Schneider)
Passive Surveillance
Physicians, laboratories, and hospitals are given forms to complete and submit with the expectation that they will report all of the cases of reportable disease that come to their attention
Advantages: Inexpensive
Disadvantages: Data are provided by busy health professionals. Thus, the data are more likely to be incomplete and underestimate the presence of disease in the population
Epidemiology (Schneider)
Active Surveillance
Involves regular periodic collection of case reports by telephone or personal visits to the reporting individuals to obtain the data
Advantages: More accurate because it is conducted by individuals specifically employed to carry out the responsibility
Disadvantages: Expensive
Epidemiology (Schneider)
Sentinel Surveillance
Monitoring of key health events, through sentinel sites, events, providers, vectors/animals
Case report indicates a failure of the health care system or indicates that special problems are emerging
Advantages: Very inexpensive
Disadvantages: Applicable only for a select group of diseases

Epidemiology (Schneider)
Some Surveillance Programs
National Notifiable Diseases Surveillance System
http://www.cdc.gov/epo/dphsi/nndsshis.htm
Morbidity and Mortality Weekly Report (MMWR)
http://www.cdc.gov
Cancer Surveillance, Epidemiology and End Result (SEER)
http://www.seer.cancer.gov/

Epidemiology (Schneider)
“Good surveillance does not necessarily ensure
the making of right decisions, but it reduces the
chances of wrong ones.”
Alexander D. Langmuir
NEJM 1963;268:182-191