Dietary energy density and energy intake in cancer patients
70
Ola Wallengren Department of Internal Medicine and Clinical Nutrition Institute of Medicine Sahlgrenska Academy at University of Gothenburg Gothenburg 2012
Transcript of Dietary energy density and energy intake in cancer patients
Ola Wallengren
Department of Internal Medicine and Clinical Nutrition
Institute of Medicine
Sahlgrenska Academy at University of Gothenburg
Gothenburg 2012
Dietary energy density and energy intake in cancer patients
© Ola Wallengren 2012
ISBN 978-91-628-8528-1
E-version: http://hdl.handle.net/2077/29709
Printed in Gothenburg, Sweden 2012
Kompendiet

Background & Aims: Cachexia is frequent in advanced cancer and is
associated with adverse outcomes; however, definite diagnostic criteria for
cachexia are not established. Diet energy density (ED) may affect energy
intake (EI) and energy balance. Patient characteristics may also influence
such associations. This potentially hampers cachexia treatment and dietary
treatment in clinical practice.
The aim was to study associations between ED and EI in palliative cancer
patients and whether ED or EI predict energy balance, and the influence of
systemic inflammation and survival time. The prevalence of reduced quality
of life (QoL), function and survival, in patients classified by different
cachexia criteria were compared.
Methods: Dietary intake and ED was assessed by food records (n=251-322).
Energy balance was calculated from the change in body energy content by
repeated DXA scans in 107 patients for a total of 164 4-month periods.
Linear regression and linear mixed model were used to investigate
relationships between ED and EI with patient characteristics as covariates. In
energy balance analysis systemic inflammation and survival were covariates.
Quality of life (QoL) was assessed by questionnaire, physical function by
treadmill test.
Results: Diet ED was associated with EI, explaining approximately 16-22 %
of the variation in EI. Age, BMI, fatigue and survival were negatively
associated and hypermetabolism was positively associated with EI. After
covariate adjustment, ED was still positively associated with EI. In
unadjusted models, the ED of solid food and EI were both positive predictors
of energy balance (P<0.03). Survival was positively and systemic
inflammation negatively associated with energy balance (P<0.005). After
adjustment for inflammation, only EI remained a significant predictor.
Adverse QoL, function and symptoms were associated with weight loss >2%,
BMI <20, fatigue and CRP >10mg/L (P<0.05). Short walking distance was
associated with fatigue, low grip strength and inflammation (P<0.05). Short
survival was associated with weight loss, fatigue, inflammation and S-
albumin < 32g/L (P<0.05). The prevalence of cachexia diagnosis varied from
12 to 85 % using different definitions.
Conclusions: Diet energy density and energy intake are positively
associated. Age, BMI, fatigue, survival and hypermetabolism are associated

with EI, but do not substantially influence the association between ED and
EI. Diet EI and ED of solid food are positively associated with energy
balance in patients with advanced cancer. Relations between EI, ED and
energy balance are affected by systemic inflammation. Thus, targeting
systemic inflammation may be important in nutritional interventions in this
patient group.
Weight loss, fatigue and markers of systemic inflammation were consistently
associated with adverse QoL, reduced function, more symptoms and shorter
survival. The prevalence of cachexia using different definitions varied
widely; indicating a need to further explore and validate diagnostic criteria
for cancer cachexia.
Keywords: Cancer, cachexia, diagnostic criteria, quality of life, nutritional
support, energy intake, energy balance, dietary energy density
ISBN: 978-91-628-8528-1
Aptitlöshet och avmagring (kakexi) är vanligt vid avancerad cancer och
förknippas med negativa konsekvenser så som försämrad behandlingseffekt,
livskvalité, fysisk funktion och kortare överlevnad. Tydliga och välbelagda
diagnostiska kriterier för kakexi saknas, vilket försvårar diagnostiken och
behandlingen. Minskat födointag är en av de viktigaste faktorerna som leder
till avmagring. Ett av de vanligaste kostråden för att öka energiintaget är att
öka intaget av energirika livsmedel och drycker. Energitätheten i kosten kan
påverka energiintag och energibalans positivt men detta är inte studerat på
cancerpatienter.
Syftet med denna avhandling var att studera om energitätheten i kosten kan
påverka energiintag och energibalans hos patienter med avancerad cancer. Ett
ytterligare mål var att utforska och validera olika diagnostiska kriterier för
cancer cachexia genom att se hur dessa relaterar till nedsatt livskvalité, fysisk
funktion och överlevnad. För att studera detta analyserades data från
interventionsstudier av anti-inflammatorisk behandling, anemibehandling,
insulinbehandling och näringsstöd på en palliativ öppenvårdsmottagning,
Sahlgrenska Universitetssjukhuset, mellan 1993 och 2005. Mätningar
inkluderade blodvärden, fysisk funktion, kroppssammansättning och
livskvalitéformulär. Kostintaget uppskattades från kostdagböcker.
Det fanns ett positivt samband mellan kostens energitäthet och energiintaget.
Patienter med högre ålder, mer trötthet och kort överlevnad hade ett lägre
energiintag men även hos dessa patienter var en hög energitäthet i kosten
förknippat med ett högre energiintag. Ett högre energiintag och hög
energitäthet i fast föda var förknippat med en förbättrad energibalans under
de följande 4 månaderna. Patienter med inflammatoriskt påslag hade en mer
negativ energibalans, vilket överskuggade energitäthetens påverkan. Dessa
fynd stödjer nuvarande kostråd men belyser även vikten av anti-
inflammatorisk behandling.
Viktminskning, trötthet och inflammatoriska markörer var förknippat med
nedsatt livskvalité, funktion, fler symtom och kortare överlevnad.
Förekomsten av kakexi varierade kraftigt beroende på vilka kriterier som
användes, vilket indikerar ett behov av att ytterligare undersöka och validera
diagnostiska kriterier för cancer kakexi.
This thesis is based on the following studies, referred to in the text by their
Roman numerals.
I. Wallengren O, Lundholm K, Bosaeus I. Diet energy density
and energy intake in palliative care cancer patients. Clin
Nutr. 2005;24(2):266-73.
II. Wallengren O, Bosaeus I, Lundholm K. Dietary energy
density is associated with energy intake in palliative care
cancer patients. Support Care Cancer. 2012:20(11):2851-
2857.
III. Wallengren O, Bosaeus I, Lundholm K. Dietary energy
density, inflammation and energy balance in palliative care
cancer patients. Clin Nutr. 2012. Epub 2012/06/26.
IV. Wallengren O, Lundholm K, Bosaeus I. Diagnostic criteria
of cancer cachexia: Relation to quality of life, exercise
capacity and survival in patients with advanced cancer.
Submitted

ABBREVIATIONS ............................................................................................. IX
1 INTRODUCTION ........................................................................................... 1
1.1 Cancer ................................................................................................... 1
1.1.1 Palliative care ................................................................................ 2
1.2 Cancer cachexia .................................................................................... 3
1.2.1 Definition and diagnostic criteria .................................................. 3
1.2.2 Etiology, pathology and impact ..................................................... 4
1.3 Nutrition support to cancer patients ...................................................... 9
1.3.1 Dietary counseling strategies to improve dietary intake ............. 10
1.3.2 Diet energy density ...................................................................... 11
1.3.3 Evidence base for oral nutritional support in cancer patients ...... 12
2 AIMS ......................................................................................................... 16
3 PATIENTS AND METHODS ......................................................................... 17
3.1 Study population ................................................................................. 17
3.2 Methods ............................................................................................... 18
3.2.1 Anthropometry, body composition and energy balance .............. 18
3.2.2 Dietary intake .............................................................................. 19
3.2.3 Biochemistry ............................................................................... 21
3.2.4 Performance and functional status ............................................... 21
3.2.5 Quality of life .............................................................................. 22
3.2.6 Cachexia definitions .................................................................... 22
3.3 Data analysis ....................................................................................... 23
4 RESULTS ................................................................................................... 26
4.1 Subject characteristics ......................................................................... 26
4.2 Dietary intake ...................................................................................... 27
4.3 Energy density and energy intake ....................................................... 28
4.4 Energy balance .................................................................................... 31

4.5 Diagnostic criteria of cancer cachexia: QoL, function, symptoms and
survival ....................................................................................................... 32
5 DISCUSSION .............................................................................................. 37
5.1 Methodological considerations ........................................................... 37
5.2 Dietary energy density and energy intake ........................................... 40
5.3 Systemic inflammation ....................................................................... 43
5.4 Diagnostic criteria and adverse outcomes ........................................... 44
6 CONCLUSION ............................................................................................ 47
7 FUTURE PERSPECTIVES ............................................................................. 48
ACKNOWLEDGEMENT .................................................................................... 50
REFERENCES .................................................................................................. 51

AMC Mid-arm muscle circumference
ASMI Appendicular skeletal muscle mass index
BMI Body mass index
BW Body weight
CRP C-reactive protein
DXA Dual-energy x-ray absorptiometry
E% Percentage of energy intake
ED Energy density
EDfood Energy density of solid food
EI Energy intake
ES Effect size
ESR Erythrocyte sedimentation rate
FR Food record
EORTC European Organization for Research and Treatment of Cancer
Scale
KPS Karnofsky Performance Score
ONS Oral nutritional supplements
QoL Quality of life
REE Resting energy expenditure
TSF Triceps skinfold
WL Weight loss
W% Percentage of food weight


Ola Wallengren
1
Cachexia is very common in patients with advanced cancer. It affects
treatment, survival, quality of life (QoL) and function negatively, yet it is
rarely recognized, assessed, or managed actively [1]. Contributing factors
may be the lack of a clear definition and the multifactorial nature of the
cachexia syndrome [1, 2]. Recently there have been several articles defining
and discussing the definitions of cancer cachexia [2]. The most accepted
definition of cancer cachexia have been published as an international
consensus and is one from more detailed descriptions of stages and subsets
will develop [1, 2]. The currently suggested definitions and staging of cancer
cachexia are supported by a clinical and pathophysiological rationale [1, 3-5];
however, the validity and prognostic significance in different patient groups
remains limited [4, 6, 7].
Reduced food intake is one of the main domains of anti-cachexia therapy [1,
2, 8-10]. Dietary counseling is in routine practice often recommended as the
first line of nutrition therapy [11, 12]. One of the most common strategies to
increase energy intake (EI) is to increase the intake of energy-dense food and
beverages [11-14]. Dietary energy density (ED) is associated with EI in
healthy and obese subjects [15-19]. The effect of dietary advice aimed at
increasing ED in patients with advanced cancer has not been studied. This
advice is consequently based on expert opinions and interventions in other
patient groups [11-14].
The main objective of this thesis was to increase knowledge and efficacy of
oral nutrition therapy by investigating if diet ED is important for maintaining
an adequate EI in cancer patients (paper I-III). An additional objective was to
further explore and validate different diagnostic criteria in the diagnosis and
staging of cancer cachexia (paper IV). To achieve this, a secondary analysis
was performed of data from intervention studies of anti-inflammatory
treatment, anemia therapy, insulin treatment and nutritional support in an
outpatient palliative care program at the Department of Surgery at
Sahlgrenska University Hospital (Gothenburg, Sweden) between 1993 and
2005 [20-23].
There were more than 55 000 cases of malignant cancers reported to the
Swedish Cancer Registry in 2010. During the last two decades the average
Dietary energy density and energy intake in cancer patients
2
annual increase in number of cases has been 2.0 % for men and 1.4 % for
women. The increase is partly explained by the ageing population but also by
the introduction of screening activities and improvements in diagnostic
practices [24]. The probability of developing cancer before the age of 75 is
31 % among men and 28 % among women. However, the risk of developing
cancer varies strongly with both age and by site [24].
The prognosis for cancer patients in Sweden has developed positively in the
last four decades. The relative 5-year survival has increased from 35 % for
men and 48 % for women to nearly 70 % for both sexes [25].
The major gastrointestinal cancers are cancer of the colon, rectum and anus,
stomach, pancreas and biliary tract. Together they constitute about 16 % of
all newly diagnosed cancers in Sweden [24].
There is an annual decrease in incidence of upper gastrointestinal cancers for
both men and women during the last two decades which is mainly attributed
to a reduction in stomach cancer incidence [24]. Overall 5-year survival of
stomach cancer is about 20 percent [25].
Cancer of colon and rectum are among the most common cancer sites and the
trend is rather stable although colon cancer in women has increased during
the last decade [24]. The relative 10-year survival rate is over 50 percent [25].
There is a declining trend in both cancer of the liver and pancreas. Cancer of
the pancreas has very poor prognosis. The relative 5-year survival is currently
only a few percent [25].
The main treatments for cancer care are surgery, radiotherapy and
chemotherapy. Although the basic principles are the same, there is a constant
improvement and refinement of these methods. Often they are combined in
such a way that side effects are reduced, while treatment results are improved
[25]. The disease and its treatment still generate a large number of symptoms
that can affect nutritional status. All treatments have nutritional
consequences, either because they add a nutritional demand or because they
have side effects that limit dietary intake [26].
With long time (5-10 year) survival rates ranging from only a few percent to
just over 50 % it is clear that a majority of patients with gastrointestinal

Ola Wallengren
3
cancers are eligible for palliative care. The concept of palliative care and
palliative medicine has been around for more than 30 years. The palliative
phase begins from the moment cure is not or no longer possible, and lasts
until the moment of death. The World Health Organization‟s current
definition of palliative care states that:
“Palliative care is an approach that improves the quality of life of patients and
their families facing the problem associated with life-threatening illness,
through the prevention and relief of suffering by means of early identification
and impeccable assessment and treatment of pain and other problems,
physical, psychosocial and spiritual”[27].
Palliative care is applicable early in the course of illness, in conjunction with
other therapies that are intended to prolong life. As such it can include
chemotherapy or radiotherapy, symptom management, nutrition support and
counseling, preferably in a multimodal team approach [10, 26, 27]. The focus
of care may change through the disease trajectory from physiological and
functional outcomes to improvement of food enjoyment and QoL [26].
The term „cachexia‟ originates from the Greek words kakós (bad) and hexis
(condition or appearance). This „bad condition‟ has long been associated with
the gravely ill patient and with poor prognosis. The term is regularly used to
describe wasting of body tissues or a state of depletion [26].
Cancer cachexia is a complex and multifactorial syndrome that is not easily
defined and several definitions and criteria for diagnosis have been suggested
[1-4, 6]. An ongoing loss of muscle mass (with or without loss of fat mass)
due to a negative energy and protein balance driven by a variable
combination of reduced EI, systemic inflammation and metabolic
abnormalities are considered to be main characteristics [1, 2].
Development of cancer cachexia is seen as a continuum with three suggested
stages that are clinically relevant: precachexia, cachexia and refractory
cachexia [1]. Their definition still remains somewhat imprecise but provide a
framework which can evolve over time [1, 2]. Defining the stage and
components of cancer cachexia could help select patients suitable for
multimodal treatment programs [1, 2, 10]. Early recognition of cachexia is
important so that its effects can be reduced or postponed. The proportion of

Dietary energy density and energy intake in cancer patients
4
patients with cachexia diagnosis can vary considerably depending on the
definition criteria used [6, 7, 28, 29]. For example, Fox et al. observed a
prevalence of cachexia ranging from 2.4 to 14.7 % depending on definition
and totaling 23.1 % by any of these definitions in a large sample of cancer
patients [29]. In weight losing patients with advanced pancreatic cancer the
prevalence ranged from 21.8 to 60 % depending on if a 3 or 2 factor
definition of cachexia were used [4]. Thoresen et al. observed a prevalence of
cachexia ranging from 22 to 55 % in colorectal cancer patients depending on
definition [7]. Bozzetti et al. classified patients by 4 classes (or stages) of
cachexia from „asymptomatic precachexia‟ to „symptomatic cachexia‟ based
on weight loss (WL) (≥10%) and presence or absence of symptoms; 36 %
had both symptoms and WL, 40 % had WL and 83 % had either WL or
symptoms, leaving 17 % with WL <10% and no symptoms [6]. The
prevalence of „nutritional risk‟ or „malnutrition‟ in cancer patients varies
widely, ranging from 5 to 85 %, using different criteria (WL, BMI or
screening instruments) in different populations and settings [11]. It is clear
that a lack of definition and classification is a barrier to getting a clear picture
of the prevalence and consequences of cachexia.
Diagnostic criteria should be both sensitive and specific to be of value in
clinical practice and in the design of clinical trials. The currently suggested
definitions and staging of cancer cachexia are strongly supported by a clinical
and pathophysiological rationale [1, 3-5]. However, the validity and
prognostic significance in different patient groups remains limited [4, 6, 7].
Cachexia in advanced cancer has a negative impact on outcomes such as
QoL, physical function and survival [1, 5, 30]. Approximately 20% of
patients with cancer may die from the effects of malnutrition rather than the
malignancy [31]. Cachexia is also associated with increased risk of
complications in surgery and radiotherapy and impaired response to
chemotherapy [31, 32].
Weight loss is a cardinal feature of cancer cachexia and a majority of patients
with advanced cancer experience some degree of WL [5]. Weight loss is a
significant prognostic variable for survival in most studies in patients with
advanced cancer [33]. Various perspectives exist on how to classify WL.
Absolute WL can be classified by severity and various cut-offs have been
suggested, from 2 to >20 % [1, 26]. Another perspective is intensity of WL,
i.e. rate of WL in 1 week, 1, 3 or 6 months [1, 26]. Body mass index (BMI)
Ola Wallengren
5
can be a measure of body energy and protein reserves, and can together with
WL be used to assess the severity of depletion [1]. However, none of these
classifications take into account the wide distribution in body composition in
cancer patients and also give no information of proportions of fat and lean
body mass lost [26].
Weight loss reflects a negative energy balance, in which dietary EI is less
than energy expenditure. A reduced EI due to anorexia and metabolic
abnormalities, including hypermetabolism driven by systemic inflammation,
are considered the primary causes [5, 30, 34]. Other procachectic
mechanisms may, however, be involved.
Weight loss is composed of lean and adipose tissues in different degrees.
The amount of WL for any unit of energy deficit will be highly dependent on
the proportion of fat and fat free mass lost as their energy density are very
different (9,417 kcal/kg for fat and 884 kcal/kg for fat-free mass) [35]. The
low energy content of lean tissue and concomitant up regulation of
proteolytic pathways (particularly the ubiquitin-proteasome pathway)
together with hypoanabolism makes loss of muscle mass greater than
expected for any level of energy deficit compared to healthy subjects [36-39].
Systemic inflammation is believed to be primarily involved in the metabolic
change and loss of muscle in cachexia; hormones, tumor derived factors, bed
rest, and inadequate nutrient intake may also contribute [10, 40].
The ensuing loss of function and debilitation makes muscle loss an important
feature and treatment target in cancer cachexia [1, 10, 37]. Muscle loss is
indeed associated with poor outcome and shorter survival in cancer patients
[41].
Assessment of muscle mass and strength are therefore important in diagnosis,
staging and follow-up of cachexia; however, there is no consensus as to
methodology [1, 42]. Cross-sectional imaging has been suggested as the
preferred method (CT or MRI), followed by dual-energy x-ray
absorptiometry (DXA), mid-arm muscle circumference (AMC) and
bioimpedance analysis [1]. Handgrip strength has been suggested as the
preferred method assessing muscle function [1, 3, 42]. There is also no clear
consensus as to which cut-off limits should be used in diagnosis of cachexia.
Appendicular skeletal muscle mass index (ASMI) consistent with sarcopenia
have been suggested when using DXA [1, 3].

Dietary energy density and energy intake in cancer patients
6
The catabolic drive and metabolic abnormalities in cancer cachexia has long
been considered to be the result of a variety of interactions between the tumor
and the host, of which all are not completely understood [38, 39]. The tumor
induces local production of pro-inflammatory (interleukins; IL-1, IL-6, IL-8,
interferon-γ and tumor necrosis factor-α) and anti-inflammatory cytokines
(IL-4, IL-10 and IL-13) as well as tumor specific cachectic factors
(proteolysis inducing factor and lipid mobilizing factor) [38, 39]. The liver
responds by increasing the production of positive acute-phase proteins such
as C - reactive protein (CRP) and fibrinogen. Concomitantly the level of
albumin, a negative acute-phase protein, may fall [38]. Although not
completely understood, there also seems to be a neuro-endocrine stress
response that results in inadequate neuro-hormonal anabolic activity (insulin,
growth hormone and testosterone) and excess catabolic activity (cortisol and
myostatin) [38]. These host tumor interactions results in a catabolic state with
a deranged protein, lipid and glucose metabolism [38, 39]. Systemic
inflammation measured by CRP is associated with WL and poor prognosis
[5, 43]. The value of specific cytokines in the assessment of inflammation in
cachexia needs further study [5, 10]. Systemic inflammation is therefore
considered to be one of the key features of the cachectic state and an
important therapeutic target [1, 10, 38].
The most common marker of systemic inflammation in cancer patients has
been the level of CRP [1]. Two cut-off levels have been suggested, CRP >5
or >10 mg/L [3, 4]. Alternative markers and prognostic scores include
erythrocyte sedimentation rate (ESR), serum albumin, the composite
Glasgow Prognostic Score, the Neutrophil Lymphocyte Ratio or the Platelet
Lymphocyte Ratio [22, 43, 44]. Additional work is required to establish the
value of different measures of inflammatory response as diagnostic criteria
and selection in clinical trials [1, 43]
Many different anti-inflammatory therapies have been used in cancer
cachexia treatment. Therapies include celecoxib, indomethacin,
eicosapentaenoic acid, ibuprofen and thalidomide. The effects have generally
been positive but inconsistent and few studies have been carried out that
compared treatments [45-52]. Lundholm et al. showed that indomethacin
prolongs survival over that achieved with placebo, but the effect of
prednisolone is less clear [46]. Mantovani et al. showed that a combination of
a progestational agent, eicosapentaenoic acid, L-carnitine and thalidomide is
more effective in improving lean body mass, resting energy expenditure
(REE) and fatigue reduction than any of the agents given alone [53].
Similarly, a combination of fish oil and COX-2 inhibitors is more effective in

Ola Wallengren
7
improving weight and strength than fish oil alone [48]. It is clear that further
study is needed to determine the most effective mode of anti-inflammatory
treatment.
Loss of appetite is one of the most frequently reported symptoms in cancer
patients with on average 65 % of patients reporting anorexia in studies of
palliative care [5, 26, 33]. Neuroendocrine and metabolic control of EI and
appetite is regulated by peripheral signals to the brain as well as signaling of
metabolic sensors in the brain and brainstem. It is clear that cancer anorexia
is multifactorial and involves most of the signaling pathways modulating EI
[26, 39]. The influence of anorexigenic signals is dominating and the
orexigenic signals are reduced so that anorexia develops and EI is reduced
[26, 39]. However, reported anorexia is not always associated with reduced
intake and WL and vice versa [5].
Reported energy intakes by cancer patients are generally low. Average
energy intakes are close to reported basal energy expenditure [26, 54, 55]. As
a consequence a significant number of patients consume less energy than is
required for basal activities of daily living. Energy intake is associated with
WL in several but not all studies [5]. As a diagnostic criteria an EI < 1500
kcal/day have been used classifying patients with low intake [4]. Patients
own estimate of intake in relation to normal have also been suggested for
assessment of overall food intake [1].
Increased energy expenditure would also contribute to a negative energy balance. Resting energy expenditure has been measured in a variety of studies and results have been variable [5, 39]. Increased, normal and decreased metabolism has all been found [5, 39, 56]. Hypermetabolism may be present in some patients and it has been related to type and stage of tumor and the presence of systemic inflammation [5, 34, 39]. Total energy expenditure may fall due to reductions in physical activity, compensating for reduced EI and any hypermetabolism [57, 58]. Interestingly, it is possible to increase total energy expenditure with oral nutritional supplements (ONS) containing eicosapentaenoic acid [58].
Many drugs have been evaluated for their appetite stimulating properties and effect on EI, including progestins, glucocorticoids, cannabinoids and ghrelin [59-62]. There are some improvements in appetite, EI and body weight (BW); however, several of these drugs have unwanted side effects and no clear benefit towards QoL or survival have been observed which limits their clinical usefulness [10, 26, 59-62].

Dietary energy density and energy intake in cancer patients
8
A number of symptoms may limit food intake in patients with advanced cancer, such as; anorexia, pain, early satiety, nausea, vomiting, dry mouth, dysphagia, dysgeusia, constipation and others, caused by the disease itself or by treatment [26, 63]. Many of these nutrition impact symptoms are present concurrently and psychological factors, such as anxiety, depression and distress, may also contribute [26]. Anorexia, dysphagia, pain and mouth sores are associated with reduced dietary intake, WL and reduced functional capacity [63]. Anorexia, dysphagia, nausea, pain, constipation and depressed mood are also associated with shorter survival [33, 64]. Many of these symptoms can be treated or palliated and there is a need of an integrated approach of these symptoms in the assessment and treatment of cancer cachexia [1, 26, 33].
The cachexia syndrome has detrimental effect on QoL. Patients report an
impact on their emotions, spirituality, relationships and social functioning.
Together with anorexia, pain and fatigue this results in a restricted and
isolated life with decreased performance status and QoL [4, 26, 63, 65, 66].
Reduced QoL is associated with shorter survival [64]. There is a significant
correlation between physical activity levels and patient reported physical
function, role function and fatigue [57, 67]. Nutritional status is also
associated with QoL and function and these aspects can also improve with
nutritional interventions [65, 68-70].
Fatigue is one of the most common symptoms for patients with advanced
cancer [33]. Fatigue can be defined as a subjective feeling of tiredness,
weakness or lack of energy [71]. It is a multidimensional syndrome of
physical, cognitive and emotional components with difficulty in motivation
or in activity. The exact cause of fatigue remains unclear and many
contributing factors may exist, such as energy depletion, alterations in muscle
metabolism, pro-inflammatory cytokines, anemia, endocrine disorders,
infections, medications, depression, and other interfering symptoms [42, 71,
72]. Pharmacological interventions for fatigue have shown some effects of
psychostimulant methylphenidate, erythropoietin and darbepoetin [73]. Non-
pharmacological interventions support the use of exercise and psychosocial
interventions in the management of cancer related fatigue. Overall, more
research is warranted, especially to determine potential efficacy in those with
advanced disease [73].
Patient centered outcomes, such as patient reported QoL, function and
symptoms, are important aspects when assessing the impact of cachexia and

Ola Wallengren
9
effects of anti-cachectic treatment [1, 74, 75]. In palliative care, QoL and
function becomes the principal or only endpoint of consideration [27, 74, 75].
The European Organization for Research and Treatment of Cancer
questionnaire (EORTC-QLQ-C30) [76] is recommended in the routine
assessment functional and psychosocial effects [1]. Alternatively, physician
reported performance status can also be used (e.g. Karnofsky performance
score or Eastern Cooperative Oncology Group questionnaire) [1, 77, 78].
Objectively measured physical activity with activity meters can be used to
assess physical function, may provide a surrogate marker of QoL and is a
meaningful outcome in clinical trials [1, 37, 57].
The overall goal of oral nutritional support to cancer patients is to maintain or
improve nutritional status and thereby improve treatment tolerance and
outcome. Additional goals are to reduce disease or treatment symptoms,
maintain or improve functional capacity and ultimately improve the patient‟s
QoL [11-13, 68, 79-82]. Nutrition support in curative treatment aims
primarily at increasing treatment tolerance [26, 65]. In the palliative phase,
the main goal is to alleviate and prevent adverse symptoms and maintain or
increase QoL [26, 65]. For caregivers involved in decisions related to
nutritional support in patients with advanced cancer it is important to keep
aware of the current state of evidence concerning prognosis in this patient
group [26]. Approximation of life expectancy is required to make appropriate
decisions in the phases of advanced malignant disease [26].
When ad libitum dietary intake is inadequate there are a number of nutrition
support strategies available; dietary fortification and counseling, oral
nutritional supplements (ONS, ready to drink or reconstituted powder),
enteral tube feeding and parenteral nutrition, alone or in combination [11].
Conventional nutrition support cannot fully reverse the loss of muscle or the
ensuing functional impairment in cachectic patients [1, 9]. However,
multimodal treatment including nutrition support and anti-inflammatory
treatment has been shown to partially alter the cachectic trajectory, improving
functional capacity, QoL and prolonged survival of advanced cancer patients
[20, 49, 53, 68, 83]. End stage catabolic patients with severe muscle wasting,
low performance status and unresponsive to oncological treatment may not
have clinical important benefits from such multimodal treatments [1].

Dietary energy density and energy intake in cancer patients
10
European, American and Australian guidelines on nutritional support to
cancer patients recommend that nutrition receives prompt attention and that
intervention is commenced in patients that are malnourished or at risk for
developing malnutrition [79-82, 84]. However, these guidelines do not fully
capture the potential benefits of oral nutritional support such as dietary
counseling and ONS as they rely predominantly on data from studies of
enteral or parenteral feeding [68].
Nutrition counseling is a supportive process, characterized by a collaborative
counselor–patient relationship, to set priorities, establish goals, and create
individualized action plans that acknowledge and foster responsibility for
self-care to treat an existing condition and promote health [85].
Dietary counseling to improve nutrient intake in cancer patients with
declining nutrient status is in routine practice often recommended as the first
line of diet therapy, prior to using ONS or in combination with ONS [11, 12].
Dietary counseling should be individually tailored to nutritional needs,
nutritional status, dietary restrictions, tolerance and feasibility,
gastrointestinal function, medical condition and expected side effects of
treatment [11, 12]. There are various dietary counseling strategies to support
oral nutrient intake, including increasing the intake of energy-dense food and
beverages, increasing the frequency of meals and snacks, enhancing flavor,
modifying texture or temperature, limit beverage or separate food and
beverage intake, retry problem foods, take alcohol as an appetite stimulant
and avoid or include foods to remedy symptoms [11-14]. An alternative
approach is to not increase quantity, avoid nutritional supplements or be
allowed not to eat and that dietary restrictions should be lifted [13].
Psychosocial targeted advice includes eating what you want, can tolerate, are
easy to eat, enjoy and that will improve QoL. Some suggest relaxing dietary
restrictions and eat whatever negotiated as best by patient and family [13].
Most of these advices are based on expert opinions with little theoretical
justification or empirical evidence to support them [13]. Some are based on
observational studies, non-randomized trials or interventions in other patient
groups [11-14]. Many studies neglect to report or give very brief information
about the person giving the dietary counseling, frequency of counseling,
which specific advices that were given, counseling methods used or the
patients understanding and compliance. Most importantly, randomized trials
Ola Wallengren
11
comparing the effects of specific dietary advice and their relative efficiency
in cancer patients are lacking [11-13]. Consequently, little well supported
specific dietary counseling strategies aimed at improving dietary intake in
cancer patients are available. This is an area for further study.
Energy dense foods are used with the intent of increasing the ED of the diet
and thereby increase EI. Small meals, in reference to weight and volume,
with high ED will provide more energy and are supposed to be less satiating.
Diet energy density is positively correlated with EI in healthy and obese
people, both in experimental studies and in studies of people eating
self-selected diets in free living conditions [15-19]. Cross-sectional
epidemiological studies have shown that ED and BMI are correlated and that
ED is associated with weight or waist circumference [86, 87]. This result,
while not a general finding, implies that ED is associated with long-term
energy balance in healthy and obese people [86, 87].
Experimental studies in institutionalized elderly or with home-delivered
meals have shown that EIs increase when ED of the diet are increased [88-
91]. However, these were not self-selected diets and all or a large part of the
diet were manipulated and supplied to the subjects. This limits the potential
for compensatory changes in intake and may not reflect the long term impact
of diet ED on energy balance in the context of dietary counseling. With
increased ED of the diet a decrease in the amount (weight) of food is usually
observed so that EI increases less than expected (i.e. food intake
compensation) [11, 15, 19, 92, 93].
The effect of dietary advice aimed at increasing ED in patients with advanced
cancer eating self-selected diets in free living conditions has not been studied.
Dietary counseling to increase the intake of energy-dense foods may be
inappropriate for patients with advanced cancer, if it does not result in
increased EI and an improved energy balance. This may be the case, for
example, if the patient makes compensatory changes.
Dietary energy density can be defined as the energy per unit of dry or wet
weight of food or energy per unit of volume of food. Usually ED is defined
as energy per wet weight of food eaten [19]. The energy density of the diet is
dependent on the macronutrient composition, amount of water, fiber and air
in the diet, where the amount of water and fat is of most practical importance
[94].

Dietary energy density and energy intake in cancer patients
12
Different methods of ED calculation have been used, in reference to the types
of food included in the analysis [95, 96]. The energy density can be markedly
affected by the inclusion or exclusion of specific dietary items, particularly
energy-free beverages [94-96]. This has implications for making direct
comparisons between studies and interpretation of findings. In addition,
associations between ED and dietary intake could vary according to how ED
was calculated and therefore make the results of such studies method-
dependent [87, 95]. For example, studies in healthy subjects have shown that
ED is associated with long-term energy balance but the association depends
on whether water and less energy-dense drinks are included in the calculation
[87]. Research on healthy subjects suggests that energy-free beverages do not
influence EI, though the long term effects of non-energy beverages intake on
EI have not been fully explored [19, 97-99].
There is also limited information on the influence of patient characteristics on
the association between ED and EI, potentially hampering individual
tailoring of dietary treatment in clinical practice. In a heterogeneous sample,
dietary associations in a between- or within-subject analysis could be
different, due to differences among subjects such as age, sex, BMI, physical
activity level, dietary reporting levels and related measurement errors (i.e.
attenuation bias) [19, 100, 101].
Clarification of the association between ED, EI and energy balance in
patients with advanced cancer is, therefore, necessary to improve dietary
advice.
To review the evidence base for oral nutritional support to cancer patients
meta-analyses, evidence based guidelines, systematic reviews and their
bibliographic references were searched to identify studies that studied the
effectiveness of oral nutritional support in cancer patients compared to no
advice or usual care [11-13, 68, 79-84, 102-105]. Searches were updated with
PubMed searches with combinations of exploded MeSH terms including
neoplasm, diet therapy and nutritional support and related search terms. Only
human randomized controlled trials (RCT) in English or Nordic languages
were included. Trials studying the effects of parenteral or enteral nutrition or
specific nutraceuticals (e.g. EPA, arginine, and glutamine) were excluded.
Twenty-two RCTs with a total of 1847 participants were found [106-127].

Ola Wallengren
13
Study groups were:
no advice
usual care
the prescription of ONS
dietary counseling
dietary counseling and ONS
The no advice or usual care groups were control groups. However, usual care
included brief nutritional advice, written or by dietician or other health care
professionals in some studies. Oral nutritional supplements were
commercially available ready to drink sip feeds but also creams or
reconstituted powders that were nutritionally complete or energy/protein
dense with vitamin and minerals. Amounts of ONS prescribed were not
specified in all studies but ranged from 400 to 2400 kcal [106, 124, 125].
Four studies compared elemental or hydrolyzed diets to standard diets in
patients with abdominal radiation [106-109]. In the 19 studies that included
some form of dietary counseling or usual care with dietary information this
was performed by a dietician in 13 studies [110, 113, 114, 118-127],
otherwise it was performed by other health care professionals or not
specifically mentioned. In most studies, the dietary counseling strategies used
were only briefly described and focused mainly on increasing the intake of
energy-dense food and beverages, increasing the frequency of meals and
snacks, modifying texture and to avoid or include foods to remedy
symptoms.
Overall there were several clinical benefits of the interventions including:
Improved energy and protein intake [111, 113, 115, 119,
121, 123-125, 127]
Improved body weight and anthropometry [106, 112, 117,
118, 122, 123, 126]
Less malnutrition [120, 123-125]
Improved immune function [106, 107]
Improved QoL and function [124, 125]
Less symptoms [116, 124, 125]
Less complications or improved treatment tolerance [114,
117, 127]
Reduced length of stay in hospital [114].

Dietary energy density and energy intake in cancer patients
14
Effects of the interventions were mixed and 3 studies did not find any
significant effects at all [108-110]. Two of these were comparisons of
elemental diet for 33-44 days to standard low fiber diet; however, in 2 similar
trials there were improvements in weight and immune function [106, 107].
The 3rd
study included only well-nourished patients where positive effects are
less likely [11, 110]. In the largest study, comparing dietary counseling, ONS
or their combination to a control group, only modest effect on weight were
found in the counseling group with no other effects of the interventions
[126]. However, compliance to nutritional support was very low, for
example; only 19% of patients were able to take their full prescription of
ONS by week 6 of the 1 year study and only 17% completed more than one
food diary [126].
In the most recent meta-analysis of the effects of oral nutritional support in
cancer patients 13 randomized controlled trials with 1414 participants were
included [68]. There were no significant differences in mortality between
intervention and control groups (RR 1.06, P =0.43, I2=0%). Nutritional
intervention had positive effects on some measures of QoL and symptoms
(global QoL, emotional functioning, dyspnea and anorexia). There were
significant improvement in BW (mean difference 1.86 kg, P =0.02, I2=76%)
and EI (mean difference 432 kcal/day, P =0.001, I2=97%). Heterogeneity
was high in all significant analyses. Studies showing larger effects were
identified as sources of heterogeneity [123-125]. Consequently, after
removing these studies no significant effects were found.
In a previous meta-analysis with 3 studies [107, 111, 115], of which 2 were
not included in the above meta-analysis, found that oral nutrition support
increased EI by 381 kcal/day, without significant heterogeneity [83].
The several positive effects of oral nutritional support in cancer patients are
also supported by meta-analyses in other patients groups that have
consistently shown improvements in nutrient intake, anthropometry and also
a number of clinical and functional benefits [11, 102, 104, 105]. Contrary to
studies in cancer patients, meta-analyses in several other patient groups have
repeatedly shown reductions in hospital admissions and mortality [11, 104,
105]. However, the most recent Cochrane review did not find a consistent
effect on survival [102]. Most studies in cancer patients are not adequately
designed or powered to study the effects on mortality. For example, Baldwin
et al. aimed at a assessing the effects of nutritional interventions on survival.
They intended to include 660 patients to reach adequate power but the study
was stopped prematurely by advice of a data monitoring committee and only
included 358 patients and only half of the predicted deaths had occurred
[126].

Ola Wallengren
15
There are inherent difficulties studying the effects of nutritional
interventions. Failure to comply with the treatment, lack of blinding and
patients obtaining dietary information from alternative sources all make it
difficult to assess the true treatment effect and also decrease the effect size
(ES) of the interventions [128]. With these methodological issues and the
large clinical heterogeneity between studies in mind, it is not surprising that
results are heterogeneous and effects are modest or insignificant.
Consequently, it is not yet possible to determine whether this is due to failure
of the interventions, due to poor compliance or different effects in diverse
patient groups and settings.
In conclusion, oral nutritional support to cancer patients is effective at
increasing nutritional intake and BW and can also improve some aspects of
QoL and malnutrition related outcomes. No beneficial effects on mortality
have been found. Available evidence suggests that oral nutritional support
should include dietary counseling with ONS if needed. Few well supported
specific dietary counseling strategies aimed at improving dietary intake in
cancer patients are available. The effects of diet ED on EI and energy balance
have not been specifically studied. Conclusions are clearly limited by the
large clinical and statistical heterogeneity and the low to moderate quality
data from available studies. Further studies are needed.

Dietary energy density and energy intake in cancer patients
16
The overall aim of this thesis was to investigate if the energy density of the
diet is important for maintaining an adequate energy intake in cancer patients.
The thesis also aimed to examine which patient characteristics that may
influence dietary intake, all in order to increase knowledge and efficacy of
nutrition therapy for disease-related malnutrition in cancer patients.
An additional aim was to study the relation between different diagnostic
criteria for cancer cachexia and the prevalence of adverse patient centered
outcomes such as reduced QoL, impaired function, symptoms and also the
prognostic significance of these criteria on survival.
Specifically, the following questions were addressed:
1. Is diet ED associated with EI in palliative care cancer
patients? (paper I)
2. Which method of diet ED calculation is most appropriate to
describe a possible relationship between EI and ED? (paper
I)
3. In addition to diet ED, what subject characteristics (i.e. sex,
age, BMI, WL, muscle mass, hand grip strength, fatigue and
inflammation) are associated with EI? (paper II)
4. Do subject characteristics associated with EI influence the
association between EI and diet ED? (paper II)
5. Is the association between ED and EI different within
individuals compared to group level associations when
accounting for between subject differences? (paper II)
6. Is diet ED and EI associated with energy balance in patients
with advanced cancer, and does systemic inflammation
influence these possible relationships? (paper III)
7. Which diagnostic criteria of cancer cachexia are associated
with reduced QoL, more symptoms, reduced functional
abilities and shorter survival? (paper IV)

Ola Wallengren
17
Patients referred to a palliative care program at the Department of Surgery at
Sahlgrenska University Hospital (Gothenburg, Sweden) between 1993 and
2005 were included in the studies. This was a secondary analysis of cross-
sectional and longitudinal data from intervention studies of anti-inflammatory
treatment with indomethacin, of anemia with erythropoietin, insulin
(NCT00329615), dietary counseling and nutritional support in an outpatient
palliative care program. [20-23]. Patients were invited to participate in
follow-up measurements that included biochemical tests, measurement of
body composition and dietary intake every 4 months. None of the patients
received radio- or chemotherapy during follow-up or had received any of
these therapies within 6 months of the start of our evaluations.
Inclusion criteria were the presence of generalized malignant disease with a
solid tumor type without efficient or established tumor treatment available,
expected survival of more than six months at first visit. Subjects were also
required to have data for BW, height and WL from pre-illness weight. In
paper I, II and IV baseline data at inclusion in the above mentioned studies
were used for analysis. In the longitudinal follow-up, all available data that
met the study criteria were used for analysis. Measurement of REE was
required in paper I. For inclusion in paper I-II at least one food record (FR)
was required. The completion of at least two measurements of body
composition and FRs separated by 4 months were required for the
longitudinal follow-up (paper III). For paper IV at least one outcome was
required (quality of life questionnaire or a treadmill walk). Exclusion
criterion was treatment with parenteral or enteral nutrition at inclusion (paper
I, II and IV) and during follow-up (paper III). Outliers for EI (outside ± 3
SD) were excluded in paper II. Only patients with a complete data set were
included in paper I. In paper II and III only patients with complete data in the
mixed models are presented. An overview of design and analysis is presented
in Table 1.
Dietary energy density and energy intake in cancer patients
18
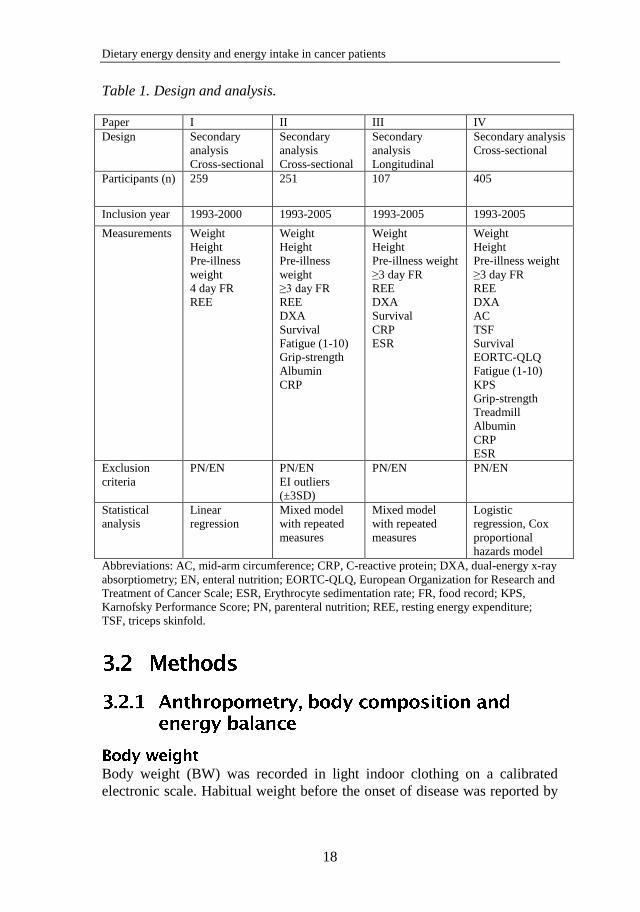
Table 1. Design and analysis.
Paper I II III IV
Design Secondary
analysis
Cross-sectional
Secondary
analysis
Cross-sectional
Secondary
analysis
Longitudinal
Secondary analysis
Cross-sectional
Participants (n) 259 251 107 405
Inclusion year 1993-2000 1993-2005 1993-2005 1993-2005
Measurements Weight
Height
Pre-illness
weight
4 day FR
REE
Weight
Height
Pre-illness
weight
≥3 day FR
REE
DXA
Survival
Fatigue (1-10)
Grip-strength
Albumin
CRP
Weight
Height
Pre-illness weight
≥3 day FR
REE
DXA
Survival
CRP
ESR
Weight
Height
Pre-illness weight
≥3 day FR
REE
DXA
AC
TSF
Survival
EORTC-QLQ
Fatigue (1-10)
KPS
Grip-strength
Treadmill
Albumin
CRP
ESR
Exclusion
criteria
PN/EN PN/EN
EI outliers
(±3SD)
PN/EN PN/EN
Statistical
analysis
Linear
regression
Mixed model
with repeated
measures
Mixed model
with repeated
measures
Logistic
regression, Cox
proportional
hazards model
Abbreviations: AC, mid-arm circumference; CRP, C-reactive protein; DXA, dual-energy x-ray
absorptiometry; EN, enteral nutrition; EORTC-QLQ, European Organization for Research and
Treatment of Cancer Scale; ESR, Erythrocyte sedimentation rate; FR, food record; KPS,
Karnofsky Performance Score; PN, parenteral nutrition; REE, resting energy expenditure;
TSF, triceps skinfold.
Body weight (BW) was recorded in light indoor clothing on a calibrated
electronic scale. Habitual weight before the onset of disease was reported by
Ola Wallengren
19
the patients. Weight loss was calculated as the difference between the two,
and expressed as percentage of habitual BW. Body height was measured
using a wall-mounted stadiometer and body mass index (BMI) was calculated
as weight (kg) divided by height (m) squared. Weight loss and BMI were
classified according to five different criteria; BMI < 20, WL > 2%, 5%, and
10% respectively or WL > 2% and a BMI < 20 [1, 28].
Body composition was measured by dual-energy X-ray absorptiometry using
a LUNAR DPX-L scanner (Scanexport Medical, Helsingborg, Sweden).
Whole-body scans were obtained in fast-scan mode. Body fat and lean tissue
mass were analyzed using the extended research mode of the LUNAR DPX-
L software (Version 1.31; Scanexport Medical). Appendicular skeletal
muscle mass index (ASMI) calculated from appendicular lean soft tissue
mass (kg) divided by squared body height were used as a proxy of whole
body skeletal muscularity. Low ASMI was defined as ASMI < 7.26 kg/m2
for males and < 5.45 kg/m2 for females [1, 3]. Alternatively, AMC was used
with a cut-off below the 10th percentile of a reference population [3, 129].
AMC was estimated using triceps skinfold and mid-arm circumference,
measured with a Harpenden skinfold caliper and tape measure at midpoint of
the humerus. Low muscle mass was defined as low ASMI or AMC below
cut-off.
Resting energy expenditure (REE) was measured by indirect calorimetry
(Deltatrac; Datex, Helsinki, Finland) after an overnight fast.
Hypermetabolism was expressed as the percentage of measured REE above
or below the predicted basal metabolic rate using the Harris-Benedict
equation.
Energy balance was estimated from the difference in body composition from
DXA scans separated by 4 months. Changes (gain or loss) in fat or fat-free
mass were multiplied by their respective energy value (9,417 kcal/kg for fat
and 884 kcal/kg for fat-free mass) and divided by the number of days
between scans, giving energy balance per day (kcal/day) [35].
A dietician instructed the patients to complete a 4-day FR at home. Amounts
of all food and beverages were recorded in household measures. The dietician

Dietary energy density and energy intake in cancer patients
20
interviewed each patient and any ambiguities were resolved upon return of
the FRs. The emphasis in dietary intake during the study of palliative
nutritional intervention in addition to indomethacin and erythropoietin
treatment had been on energy and macronutrients [20]; consequently, the
recording of beverages that did not contain energy was not specifically
requested. Estimation of serving sizes and conversion to weight units were
aided by a previously validated meal model [130]. Intakes of energy and
nutrients were calculated with KOSTSVAR (from 1993 to 2000) or with
DIET32 (from 2000 to 2005) software (Aivo, Stockholm, Sweden). The
National Food Composition table (PC-kost, Statens livsmedelsverk, Uppsala,
Sweden) was used as nutrient database. Food records were validated by 24
hr. urinary nitrogen [56].
Energy intake is reported in absolute amounts (kcal), amount per kg of BW (kcal/kg/d), and as a multiple of the measured REE (EI/REE). Macronutrient intake is reported as the percentage of EI (E%). Food weight, water volume and fiber weight are expressed in grams per day and as percentage of the total food weight (W%).
“Energy density” is defined as the amount of energy per wet weight of food
(kcal/g). Four different methods, with varying exclusions of different
beverages and water, were used to calculate the ED in the diet: (ED1) all food
and beverages (paper I-IV); (ED2) all food and energy-containing beverages
(paper I); (ED3; EDfood) all food and milk (paper I and III); and (ED4) food
only (paper I). These methods have previously been used by Cox and Mela,
and were used here in slightly modified form, in that alcoholic beverages
were excluded in ED3 and no analysis were performed on all dry matter and
macronutrients [95]. In paper III ONS were also included in calculation of
EDfood (ED3). Summaries of methods and the rationale for different
calculations of ED are presented in Table 2. The food and beverages were
grouped in accordance with Swedish National Food Composition Tables
grouping of foods [131]; in addition, a food group was created for energy-
free beverages.

Ola Wallengren
21
Table 2. Methods of energy density calculation. Methods presented in the order of least exclusion of food items.
Method Includes Excludes Rationale
ED 1 Total dietary
intake
- Typical dietary measure.
Includes all on the
assumption of a complete
dietary record.
ED 2 All food and
energy-containing
beverages
Energy-free beverages, e.g.
water, tea, coffee and non-
energy sweetened soft drinks
Between meals beverage
intake could be
incompletely recorded.
Uncertain to what extent
non-energy beverages
affect energy intake.
ED 3
(EDfood)
All food and milk
(ONS)
All other beverages than milk Milk is consumed both as
food and as a beverage.
ED 4 Food only All beverages Exclusion of beverages can
presumably decrease CV
Abbreviations: CV, coefficient of variation; ONS, oral nutritional supplements.
Blood tests included measurement of C-reactive protein (CRP), erythrocyte
sedimentation rate (ESR), S-Albumin and hemoglobin (Hb) levels. The
presence of inflammation was defined by two criteria: 1/ An elevated level of
CRP (three levels: CRP > 5, CRP > 10, CRP > 15 mg/L) or 2/An elevated
ESR (two levels: > 20, > 30 mm/h). The Glasgow Prognostic Score (GPS)
was also used to define whether inflammation was present [43].
Hypoalbuminemia was defined as S-Albumin < 32 g/L and anemia as Hb <
120 g/L [3, 28].
Karnofsky Performance Score was assessed by the attending clinician and a
score of 80 was used as cut-off [4, 77]. Grip strength was measured with a
hand-held spring-loaded dynamometer. Low muscle strength was defined as
a value in the lowest tertile, adjusted for sex and age [3]. Walking distance
was measured on a treadmill. The exercise started with patient standing on
the treadmill with all equipment connected for 1 min and thereafter walking
1.5 km/h for 2 min. The test continued with walking at 1.5 km/h at a 12%
elevation for 1 min; thereafter, the speed was increased 0.1 km/h every 10th
second until the person finished the test. Patients with reduced walking
capacity were defined as having walking distance less than the patient group
mean, adjusted for sex and age.

Dietary energy density and energy intake in cancer patients
22
The European Organization for Research and Treatment of Cancer (EORTC)
QLQ-C30 form were filled out by the patient. The QLQ-C30 was developed
for cancer patients and has been validated in multicultural environments [76].
It considers several factors that contribute to QoL, including physical and
role functioning, cognitive status, emotional and social factors and global
QoL. Symptoms (fatigue, pain, nausea and vomiting, dyspnea, and insomnia)
and financial implications are also included in this questionnaire. Answers to
specific items were summed and transformed linearly to range between 0
(representing poor health) to 100 (representing optimal health status). Higher
scores on the symptom scales indicate a high level of symptoms.
Cluster analysis with a two cluster solution was used to identify relatively
homogenous groups of patients into QoL and symptom clusters. Primary
outcome were a “QoL and symptom” cluster where all functional and
symptom scales and items, except financial implications, were used to form
two clusters with patients differing in these two aspects. In addition, two
more cluster analyses were run with only QoL and functional scales or only
symptoms scales, to form two additional outcomes focusing on each aspect.
Patients with lower QoL and function or more disease symptoms were
considered to have adverse outcomes.
Patients were also asked to rate their own perception of fatigue on a 10 point
scale (1-10). This measure of fatigue was used as diagnostic criteria and after
visual inspection of the distribution and comparison with reference values for
EORTC QLQ-C30 [132] a value >3 were used as cut-off (paper IV).
Patients were classified as having cachexia using three recently published
definitions; 1/ The 2- and 3-factor profile definitions described by Fearon et
al., incorporating WL (≥ 10%), low food intake (≤ 1500 kcal/day) and
systemic inflammation (CRP ≥ 10 mg/L) (Fearon et al. 2006)[4]; 2/ The
diagnostic criteria of Evans et al. with WL (> 5%) plus three of the
following: decreased handgrip strength, fatigue, low EI, low muscle mass or
abnormal biochemistry (CRP > 5 mg/L, anemia or low albumin) (Evans et al.
2008) [3]; and 3/ The 2011 expert panel consensus definition of screening
and staging of cachexia using WL, BMI or low muscle mass (Fearon et al.
2011) [1].

Ola Wallengren
23
Group data are expressed as mean ± SD unless otherwise stated. Data were
checked for normality with one-sample Kolmogorov-Smirnov test. When
log-transformation restored normality the transformed data were used. Data
were analyzed using SPSS for Windows version 11.5 (paper I) and 19.0.0
(paper II-IV) (SPSS, Chicago, IL). A P-value < 0.05 was considered to be
significant.
Differences in proportions were analyzed with the χ2-test or Fisher‟s exact
test, as appropriate. Differences between group means were tested with t-test
for normally distributed data and with Mann-Whitney U-test for QoL data.
Differences in means between more than two groups are assessed by 1-way
ANOVA, and post hoc differences, by the method of Bonferroni.
The association between ED and EI were analyzed with Pearson´s correlation
coefficient and linear regression (paper I and II). Associations between
mixed model estimated individual intercepts and slopes and subject
characteristics were analyzed with Pearson‟s correlation coefficient (paper
II).
Linear mixed models were used to analyze the multi-level repeated measures
data in paper II and III. In paper II, a mixed model was used to investigate
the relationship between EI and ED and a number of patient characteristics.
In paper III, the mixed model was used to investigate the relationships
between energy balance and ED, EDfood, EI, systemic inflammation and
survival. Details of the analyses are given below.
Paper II
Energy intake was the dependent variable. Fourteen explanatory variables
were included from start: ED, age, sex, BMI, WL, tumor type, survival
(tertiles), hypermetabolism, low serum albumin (<32 g/L), high CRP (CRP
>5 mg/L), low ASMI (<7.25 in males and <5.45 in females), fatigue,
handgrip strength (adjusted for sex and age) and day of dietary record. These
variables were entered as fixed effects, which can be interpreted as estimates
of group mean effects. Day of dietary record was entered as a repeated effect
with a first-order auto-regressive covariance type and as a fixed covariate to
model dependence and trend across days. Starting from the full model, the

Dietary energy density and energy intake in cancer patients
24
explanatory variable having the highest p-value was excluded and the model
was refitted in a stepwise backward selection procedure until all remaining
explanatory variables in the model showed significance.
Apart from the fixed effects, the model includes a random intercept and a
random effect for ED. In a random intercept and slope model an intercept and
slope is estimated for each individual in addition to the fixed effects.
Significant random intercepts indicate that individual EI differs from the
group estimate when accounting for explanatory variables in the fixed effects
model. Similarly, significant random slopes indicate that individual responses
in EI for a change in ED are different from the overall group response (fixed
effect).
ED was centralized by subtracting the population mean value from each
observation. In this way the estimated variance of the random intercept can
be interpreted as the between-subject variation in the mean response at the
group mean value of ED.
Paper III
Energy balance was the dependent variable. The measurement period was
entered as a repeated effect with a Toeplitz covariance type. If model
convergence was not achieved, a first-order auto-regressive covariance was
used. The last measurement period before death was considered to be
common for all patients, in order to enable modeling of the natural disease
progression. Thus, measurement periods were 0-4 (1st), 4-8 (2
nd), 8-12 (3
rd)
and 12-16 (4th) months before the final follow-up appointment. ED and EI at
the beginning of measurement periods were entered as continuous predictors.
Additionally, models were adjusted at the beginning of each measurement
period for (log transformed) survival in days, or by tertiles of survival. The
presence of inflammation was defined by three criteria: the patient having an
elevated level of CRP (two levels: CRP > 5, CRP > 10 mg/L) or having an
ESR > 20 mm/h. The Glasgow Prognostic Score (GPS) was also used to
define whether inflammation was present [43]. Schwarz's Bayesian criterion
was used to select the inflammatory marker and measure of survival
(continuous or tertile-based) that yielded the best model. Differences in
patient characteristics and differences in dietary characteristics between
patients with or without systemic inflammation were tested with a mixed
model with repeated effects and test variable as the dependent variable.
Cluster analyses were performed with K-means cluster analysis with a two
cluster solution (paper IV).

Ola Wallengren
25
Logistic regression was used to estimate the odds ratio of having low QoL,
more symptoms or short walking distance with each diagnostic criteria or
cachexia definition as a single dichotomized predictor (paper IV).
Additionally, a stepwise forward logistic regression was fitted with all
diagnostic criteria as possible predictors for an adverse outcome (paper IV).
Survival analysis was conducted with a Cox proportional hazard regression
model with each diagnostic criterion or cachexia definition as a single
dichotomized predictor. A stepwise model with all predictors was also fitted
(paper IV). Differences in survival (days) were tested with the log-rank test
(paper IV).

Dietary energy density and energy intake in cancer patients
26
The largest sample of patients were included in paper IV (n = 405) and these
included nearly all of patients in the previous papers (Table 1). Thus, as an
overview of patient characteristics and dietary intake of patients included in
this thesis, data from paper IV is presented.
Patient characteristics, WL, functional status and biochemistry of patients are
shown in Table 3 and tumor types in Table 4. Patients had advanced disease
with 54 % having distant metastases (stage IV), which is reflected in values
for health status, functional status and a median survival of less than 6
months (Table 3).
Table 3. Patient characteristics at first visit (baseline)
n Mean ± SD Range
Survival (days; median, IQR) 405 175 ± 235 1–6014
Age (years) 405 68 ± 11 30–89
BMI (kg/m2) 405 23.0 ± 3.8 15.7–38.4
Weight (kg) 405 67.3 ± 13.8 35.4–119.7
Weight loss (%) 405 10.0 ± 9.3 -16–45
Hypermetabolism (%) 400 10.6 ± 13.1 -26–68
CRP (mg/L) 399 32 ± 43 1–300
ESR (mm/h) 375 39 ± 27 3–115
S-Albumin (g/L) 398 34 ± 5 19–47
Hemoglobin (g/L) 405 120 ± 16 67–165
Fatigue (EORTC, 0-100) 331 52 ± 28 0–100
KPS 290 84 ± 11 50–100
Walking distance (m) Male 159 317 ± 214 34–1241
Female 145 242 ± 192 3–1400
Abbreviations: CRP, C-reactive protein; EORTC, European Organization for Research and
Treatment of Cancer Scale; ESR, Erythrocyte sedimentation rate; KPS, Karnofsky
Performance Score.
Weight loss was noted in 84 % of patients before study inclusion. Proportions
of patients with WL more than 5, 10 and 15 % were 67, 46 and 27 %
respectively. Patients also had low appendicular skeletal muscle mass (67 %)
and the prevalence was higher in men (76 %, P < 0.001). 74 % had elevated

Ola Wallengren
27
CRP (>5 mg/L) with some differences across tumor types (P = 0.02).
Specifically, patients with upper gastrointestinal cancer had lower CRP than
those with biliary tract cancer (P = 0.02). Patients with inflammation (CRP >
5) had higher REE than predicted (12.1 vs. 5.8 % of BMR, respectively, P <
0.001) and also experienced slightly more WL before inclusion (10.5 vs. 8.5
%, respectively, P = 0.049). Fatigue (EORTC) was higher in patients with
inflammation (median, 56 vs. 33, respectively, P = 0.001). Patients with
pancreatic tumors had shorter survival than other tumor types (P = 0.04).
Table 4. Tumor types
Tumor type n %
Colorectal 91 22
Biliary tract 59 15
Upper gastrointestinal 107 26
Pancreatic 105 26
Other 43 11
Total 405 100
Energy intake ranged from 326 to 4715 kcal/day with mean intake of
1762±639 kcal/day (n = 322) (Table 5). Expressed in relation to BW
(kgBW), EI was 27.0±10.3 kcal/kg/day (range, 5.7–76.9 kcal/kg/day). Energy
intake, expressed as a multiple of measured REE (EI/REE), ranged from 0.29
to 2.87 with a mean of 1.18±0.41 (n = 318).
Macronutrient intake, expressed as percent of total EI was 36 E% fat, 45 E%
carbohydrate and 16 E% protein and thus did not differ from the general
population in Gothenburg [133]. Dietary protein intake estimated from 24h
urine nitrogen (n=53) according to Bingham and Cummings [134], were not
significantly different from protein intake calculated from FRs (mean
difference 4.5 ± 22.9 g/day, P = 0.15). Moreover, differences between
estimates were not significantly different between sexes or by overweight
status. However, there was a trend of FRs to overestimate protein intake at
lower intakes and underestimate at higher intakes (r = -0.58, P < 0.001).
Dietary energy density and energy intake in cancer patients
28
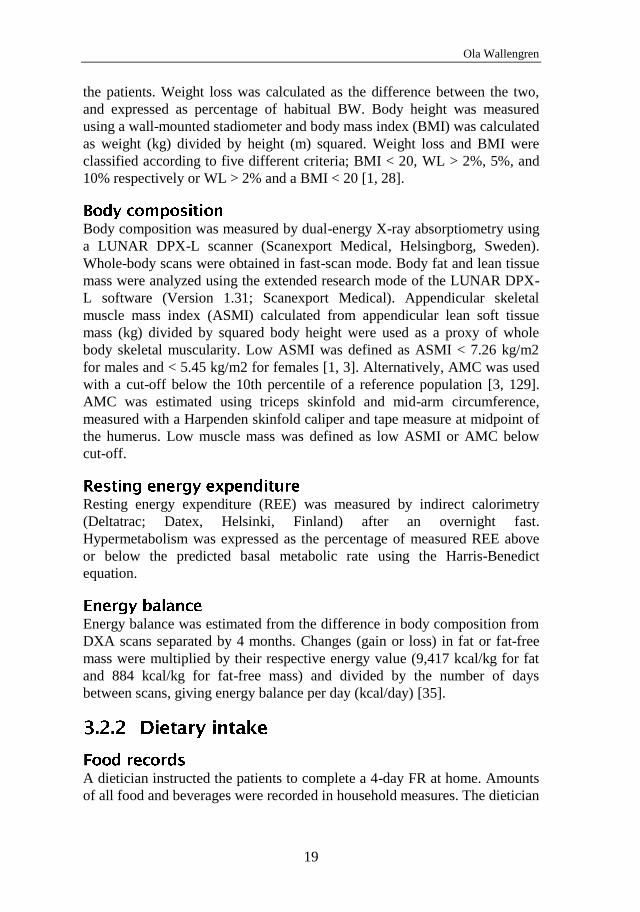
Table 5. Dietary intake
n = 322 Mean ± SD
Energy intake (kcal) 1761 ± 639
Energy intake(kcal/kg) 27.0 ± 10.3
Energy intake (EI/REE) 1.18 ± 0.41
Energy density (kcal/g) 0.90 ± 0.23
Fat (g) 73 ± 34
Carbohydrate (g) 201 ± 73
Protein (g) 68 ± 25
Protein (g/kg) 1.03 ± 0.4
Alcohol (g) 3 ± 10
Fiber (g) 13 ± 6
Water (g) 1618 ± 674
Food weight (g) 2042 ± 789
Fat (E%) 36 ± 7
Carbohydrate (E%) 45 ± 7
Protein (E%) 16 ± 3
Alcohol (E%) 1 ± 4
Water (W%) 79 ± 8
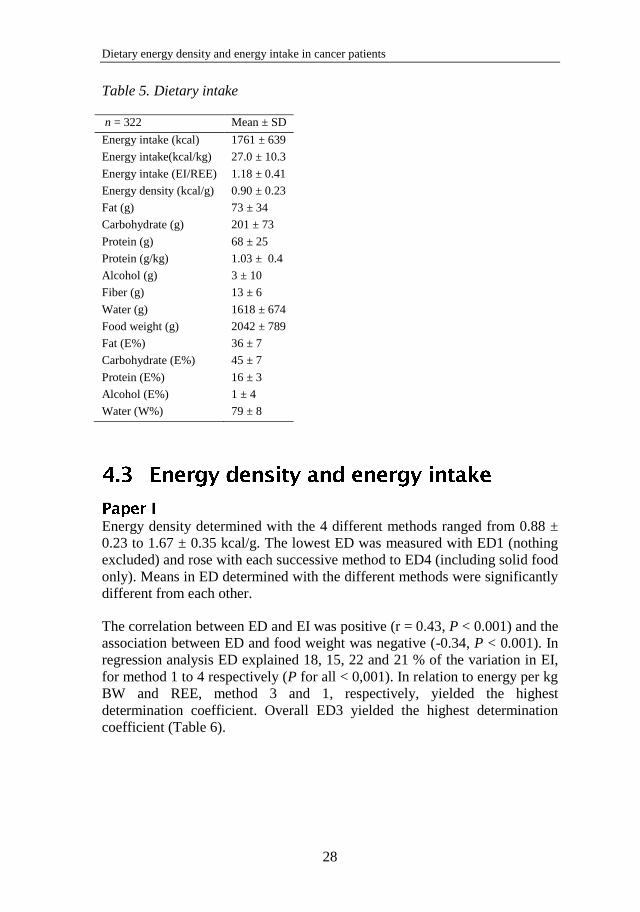
Energy density determined with the 4 different methods ranged from 0.88 ±
0.23 to 1.67 ± 0.35 kcal/g. The lowest ED was measured with ED1 (nothing
excluded) and rose with each successive method to ED4 (including solid food
only). Means in ED determined with the different methods were significantly
different from each other.
The correlation between ED and EI was positive (r = 0.43, P < 0.001) and the
association between ED and food weight was negative (-0.34, P < 0.001). In
regression analysis ED explained 18, 15, 22 and 21 % of the variation in EI,
for method 1 to 4 respectively (P for all < 0,001). In relation to energy per kg
BW and REE, method 3 and 1, respectively, yielded the highest
determination coefficient. Overall ED3 yielded the highest determination
coefficient (Table 6).

Ola Wallengren
29
Table 6. Determination coefficient (R2) in regression of different measures of
energy intake (EI, EI/kg BW and EI/REE) and diet energy density, calculated with four different methods (Table 2).
Method ED1 ED2 ED3 ED4
Energy (kcal)
R2 0.18 0.15 0.22 0.21
Energy (kcal/kg)
R2 0.16 0.10 0.16 0.16
Energy (EI/REE)
R2 0.18 0.16 0.18 0.15
All regressions were significant, P < 0.001.
Abbreviations: EI, Energy intake; R2, Determination coefficient; REE, resting energy
expenditure.
Age, BMI, fatigue and survival were negatively associated and
hypermetabolism was positively associated with EI. Effect estimates (1 SD)
were: -1.9 kcal/kg/d for age, -3.8 kcal/kg/d for BMI, -1.5 kcal/kg/d for fatigue
and 1.1 kcal/kg/d for hypermetabolism. For tertiles of survival, the effect
was -4.3 kcal/kg/d for 1st and -2.6 kcal/kg/d for 2nd compared to 3rd.
Patients with shortest survival (<3.7 months) had approximately 17 % lower
EI than patients with more than 8.3 months survival.
After adjustment with the above covariates, group mean estimate for ED (1
kcal/g) were 17.5 kcal/kg/d (95% CI, 15.2-19.8) and expressed as 1 SD, 4.5
kcal/kg (17.3 %) (P < 0.001) (Figure 1). When entering ED as the only
predictor of EI in a mixed model with fixed, random and repeated effects, the
group mean estimate for ED (1 kcal/g) was 18.5 kcal/kg/d (95%CI, 16.4-
20.6). Using linear regression with mean dietary ED predicting EI in these
patients, the β-coefficient was 16.6 kcal/kg/d (95% CI, 11.9-21.3) (P <
0.001), explaining 16.2% of the variation in EI. With multiple linear
regression with age, BMI, hypermetabolism, fatigue and tertiles of survival
as covariates, the β-coefficient for ED was 13.6 kcal/kg/d (95% CI, 9,6-17.6)
(p<0.001). Thus, estimates of the relationship between EI and ED from the
mixed model and simple or multiple linear regression, with or without
covariates were not significantly different judged by overlapping 95%
confidence intervals.
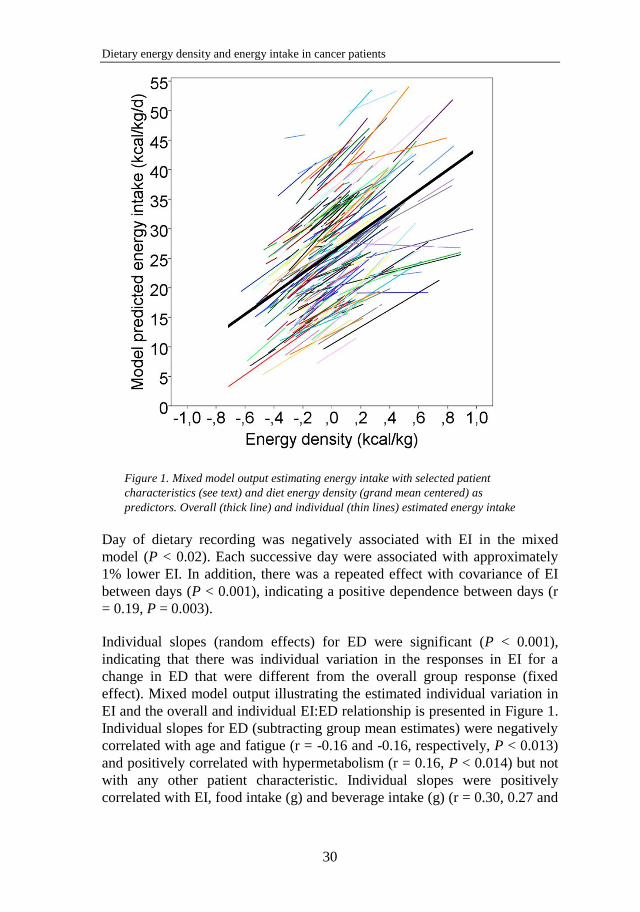
Dietary energy density and energy intake in cancer patients
30
Figure 1. Mixed model output estimating energy intake with selected patient
characteristics (see text) and diet energy density (grand mean centered) as
predictors. Overall (thick line) and individual (thin lines) estimated energy intake
Day of dietary recording was negatively associated with EI in the mixed
model (P < 0.02). Each successive day were associated with approximately
1% lower EI. In addition, there was a repeated effect with covariance of EI
between days (P < 0.001), indicating a positive dependence between days (r
= 0.19, P = 0.003).
Individual slopes (random effects) for ED were significant (P < 0.001),
indicating that there was individual variation in the responses in EI for a
change in ED that were different from the overall group response (fixed
effect). Mixed model output illustrating the estimated individual variation in
EI and the overall and individual EI:ED relationship is presented in Figure 1.
Individual slopes for ED (subtracting group mean estimates) were negatively
correlated with age and fatigue (r = -0.16 and -0.16, respectively, P < 0.013)
and positively correlated with hypermetabolism (r = 0.16, P < 0.014) but not
with any other patient characteristic. Individual slopes were positively
correlated with EI, food intake (g) and beverage intake (g) (r = 0.30, 0.27 and

Ola Wallengren
31
0.15 respectively, P < 0.02). There was also individual variation in EI that
could not be accounted for in the present model as indicated by significant
individual (random) intercepts (P < 0.001). Individual intercepts (i.e. EI)
were negatively correlated with a high proportion of protein (E%) and fiber
(W%) in the diet (r = -0.23 and -0.21, respectively, P < 0.001). EI were
positively correlated with a high proportion of beverages (r = 0.28, P <
0.001), both with and without energy (r = 0.18 and 0.16, respectively, P <
0.013).
Data from 107 patients who were followed through 164 periods was available
to model four measurement periods over the 16 months before the final
follow-up. An ESR value greater than 20 and tertiles of survival were the best
predictors of energy balance, and these were consequently used in models to
adjust for inflammatory status and survival. Missing data meant that 97
patients who were followed through 145 periods remained in models adjusted
for survival and inflammatory status. The mean energy balances were -126 ±
250, -25 ± 237, 118 ± 239 and 85 ± 123 kcal/day for measurement periods 1
to 4, respectively.
In an unadjusted model, the EDfood and EI were positive predictors of energy
balance (P < 0.03). A 1-SD increase in ED and EI increased energy balance
by 38 and 41 kcal/day, respectively. The total diet ED did not predict energy
balance (P > 0.05). Survival was positively (P < 0.001) and inflammatory
status (measured as ESR > 20) was negatively (-98 kcal/day, P = 0.005)
associated with energy balance over the following 4 months. The estimated
energy balance for tertiles of survival from 1st to 3
rd were -180 ± 31, -23 ± 30
and 5 ± 23 kcal/day (mean ± SEM), respectively (Figure 2). Only EI
remained a significant predictor of energy balance after adjustment for
survival and inflammatory status. Patients with inflammation had a lower EI
relative to BW (-9%, P = 0.04) while the EI was not significantly different (-
8%, P = 0.07). ED (-9%, P = 0.02) and EDfood (-8%, P = 0.01) were both
significantly lower. There were no differences in macronutrient distribution
(E%) or water intake between groups, but fiber intake was lower in patients
with inflammation (-1.7 g/d, P = 0.04).
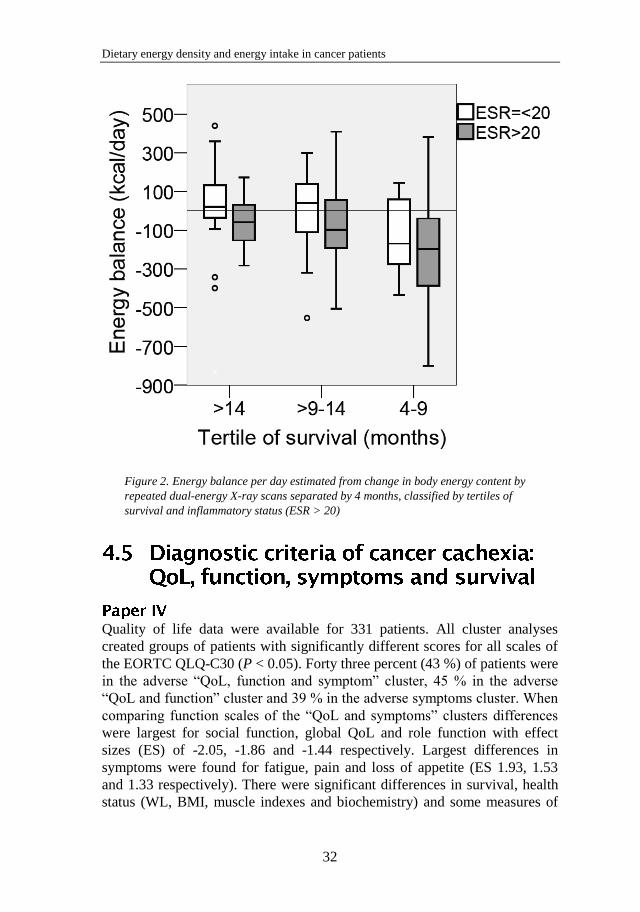
Dietary energy density and energy intake in cancer patients
32
Figure 2. Energy balance per day estimated from change in body energy content by
repeated dual-energy X-ray scans separated by 4 months, classified by tertiles of
survival and inflammatory status (ESR > 20)
Quality of life data were available for 331 patients. All cluster analyses
created groups of patients with significantly different scores for all scales of
the EORTC QLQ-C30 (P < 0.05). Forty three percent (43 %) of patients were
in the adverse “QoL, function and symptom” cluster, 45 % in the adverse
“QoL and function” cluster and 39 % in the adverse symptoms cluster. When
comparing function scales of the “QoL and symptoms” clusters differences
were largest for social function, global QoL and role function with effect
sizes (ES) of -2.05, -1.86 and -1.44 respectively. Largest differences in
symptoms were found for fatigue, pain and loss of appetite (ES 1.93, 1.53
and 1.33 respectively). There were significant differences in survival, health
status (WL, BMI, muscle indexes and biochemistry) and some measures of
Ola Wallengren
33
physical function (grip strength in women and walking distance in men) but
no difference in dietary intake between “QoL, function and symptom”
clusters.
Between clusters formed with only global QoL and function scales, the
largest differences were found for social function, role function and global
QoL (ES 2.12, 1.95 and 1.92 respectively), with differences in symptoms
being less pronounced. Differences between the symptom clusters were
largest for loss of appetite and fatigue (ES 2.39 and 1.71 respectively).
Odds ratios for adverse QoL, function, symptoms and short walking distance,
classified by different diagnostic criteria for cachexia are shown in Table 7.
In the stepwise forward logistic regression model with all diagnostic criteria
as possible predictors for an adverse outcome 162 patients were available for
analysis. Low handgrip strength (lowest tertile), fatigue > 3 (10 point scale)
and CRP>10 (mg/L) were associated with being in the adverse “QoL,
function and symptoms” cluster (P < 0.05). The same three predictors with
the addition of WL > 5% remained in the model with adverse “QoL and
function” cluster as outcome (P < 0.05). Weight loss > 10%, fatigue > 3,
protein intake < 1.2 (g/kg/day) and hemoglobin <120 (g/L) were significant
predictors of being in the cluster with more symptoms (P < 0.02). In the
stepwise model with walking distance less than average as outcome, fatigue >
3 and ESR > 20 (mm/h) were associated with shorter walking distance (n =
168, P < 0.001).
There were 6 censored observations in the survival analyses. Hazard ratios
from the Cox proportional hazards model with each diagnostic criterion as
predictor and median survival for each classification are shown in Table 8.
None of the dietary variables were significant predictors of survival (data not
shown).
In the stepwise Cox regression model with all diagnostic criteria as possible
predictors for survival, 202 patients were available for analysis. Low
handgrip strength, fatigue > 3 (1-10 scale), Karnofsky performance score <80
and CRP>15 (mg/L) were prognostic of shorter survival (P < 0.03).
Based on the results from the logistic and Cox regressions an alternative 3-
factor diagnostic criterion was constructed: WL >2%, Fatigue >3 (1-10 scale)
and CRP > 10 mg/L (Table 7 and 8).
Dietary energy density and energy intake in cancer patients
34
When excluding patients with less than 3 months survival, odds ratios for
having an adverse outcome decreased for all cachexia definitions except for
those of Fearon et al. 2006 [4]. In survival analysis only the 2 of 3 factor
definition of Fearon et al. 2006 [4] and our own alternative 3-factor
definition remained significant predictors of survival, with hazard ratios of
1.4 and 1.6 respectively (P < 0.004). The prevalence of a diagnosis of
cachexia decreased when excluding patients with less than 3 months survival;
to 6 % (3-factor, Fearon et al. 2006), 38 % (2 of 3-factors, Fearon et al.
2006), 28 % (Evans et al. 2008), 82 % (Fearon et al. 2011) and 26 % (our 3-
factor alternative), respectively.

Ola Wallengren
35
Table 7. Odds ratio for adverse QoL, function, symptoms and walking distance in patients with advanced cancer (n = 405), classified by different diagnostic criteria for cachexia.
Odds ratio for adverse outcomea
Qo
L a
nd
Sy
mp
tom
s
Qo
L
Sy
mp
tom
s
Sh
ort
wal
kin
g
dis
tan
ce
Pre
val
ence
(%
)
Mis
sin
g (
%)
BMI < 20 2,9 2,7 2,6 21 0 BMI < 20 and weight loss > 2% 2,8 2,6 2,5 20 0 Weight loss > 2% 2,1 2,1 1,9 77 0 Weight loss > 5% 1,7 1,8 2,0 67 0 Weight loss > 10% 1,8 1,9 1,9 46 0 Walking distance less than average 2,3 2,2 3,3 - 58 25 Handgrip strength in lowest tertile 2,5 2,3 2,2 2,7 35 31 Fatigue < 3 (1 to 10 scale) 4,0 4,5 4,0 3,3 63 28 Karnofsky performance Score < 80 3,4 2,7 3,6 17 28 EI < 20 (kcal/kg/day) 28 21 EI < 1500 (kcal/day) 2,3 2,0 39 21 EI less than average (1756 kcal/day) 1,9 3,1 53 21 Protein intake < 1.2 (g/kg) 2,0 69 21 ED less than average 49 21 Low AMC 2,3 1,9 2,1 15 1 Low ASMI 2,0 2,1 1,8 2,0 67 4 Low muscle mass 1,8 2,0 2,0 66 0 CRP > 5 (mg/L) 2,1 2,3 2,6 3,9 74 2 CRP > 10 (mg/L) 3,1 3,6 2,4 3,6 59 2 CRP > 15 (mg/L) 3,0 3,0 2,4 3,1 49 2 ESR > 20 (mm/h) 1,7 2,0 1,7 4,2 70 7 ESR > 30 (mm/h) 1,7 1,7 1,6 3,2 50 7 S-Albumin < 32 (g/L) 1,9 2,2 1,7 3,2 30 2 Hemoglobin < 120 (g/L) 1,7 1,6 2,1 1,9 48 0 Cachexia all 3 factors (Fearon 2006) 5,3 4,4 5,1 3,5 12 22 Cachexia 2 of 3 factors (Fearon 2006) 2,1 2,6 2,6 2,1 45 22 Cachexia (Evans 2008) 2,3 2,3 3,1 3,1 33 33 Cachexia (Fearon 2011) 2,6 3,4 2,2 85 0 Cachexia (WL>2%, Fatigue>3, CRP>10) 2,5 3,2 2,6 4,2 37 30
aOnly statistically significant odds ratios are shown (P < 0.05). Abbreviations: AMC, mid-arm muscle circumference; ASMI, appendicular muscle mass index; CRP, C-reactive protein; ED, diet energy density; EI, energy intake; ESR, Erythrocyte sedimentation rate; WL,
weight loss.

Dietary energy density and energy intake in cancer patients
36
Table 8. Table 4. Survival analysis with Cox-proportional hazards model in patients with advanced cancer (n = 405), classified by different diagnostic criteria for cachexia.
Median survival (days)
Diagnostic criteria
Diagnostic criteria Hazard ratioa Negative Positive Difference
BMI < 20
BMI < 20 and weight loss > 2%
Weight loss > 2% 1,4 251 146 -105
Weight loss > 5% 1,3 243 147 -96
Weight loss > 10% 1,2 203 133 -70
Walking distance less than average 1,3 240 146 -94
Handgrip strength in lowest tertile
Fatigue < 3 (1 to 10 scale) 1,6 249 131 -118
Karnofsky performance Score < 80 1,5 182 101 -81
Low AMC 1,3 183 128 -55
Low ASMI
Low muscle mass
CRP > 5 mg/L 1,8 290 138 -152
CRP > 10 mg/L 2,2 291 120 -171
CRP > 15 mg/L 2,3 255 110 -145
ESR > 20 1,6 257 149 -108
ESR > 30 1,7 241 135 -106
S-Albumin < 32g/L 2,0 224 107 -117
Hb < 120g/L 1,4 236 135 -101
Adverse QoL and Symptoms 1,6 249 120 -129
Adverse QoL 1,6 253 126 -127
More Symptoms 1,6 244 120 -124
Cachexia all 3 factors (Fearon 2006) 2,2 202 85 -117
Cachexia 2 of 3 factors (Fearon 2006) 1,7 252 126 -126
Cachexia (Evans 2008) 1,4 197 115 -82
Cachexia (Fearon 2011) 1,3 249 157 -92
Cachexia (WL>2%, Fatigue>3, CRP>10) 2,1 240 91 -149
aOnly statistically significant hazard ratios are shown (P < 0.05).
Abbreviations: AMC, mid-arm muscle circumference; ASMI, appendicular muscle mass
index; CRP, C-reactive protein; ESR, Erythrocyte sedimentation rate; QoL, quality of life;
WL, weight loss.
Ola Wallengren
37
The present studies are the first attempt to examine dietary ED and its
relation to EI in cancer patients using both a between- and within-subject
analysis. Energy density of the diet was associated with EI in all analyses.
Paper III is the first examination of EI and dietary ED and their relationships
with energy balance in cancer patients. As expected, EI was positively
associated with energy balance; however, only EDfood was associated with
energy balance. These results support current dietary practice recommending
an energy-dense diet to cachectic cancer patients.
When we applied several popularly used criteria for cancer cachexia we
found that WL, fatigue and markers of systemic inflammation were most
strongly and consistently associated with adverse QoL, reduced functional
abilities, more symptoms and shorter survival, which support that these are
among the key features that should be assessed to characterize a patient with
cachexia.
Patients included in this thesis were an unselected and heterogeneous group
of cancer patients referred to a palliative care program. A majority of patients
had gastrointestinal cancers (89%). Accordingly, the results may not be
representative or generalizable to other groups of cancer patients, who may
have a different etiology of anorexia and cachexia. We found differences in
CRP and survival among tumor types. In the mixed models, both survival and
signs of inflammation were used as covariates which would adjust for
differences among tumor types. In paper II we entered tumor type as a
covariate and it was not significant.
Interventions included anti-inflammatory treatment with indomethacin, of
anemia with erythropoietin, insulin, dietary counseling and nutritional
support [20-23]. The effects of concomitant anti-inflammatory treatment
should consequently be considered when evaluating our results. More than
90% of patients were being treated with indomethacin in the analysis of
energy balance (paper III). Therefore we chose to adjust for signs of
inflammation per se, rather than its treatment to assess the effects of
inflammation. However, we cannot infer that dietary diaries precisely reflect
Dietary energy density and energy intake in cancer patients
38
the actual eating behavior of advanced cancer patients without anti-
inflammatory treatment or that there are no differences in eating behavior
between patients with different tumor types. Results in the longitudinal
follow-ups do not reflect alterations during disease progression that were
fully spontaneous: they present an integrative view over time, according to
the evidenced-based treatment offered.
In the intervention studies emphasis in dietary intake was on energy and
macronutrients [20-23]. Consequently, when FRs were returned and checked
for incomplete recordings energy-free beverages were not specifically asked
for, which may have increased underreporting. Underreporting of energy-free
beverages between days or between patients will affect the calculated ED and
consequently the estimated relationship between ED of the total diet and EI.
Inclusion of energy free-beverages when calculating ED would be expected
to decrease the association between ED and EI if under reporting were
substantial. In contrast, the inclusion of energy free beverages increased the
association between ED and EI (comparing ED1 to ED2, table 6) and
consequently does not support that there were substantial under reporting of
energy free beverages. Energy and water intake varied widely between
subjects; however, it is not possible to classify patients as under or over
reporters using cut-off values from healthy populations in this sample of
unselected palliative care cancer patients with ongoing WL. An alternative
approach was used in paper II where patients were excluded if EIs were
outside of ±3SD.
Energy intake in relation to BW decreased with increasing BMI in the present
study. This could be due to underreporting in people with higher BMI‟s,
assuming that physical activity levels were the same across the BMI range.
This is a common phenomenon in dietary surveys [135], but one we didn‟t
expect to find in this population of weight losing cancer patients. Analysis of
urinary nitrogen did not indicate underreporting of protein intake in a sub
sample of our patients but there could still be underreporting of non-protein
rich foods. Dietary protein intake estimated from urine nitrogen were on the
contrary 4.5 g/day lower (P = 0.15) than estimated intake from FRs even
after accounting for incomplete collection of urine according to the method of
Bingham and Cummings [134]. Estimates were also not significantly
different stratifying by overweight status. However, there was a trend of FRs
to overestimate protein intake at lower intakes and underestimate at higher
intakes (r = -0.58, P < 0.001) which may support that there were systematic
over- and underreporting at low and high BMI‟s respectively. Since urine
was only collected for only 24h during the 4-days of FR this correlation

Ola Wallengren
39
could arise by regression to the mean, which would be expected to some
degree. The limited number of patients with urine collections prevents any
definite conclusions regarding urinary nitrogen and dietary reporting.
The association with decreasing EI with higher BMI‟s may also be due to
high EI in patients with low BMI attempting to counteract WL. In a
systematic review Blum et al. found that reported EI related unreliably to WL
which, given our results, to some degree could be due to confounding by
BMI [5]. Yet another explanation may be that subjects with higher BMI have
a higher proportion of adipose tissue to lean body mass and thus lower
energy expenditure per kg [136]. BMI or body composition may therefore be
important covariates to consider when assessing dietary adequacy from
dietary records also in patients with advanced cancer.
It is inherently difficult to study the association between two variables when
they are mathematically related, as in the case of EI and ED (i.e. kcal and
kcal/g). The variables X and X/Y will be correlated even if X and Y are
random numbers. Consequently, diet ED and EI are expected to be
correlated. However, in the presence of human EI regulation, EI and ED
would not be correlated if any change in diet ED were precisely compensated
by a reciprocal change in amount of food eaten to reach a specific EI. This
would constitute perfect EI regulation. On the other hand, if people would eat
the same amount of food (by weight) every day, then EI would be precisely
dependent on diet ED and the two would be perfectly correlated with no
apparent EI regulation. It is also possible, however, that humans choose more
energy-dense foods when energy demands increase or vice versa, although
evidence for this is largely lacking [137-139]. In that case ED will be
correlated with EI even in the presence of perfect EI regulation.
Any correlation between EI and ED in these scenarios would thus represent
the uncompensated or “true” relation between EI and ED and any
measurement error in either variable would obscure this relationship.
However, the direction of causality cannot be established.
The cross-sectional design, the short period of dietary recording in the
analysis of day-to-day variation and a possible impact of dietary misreporting
limit the conclusions that can be drawn. Increased number of days of dietary
recording would be preferable but are in our opinion not feasible in this
patient group.

Dietary energy density and energy intake in cancer patients
40
Strengths include the use of a multivariate mixed linear model, which
correctly models non-independent hierarchical data with repeated measures,
in a large sample of patients with advanced cancer. This allowed for a better
estimate of the impact of diet ED on EI while accounting for between subject
differences.
The inclusion of exercise and non-exercise energy expenditure (apart from
REE) in the models might explain part of the unexplained variance in EI and
energy balance. Since these variables were not measured, this precludes us
from making any conclusions of their impact on these relationships.
Strengths also include the high precision with which energy balance was
measured and the longitudinal follow-up. However, the reliability of
estimates of the impact of ED and EI on energy balance are limited by
imprecision in the measure of food intake and by the low number of patients
in that analysis. The requirement for several body composition measurements
separated by 4 months limited the number of patients from the cohort that
could be included in the analysis.
Strengths in the analysis of different diagnostic criteria and adverse outcomes
include the large number of diagnostic variables measured with appropriate
methods simultaneously in a relatively large sample of patients with
advanced cancer. The use of cluster analysis that clearly separated patients
with adverse QoL, function and symptoms may also be considered a strength
of this analysis.
Limitations include the number of missing values in some of the variables,
which reduced the number of patients available for multi-factor and
multivariate analysis. Missing measures is a reality in care of patients with
advanced cancer, diagnostic measures should therefore be accessible and
easy to perform in routine care [1].
Where methods of ED calculation are comparable, the observed dietary ED
in this study is close to the observed ED in larger community studies in the
U.S. and Spain in healthy populations of similar age, so it appears that the
diet ED in this group of cancer patients does not differ much from what has
been observed in healthy populations [16, 17, 140].
Ola Wallengren
41
Dietary energy density was associated with EI regardless of calculation
method and both in a between- and within-person analysis. The ED of food
predicted energy balance, but the association was not significant when
systemic inflammation was considered. Overall, the results were in
accordance with findings in elderly, healthy and overweight free-living
people in both experimental and observational studies [15-17, 19, 87, 89-92,
141].
The results from paper I indicated that the method used when calculating ED
had little impact on the association between ED and different measures of EI
(absolute, per kgBW and EI/REE). In relation to absolute EI and per kg BW
the exclusion of all beverages except milk (ED3) gave the highest
determination coefficient (R2) and overall ED3 seemed to be the best measure
(Table 6). It is interesting that the inclusion of non-energy containing
beverages increases the association between ED and EI compared to ED
calculated including energy containing beverages only (ED2); this in part
contradicts earlier research on healthy subjects that non-energy beverages
does not influence EI [19, 97, 99, 142]. This could indicate that in cancer
patients with limited dietary intake, the total volume of food and drinks is a
limiting factor in respect to EI. Stomach filling has indeed been suggested to
partially mediate the influence of ED on food intake even in healthy subjects
[143]. In the mixed model energy free beverages were positively correlated
with EI which would seem contradictory. However, the positive association
could arise if patients with a limited food intake reduced their intake of
beverages, supposedly to reduce food volume. Alternatively, patients with
low intakes may underreport their beverage intake.
In our longitudinal analysis, ED of solid food (including milk) was positively
associated with long-term energy balance in an unadjusted model. This
association persisted; indeed it increased, after adjustment for survival. In
contrast, total ED of the diet were not associated with energy balance in any
model. This suggests that it is EDfood that affects EI and ultimately energy
balance in cancer patients with limited food intake. This result agrees with
those of studies in healthy subjects, where EDfood is associated with long-term
energy balance and the association depend on whether water and less
energy-dense drinks are included in the calculation [87]. Accordingly, the
effect of the ED of food and energy from beverages should be separated in
future analyses.

Dietary energy density and energy intake in cancer patients
42
Our results imply that diet ED and in particular EDfood affects EI and energy
balance to some degree, which supports current dietary practice. If there is no
compensatory change in the amount of food, then an ED that is 1 SD higher
(an increase of approximately 16-25%) would correspond to an increase in EI
of approximately 350-450 kcal. Some compensation is, however, expected.
ED was negatively associated with the amount of food ingested (food weight)
which indicate EI compensation. The effect of increased ED would thus be
compensated for by a smaller portion size or reduced meal frequency.
Consequently, an increase in EDfood of 1 SD was correlated in this patient
group with an increase in EI of approximately 190 kcal (10%). A
compensatory change in total energy expenditure may be expected in cancer
patients during semi-starvation, mainly due to changes in the level of
physical activity [36]. Consequently, only a minor part of a change in EI is
reflected in the energy balance. Our results, showing that an increase in ED
of 1 SD is associated with an increase in energy balance of approximately 40-
50 kcal/day, support this.
Average daily EI decreased during days of dietary recording. This could be
an effect of dietary recording in itself (wear-out effect) or an initial effort to
increase dietary intake that could not be upheld across the recording period,
i.e. EI compensation between days, albeit at low levels of EI. The repeated
measures covariance indicates dependence between days which could be due
to EI regulation but the positive correlation indicates clustering of high or
low EI, possibly due to disease symptoms, environmental or social
circumstances [63, 144]. In healthy subjects de Castro reported a 2 to 3 day
lag in EI compensation [145]. If the same applies to our patient sample our
results would indicate EI regulation between days to some degree.
Lowering the water content of food while increasing the fat content is the
most effective way of increasing dietary ED. Increasing the ED by 25%
would require a decrease in water content of ~5% and an increase in fat
content of ~10 E%. For example, substituting boiled potatoes for pan-fried
potatoes would increase the ED by 43%, and substituting natural yoghurt
with 3% fat for yoghurt sweetened by sugar and having a fat content of 7%
would increase the ED by 215%. Thus, exchanging several foods and
beverages for corresponding energy-dense options could increase diet ED
substantially.
Diets rich in protein (E%) and fiber (W%) were associated with lower EIs
even after accounting for their influence on ED. This could possibly be
Ola Wallengren
43
explained by the higher satiating properties of protein and fiber, which have
been documented in healthy and obese [146, 147] and may consequently also
apply to cancer patients. Recommending less energy-dense fiber rich foods to
weight losing patients is counterintuitive and our results also support this.
The importance of an adequate protein intake in disease related malnutrition
is well established and high-protein supplements have been shown to produce
clinical benefits, including increased EI and weight gain [103]. High-protein
diets should therefore be recommended despite that such diets supposedly are
more satiating. Rather, different protein sources should be explored for their
anabolic, anti-catabolic and satiating properties to optimize their effect in
different disease states [148, 149].
The inclusion of between-subject covariates did not substantially impact the
positive association between EI and ED. This implies that diet ED is likely to
be an important factor when attempts are made to increase EI in
malnourished cancer patients with a limited capacity of food intake, similarly
to what has been found in elderly [89-91].
In this group of cancer patients there were individual variations in the
responses in EI for a change in ED that were different from the overall group
response. Specifically, age and fatigue were associated with lower EI and
with flatter ED:EI slopes. There was also a positive association between EI
and individual ED:EI slopes, which means that patients with low EIs have
flatter ED:EI slopes. This implies that some patients could be less likely to
respond favorably to an increase in diet ED, particularly the elderly and
fatigued with low EI.
The association between ED of food and energy balance was not significant
when systemic inflammation was considered. Patients with an ESR > 20 had
lower dietary ED, EI and fiber intake than other patients, while the amount of
food and degree of hypermetabolism were similar. While causality cannot be
inferred, the results imply that ingestive behavior and choice of food change
in the presence of systemic inflammation, which leads to a lower EI and
negative energy balance. However, systemic inflammation (CRP > 5 mg/L)
was not significant in the mixed model predicting EI and were also not
correlated with the individual EI:ED slopes. This could partly be explained
by the possible impact of inflammation on fatigue and hypermetabolism and
their association with EI, explaining more of the variance in EI than the
dichotomized marker of inflammation alone. More importantly regarding the
Dietary energy density and energy intake in cancer patients
44
association between EI and ED is the fact that individual EI:ED slopes were
not associated with systemic inflammation. Thus, while EI and ED may be
low in patients with inflammation the positive association between EI and
ED may still be the same as in patients without.
Energy balance became more negative during the final 5 months of life, and
patients with inflammation differed from those without, especially in patients
with longer survival (2nd
and 3rd
tertiles) (Figure 1). Our results thus highlight
the importance of targeting systemic inflammation in the prevention and
treatment of cancer cachexia with nutrition support [22, 31, 43, 53, 150].
The most common measure of systemic inflammation in cancer patients has
been the level of CRP. Interestingly, we found ESR > 20 to be the
inflammatory marker that was most closely associated with energy balance.
ESR may reflect more accurately a long-standing inflammatory state, while
CRP is more sensitive to acute changes, such as incidental infection.
However, CRP with a cut-off of 10 mg/L seemed to be the best predictor of
adverse QoL, symptoms and shorter survival, although differences between
the cut-off levels were small. Our results support that serum CRP level is a
useful marker of systemic inflammation and a key feature of cancer cachexia
[1]. However, both markers, at different cut-off levels, reflect essentially the
same influence on the associations studied, and the limited number of
patients precludes further conclusions.
Weight loss, fatigue and markers of systemic inflammation were the criteria
for cancer cachexia that were most strongly and consistently associated with
adverse QoL, reduced functional abilities, more symptoms and shorter
survival. All cachexia definitions used were associated with adverse
outcomes and prognostic of survival.
The use of cluster analysis to separate patients with adverse QoL, function
and symptoms worked well and large clinically meaningful differences were
found in most scales of the EORTC QLQ-C30 [151]. Between the “QoL,
function and symptoms” clusters the largest differences were found in global
QoL and all function scales, but also in pain, fatigue and appetite. Similarly,
the symptom only clusters weighed heavily on loss of appetite and fatigue,
which suggests that the two are related. In agreement with a meta-analysis of
studies using the EORTC QLQ-C30 all of the clusters with adverse outcomes

Ola Wallengren
45
were associated with shorter survival [64]. Our results support that patient-
reported functional and psychosocial effects and symptoms are among the
key features that should be assessed to characterize a patient with cachexia
[1].
Weight loss of any degree was associated with both adverse QoL and shorter
survival and might be a better reflection of an ongoing process of negative
energy balance and progressive disease than BMI in this population. This
agrees with most previous studies showing WL to be a significant prognostic
variable for survival in advanced cancer [33].
Patients with shorter survival had substantially lower EIs and increasingly
negative energy balance. This could be expected and fits well to the
suggested classifications and stages of cancer cachexia (Figure 2) [1, 4].
Energy intake as a dichotomized predictor was not associated with survival
and was not consistently associated with adverse outcomes other than more
disease symptoms. Diet ED was not associated with any outcome. Reduced
food intake is undoubtedly one of the main features of cachexia and should
be assessed routinely [1]. In our study however, the dietary assessment with
the classification criteria used seemed to be of little prognostic value. Rather
the symptom scales of the EORTC QLQ-C30 that capture some of the
underlying causes of reduced food intake, such as loss of appetite, nausea,
diarrhea, constipation and fatigue appeared to be of better prognostic value.
These results question the validity of using FRs as a diagnostic criterion. In
paper III on the other hand, EI as a continuous predictor was associated with
long term energy balance which shows that a 4-day FR has some predictive
validity of EI over the following 4 months. For energy intake to be predictive
of adverse outcomes it may be more appropriate to evaluate EI compared to
estimated expenditure on an individual basis. This is a challenging task that
may not be possible as a screening activity or in use as a diagnostic criterion.
Fearon et al. suggests in their consensus findings that the patient‟s own
estimate of overall food intake in relation to normal may be used to assess
food intake [1] which, given our results, seems like a more appropriate
option.
The prevalence of a diagnosis of cancer cachexia varied widely according to
the definition used (Table 3). In one end of the spectrum was the 3-factor
definition of Fearon et al. [28] with prevalence of 12 % and in the other the
consensus definition of Fearon et al. [1] with prevalence of 85 %. The former
included patients with more advanced cachexia which was strongly
associated with adverse QoL, symptoms and a median survival of less than 3
months and as such may already entered a state of refractory cachexia. The

Dietary energy density and energy intake in cancer patients
46
more inclusive consensus definition [1] was also associated with adverse
QoL and symptoms but not with a shorter walking distance. In these patients
with less of a functional decline and a longer survival, anti-cachectic
treatment may be timely and efficient. Main determinants for a cachexia
diagnosis according to the consensus definition [1] were the high prevalence
of WL > 5% (67 %) and low muscle mass (66%) together with WL > 2% (77
%), while BMI < 20 contributed marginally (Table 8).

Ola Wallengren
47
We found a positive association between diet ED and EI in palliative care
cancer patients.
Age, BMI, fatigue, survival and hypermetabolism are associated with EI, but
do not substantially influence the association between ED and EI. However,
individual variation in response implies that some patients could be less
likely to respond positively to an increase in dietary ED, particularly the
elderly and fatigued with low EI.
The energy intake and ED of the food consumed are associated with energy
balance in patients with advanced cancer. This conclusion justifies current
dietary practice and encourages future dietary interventions. Our results
suggest also that the associations of EI and ED with energy balance are
influenced by systemic inflammation. Thus, targeting systemic inflammation
may be important in nutritional interventions in this patient group.
ED of solid food (including milk) was positively associated with long-term
energy balance. In contrast, total ED of the diet were not associated with
energy balance. This suggests that it is EDfood that affects EI and ultimately
energy balance in cancer patients with limited food intake. Accordingly, the
effect of the ED of food and energy from beverages should be separated in
future analyses.
Weight loss, fatigue and markers of systemic inflammation were the criteria
for cancer cachexia that were most strongly and consistently associated with
adverse QoL, reduced functional abilities, more symptoms and shorter
survival. All the cachexia definitions used were associated with adverse
outcomes and prognostic of survival, but the prevalence of cachexia using
criteria of the different definitions varied widely; especially in patients with
more than three months survival – from 6 to 82 per cent – indicating a need
to further explore and validate diagnostic criteria for cancer cachexia.

Dietary energy density and energy intake in cancer patients
48
Additional studies are required to understand the impact of energy-dense
diets in cancer patients on both EI and energy balance. The impact of diet ED
should be confirmed in additional longitudinal follow-ups or preferably in
dietary interventions. In future studies, the effect and degree of compensation
in dietary intake when dietary characteristics that influence ED change
should be monitored. Such studies should also pay attention to the effects of
ED in solid food as well as the impact of energy containing and energy free
beverages. In addition, possible subject characteristics (age, BMI, physical
activity level, inflammatory status, stage of disease and cachexia) and
nutrition impact symptoms (fatigue, appetite loss, pain and gastrointestinal
symptoms) that may influence this relationship should be considered.
To further explore and validate different diagnostic criteria in the diagnosis of
cancer cachexia we suggest for future research that several different cut-off
values be used for the main features of cachexia, similarly to the approach in
this thesis. The diagnostic criteria and classification of the cachexia stages
need further validation to better select patients with high enough sensitivity
and specificity for interventions that are clinically relevant and tailored for
the specific stages: precachexia, cachexia and refractory cachexia [1, 2].
Generally applicable diagnostic criteria would be valuable but clearly there
are populations that may need specific modification. Definite cut-offs for the
criteria that relate optimally to patient centered outcomes could be developed
from large contemporary datasets [1].
Cancer cachexia is by definition a multifactorial syndrome and as such
requires a solution that is multidimensional. It is self-evident that optimal
oncological management must be achieved to get the best response of anti-
cachexia therapy. The development of cachexia is complex and involves a
number of partly interrelated factors. Therefore, the best supportive care for
cancer cachexia remains unresolved. Any single therapy is unlikely to be
fully successful and combination therapies are at present the most logical and
promising solution [1, 9, 10, 26, 37].
There are principally two main domains of cachexia therapy; reduced food
intake and metabolic disturbances [8-10, 37]. Nutrition support, including
dietary counseling, ONS and artificial nutrition as appropriate, possibly
together with appetite stimulants will support nutritional intake [11, 20, 60-
62, 68]. Optimal management of nutrition impact symptoms is also key

Ola Wallengren
49
factors that need to be addressed to support food intake and also improve
QoL[26, 63].
Anti-inflammatory treatment to modify the host-tumor response together with
anabolic and anti-catabolic therapies can reduce the metabolic disturbances
and possibly restore the impaired appetite and anabolic response to nutrition
and exercise [8, 10, 37, 45, 51, 60]. Anemia therapy and exercise could
further improve fatigue and physical activity [73, 152]. These combination
therapies could thus result in improvement of important patient centered
outcomes such as physical activity, function, QoL and survival. It is clear
however that further study is needed to determine the most effective mode of
treatment.

Dietary energy density and energy intake in cancer patients
50
Först och främst vill jag rikta ett stort tack till min handledare professor
Ingvar Bosaeus som med stort engagemang, entusiasm, tålamod och inte
minst kunskap har hjälpt och stöttat mig genom forskarutbildningen. Ett
bestående minne kommer vara hur roligt det har varit på vägen, när idéer och
frågor bollats fram och tillbaka och motgångar har vänts till nya uppslag och
utmaningar.
Till professor Kent Lundholm, medförfattare och upphovsman till
cancerkakexistudierna som ligger till grund för denna avhandling. Tack för
att du gjort all denna forskning möjlig och för dina mycket värdefulla
kunskaper och synpunkter på mina arbeten.
Till Elisabet Rothenberg och Petra Sixt vill jag rikta ett tack för att de som
min närmaste chef givit mig möjlighet och stöd att genomföra denna
forskning.
Jag vill även tacka alla mina arbetskamrater och kollegor på klinisk
nutrition Sahlgrenska som träffat patienterna i studierna, räknat på alla
kostdagböcker och gjort kroppssammansättningsmätningar.
Tack till docent Lars Ellegård för givande och värde fulla diskussioner.
Ett stort tack till all personal på Avdelningen för övre gastrointestinal kirurgi
och kirurgmottagningen Sahlgrenska som gjort en stor insats för dessa
patienter och bidragit till insamlandet av data till dessa studier. Ett speciellt
tack till forskningssjuksökterska Ulla Körner för gott sammarbete.
För hjälp med statistiken vill jag tacka Staffan Nilsson, Malin Östensson
och Marita Olsson.
Tack till FoU-rådet i Göteborg och södra Bohuslän och ALF som
ekonomiskt stöttat arbetet med denna avhandling.
Slutligen vill jag rikta en tanke och tacksamhet till alla patienter och
stöttande anhöriga som osjälviskt och tappert medverkat i dessa studier trots
ibland svåra omständigheter. Genom att fylla i många formulär och genomgå
flertalet medicinska tester har de bidragit och gjort den här forskningen
möjlig.

51
1. Fearon, K., et al., Definition and classification of cancer cachexia: an
international consensus. Lancet Oncol, 2011. 12(5): p. 489-95.
2. Macdonald, N., Terminology in cancer cachexia: importance and status.
Curr Opin Clin Nutr Metab Care, 2012. 15(3): p. 220-5.
3. Evans, W.J., et al., Cachexia: a new definition. Clin Nutr, 2008. 27(6): p.
793-9.
4. Fearon, K.C., A.C. Voss, and D.S. Hustead, Definition of cancer cachexia:
effect of weight loss, reduced food intake, and systemic inflammation on
functional status and prognosis. Am J Clin Nutr, 2006. 83(6): p. 1345-50.
5. Blum, D., et al., Cancer cachexia: A systematic literature review of items
and domains associated with involuntary weight loss in cancer. Crit Rev
Oncol Hematol, 2011.
6. Bozzetti, F. and L. Mariani, Defining and Classifying Cancer Cachexia: A
Proposal by the SCRINIO Working Group. Journal of Parenteral and Enteral
Nutrition, 2009. 33(4): p. 361-367.
7. Thoresen, L., et al., Nutritional status, cachexia and survival in patients
with advanced colorectal carcinoma. Different assessment criteria for
nutritional status provide unequal results. Clin Nutr, 2012.
8. Argiles, J.M., F.J. Lopez-Soriano, and S. Busquets, Mechanisms and
treatment of cancer cachexia. Nutr Metab Cardiovasc Dis, 2012.
9. Bosaeus, I., Nutritional support in multimodal therapy for cancer cachexia.
Support Care Cancer, 2008. 16(5): p. 447-51.
10. Fearon, K.C., Cancer cachexia: developing multimodal therapy for a
multidimensional problem. Eur J Cancer, 2008. 44(8): p. 1124-32.
11. Stratton, R.J., C.J. Green, and M. Elia, Disease-related Malnutrition: An
Evidenced based Approach to Treatment.2003, Wallingford, Oxon.: CABI
Publishing.
12. van Bokhorst-de van der Schueren, M.A., Nutritional support strategies for
malnourished cancer patients. Eur J Oncol Nurs, 2005. 9 Suppl 2: p. S74-
83.
13. Hopkinson, J.B., I. Okamoto, and J.M. Addington-Hall, What to eat when
off treatment and living with involuntary weight loss and cancer: a
systematic search and narrative review. Support Care Cancer, 2011. 19(1):
p. 1-17.
14. Silver, H.J., Oral strategies to supplement older adults' dietary intakes:
comparing the evidence. Nutr Rev, 2009. 67(1): p. 21-31.
15. de Castro, J.M., Dietary energy density is associated with increased intake
in free-living humans. J Nutr, 2004. 134(2): p. 335-41.
16. Kant, A.K. and B.I. Graubard, Energy density of diets reported by American
adults: association with food group intake, nutrient intake, and body weight.
Int J Obes (Lond), 2005. 29(8): p. 950-6.

Dietary energy density and energy intake in cancer patients
52
17. Ledikwe, J.H., et al., Dietary energy density is associated with energy intake
and weight status in US adults. Am J Clin Nutr, 2006. 83(6): p. 1362-8.
18. Rolls, B.J., The relationship between dietary energy density and energy
intake. Physiol Behav, 2009. 97(5): p. 609-15.
19. Stubbs, J., S. Ferres, and G. Horgan, Energy density of foods: effects on
energy intake. Crit Rev Food Sci Nutr, 2000. 40(6): p. 481-515.
20. Lundholm, K., et al., Palliative nutritional intervention in addition to
cyclooxygenase and erythropoietin treatment for patients with malignant
disease: Effects on survival, metabolism, and function. Cancer, 2004.
100(9): p. 1967-77.
21. Lindholm, E., et al., Effects of recombinant erythropoietin in palliative
treatment of unselected cancer patients. Clin Cancer Res, 2004. 10(20): p.
6855-64.
22. Lundholm, K., et al., Evidence that long-term COX-treatment improves
energy homeostasis and body composition in cancer patients with
progressive cachexia. Int J Oncol, 2004. 24(3): p. 505-12.
23. Lundholm, K., et al., Insulin treatment in cancer cachexia: effects on
survival, metabolism, and physical functioning. Clin Cancer Res, 2007.
13(9): p. 2699-706.
24. Socialstyrelsen, Cancer incidence in Sweden 2010. Cancer incidence in
Sweden, ed. A. Åberg2011: Socialstyrelsen. 100.
25. Socialstyrelsen, Cancer i siffror 2009. Johansson, E2009: Socialstyrelsen.
60.
26. Baracos, V.E., Cancer-associated cachexia and underlying biological
mechanisms. Annu Rev Nutr, 2006. 26: p. 435-61.
27. WHO, W.H.O. Definition of Palliative Care. [Web page] 2012 [cited 2012
18 september]; Available from:
http://www.who.int/cancer/palliative/definition/en/.
28. Fearon, K.C., et al., Double-blind, placebo-controlled, randomized study of
eicosapentaenoic acid diester in patients with cancer cachexia. J Clin
Oncol, 2006. 24(21): p. 3401-7.
29. Fox, K.M., et al., Estimation of Cachexia among Cancer Patients Based on
Four Definitions. J Oncol, 2009. 2009: p. 693458.
30. Tisdale, M.J., Cancer cachexia. Curr Opin Gastroenterol, 2010. 26(2): p.
146-51.
31. Barber, M.D., Cancer cachexia and its treatment with fish-oil-enriched
nutritional supplementation. Nutrition, 2001. 17(9): p. 751-5.
32. Langer, C.J., J.P. Hoffman, and F.D. Ottery, Clinical significance of weight
loss in cancer patients: rationale for the use of anabolic agents in the
treatment of cancer-related cachexia. Nutrition, 2001. 17(1 Suppl): p. S1-
20.
33. Trajkovic-Vidakovic, M., et al., Symptoms tell it all: A systematic review of
the value of symptom assessment to predict survival in advanced cancer
patients. Critical Reviews in Oncology/Hematology, 2012(0).

53
34. Skipworth, R.J. and K.C. Fearon, The scientific rationale for optimizing
nutritional support in cancer. Eur J Gastroenterol Hepatol, 2007. 19(5): p.
371-7.
35. Elia, M., R. Stratton, and J. Stubbs, Techniques for the study of energy
balance in man. Proc Nutr Soc, 2003. 62(2): p. 529-37.
36. Hall, K.D. and V.E. Baracos, Computational modeling of cancer cachexia.
Curr Opin Clin Nutr Metab Care, 2008. 11(3): p. 214-21.
37. Fearon, K.C., The 2011 ESPEN Arvid Wretlind lecture: Cancer cachexia:
The potential impact of translational research on patient-focused outcomes.
Clin Nutr, 2012.
38. Skipworth, R.J., et al., Pathophysiology of cancer cachexia: much more
than host-tumour interaction? Clin Nutr, 2007. 26(6): p. 667-76.
39. Tisdale, M.J., Mechanisms of cancer cachexia. Physiol Rev, 2009. 89(2): p.
381-410.
40. Muscaritoli, M., et al., Muscle atrophy in aging and chronic diseases: is it
sarcopenia or cachexia? Intern Emerg Med, 2012.
41. Tsai, S., Importance of lean body mass in the oncologic patient. Nutr Clin
Pract, 2012. 27(5): p. 593-8.
42. Strasser, F., Diagnostic criteria of cachexia and their assessment: decreased
muscle strength and fatigue. Curr Opin Clin Nutr Metab Care, 2008. 11(4):
p. 417-21.
43. McMillan, D.C., Systemic inflammation, nutritional status and survival in
patients with cancer. Curr Opin Clin Nutr Metab Care, 2009. 12(3): p. 223-
6.
44. Fouladiun, M., et al., Body composition and time course changes in regional
distribution of fat and lean tissue in unselected cancer patients on palliative
care--correlations with food intake, metabolism, exercise capacity, and
hormones. Cancer, 2005. 103(10): p. 2189-98.
45. Tazi, E. and H. Errihani, Treatment of cachexia in oncology. Indian J Palliat
Care, 2010. 16(3): p. 129-37.
46. Lundholm, K., et al., Anti-inflammatory treatment may prolong survival in
undernourished patients with metastatic solid tumors. Cancer Res, 1994.
54(21): p. 5602-6.
47. McMillan, D.C., et al., A pilot study of megestrol acetate and ibuprofen in
the treatment of cachexia in gastrointestinal cancer patients. Br J Cancer,
1997. 76(6): p. 788-90.
48. Cerchietti, L.C., A.H. Navigante, and M.A. Castro, Effects of
eicosapentaenoic and docosahexaenoic n-3 fatty acids from fish oil and
preferential Cox-2 inhibition on systemic syndromes in patients with
advanced lung cancer. Nutr Cancer, 2007. 59(1): p. 14-20.
49. Mantovani, G., et al., Phase II nonrandomized study of the efficacy and
safety of COX-2 inhibitor celecoxib on patients with cancer cachexia. J Mol
Med (Berl), 2010. 88(1): p. 85-92.
Dietary energy density and energy intake in cancer patients
54
50. Dewey, A., et al., Eicosapentaenoic acid (EPA, an omega-3 fatty acid from
fish oils) for the treatment of cancer cachexia. Cochrane Database Syst Rev,
2007(1): p. CD004597.
51. Reid, J., et al., Non-steroidal anti-inflammatory drugs for the treatment of
cancer cachexia: A systematic review. Palliat Med, 2012.
52. Reid, J., et al., Thalidomide for managing cancer cachexia. Cochrane
Database Syst Rev, 2012. 4: p. CD008664.
53. Mantovani, G., et al., Randomized phase III clinical trial of five different
arms of treatment in 332 patients with cancer cachexia. Oncologist, 2010.
15(2): p. 200-11.
54. Bosaeus, I., P. Daneryd, and K. Lundholm, Dietary intake, resting energy
expenditure, weight loss and survival in cancer patients. J Nutr, 2002.
132(11 Suppl): p. 3465S-3466S.
55. Hutton, J.L., et al., Dietary patterns in patients with advanced cancer:
implications for anorexia-cachexia therapy. Am J Clin Nutr, 2006. 84(5): p.
1163-70.
56. Bosaeus, I., et al., Dietary intake and resting energy expenditure in relation
to weight loss in unselected cancer patients. Int J Cancer, 2001. 93(3): p.
380-3.
57. Ferriolli, E., et al., Physical Activity Monitoring: A Responsive and
Meaningful Patient-Centered Outcome for Surgery, Chemotherapy, or
Radiotherapy? Journal of Pain and Symptom Management, 2012. 43(6): p.
1025-1035.
58. Moses, A.W., et al., Reduced total energy expenditure and physical activity
in cachectic patients with pancreatic cancer can be modulated by an energy
and protein dense oral supplement enriched with n-3 fatty acids. Br J
Cancer, 2004. 90(5): p. 996-1002.
59. Strasser, F., et al., Comparison of orally administered cannabis extract and
delta-9-tetrahydrocannabinol in treating patients with cancer-related
anorexia-cachexia syndrome: a multicenter, phase III, randomized, double-
blind, placebo-controlled clinical trial from the Cannabis-In-Cachexia-
Study-Group. J Clin Oncol, 2006. 24(21): p. 3394-400.
60. Lundholm, K., et al., Effects by daily long term provision of ghrelin to
unselected weight-losing cancer patients: a randomized double-blind study.
Cancer, 2010. 116(8): p. 2044-52.
61. Berenstein, E.G. and Z. Ortiz, Megestrol acetate for the treatment of
anorexia-cachexia syndrome. Cochrane Database Syst Rev, 2005(2): p.
CD004310.
62. Yavuzsen, T., et al., Systematic review of the treatment of cancer-associated
anorexia and weight loss. J Clin Oncol, 2005. 23(33): p. 8500-11.
63. Kubrak, C., et al., Nutrition impact symptoms: key determinants of reduced
dietary intake, weight loss, and reduced functional capacity of patients with
head and neck cancer before treatment. Head Neck, 2010. 32(3): p. 290-
300.

55
64. Quinten, C., et al., Baseline quality of life as a prognostic indicator of
survival: a meta-analysis of individual patient data from EORTC clinical
trials. Lancet Oncol, 2009. 10(9): p. 865-71.
65. Marin Caro, M.M., A. Laviano, and C. Pichard, Nutritional intervention and
quality of life in adult oncology patients. Clin Nutr, 2007. 26(3): p. 289-301.
66. McClement, S., Cancer anorexia-cachexia syndrome: psychological effect
on the patient and family. J Wound Ostomy Continence Nurs, 2005. 32(4):
p. 264-8.
67. Fouladiun, M., et al., Daily Physical-Rest Activities in Relation to
Nutritional State, Metabolism, and Quality of Life in Cancer Patients with
Progressive Cachexia. Clinical Cancer Research, 2007. 13(21): p. 6379-
6385.
68. Baldwin, C., et al., Oral nutritional interventions in malnourished patients
with cancer: a systematic review and meta-analysis. J Natl Cancer Inst,
2012. 104(5): p. 371-85.
69. Lis, C.G., et al., Role of nutritional status in predicting quality of life
outcomes in cancer - a systematic review of the epidemiological literature.
Nutr J, 2012. 11: p. 27.
70. Wanden-Berghe, C., et al., Evaluation of quality of life related to nutritional
status. Br J Nutr, 2009. 101(7): p. 950-60.
71. Radbruch, L., et al., Fatigue in palliative care patients -- an EAPC
approach. Palliat Med, 2008. 22(1): p. 13-32.
72. Yellen, S.B., et al., Measuring fatigue and other anemia-related symptoms
with the Functional Assessment of Cancer Therapy (FACT) measurement
system. Journal of Pain and Symptom Management, 1997. 13(2): p. 63-74.
73. Payne, C., P.J. Wiffen, and S. Martin, Interventions for fatigue and weight
loss in adults with advanced progressive illness. Cochrane Database Syst
Rev, 2012. 1: p. CD008427.
74. Roila, F. and E. Cortesi, Quality of life as a primary end point in oncology.
Ann Oncol, 2001. 12 Suppl 3: p. S3-6.
75. Granda-Cameron, C., et al., Measuring patient-oriented outcomes in
palliative care: functionality and quality of life. Clin J Oncol Nurs, 2008.
12(1): p. 65-77.
76. Aaronson, N.K., et al., The European Organization for Research and
Treatment of Cancer QLQ-C30: a quality-of-life instrument for use in
international clinical trials in oncology. J Natl Cancer Inst, 1993. 85(5): p.
365-76.
77. Karnofsky, D.A., et al., The use of the nitrogen mustards in the palliative
treatment of carcinoma. With particular reference to bronchogenic
carcinoma. Cancer, 1948. 1(4): p. 634-656.
78. Oken, M.M., et al., Toxicity and response criteria of the Eastern
Cooperative Oncology Group. Am J Clin Oncol, 1982. 5(6): p. 649-55.
79. Arends, J., et al., ESPEN Guidelines on Enteral Nutrition: Non-surgical
oncology. Clin Nutr, 2006. 25(2): p. 245-59.

Dietary energy density and energy intake in cancer patients
56
80. Bauer, J., S. Ash, and W. Davidson, Evidence based practice guidelines for
the nutritional management of cancer cachexia. Nutrition & Dietetics, 2006.
63: p. S3–32.
81. August, D.A., et al., A.S.P.E.N. Clinical Guidelines: Nutrition Support
Therapy During Adult Anticancer Treatment and in Hematopoietic Cell
Transplantation. Journal of Parenteral and Enteral Nutrition, 2009. 33(5): p.
472-500.
82. Bozzetti, F., et al., ESPEN Guidelines on Parenteral Nutrition: non-surgical
oncology. Clin Nutr, 2009. 28(4): p. 445-54.
83. Elia, M., et al., Enteral (oral or tube administration) nutritional support and
eicosapentaenoic acid in patients with cancer: a systematic review. Int J
Oncol, 2006. 28(1): p. 5-23.
84. American Dietetic Association Oncology Evidence-Based Nutrition Practice
Guideline. 2007 [cited 2008 05/12/08]; Available from:
http://www.adaevidencelibrary.com/topic.cfm?format_tables=0&cat=3250.
85. Nutrition Intervention Terms and Definitions, in International Dietetics &
Nutrition Terminology Reference Manual2012, Academy of Nutrition and
Dietetics.
86. Du, H., et al., Dietary energy density in relation to subsequent changes of
weight and waist circumference in European men and women. PLoS One,
2009. 4(4): p. e5339.
87. Johnson, L., et al., Reflections from a systematic review of dietary energy
density and weight gain: is the inclusion of drinks valid? Obes Rev, 2009.
88. Barton, A.D., et al., A recipe for improving food intakes in elderly
hospitalized patients. Clin Nutr, 2000. 19(6): p. 451-4.
89. Odlund Olin, A., et al., Energy-dense meals improve energy intake in
elderly residents in a nursing home. Clin Nutr, 2003. 22(2): p. 125-31.
90. Olin, A.O., et al., Energy-enriched hospital food to improve energy intake in
elderly patients. JPEN J Parenter Enteral Nutr, 1996. 20(2): p. 93-7.
91. Silver, H.J., M.S. Dietrich, and V.H. Castellanos, Increased energy density
of the home-delivered lunch meal improves 24-hour nutrient intakes in older
adults. J Am Diet Assoc, 2008. 108(12): p. 2084-9.
92. Poppitt, S.D. and A.M. Prentice, Energy density and its role in the control of
food intake: evidence from metabolic and community studies. Appetite,
1996. 26(2): p. 153-74.
93. Westerterp-Plantenga, M.S., Analysis of energy density of food in relation to
energy intake regulation in human subjects. Br J Nutr, 2001. 85(3): p. 351-
61.
94. Grunwald, G.K., et al., Quantifying and separating the effects of
macronutrient composition and non-macronutrients on energy density. Br J
Nutr, 2001. 86(2): p. 265-76.
95. Cox, D.N. and D.J. Mela, Determination of energy density of freely selected
diets: methodological issues and implications. Int J Obes Relat Metab
Disord, 2000. 24(1): p. 49-54.
57
96. Ledikwe, J.H., et al., Dietary energy density determined by eight calculation
methods in a nationally representative United States population. J Nutr,
2005. 135(2): p. 273-8.
97. Lappalainen, R., et al., Drinking water with a meal: a simple method of
coping with feelings of hunger, satiety and desire to eat. Eur J Clin Nutr,
1993. 47(11): p. 815-9.
98. Mattes, R., Fluid calories and energy balance: the good, the bad, and the
uncertain. Physiol Behav, 2006. 89(1): p. 66-70.
99. Rolls, B.J., E.A. Bell, and M.L. Thorwart, Water incorporated into a food
but not served with a food decreases energy intake in lean women. Am J
Clin Nutr, 1999. 70(4): p. 448-55.
100. Begg, M.D. and M.K. Parides, Separation of individual-level and cluster-
level covariate effects in regression analysis of correlated data. Stat Med,
2003. 22(16): p. 2591-602.
101. de Castro, J.M., Varying levels of food energy self-reporting are associated
with between-group, but not within-subject, differences in food intake. J
Nutr, 2006. 136(5): p. 1382-8.
102. Baldwin, C. and C.E. Weekes, Dietary advice with or without oral
nutritional supplements for disease-related malnutrition in adults. Cochrane
Database Syst Rev, 2011(9): p. CD002008.
103. Cawood, A.L., M. Elia, and R.J. Stratton, Systematic review and meta-
analysis of the effects of high protein oral nutritional supplements. Ageing
Res Rev, 2012. 11(2): p. 278-96.
104. Stratton, R.J. and M. Elia, A review of reviews: A new look at the evidence
for oral nutritional supplements in clinical practice. Clinical Nutrition
Supplements, 2007. 2(1): p. 5-23.
105. Stratton, R.J. and M. Elia, Encouraging appropriate, evidence-based use of
oral nutritional supplements. Proc Nutr Soc, 2010. 69(4): p. 477-87.
106. Bounous, G., et al., Dietary protection during radiation therapy.
Strahlentherapie, 1975. 149(5): p. 476-83.
107. Douglass, H.O., Jr., et al., Elemental diet as an adjuvant for patients with
locally advanced gastrointestinal cancer receiving radiation therapy: a
prospectively randomized study. JPEN J Parenter Enteral Nutr, 1978. 2(5):
p. 682-6.
108. Brown, M.S., R.B. Buchanan, and S.J. Karran, Clinical observations on the
effects of elemental diet supplementation during irradiation. Clin Radiol,
1980. 31(1): p. 19-20.
109. Foster, K.J., et al., The metabolic effects of abdominal irradiation in man
with and without dietary therapy with an elemental diet. Clin Radiol, 1980.
31(1): p. 13-7.
110. Elkort, R.J., et al., Long-term nutritional support as an adjunct to
chemotherapy for breast cancer. JPEN J Parenter Enteral Nutr, 1981. 5(5):
p. 385-90.

Dietary energy density and energy intake in cancer patients
58
111. Moloney, M., M. Moriarty, and L. Daly, Controlled studies of nutritional
intake in patients with malignant disease undergoing treatment. Hum Nutr
Appl Nutr, 1983. 37(1): p. 30-5.
112. Dixon, J., Effect of nursing interventions on nutritional and performance
status in cancer patients. Nurs Res, 1984. 33(6): p. 330-5.
113. Evans, W.K., et al., A randomized study of oral nutritional support versus
ad lib nutritional intake during chemotherapy for advanced colorectal and
non-small-cell lung cancer. J Clin Oncol, 1987. 5(1): p. 113-24.
114. Flynn, M.B. and F.F. Leightty, Preoperative outpatient nutritional support
of patients with squamous cancer of the upper aerodigestive tract. Am J
Surg, 1987. 154(4): p. 359-62.
115. Arnold, C. and M.P. Richter, The effect of oral nutritional supplements on
head and neck cancer. Int J Radiat Oncol Biol Phys, 1989. 16(6): p. 1595-9.
116. Macia, E., et al., Nutritional evaluation and dietetic care in cancer patients
treated with radiotherapy: prospective study. Nutrition (Burbank, Los
Angeles County, Calif.), 1991. 7(3): p. 205-9.
117. Nayel, H., E. el-Ghoneimy, and S. el-Haddad, Impact of nutritional
supplementation on treatment delay and morbidity in patients with head and
neck tumors treated with irradiation. Nutrition, 1992. 8(1): p. 13-8.
118. Ollenschlager, G., et al., Nutritional behaviour and quality of life during
oncological polychemotherapy: results of a prospective study on the efficacy
of oral nutrition therapy in patients with acute leukaemia. Eur J Clin Invest,
1992. 22(8): p. 546-53.
119. Ovesen, L., et al., Effect of dietary counseling on food intake, body weight,
response rate, survival, and quality of life in cancer patients undergoing
chemotherapy: a prospective, randomized study. J Clin Oncol, 1993. 11(10):
p. 2043-9.
120. Lovik, A., et al., [Dietary information after radiotherapy of head and neck
cancer]. Tidsskr Nor Laegeforen, 1996. 116(19): p. 2303-6.
121. McCarthy, D. and D. Weihofen, The effect of nutritional supplements on
food intake in patients undergoing radiotherapy. Oncol Nurs Forum, 1999.
26(5): p. 897-900.
122. Persson, C.R., et al., A randomized study of nutritional support in patients
with colorectal and gastric cancer. Nutr Cancer, 2002. 42(1): p. 48-58.
123. Isenring, E.A., S. Capra, and J.D. Bauer, Nutrition intervention is beneficial
in oncology outpatients receiving radiotherapy to the gastrointestinal or
head and neck area. Br J Cancer, 2004. 91(3): p. 447-52.
124. Ravasco, P., et al., Impact of nutrition on outcome: a prospective
randomized controlled trial in patients with head and neck cancer
undergoing radiotherapy. Head Neck, 2005. 27(8): p. 659-68.
125. Ravasco, P., et al., Dietary counseling improves patient outcomes: a
prospective, randomized, controlled trial in colorectal cancer patients
undergoing radiotherapy. J Clin Oncol, 2005. 23(7): p. 1431-8.
126. Baldwin, C., et al., Simple nutritional intervention in patients with advanced
cancers of the gastrointestinal tract, non-small cell lung cancers or
59
mesothelioma and weight loss receiving chemotherapy: a randomised
controlled trial. J Hum Nutr Diet, 2011. 24(5): p. 431-40.
127. Burden, S.T., et al., An unblinded randomised controlled trial of
preoperative oral supplements in colorectal cancer patients. J Hum Nutr
Diet, 2011. 24(5): p. 441-8.
128. Baldwin, C., C.E. Weekes, and K.L. Campbell, Measuring the effectiveness
of dietetic interventions in nutritional support. J Hum Nutr Diet, 2008.
21(4): p. 303-5.
129. Symreng, T., Arm anthropometry in a large reference population and in
surgical patients. Clin Nutr, 1982. 1(3): p. 211-9.
130. Håglin, L., U. Hagman, and M. Nilsson, Evaluation of the meal model
"Matmallen". A means of estimating consumed amounts of food.
Scandinavian Journal of Nutrition, 1995. 39: p. 79-83.
131. Statenslivsmedelsverk. Livsmedelsdatabas, PC-kost. 1993 1993 [cited 1993;
Available from: www.slv.se.
132. Scott NW, F.P., Aaronson NK, Bottomley A, de Graeff A, Groenvold M,
Gundy C, Koller M, Petersen MA, Sprangers MAG on behalf of the
EORTC Quality of Life Group, EORTC QLQ-C30 Reference Values, 2008,
EORTC Quality of Life Group Publications: Brussels.
133. Rothenberg, E., I. Bosaeus, and B. Steen, Food habits in 70-year-olds in
Sweden. A 22-year cohort study. Scandinavian Journal of Nutrition, 1996.
40(3): p. 104-110.
134. Bingham, S.A. and J.H. Cummings, Urine nitrogen as an independent
validatory measure of dietary intake: a study of nitrogen balance in
individuals consuming their normal diet. Am J Clin Nutr, 1985. 42(6): p.
1276-89.
135. Livingstone, M.B. and A.E. Black, Markers of the validity of reported
energy intake. J Nutr, 2003. 133 Suppl 3: p. 895S-920S.
136. McClave, S.A. and H.L. Snider, Dissecting the energy needs of the body.
Curr Opin Clin Nutr Metab Care, 2001. 4(2): p. 143-7.
137. Blundell, J.E. and J. Cooling, Routes to obesity: phenotypes, food choices
and activity. Br J Nutr, 2000. 83 Suppl 1: p. S33-8.
138. Bellisle, F., Food choice, appetite and physical activity. Public Health Nutr,
1999. 2(3A): p. 357-61.
139. Hopkins, M., et al., The relationship between substrate metabolism, exercise
and appetite control: does glycogen availability influence the motivation to
eat, energy intake or food choice? Sports Med, 2011. 41(6): p. 507-21.
140. Marti-Henneberg, C., et al., Energy density of the diet, food volume and
energy intake by age and sex in a healthy population. Eur J Clin Nutr, 1999.
53(6): p. 421-8.
141. Stookey, J.D., Energy density, energy intake and weight status in a large
free-living sample of Chinese adults: exploring the underlying roles of fat,
protein, carbohydrate, fiber and water intakes. Eur J Clin Nutr, 2001. 55(5):
p. 349-59.
Dietary energy density and energy intake in cancer patients
60
142. Almiron-Roig, E., Y. Chen, and A. Drewnowski, Liquid calories and the
failure of satiety: how good is the evidence? Obes Rev, 2003. 4(4): p. 201-
12.
143. de Castro, J.M., Stomach filling may mediate the influence of dietary energy
density on the food intake of free-living humans. Physiol Behav, 2005. 86(1-
2): p. 32-45.
144. de Castro, J.M., The control of food intake of free-living humans: putting the
pieces back together. Physiol Behav, 2010. 100(5): p. 446-53.
145. de Castro, J.M., Prior day's intake has macronutrient-specific delayed
negative feedback effects on the spontaneous food intake of free-living
humans. J Nutr, 1998. 128(1): p. 61-7.
146. Johnstone, A.M., Safety and efficacy of high-protein diets for weight loss.
Proc Nutr Soc, 2012. 71(2): p. 339-49.
147. Wanders, A.J., et al., Effects of dietary fibre on subjective appetite, energy
intake and body weight: a systematic review of randomized controlled trials.
Obes Rev, 2011. 12(9): p. 724-39.
148. Gilbert, J.A., et al., Effect of proteins from different sources on body
composition. Nutr Metab Cardiovasc Dis, 2011. 21 Suppl 2: p. B16-31.
149. Walrand, S. and Y. Boirie, Optimizing protein intake in aging. Curr Opin
Clin Nutr Metab Care, 2005. 8(1): p. 89-94.
150. Mantovani, G., Randomised phase III clinical trial of 5 different arms of
treatment on 332 patients with cancer cachexia. Eur Rev Med Pharmacol
Sci, 2010. 14(4): p. 292-301.
151. Osoba, D., et al., Interpreting the significance of changes in health-related
quality-of-life scores. J Clin Oncol, 1998. 16(1): p. 139-44.
152. Daneryd, P., et al., Protection of metabolic and exercise capacity in
unselected weight-losing cancer patients following treatment with
recombinant erythropoietin: a randomized prospective study. Cancer Res,
1998. 58(23): p. 5374-9.