Dienes and ε-Caprolactone - Royal Society of Chemistry · 2019-11-26 · 1 Supporting information...
11
1 Supporting information Lutetium and Yttrium Complexes Supported by Anilido- oxazoline Ligands for Polymerization of 1,3-Conjugated Dienes and ε-Caprolactone Wenqiang Li 1 , Xinxin Jiang 1 , Yat-Ming So 2 , Gaohong He 1 and Yu Pan 1, * 1 State Key Laboratory of Fine Chemicals, School of Petroleum and Chemical Engineering, Dalian University of Technology, Panjin 124221, China. 2 Department of Chemistry, The Hong Kong University of Science and Technology, Clear Water Bay, Kowloon, Hong Kong, China. * Correspondence: [email protected] Table of Contents 1 H NMR spectra of complexes 1a and 1b··································································Fig. S1 and S2. 13 C NMR spectra of complexes 1a and 1b·································································Fig. S3 and S4. IR spectra of complexes 1a and 1b·············································································Fig. S5 and S6. UV-Vis spectra of complexes 1a and 1b····································································Fig. S7 and S8. Fluorescence emission spectra of complexes 1a and 1b······················································Fig. S9. 13 C NMR spectra of PIPs produced by 1a, 1b, 2a and 2b··········································Fig. S10‒S13. 1 H NMR spectra of polymyrcenes produced by 1a, 1b, 2a and 2b··························Fig. S14‒S17. 13 C NMR spectra of polymyrcenes produced by 1a, 1b, 2a and 2b··························Fig. S18‒S21. The GPC trace of the copolymer with the feed ratio of IP and CL 700:300······················Fig. S22. The GPC trace of the copolymer with the feed ratio of IP and CL 500:500······················Fig. S23. The GPC trace of the copolymer with the feed ratio of IP and CL 300:700······················Fig. S24. 1 H NMR spectrum of copolymer with the feed ratio of IP and CL 700:300·····················Fig. S25. 1 H NMR spectrum of copolymer with the feed ratio of IP and CL 500:500·····················Fig. S26. 1 H NMR spectrum of copolymer with the feed ratio of IP and CL 300:700·····················Fig. S27. 13 C NMR spectrum of copolymer with the feed ratio of IP and CL 700:300····················Fig. S28. 13 C NMR spectrum of copolymer with the feed ratio of IP and CL 500:500····················Fig. S29. 13 C NMR spectrum of copolymer with the feed ratio of IP and CL 300:700····················Fig. S30. Electronic Supplementary Material (ESI) for New Journal of Chemistry. This journal is © The Royal Society of Chemistry and the Centre National de la Recherche Scientifique 2019
Transcript of Dienes and ε-Caprolactone - Royal Society of Chemistry · 2019-11-26 · 1 Supporting information...
1
Supporting information
Lutetium and Yttrium Complexes Supported by Anilido-
oxazoline Ligands for Polymerization of 1,3-Conjugated
Dienes and ε-Caprolactone Wenqiang Li 1, Xinxin Jiang 1, Yat-Ming So 2, Gaohong He 1 and Yu Pan 1,*
1 State Key Laboratory of Fine Chemicals, School of Petroleum and Chemical Engineering, Dalian University of Technology, Panjin 124221, China.
2 Department of Chemistry, The Hong Kong University of Science and Technology, Clear Water Bay, Kowloon, Hong Kong, China.
* Correspondence: [email protected]
Table of Contents1H NMR spectra of complexes 1a and 1b··································································Fig. S1 and S2.13C NMR spectra of complexes 1a and 1b·································································Fig. S3 and S4.
IR spectra of complexes 1a and 1b·············································································Fig. S5 and S6.
UV-Vis spectra of complexes 1a and 1b····································································Fig. S7 and S8.
Fluorescence emission spectra of complexes 1a and 1b······················································Fig. S9.13C NMR spectra of PIPs produced by 1a, 1b, 2a and 2b··········································Fig. S10‒S13.1H NMR spectra of polymyrcenes produced by 1a, 1b, 2a and 2b··························Fig. S14‒S17. 13C NMR spectra of polymyrcenes produced by 1a, 1b, 2a and 2b··························Fig. S18‒S21.
The GPC trace of the copolymer with the feed ratio of IP and CL 700:300······················Fig. S22.
The GPC trace of the copolymer with the feed ratio of IP and CL 500:500······················Fig. S23.
The GPC trace of the copolymer with the feed ratio of IP and CL 300:700······················Fig. S24.1H NMR spectrum of copolymer with the feed ratio of IP and CL 700:300·····················Fig. S25.1H NMR spectrum of copolymer with the feed ratio of IP and CL 500:500·····················Fig. S26.1H NMR spectrum of copolymer with the feed ratio of IP and CL 300:700·····················Fig. S27.13C NMR spectrum of copolymer with the feed ratio of IP and CL 700:300····················Fig. S28.13C NMR spectrum of copolymer with the feed ratio of IP and CL 500:500····················Fig. S29.13C NMR spectrum of copolymer with the feed ratio of IP and CL 300:700····················Fig. S30.
Electronic Supplementary Material (ESI) for New Journal of Chemistry.This journal is © The Royal Society of Chemistry and the Centre National de la Recherche Scientifique 2019
2
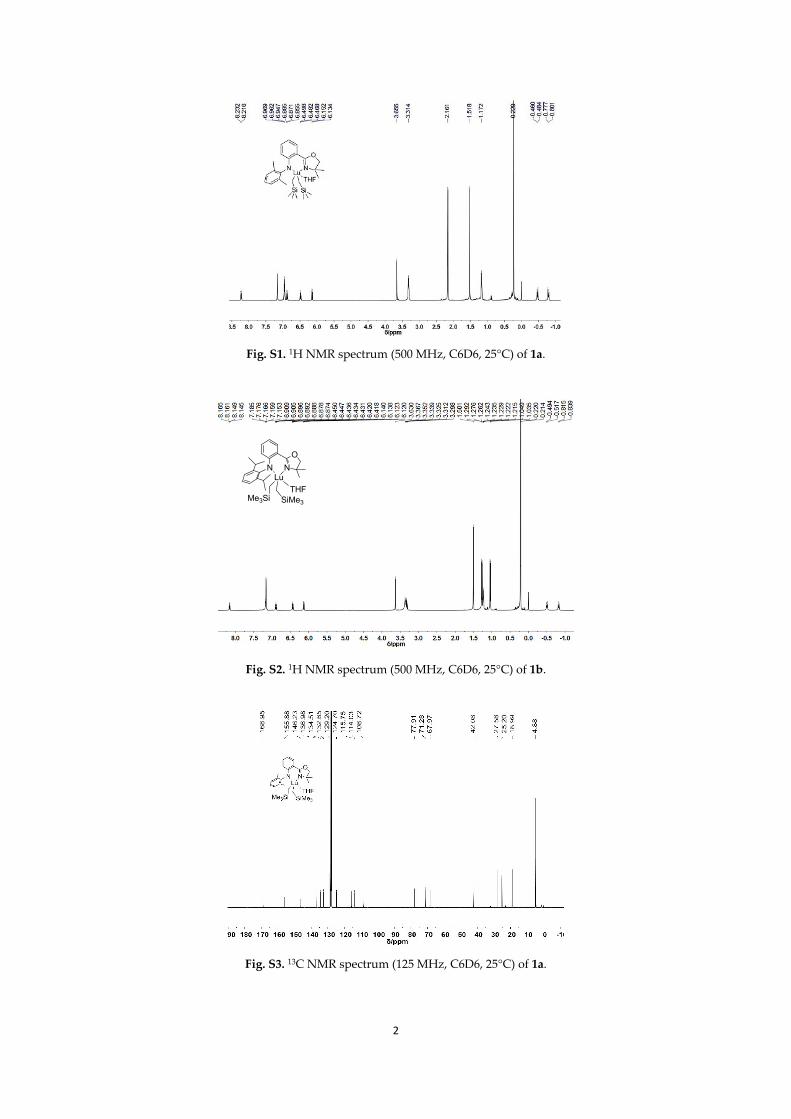
Fig. S1. 1H NMR spectrum (500 MHz, C6D6, 25°C) of 1a.
NO
NLu
THFMe3Si SiMe3
Fig. S2. 1H NMR spectrum (500 MHz, C6D6, 25°C) of 1b.
Fig. S3. 13C NMR spectrum (125 MHz, C6D6, 25°C) of 1a.

3
Fig. S4. 13C NMR spectrum (125 MHz, C6D6, 25°C) of 1b.
4000 3500 3000 2500 2000 1500 1000 500
wave number/cm-1
IR of 1a
Fig. S5. IR spectrum of 1a.
4000 3500 3000 2500 2000 1500 1000 500
wave number/cm-1
IR of 1b
Fig. S6. IR spectrum of 1b.
4
300 350 400 450 500 550 600
0.0
0.5
1.0
Inte
nsity
(a.u
.)
Wavelength(nm)
UV-Vis
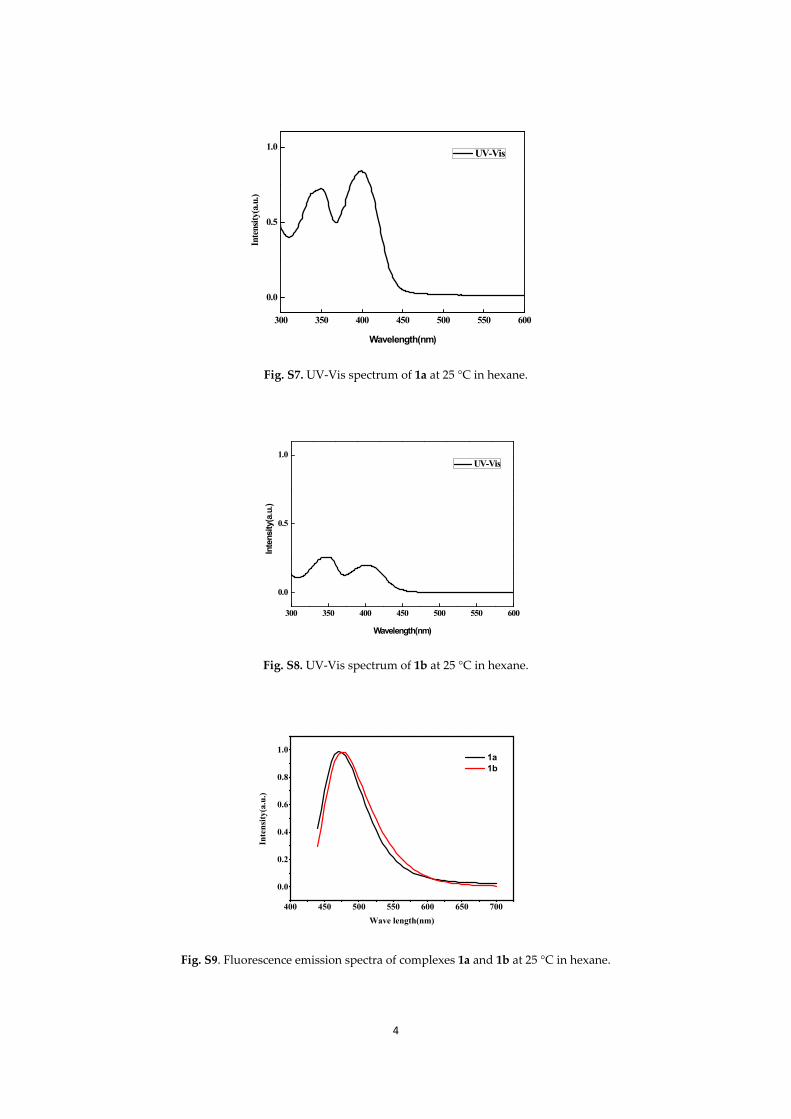
Fig. S7. UV-Vis spectrum of 1a at 25 °C in hexane.
300 350 400 450 500 550 600
0.0
0.5
1.0
Intensity(a.u.)
Wavelength(nm)
UV-Vis
Fig. S8. UV-Vis spectrum of 1b at 25 °C in hexane.
400 450 500 550 600 650 700
0.0
0.2
0.4
0.6
0.8
1.0
Inte
nsity
(a.u
.)
Wave length(nm)
1a 1b
Fig. S9. Fluorescence emission spectra of complexes 1a and 1b at 25 °C in hexane.
5
-100102030405060708090100110120130140150160δ/ppm
-1.8
213
.12
100.
00
-0.0
015
.95
18.6
223
.41
23.4
423
.47
26.3
126
.33
26.4
029
.86
31.2
932
.08
32.2
032
.23
32.3
847
.93
111.
4212
3.70
124.
5812
4.99
125.
0212
5.07
135.
2013
5.49
135.
71
147.
46
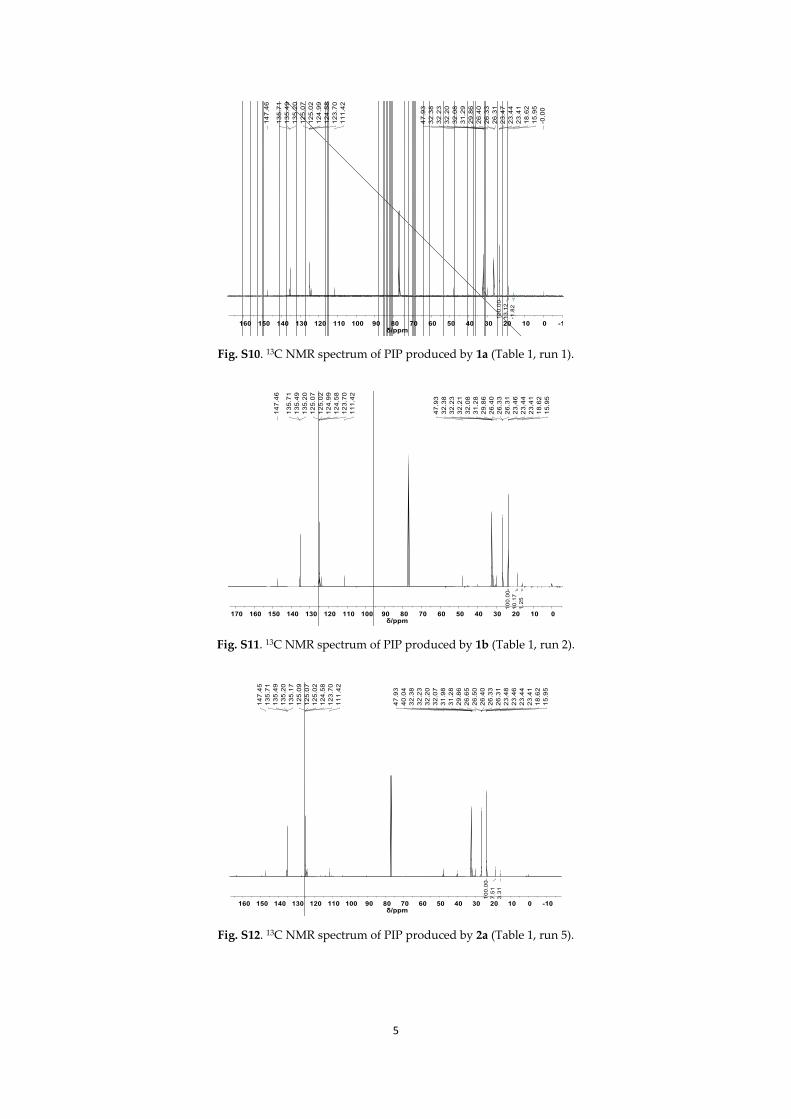
Fig. S10. 13C NMR spectrum of PIP produced by 1a (Table 1, run 1).
0102030405060708090100110120130140150160170δ/ppm
1.25
10.1
710
0.00
15.9
518
.62
23.4
123
.44
23.4
626
.31
26.3
326
.40
29.8
631
.28
32.0
832
.21
32.2
332
.38
47.9
3
111.
4212
3.70
124.
5812
4.99
125.
0212
5.07
135.
2013
5.49
135.
71
147.
46
Fig. S11. 13C NMR spectrum of PIP produced by 1b (Table 1, run 2).
-100102030405060708090100110120130140150160δ/ppm
3.31
7.51
100.
00
15.9
518
.62
23.4
123
.44
23.4
623
.48
26.3
126
.33
26.4
026
.50
26.6
529
.86
31.2
831
.98
32.0
732
.20
32.2
332
.38
40.0
447
.93
111.
4212
3.70
124.
5812
5.02
125.
0712
5.09
135.
1713
5.20
135.
4913
5.71
147.
45
Fig. S12. 13C NMR spectrum of PIP produced by 2a (Table 1, run 5).
6
-100102030405060708090100110120130140150160δ/ppm
4.34
100.
00
18.6
223
.44
23.4
726
.31
26.3
326
.40
29.8
631
.29
32.0
832
.21
32.2
432
.38
47.9
3
111.
4212
3.71
124.
5812
4.93
125.
0212
5.07
135.
2013
5.49
135.
71
147.
45
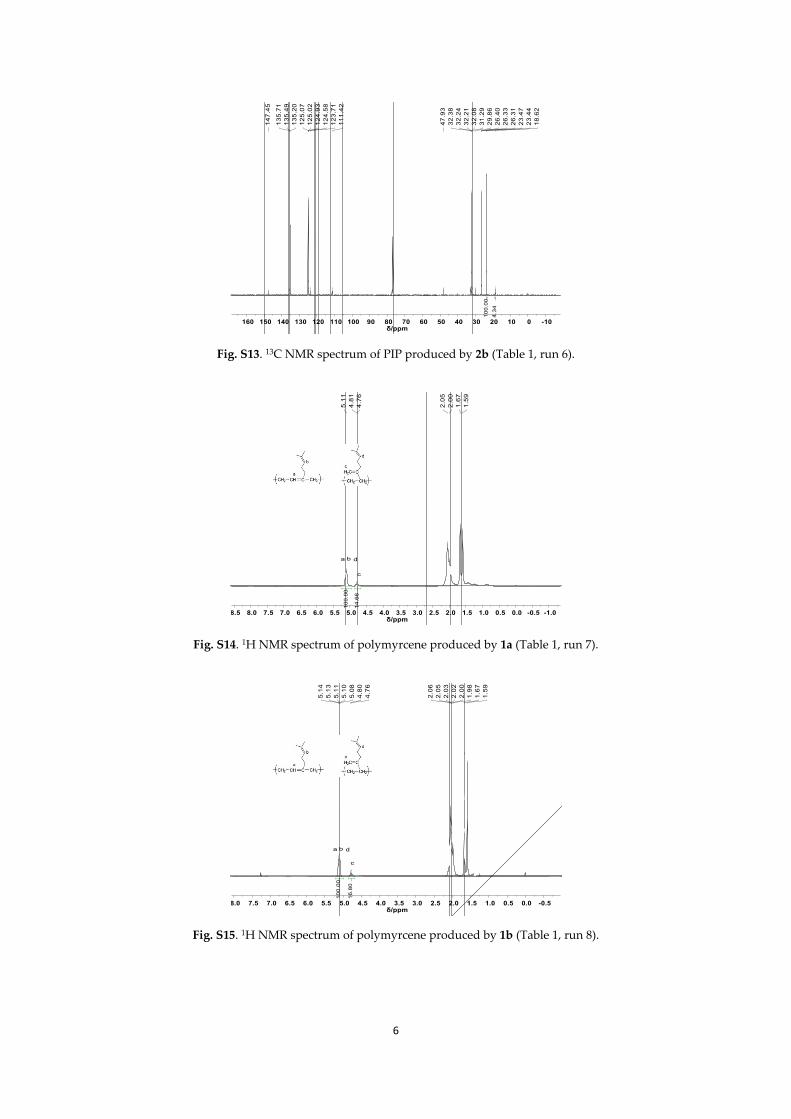
Fig. S13. 13C NMR spectrum of PIP produced by 2b (Table 1, run 6).
-1.0-0.50.00.51.01.52.02.53.03.54.04.55.05.56.06.57.07.58.08.5δ/ppm
14.6
6
100.
00
1.59
1.67
2.00
2.05
4.76
4.81
5.11
a b
c
d
Fig. S14. 1H NMR spectrum of polymyrcene produced by 1a (Table 1, run 7).
-0.50.00.51.01.52.02.53.03.54.04.55.05.56.06.57.07.58.0δ/ppm
16.8
0
100.
00
1.59
1.67
1.98
2.00
2.02
2.03
2.05
2.06
4.76
4.80
5.08
5.10
5.11
5.13
5.14
a b d
c
Fig. S15. 1H NMR spectrum of polymyrcene produced by 1b (Table 1, run 8).
7
-1.0-0.50.00.51.01.52.02.53.03.54.04.55.05.56.06.57.07.58.0δ/ppm
6.02
100.
00
1.59
1.67
1.97
1.98
1.99
2.00
2.02
2.03
2.05
2.06
2.08
4.76
4.80
5.08
5.10
5.11
5.13
5.14
*: EtOH
*: EtOH
a b d
c
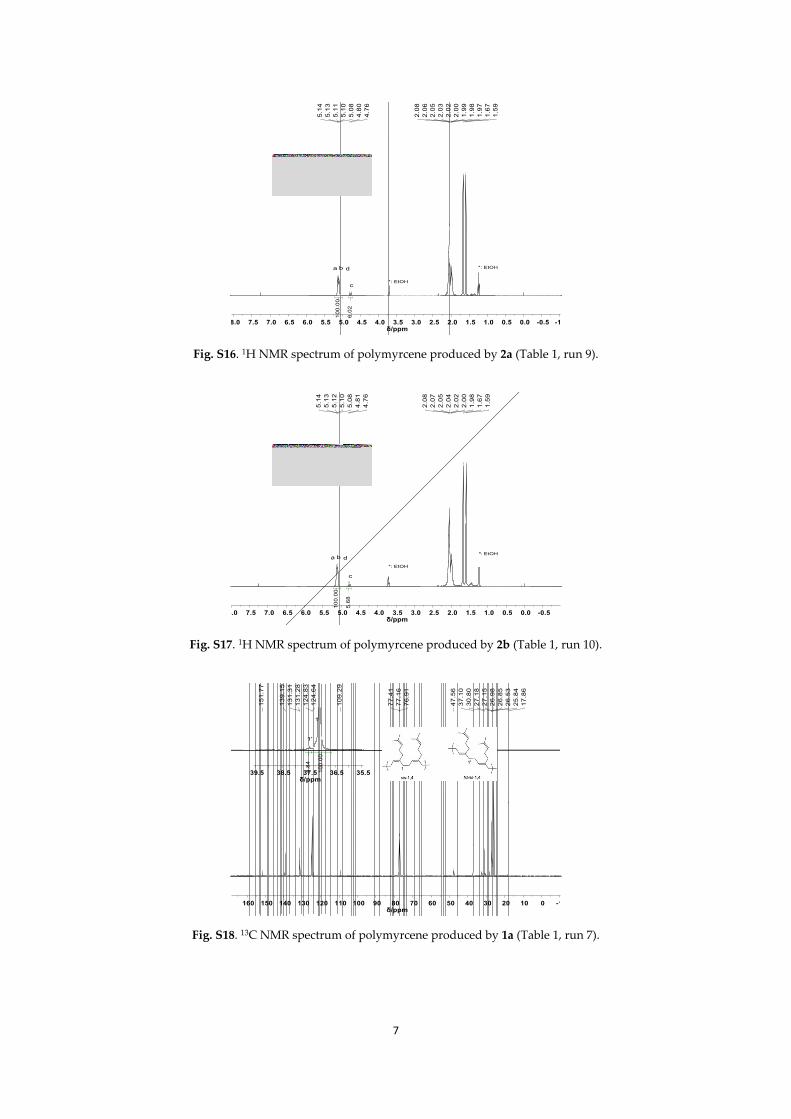
Fig. S16. 1H NMR spectrum of polymyrcene produced by 2a (Table 1, run 9).
-0.50.00.51.01.52.02.53.03.54.04.55.05.56.06.57.07.58.0δ/ppm
5.68
100.
00
1.59
1.67
1.98
2.00
2.02
2.04
2.05
2.07
2.08
4.76
4.81
5.08
5.10
5.12
5.13
5.14
*: EtOH
*: EtOHa b d
c
Fig. S17. 1H NMR spectrum of polymyrcene produced by 2b (Table 1, run 10).
-100102030405060708090100110120130140150160δ/ppm
17.8
625
.84
26.5
326
.85
26.9
827
.15
27.1
830
.80
37.1
047
.56
76.9
177
.16
77.4
1
109.
29
124.
6412
4.83
131.
2813
1.31
139.
15
151.
77
35.536.537.538.539.5δ/ppm
100.
00
4.84
1
1'
Fig. S18. 13C NMR spectrum of polymyrcene produced by 1a (Table 1, run 7).
8
-100102030405060708090100110120130140150160δ/ppm
17.8
525
.83
26.5
226
.96
27.1
327
.17
30.7
937
.08
76.9
177
.16
77.4
1
109.
28
124.
6212
4.66
124.
8213
1.29
131.
3313
9.15
151.
77
35.536.537.538.539.5δ/ppm
100.
00
1.16
37.0
8
1
1'
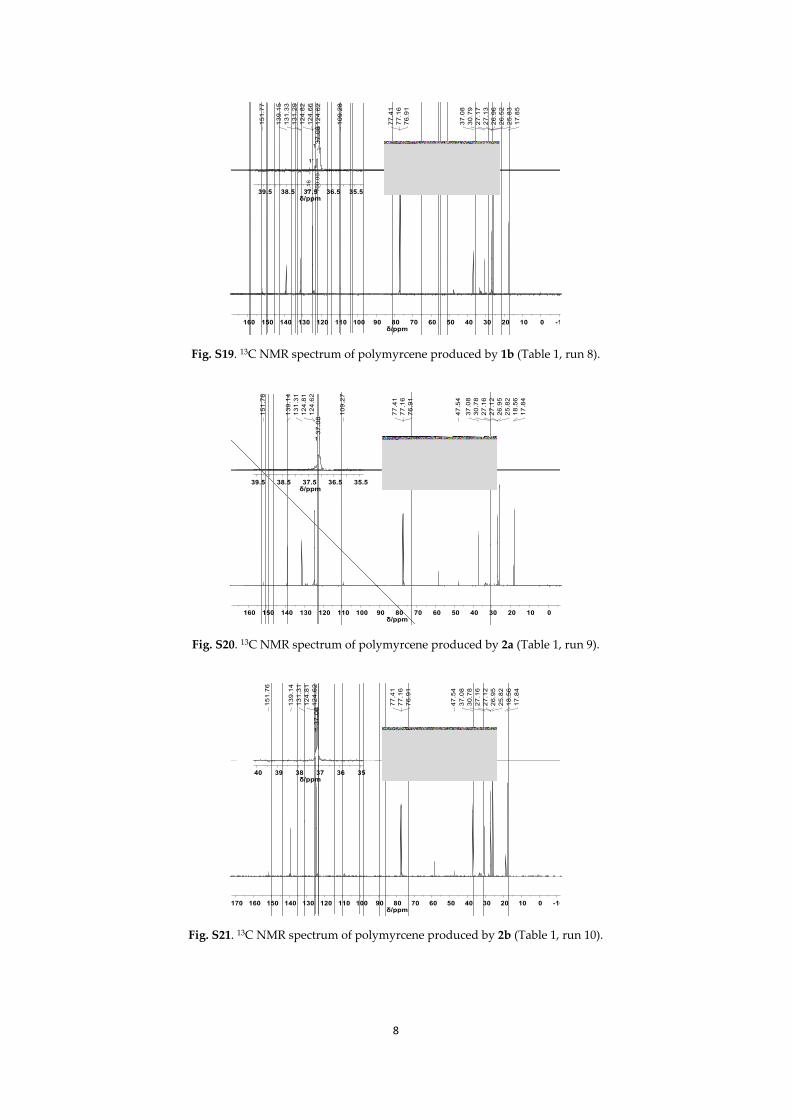
Fig. S19. 13C NMR spectrum of polymyrcene produced by 1b (Table 1, run 8).
0102030405060708090100110120130140150160δ/ppm
17.8
418
.56
25.8
226
.95
27.1
227
.16
30.7
837
.08
47.5
4
76.9
177
.16
77.4
1
109.
27
124.
6212
4.81
131.
3113
9.14
151.
76
35.536.537.538.539.5δ/ppm
37.0
8
1
Fig. S20. 13C NMR spectrum of polymyrcene produced by 2a (Table 1, run 9).
-100102030405060708090100110120130140150160170δ/ppm
17.8
418
.56
25.8
226
.95
27.1
227
.16
30.7
837
.08
47.5
4
76.9
177
.16
77.4
1
124.
6212
4.81
131.
3113
9.14
151.
76
353637383940δ/ppm
37.0
8
1
Fig. S21. 13C NMR spectrum of polymyrcene produced by 2b (Table 1, run 10).
9
Inte
nsity
(a.u
.)
Retention Time
PIP part Final
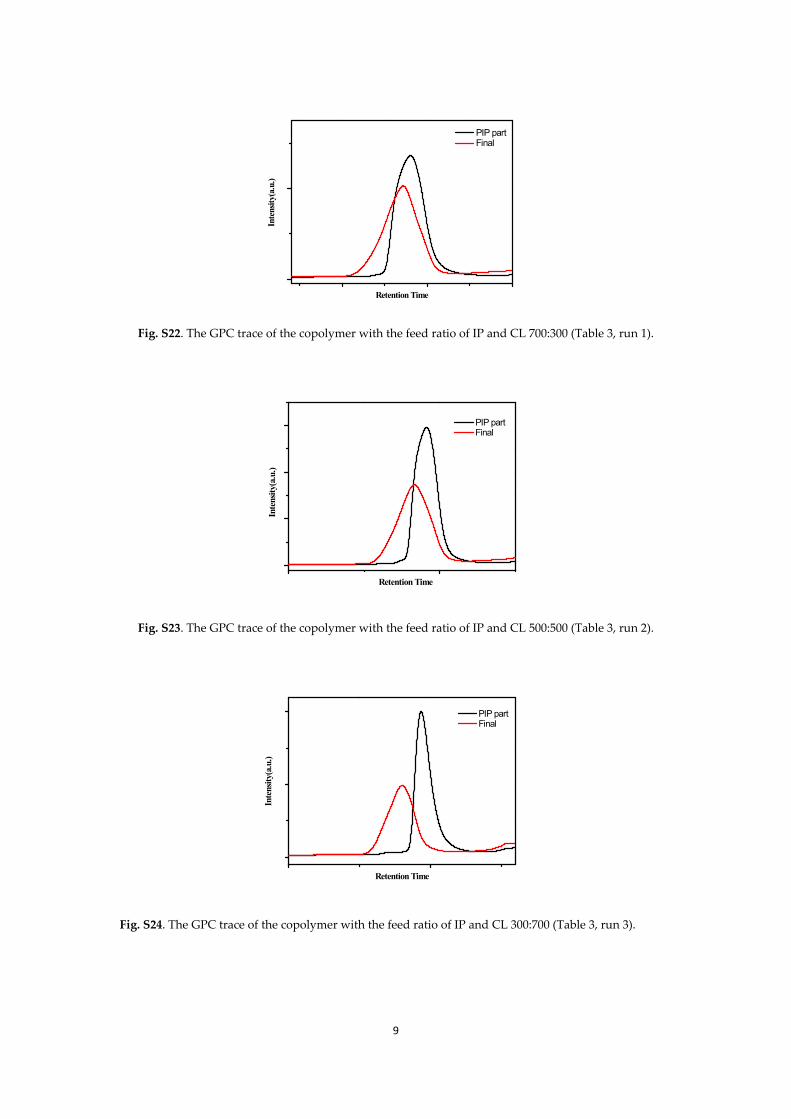
Fig. S22. The GPC trace of the copolymer with the feed ratio of IP and CL 700:300 (Table 3, run 1).
Inte
nsity
(a.u
.)
Retention Time
PIP part Final
Fig. S23. The GPC trace of the copolymer with the feed ratio of IP and CL 500:500 (Table 3, run 2).
Inte
nsity
(a.u
.)
Retention Time
PIP part Final
Fig. S24. The GPC trace of the copolymer with the feed ratio of IP and CL 300:700 (Table 3, run 3).

10
0.00.51.01.52.02.53.03.54.04.55.05.56.06.57.07.5δ/ppm
-0.0
01.
371.
371.
381.
391.
401.
401.
621.
631.
641.
641.
651.
682.
022.
042.
052.
072.
292.
312.
324.
054.
064.
07
4.68
4.76
5.11
5.12
7.26
Fig. S25. 1H NMR spectrum of copolymer with the feed ratio of IP and CL 700:300 (Table 3, run 1).
-0.50.00.51.01.52.02.53.03.54.04.55.05.56.06.57.07.58.0δ/ppm
-0.0
01.
371.
371.
381.
391.
401.
401.
411.
621.
621.
631.
641.
651.
661.
682.
022.
042.
052.
292.
312.
324.
054.
064.
074.
684.
765.
075.
085.
115.
12
7.27
Fig. S26. 1H NMR spectrum of copolymer with the feed ratio of IP and CL 500:500 (Table 3, run 2).
-0.50.00.51.01.52.02.53.03.54.04.55.05.56.06.57.07.58.0δ/ppm
-0.0
01.
351.
371.
381.
401.
411.
621.
631.
641.
651.
682.
022.
042.
292.
312.
32
4.05
4.06
4.07
4.68
4.76
5.11
5.12
7.27
Fig. S27. 1H NMR spectrum of copolymer with the feed ratio of IP and CL 300:700 (Table 3, run 3).

11
-100102030405060708090100110120130140150160170180δ/ppm
-0.0
0
18.6
223
.43
24.5
825
.54
26.4
028
.36
32.2
032
.23
34.1
2
64.1
5
76.7
777
.02
77.2
7
125.
02
135.
20
173.
55
Fig. S28. 13C NMR spectrum of copolymer with the feed ratio of IP and CL 700:300 (Table 3, run 1).
-100102030405060708090100110120130140150160170180190200210δ/ppm
-0.0
018
.62
23.4
324
.58
25.5
326
.40
28.3
532
.20
34.1
2
64.1
576
.77
77.0
277
.28
125.
02
135.
20
173.
55
Fig. S29. 13C NMR spectrum of copolymer with the feed ratio of IP and CL 500:500 (Table 3, run 2).
-100102030405060708090100110120130140150160170180190200210δ/ppm
0.00
18.6
223
.43
24.5
825
.54
26.4
028
.35
32.2
034
.12
64.1
576
.78
77.0
377
.23
77.2
9
125.
02
135.
20
173.
54
Fig. S30. 13C NMR spectrum of copolymer with the feed ratio of IP and CL 300:700 (Table 3, run 3).