Die Swell of Complex Polymeric Systems - InTech -...
20
Chapter 4 © 2012 Wang, licensee InTech. This is an open access chapter distributed under the terms of the Creative Commons Attribution License (http://creativecommons.org/licenses/by/3.0), which permits unrestricted use, distribution, and reproduction in any medium, provided the original work is properly cited. Die Swell of Complex Polymeric Systems Kejian Wang Additional information is available at the end of the chapter http://dx.doi.org/10.5772/50137 1. Introduction Die swell is a common phenomenon in polymer extrusion. When a viscoelastic fluid flows out of a die, the extrudate diameter is usually greater than the channel size. This is called die-swell, extrudate swell or the Barus effect. The degree of extrudate swell is usually expressed by the die-swell ratio (B) of extrudate diameter versus die diameter. A better understanding of such flow behavior will be beneficial for the optimization of processing parameters and the design of extrusion equipment, both of which affect product quality and production cost. Innumerable valuable experimental data of die swell have been published, each focusing on different aspects affecting extrudate swell. There have been various interpretations of the extrusion swell of viscoelastic fluids from the macroscopic view of polymer rheology, such as a normal stress effect, an elastic energy effect, an entropy enlargement effect, an orientation effect and a memory effect. In fact, these interpretations are all related to each other[1,2]. It is generally believed that die swell is an important characteristic of the fluid elasticity during flow. The most common technique used to study rheological properties of polymer melts is capillary rheometry. In a capillary, polymer flows from the reservoir through a die and finally swells out of the exit. Under the action of extension, shear and compression, some molecular chains become disentangled, uncoiled or oriented in the convergent region resulting in an entry effect. During die flow, the resultant stress and strain cannot be relaxed completely. Simultaneously, some chains continue to be sheared and elongated during extrusion. On emerging from the die exit, the molecules are relaxed in elastic deformation by reentanglement and recoiling. The extrudate tends to contract in the flow direction and to grow in the normal direction, leading to extrudate swell[3]. As it does inside the capillary, the swelling evolves with time outside the capillary to reach a maximum at a certain extrusion distance. Graessley et al.[4] have reported that die swell occurs in two steps: (1) a very rapid swelling with a relatively large swell ratio very close to the die exit, which is known as running die swell; (2) a subsequent slow expansion to give
Transcript of Die Swell of Complex Polymeric Systems - InTech -...

Chapter 4
© 2012 Wang, licensee InTech. This is an open access chapter distributed under the terms of the Creative Commons Attribution License (http://creativecommons.org/licenses/by/3.0), which permits unrestricted use, distribution, and reproduction in any medium, provided the original work is properly cited.
Die Swell of Complex Polymeric Systems
Kejian Wang
Additional information is available at the end of the chapter
http://dx.doi.org/10.5772/50137
1. Introduction
Die swell is a common phenomenon in polymer extrusion. When a viscoelastic fluid flows out of a die, the extrudate diameter is usually greater than the channel size. This is called die-swell, extrudate swell or the Barus effect. The degree of extrudate swell is usually expressed by the die-swell ratio (B) of extrudate diameter versus die diameter. A better understanding of such flow behavior will be beneficial for the optimization of processing parameters and the design of extrusion equipment, both of which affect product quality and production cost.
Innumerable valuable experimental data of die swell have been published, each focusing on different aspects affecting extrudate swell. There have been various interpretations of the extrusion swell of viscoelastic fluids from the macroscopic view of polymer rheology, such as a normal stress effect, an elastic energy effect, an entropy enlargement effect, an orientation effect and a memory effect. In fact, these interpretations are all related to each other[1,2]. It is generally believed that die swell is an important characteristic of the fluid elasticity during flow. The most common technique used to study rheological properties of polymer melts is capillary rheometry. In a capillary, polymer flows from the reservoir through a die and finally swells out of the exit. Under the action of extension, shear and compression, some molecular chains become disentangled, uncoiled or oriented in the convergent region resulting in an entry effect. During die flow, the resultant stress and strain cannot be relaxed completely. Simultaneously, some chains continue to be sheared and elongated during extrusion. On emerging from the die exit, the molecules are relaxed in elastic deformation by reentanglement and recoiling. The extrudate tends to contract in the flow direction and to grow in the normal direction, leading to extrudate swell[3]. As it does inside the capillary, the swelling evolves with time outside the capillary to reach a maximum at a certain extrusion distance. Graessley et al.[4] have reported that die swell occurs in two steps: (1) a very rapid swelling with a relatively large swell ratio very close to the die exit, which is known as running die swell; (2) a subsequent slow expansion to give

Viscoelasticity – From Theory to Biological Applications 78
an equilibrium die swell. Thus, the extent of the swelling will depend on both external factors as well as the intrinsic characteristics of the polymer[5]. The former include the geometry (contraction ratio and angle, die length and diameter as well as their ratio L/D) of the extrusion system (reservior, entry and die) [6,7] and the capillary operating conditions (the applied shear rate, stress and temperature) [8,9] and the external environment medium[10]. Extrudate swell can be used to assess the polymer viscoelasticity upon melt extrusion. Through rheological characterization, extrudate swell can also be correlated with the molecular structure of the polymer (molecular weight, and extents of crosslinking and long chain branching)[11].
Precise polymer processing requires an adequate quantitative description of flow. The viscous behavior determines the throughput, while the elastic properties are important for dimensional stability. Many theoretical studies have been conducted to improve our understanding and prediction of extrudate swell[12], in which a very critical aspect is the choice of an appropriate constitutive model[13,14]. In simulations, specific values of the model parameters—especially material parameters—must be defined. Some of these parameters can be measured by rheological experiments. Thus, quantitative analyses are able to relate extrudate swell to the viscoelasticity of polymer melts.
Extrudate swell was initially exploited to study the effects of die swell on processability and its correlation with the relevant rheological properties of polymer melts and the early work has been reviewed by Kontos and White[15] and Graessley[4]. In these early studies[16–18], a wide range of experiments on polymer melt swelling were performed. Some workers have reported that die swell varies with temperature[19], pressure during processing[20], molecular weight and its distribution[21–23], as well as molecular structure[24–27] and compounding ingredients[28]. Studies of die swell as a function of length to diameter ratio of die (L/D), entry speed and shape of the die have been reported by Han [29], Cotten[30], Lenk [31] and Vinogradov and Malkin[32]. Recently, the die swell of particle-filled polymers has attracted more attention because of their wider engineering applications[33,34]. These experiments have generated various valuable data of extrudate swell which need to be rationalized by theoretical studies.
Previous examinations of the existing data have identified some semi-empirical correlations relating the swell ratio to rheological parameters. In the 1970s, Bagley and Duffey[35], Graessley et al.[4], Han[36] and Tanner[37] proposed expressions for the relationship between the swell ratio B and the first normal stress difference or shear stress, on the supposition that polymer melt shear flow obeyed a simple law. One of the most famous approaches is that of Tanner[38] based on elastic recovery theory. In this model, the maximum diameter of the extrudate is related to the recoverable shear strain at the capillary wall.
Such continuum mechanics studies have been regularly reported from the early 1980s onwards. Investigations of the swelling phenomenon have been carried out using numerical simulations, especially by using the finite element method when considering complicated boundary conditions[39,40]. Most of the analyses have been conducted for laminar flow or

Die Swell of Complex Polymeric Systems 79
at low Reynolds number, in which the swell ratio is greater than one. However, at higher Reynolds numbers, the dimensions of the extrudate are possibly smaller than those of the die. Few data have been published concerning the effect of Reynolds number on the die swell[41,42]. Han[29] suggested that the equilibrium die swell measurements are independent of rheometer geometry for common extrusion at relatively low flow rate through a capillary where the ratio of reservoir diameter to capillary die diameter is less than 10, and length to diameter ratio of the capillary die is greater than 20. Such a capillary is termed a long capillary, in which the effects of the entry flow from the reservoir on the die exit region flow can be neglected. Most theoretical models have been derived for a long capillary[43–47]. However, there have been few quantitative predictions of die swell in actual polymer processing operations in which the ratio of width to length in the die flow channel is relatively short[48-58]. The die swell behavior of polymeric materials should be very important in short capillary flow. However, entrance effects in the short tube flow of polymer melts are relatively complicated. Thus, it is necessary to extend the theoretical models of the die swell in a long capillary to that in a short capillary. This is one purpose of this paper.
On the other hand, particulate-filled polymer composites are widely used in engineering to improve polymer properties. Their flow properties are important when molding various products. Some swell experiments have been conducted on filled polymers in which it was noticed that the die swell was related to the filler shape, size, dispersion, concentration and interfacial modification of the inclusions in the matrix[59,60]. However, there are few quantitative theories of the swelling in composites, in contrast to the situation for pure polymer melts[37,61]. Thus, it is necessary to explore how the swell behaviors of composites differ from those of a pure polymer. A second aim of this paper is to develop a single unified quantitative extrudate swell model for both pure polymers and their composites.
The following sections first present a unified theoretical equation to describe extrusion swell in both long capillaries and short capillaries. The evolution of the finite distance of extrudate swelling and the particular features of the swelling of filled composites are also detailed. Finally, comparisons are made between the predictions of the model and experimental data.
2. Theoretical Model
2.1. The extrudate swell theory for a long capillary
Up to now, most of the extrudate swell models have been established on the basis of the analysis of long capillary flow. The swell ratio B has been related to the recoverable shear strain (SR) or elastic strain energy[62]. One most pertinent systematic theories of extrudate swell of entangled polymeric liquids is that of Tanner, who first based his model on the K-BKZ constitutive equation and the free recovery from Poiseuille flow with the aspect ratio of length L to diameter D being very large[37]. The correlation was later confirmed for a wide class of constitutive equations, including PTT, pom–pom and general network type models for fully-developed tube flow[63]. It was found that the extrudate swelling ratio B may be expressed

Viscoelasticity – From Theory to Biological Applications 80
as a function of the first normal difference 1N and the shear stress 12 . Regardless of the fact that this clearly shows how the swell is related to the elasticity of viscoelastic polymeric fluids, the viscous heating and the time-dependent nature of swell are not considered.
More recently, Wang et al.[64,65] extensively exploited the variations of extrudate swell with both polymer characteristics ( nM , /n WM M and eM ) and the operational processing conditions. A double molecular mechanism of disentanglement-reentanglement and decoil-recoil was proposed to rationalize variations of polymer elasticity during flow with chain conformation. The die swell behavior essentially results from the molecular dynamics of the system. Thus, it is desirable to establish a single primary theoretical framework to relate the extrudate swell to the intrinsic viscoelasticity and external conditions.
There are three kinds of polymer segments and chains in the extrudates, which have been defined by Song[66] as extending chain, coil chain and entangled polymeric chain. Besides the change in chain conformation and the degree of reorganization of the constituent chains, the extension and flow can also induce the dynamic and reversible disentanglement and reentanglement between polymeric chains, such that the polymeric melts then undergo a partial stress relaxation leading to extrudate swelling at the die exit. The swell ratio is affected by the length to diameter ratio and the residence time. Based on such a viewpoint of dynamics, Song developed a novel molecular theory of such multiple entangled constituent chains in order to analyze non-linear viscoelasticity for the polymeric melts. His derived constitutive equations and material functions in a multiple-flow field were subsequently quantitatively verified[67]. Based on the O-W-F constitutive equation and the multiple transient-network model as well as the double relaxation dynamics of the reentanglement-disentanglement transition (RE-DT) and recoil-uncoil transition (RC-UCT) from the Poiseuille flow, Song proposed that swell evolves in three stages (instantaneous swelling, delayed swelling and ultimate extrudate swelling)[68]. A new set of swelling equations incorporating molecular parameters, operational parameters and growth time in both the steady state and dynamic state were developed. Song’s model successfully described the die swell through a long capillary of both linear polyethylene (HDPE) and linear polybutadiene (PBD) with the different molecular weights and different processing variables[69]. In this paper, Song’s extrudate swell theory will be extended in order to analyze both the die swell out of a short capillary and the swell of polymer composites.
In the steady shear flow, the shear viscosity can be written as
n00
0( ) / [1 ( ) ]
Ga
(1)
The above expression is verified by experimental data, and can also be deduced from the O-W-F constitutive equation together with molecular dynamics[69]. The coefficient of the first normal-stress difference 1 in the steady shear flow is
1
1 1/ 1/ 01 0 0
0( ) 2 / ( ) / 1
nan nn G
G
(2)

Die Swell of Complex Polymeric Systems 81
From experimental data of and 1( ) , the molecular parameters of the zero shear viscosity 0 , the equilibrium modulus 0G , and the exponents n and a can be determined. The approximate value of the ultimate extrudate swell B was obtained as Eq. (3) by Song[69]:
1/ (1 ) 1/20
0
1 (( ( ) / (1 ( / ) )) 5.098)2
n WB n L DG
(3)
B depends on both the molecular parameters and the operational variables [the capillary length to diameter ratio /L D and the shear rate or shear stress ]. (1 )W is the fraction of the recoverable conformation of the entangled polymeric chain in the flow, which can be calculated from the experimental swell ratio data by Eq. (4).
24
1/0
0
2ln(4 5.098)(1 )
ln( ( ) / (1 ( / ) ))n a
BBW
n L DG
(4)
Details of the derivation of the above equations (3) and (4) and their application to the extrudate swell of HDPE and PDB are given by Song[69]. Eq.3 may also be expressed in the form as shown in Eq. (5), where equB is the die swell ratio at /L D , and m is the shear
rate-dependent constant.
(1 ( / ) )
rm
equ abB BL D
(5)
2.2. Finite extrudate swell distance
As discussed above, the swelling evolves with time after the polymer is extruded from the capillary, during which time the molecules continue to exhibit similar disentanglement-reentanglement transitions and uncoil-recoil transitions to those occurring whilst it is still inside the capillary. To describe this phase, Eq. (3) can be reformulated as Eq. (6) by introducing two parameters tk and wf :
1/ (1 )0
0
1 ( ( ( ) / (1 ( / ) )) 5.098)2
wfn WtB k n L D
G
(6)
Here wf is a variable which replaces the fixed value of 0.5 used by Song[69] in Eq. (3) and the coefficient tk describes the evolution of the extrudate swell with time. tk may be written as
0 0 01 ln( / ) / (1 ( / ) )tk A t t G (7)

Viscoelasticity – From Theory to Biological Applications 82
As the swell approaches a maximum at t t , tk approaches unity corresponding to the model used by Song[69]. However in contrast to Song’s model, in practice t is not infinite and actually has a finite value which can be determined experimentally[70], i.e., the maximum ultimate swelling will be realized at time t along the extrusion distance. If the extrusion distance is expressed as Z D , where D is the capillary diameter and Z is a numerical factor, t and Z can be correlated as follows from the shear rate,
8 /nt k Z (8)
where nk is a constant for a given material, whose approximate value is
(1 3 ) / 4nk n n (9)
where n is the constitute exponent of the fluid. From Eqs. (7)–(9), it can be shown that
ln ln ln ln1 ( )
tn
kt k Z
(10)
Eq. (10) can be rewritten as Eq. (11).
ln( * ) ln ln1 ( )
tn
kt Z k
(11)
Thus, either Eq. (10) or Eq. (11) can be used to predict the time of maximum swelling and the corresponding swell distance.
2.3. Extrudate swell theory for a short capillary
The above model is based on the assumption that the chain elongation incurred on reservoir entry is fully relaxed in the capillary. This is only approximately true for extrusion in a long capillary and a very poor assumption for a short capillary where the the entry flow is more complicated and the entry effect is more prominent[71]. Liang[72] reported the results of many swelling experiments using a short capillary and some quantitative empirical relations between the swell ratio and the material characteristics and operational parameters have been obtained[37,70,73]. In this paper, we attempt to modify Song’s model in order to describe the swelling behavior in short capillary extrusion.
Liang[74] described the die swell ratio as follows,
1/2(1 )l RB S (12)
1/21( / 2 )RS N (13)
00.5tanl (14)

Die Swell of Complex Polymeric Systems 83
where RS is the recoverable shear strain; l shows the elastic strain induced by the stored energy in the capillary reservoir, which is related to the capillary geometry and the fluid viscoelasticity; l is a function of the entry converging flow parameter; 0 is the half-entry convergence angle of a viscoelastic fluid, which is given by a function of the constitute exponent n of the fluid, the entry pressure drop P and the ratio of the capillary diameter D to its reservoir diameter rD . The pressure loss in the entry region can be approximately expressed in terms of the Bagley entrance correction factor ( e ).
1.5( 1) 1.5( 1)
04(1 ( / ) ) 2 (( / ) 1)1tan [ ]
3( 1) 3(1 )
n nr rD D D D
e n n
(15)
12P
e
(16)
The total die swell ratio in Eq. (3) can be approximated as Eq. (17), which has the same form as Eq. (12).
1 1/2(5.098 / 4 / 4)wRB S (17)
Eq. (17) can be modified to describe the extrudate swell out of a short capillary, as shown in Eq. (18),
(1 )1 ( ( ) 5.098 / 4)2 4
wfWt L R
MB k k S (18)
where tk is the time-dependent coefficient reflecting the swelling evolution as defined by
Eq. (7) and 0(1 )1 ( )
[ ]1 ( / )
a
L a
wk
L D
shows the effects of capillary length, i.e., the degree of
relaxation. / 4M is the recoverable effect from the stored energy in the capillary reservoir. It may be ca. 1 for a sufficiently long capillary while it may be l for a very short capillary as defined by Eq. (14). Thus, Eq. (18) may be used for both long and short capillaries since it includes sufficient variables, whereas Eq. (3) is only appropriate for long capillaries.
2.4. Extrudate swell theory of filled composites
In particle-filled composites, the filler is distributed in an entangled matrix network and the filling affects the network relaxation[74]. Regardless of the variation in viscoelastic properties, it has been found experimentally that the values of and 1( ) for filled composites are similar to those of the pure polymer matrix, i.e., the above extrudate swell theory may be modified for use with filled composites.
However, experiments have shown that the die swell is usually weakened with increasing filler concentration [75]. This suggests that the die swell of a composite can be expressed by Eq. (19),

Viscoelasticity – From Theory to Biological Applications 84
( , ) ( , 0) ( )B B F (19)
where ( , )B and ( , 0) mB B are the die swell of the composite with a filler content of and the die swell of the pure matrix, respectively, and ( )F is the filling effect. Eq. (19) implies that the viscoelastic behavior of the filled composites is dominated by the elasticity of the composite matrix in the high shear rate range. Liang[75] found that (1 )wB , where w was the wall shear stress, and and were constants related to the elasticity of the matrix melt and the geometry of the filler particles, respectively. The function ( )F is analogous to those used for the viscosity of a suspension of spheres, and may be called a ‘concentration shift factor’[76]. There are several forms for ( )F . Here we use the form shown in Eq. (20),
( ) [1 ( / ) ]pkcF (20)
( / )qc c (21)
where k , p and q are constants which depend on the filler-polymer system and the flow field; c is the percentage decrease of the network elasticity caused by filling with the particles, which is directly related to the shear rate as described by Eq. (21); c is the limiting shear rate when the network is almost completely destroyed, in accordance with percolation theory. An approximation to Eq. (21) may be rewritten in stress form as Eq. (22).
'( / )qc c (22)
3. Comparison of die swell given by the model with experiment
3.1. Experimental data
For comparison of the predicted swell ratios using the model described above with experimental data, several sets of raw swell data were taken from the literature and replotted in appropriate formats.
In testing the validity of the model for a system with large L/D, the rheometric and swell data of a pure IUPAC-LDPE standard was used as shown in Figures 1 and 2 [77,78]. The capillary had die diameter 3.00D mm and experiments were carried out at 150℃.
To show whether the model is valid in analyzing the maximum extrusion distance during swelling, we used the data for a semi-dilute polymer solution of a partially hydrolyzed polyacrylamide manufactured by Rhone Poulenc (Rhodoflood AD37, Mw= 6 x 10⁶, degree of hydrolysis = 24%)[70]. Purified water containing 20 g/l of NaCl was employed as a solvent for the polymer. The polymer concentration was 3000 ppm. The swell tests were conducted in a stainless steel capillary with length of 51 mm and inner diameter of 0.60 mm.
Die Swell of Complex Polymeric Systems 85
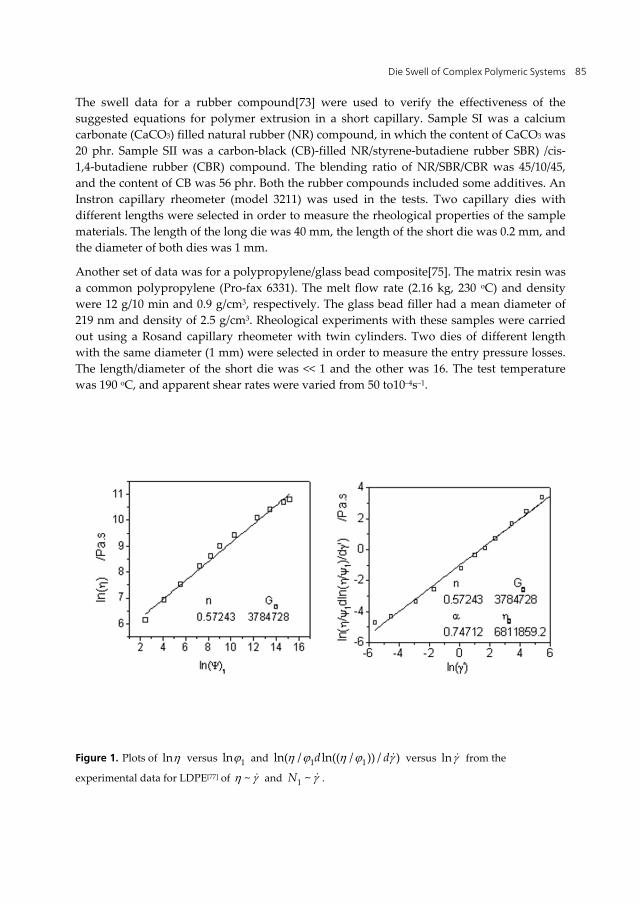
The swell data for a rubber compound[73] were used to verify the effectiveness of the suggested equations for polymer extrusion in a short capillary. Sample SI was a calcium carbonate (CaCO3) filled natural rubber (NR) compound, in which the content of CaCO3 was 20 phr. Sample SII was a carbon-black (CB)-filled NR/styrene-butadiene rubber SBR) /cis-1,4-butadiene rubber (CBR) compound. The blending ratio of NR/SBR/CBR was 45/10/45, and the content of CB was 56 phr. Both the rubber compounds included some additives. An Instron capillary rheometer (model 3211) was used in the tests. Two capillary dies with different lengths were selected in order to measure the rheological properties of the sample materials. The length of the long die was 40 mm, the length of the short die was 0.2 mm, and the diameter of both dies was 1 mm.
Another set of data was for a polypropylene/glass bead composite[75]. The matrix resin was a common polypropylene (Pro-fax 6331). The melt flow rate (2.16 kg, 230 oC) and density were 12 g/10 min and 0.9 g/cm3, respectively. The glass bead filler had a mean diameter of 219 nm and density of 2.5 g/cm3. Rheological experiments with these samples were carried out using a Rosand capillary rheometer with twin cylinders. Two dies of different length with the same diameter (1 mm) were selected in order to measure the entry pressure losses. The length/diameter of the short die was << 1 and the other was 16. The test temperature was 190 oC, and apparent shear rates were varied from 50 to10–4s–1.
Figure 1. Plots of ln versus 1ln and 1 1ln( / ln(( / )) / )d d versus ln from the
experimental data for LDPE[77] of ~ and 1 ~N .

Viscoelasticity – From Theory to Biological Applications 86
3.2. Comparison of the predicted values of swell ratio with the experimental data
3.2.1. Swelling simulations for pure LDPE extruded from capillaries with different L/D ratios
The dashed curves in Figure 2 present the experimental data[77] of extrudate swell ratio for LDPE for different capillary /L D ratio and shear rates from which (1 )W can be calculated assuming 1tk using Eq. (4), as listed in Table 1. wf is determined by fitting B against /L D under different shear rates.
In addition, the swell ratio was also fitted by 0 ( / )BB B k L D as suggested by Liang[75] (as shown by the dotted curves in Figure 2) and by Eq. (5) (as shown by the solid curves in Figure 2). The resulting values of key parameters for the three cases are compared in Table 1.
n 0G /Pa a 0 /Pa.s
0.57243 3784728 0.74712 6811860
IUPAC-LDPE
Dashed curves By Eq. (3) ( 1tk )
Dotted curves by 0 ( / )BB B k L D
Solid curves by / (1 ( / ) )a
equB B b L D
1 W wf 0B Bk equB b
10 0.74 0.36 1.83 0.0021 1.573 2.4906
1 0.64 0.39 1.70 0.00185 1.561 1.9614
0.63 0.58 0.43 1.69 0.00125 1.557 1.6841
0.1 0.45 0.47 1.38 0.00030 1.316 0.7806
Table 1. Values of parameters for LDPE obtained from the plots in Figures 1 and 2
Figure 2. Predicted curves and experimental data of extrudate swell ratio for LDPE with different capillary L/D ratio and shear rates.

Die Swell of Complex Polymeric Systems 87
The comparisons of swell ratio predicted by Eq. (3), 0 ( / )BB B k L D and Eq. (5) are also compared with experimental data (points) in Figure 2. All three models predict that the swell ratio decreases with increasing capillary L/D ratio and increases with increasing shear rate. It is also found that all three equations describe well the approximate linear relationship between the experimental swell ratio and L/D at larger values of L/D, i.e., in long capillaries. However, below a certain critical value of L/D, B increases rapidly with decreasing L/D. This trend is well predicted by Eq. 5 only. Liang’s model[77] 0 ( / )BB B k L D gives a completely different picture to experiment. Song’s model Eq. (3) underestimates the swell ratio compared with experiment, showing that Eqs. (3) and (4) are only appropriate for swelling on extrusion from a long capillary, because of the assumption in Song’s theory[69] that the entry effect is almost relaxed in capillary flow. In a short capillary, the chain elongation on entry cannot be neglected. The critical L/D ratio, which determines whether a capillary behaves as ‘long’ or ‘short’, increases with shear rate. This may be explained by the more incomplete relaxation of the elongated chains in the entry region at higher shear rate. The degree of relaxation depends on both the capillary length and the strength of the flow field as described by Eq. (5).
3.2.2. Extrusion distance giving the maximum swell ratio for semi-dilute polymer solutions
For a capillary with a L/D ratio of 85, the swelling of polyacrylamide solution was observed to reach a maximum at a given time t at a given distance (expressed as a multiple Z of capillary diameter D ) from the capillary[70], i.e., the swelling is finite. In the simulations, n , a and 0 were obtained by fitting the experimental ~ curve[70] using Eqs. (1) and (2).
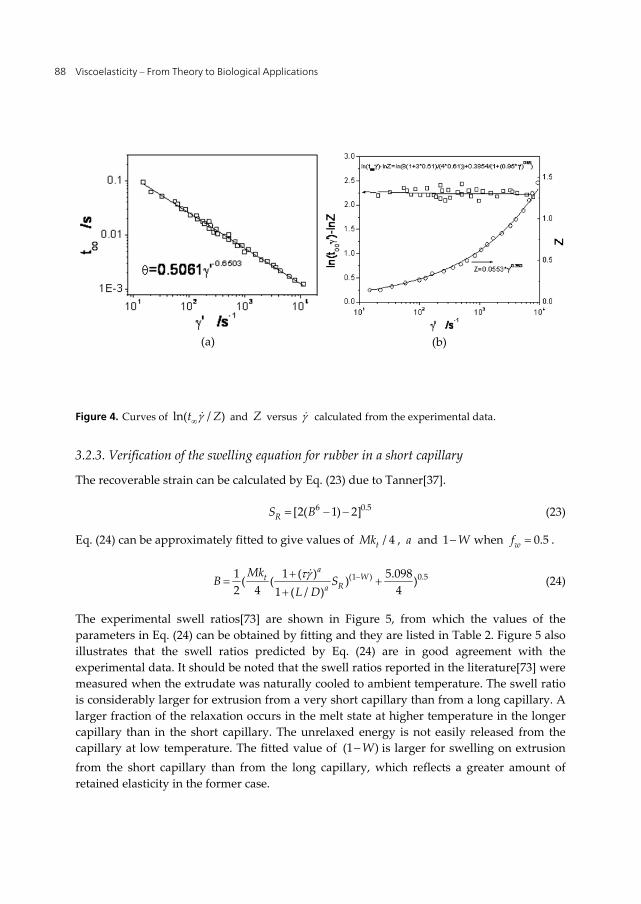
tK and (1 )W can be fitted using Eq. (3). t and Z were subsequently calculated from Eq. (11) and compared with the experimental data as shown in Figure 3. The calculated swell ratio B is close to the experimental data for 3.5468tK and (1 ) 0.5964W . The simulated value of t decreases as a power law function of shear rate as observed from the experimental data in Figure 4a, as does Z as shown in Figure 4b.
Figure 3. Calculated plots of B versus from the experimental data for a semi-dilute polymer solution
Viscoelasticity – From Theory to Biological Applications 88
Figure 4. Curves of ln( / )t Z and Z versus calculated from the experimental data.
3.2.3. Verification of the swelling equation for rubber in a short capillary
The recoverable strain can be calculated by Eq. (23) due to Tanner[37].
6 0.5[2( 1) 2]RS B (23)
Eq. (24) can be approximately fitted to give values of / 4tMk , a and 1 W when 0.5wf .
(1 ) 0.51 1 ( ) 5.098( ( ) )2 4 41 ( / )
aWt
Ra
MkB S
L D
(24)
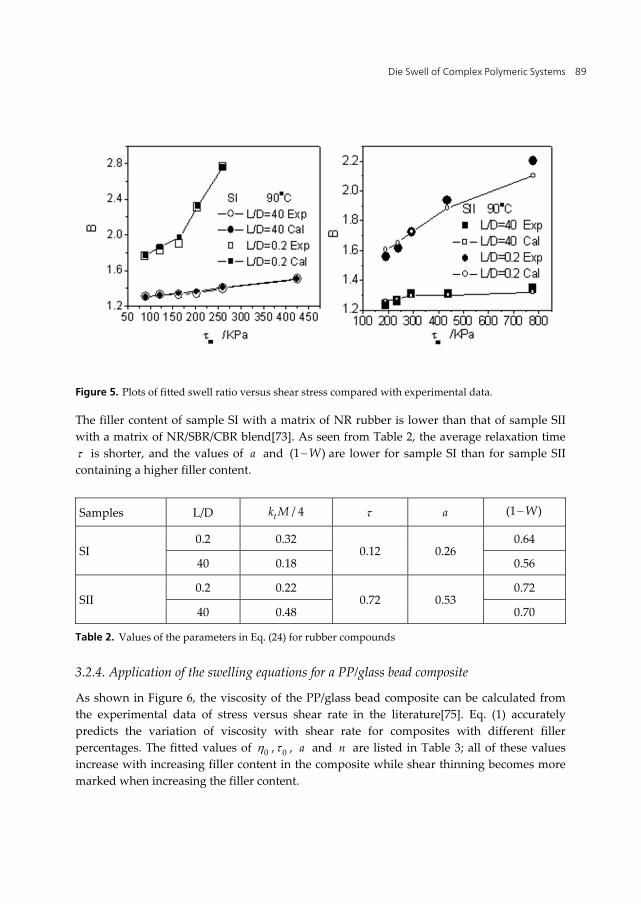
The experimental swell ratios[73] are shown in Figure 5, from which the values of the parameters in Eq. (24) can be obtained by fitting and they are listed in Table 2. Figure 5 also illustrates that the swell ratios predicted by Eq. (24) are in good agreement with the experimental data. It should be noted that the swell ratios reported in the literature[73] were measured when the extrudate was naturally cooled to ambient temperature. The swell ratio is considerably larger for extrusion from a very short capillary than from a long capillary. A larger fraction of the relaxation occurs in the melt state at higher temperature in the longer capillary than in the short capillary. The unrelaxed energy is not easily released from the capillary at low temperature. The fitted value of (1 )W is larger for swelling on extrusion from the short capillary than from the long capillary, which reflects a greater amount of retained elasticity in the former case.
(a) (b)
Die Swell of Complex Polymeric Systems 89
Figure 5. Plots of fitted swell ratio versus shear stress compared with experimental data.
The filler content of sample SI with a matrix of NR rubber is lower than that of sample SII with a matrix of NR/SBR/CBR blend[73]. As seen from Table 2, the average relaxation time is shorter, and the values of a and (1 )W are lower for sample SI than for sample SII containing a higher filler content.
Samples L/D / 4tk M a (1 )W
SI 0.2 0.32
0.12 0.26 0.64
40 0.18 0.56
SII 0.2 0.22
0.72 0.53 0.72
40 0.48 0.70
Table 2. Values of the parameters in Eq. (24) for rubber compounds
3.2.4. Application of the swelling equations for a PP/glass bead composite
As shown in Figure 6, the viscosity of the PP/glass bead composite can be calculated from the experimental data of stress versus shear rate in the literature[75]. Eq. (1) accurately predicts the variation of viscosity with shear rate for composites with different filler percentages. The fitted values of 0 , 0 , a and n are listed in Table 3; all of these values increase with increasing filler content in the composite while shear thinning becomes more marked when increasing the filler content.

Viscoelasticity – From Theory to Biological Applications 90
Figure 6. Experimental data for variation of viscosity with shear rate and the simulated values for the composites.
Filler content n 0 /s a 0 /kPa.s
5% 0.2071 1.31785 1.6011 2.2607 10% 0.2175 1.47162 1.6849 2.8496 15% 0.3812 1.85625 1.7210 3.5809
Table 3. Structural parameters for PP/glass bead composites
Figure 7. Comparison of predicted swell ratio with experimental data for PP/glass bead composites.
Eq. (6) can be used to predict the extrudate swell ratio of the composites with the fitted structural parameters listed in Table 3. Comparison of the predicted data with the experimental values are shown in Figure 7, assuming 1tk . The modified theory shows better agreement at higher shear rate which indicates its validity for particulate-filled composites. Table 4 shows that (1 )W , which is the residual fraction of the recoverable entanglement in polymeric chains after flow shear, decreases with increasing filler content. Smaller values of (1 )W correspond to lower elastic recovery, i.e., swell ratios are lower for composites with higher filler content. Furthermore, it can be seen that wf decreases (from

Die Swell of Complex Polymeric Systems 91
0.5137 0.5wf for the pure matrix melt) to lower values with increasing filler concentration. This shows that recovery is harder for an entangled network with higher filler content than for the corresponding matrix network.
Dashed curves given by Eq. (3) Dotted curves given by ( / ) bmcbB
Filler content 1 W wf cb Bm 0 0.56165 0.5137 127.51 0.16 5% 0.55176 0.5003 138.73 0.1307 10% 0.53287 0.4400 153.45 0.09821 15% 0.49195 0.4217 169.62 0.08876
Table 4. Values of model parameters in the equations for the composite in Figure 7
In addition, it is interesting that the swell is well depicted by one simple equation ( / ) bm
cbB . cb may be related to the composite rigidity or the density while Bm is sensitive to the shear, reflecting the recovery capability of the composites. When increasing the filler content in the composite, cb becomes larger while Bm becomes smaller, showing that the elasticity is weakened while the rigidity becomes stronger, which corresponds to the observed decrease in swell ratio.
Figure 8. Comparison of plots of ( , ) / ( , 0)B B versus shear rate with experimental data.
Plots of ( , ) / ( , 0)B B against shear rate based on the experimental data in Figures 6 and 7 are shown in Figure 8. The concentration shift factor ( ) [1 / ]cF (here k and p in Eq. (20) are both unity) illustrates the reinforcement effect while reflecting the weaker swelling capability. In our opinion, there are two levels of network structure. The microscopic one involves molecular entanglement, whilst the other involves mesoscopic particles dispersed in the compound melt. The concentration shift factor shows that the swelling functions of the two levels may be separated. The mesoscopic network probably shrinks, counteracting part of the microscopic melt swelling. The offset effect can be described by the concentration shift factor. However, the filler is far larger than the polymer chains and does not vary the basic molecular relaxation dynamics of the melt matrix except

Viscoelasticity – From Theory to Biological Applications 92
at the interfacial region around the particles. The dispersed particles perturb the flow of the melt. It is interesting that this is consistent with previous publications showing that the dimensions of the extrudate were possibly smaller than those of the die at higher Reynolds numbers[41,42].
In addition, Eq. (21) is also successful in fitting the plots of ( , ) / ( , 0)B B against as
Figure 8. c increases while q decreases when adding more glass beads to the
polypropylene. To a certain degree, c represents a critical shear rate when the melt swelling is completely offset by the shrinkage of the mesoscopic network.
Filler content c q
5% 1.249E10 0.2616
10% 2.945E13 0.1694
15% 6.188E15 0.1482
Table 5. Parameters in Eq. (19) (p=1) for the composite in Figure 5
Plots of die swell versus filler concentration[75] are shown in Figure 9. Eq. (20) well demonstrates this correlation. In fitting the data with Eq. (20), it is found that with increasing shear rate the critical content c decreases, while the die swell ratio at 0 increases. Larger die swell ratios are observed for pure PP at higher shear rates, since more elastic energy is stored.
Figure 9. Extrudate swell ratio of PP/glass bead composites with different filler contents.
( , 0) ( , ) / ( )B B F is also appropriate for correlating shear stress and filler content for the composite as shown in Figure 10. In this case, in the expression '( / )q
c c c increases while 'q decreases with increasing filler content. More importantly, ( , ) / ( )B F , i.e., ( , 0)B is almost a linear function of shear stress. It can be written as
0( , ) / ( ) ( / )B F B F k where 0B and k decrease with increasing amount of filler in the PP melt.

Die Swell of Complex Polymeric Systems 93
Figure 10. Plots of ( , ) / ( )B F versus shear stress from experimental data for PP/glass bead composites.
4. Conclusions
Two limitations of Song’s polymer extrudate swell theory have been identified for the first time. Song’s model has been modified in order to predict the finite distance at which the swelling reaches a maximum. Furthermore, the model was extended to describe the die swell on extrusion from a short capillary by considering the entry effect in Song’s molecular dynamics model and incorporating Liang’s expression. The resulting modified model can be applied to extrusion swelling for both long and short capillaries, whereas Song’s model is only appropriate for long capillaries. More importantly, the modified model is also suitable for analysis of the swelling of particle-filled composites which cannot be treated by Song’s model. The composite swell ratio can be separated into the product of the matrix swell ratio and the concentration shift factor. The excellent agreements between the values predicted by the modified model and experimental data reported in the literature for a variety of different systems demonstrate its viability for a wide range of materials and experimental conditions.
Author details
Kejian Wang* Institute of Plastics Machinery and Engineering, Beijing University of Chemical and Technology, Beijing, China
5. References
[1] Liang J.Z. Plast Rubber Compos Process Appl 1991; 15, 75-79. [2] Liang J. Z. J Mater Process Technol 1995; 52, 207-215. [3] Lodge A.S. Elastic Liquids, Academic Press, New York, 1964.
* Corresponding Author

Viscoelasticity – From Theory to Biological Applications 94
[4] Graessley W.W., Glasscock S.D. and Crawley R.L. Trans. Soc. Rheol. 1970; 14: 519–544. [5] Wong A.C.Y. J. Mater. Proc. Tech. 1998;79:163–169. [6] Koopmans R.J. J. Appl. Polym. Sci. 1992; 32:1755-1762. [7] Liang J.Z. Plast. Rubber Proc. Appl. 1995;23: 93-96.. [8] Seo Y. J. Appl. Polym. Sci. 1990;30:235-240. [9] Richardson S. Rheol. Acta 1969;9 :193-199. [10] Koopmans R.J. J. Appl. Polym. Sci. 1992;32:1750-1767. [11] Koopmans R.J. J. Appl. Polym. Sci. 1992;32:1741-1750. [12] Swan P.L., Dealy J.M. Polym. Eng. Sci. 1991;31:705–710. [13] Larson R.G., Constitutive Equations for Polymer Melts and Solutions, Butterworths,
Boston, 1988. [14] Giesekus H. J. Non-Newtonian Fluid Mech. 1982;11:69–109. [15] White J.L. Rubber Chem. Technol. 1977; 50: 163–185. [16] Spencer R. S., Dillon, R. E. J Colloid Sci 1948; 3, 163-171. [17] Schreiber H.P., Rudin A., Bagley E.B. J. Appl. Polym. Sci. 1965; 9:887–892. [18] Metzner A.B. Trans. Soc. Rheol. 1969;13:467–470. [19] Brydson J.A. Flow Properties of Polymer melts. London: The Plastic Institute. 1981. [20] Cogswell F.N. Plast. Polym. 1973; 41: 39–43. [21] Shaw M.T. Polym. Eng. Sci. 1977; 17: 266–268. [22] Rogers M.G. J. Appl. Polym. Sci. 1970;14 :1679–1689. [23] Racin R., D.C. Bogue, J. Rheol. 1979;23:263–280. [24] Mendelson R.A., F.L. Finger, J. Appl. Polym. Sci. 1975;19:1061–1078. [25] Rokudai M. J. Appl. Polym. Sci. 1981;26:1427–1429. [26] Liang J. Z., Nes J. N. s, Polymer Testing 1999;18:37–46, [27] Dufrancatel-Veiller L., Lacrampe M. F., Pababiot J. J. Appl. Polym. Sci. 2001;80:1710–
1724. [28] Minagawa N. and White J.L. J. Appl. Poly. Sci. 1976; 20: 501–523. [29] Han C. D. Rheology in Polymer Processing; Academic: New York, 1976. [30] Cotten G.R. Rubber. Chem. Technol. 1979; 52: 187–198. [31] Lenk R.S. Polymer Rheology. London: Applied Science Publishers Ltd. Ch.10, p.101.
1978 [32] Vinogradov G.V. and Malkin A.Y. Rheology of Polymers: Viscoelasticity and Flow of
Polymers, Moscow: Mir Publishers. Ch. 5, pp. 355–379,1980. [33] Rapeephun D., Jimmy Y., Pitt S. Polymer Testing 2005;24:2–11. [34] Nattaya M., Manit N., Brian P. Gradyb, Rathanawan M. Polymer Testing 2008;27:470–
479 [35] Bagley E.B., Duffey H.J., Trans. Soc. Rheol. 1970; 14:454-459. [36] Han C.D., Charles M. Trans. Soc. Rheol. 1970;14:213–218. [37] Tanner R. I. J. Polym. Sci. Part A-2: Polym. Phys. 1970; 8:2067-2071. [38] Tanner R.I. J. Non-Newtonian Fluid Mech. 1980;6:289-302. [39] Crochet M.J., Keunings R. J. Non-Newtonian Fluid Mech. 1980; 7:199–212.

Die Swell of Complex Polymeric Systems 95
[40] Barakos G., Mitsoulis E. J. Rheol. 1995;39:193–209. [41] Middleman S. Fundamental of Polymer Processing. New York: Magraw-Hill. 1977. [42] Georgiou G.C., Papanastasiou T.C. and Wilkes, J.O. AIChE. J. 1988; 34:1559–1562. [43] Utracki, L.A., Bakerdjian, Z. and Kamal, M.R. J. Appl. Polym. Sci. 1975;19: 481–501. [44] Meissner J. Pure Appl. Chem. 1975; 42: 551–612. [45] Macosko C.W. Rheology, Principles, Measurements, and Application. New York:
Wiley-Vch. Ch. 6, pp. 236–260, 1990. [46] Treloar L.R.G. The Physics of Rubber Elasticity. 3rd Edn., Oxford: Clarendon Press. 1975. [47] Barone J.R., Plucktaveesak N. and Wang S.Q. J. Rheology1998; 42: 813–832. [48] Huang D., White J. L. Polym Eng Sci 1980; 20, 182-186. [49] J.den Doelder C.F., Koopmans R.J. J. Non-Newt. Fluid Mec. 2008; 152(1-3): 195-202. [50] Muksing N., Nithitanakul M., Grady B.P. and Magaraphan R. Polym. Testing 2008;
27(4): 470-479. [51] Kumari K., Kundu P.P., Bulletin of Mater. Sci. 2008;31(2):159-167. [52] Ayutthaya S., Isarankura N., Wootthikanokkhan J., J. Appl. Polym. Sci.
2008;107(6):3853-3863. [53] Mitra S., Chattopadhyay S., Bhowmick A.K., J. Appl.Polym.Sci. 2008; 107(5): 2755-2767. [54] Rowell R.M., J. Polym. Environ., 2007; 15(4):229-235. [55] de Paulo G.S., Tome M.F., McKee S. J. Non-Newtonian Fluid Mech. 2007; 147(3):149-174. [56] Mitsoulis E., J. Fluids Eng. Trans.of the ASME2007; 129(11):1384-1393. [57] Mohanty S., Nayak S.K., Polym. Eng. Sci. 2007; 47(10):1634-1642. [58] Peng B., Wu H., Guo S.Y., Lai S.Y., Jow J., J. Appl. Polym.Sci. 2007;106(3):1725-1732. [59] Liang J.Z., Li R.K.Y., Tang C.Y. and Cheung S.W. J. Appl. Polym. Sci. 2000; 76:419–424. [60] Faulkner D.L., Schmidt L.R. Polym. Eng. Sci. 1977;17,657–667. [61] Bush M.B., Polym. Eng. Sci. 1993; 33, 950-958. [62] Kamal K.K. and Joshua U.O. J. Elast. Plas. 2001;33:297-336 [63] Tanner R. I. J. Non-Newtonian Fluid Mech. 2005;129:85–87. [64] Tapadia P., Wang S.Q. Macromolecules 2004;37:9083-9099. [65] Zhu Z Y, Wang S Q , J Rheol. 2004;48(3):571-578. [66] Song M S, Hu G X, Yang Z H, Xu Q , Wu S Z. J Mater Sci Tech. 2006; 22(1), 93-115. [67] Song M S, Xu Q, Hu G X and Wu S Z, J Mater Sci Tech. 2006;22(5):664-686. [68] Zhu C W, Song M S, Hu G X, Zhao J and Wu D M. Chin J Chem Phys. 2007;20(5): 563-581. [69] Zhao J., Song M.S., Zhu C.W., Hu G.X., Wang K.J., Wu D. M. Chin. J. Chem. Phys. 2008;
21(1):55-88. [70] Allain C., Cloitre M. and Perrot P. J. Non-Newtonian Fluid Mech. 1997; 73,51-66. [71] Zheng R, Tang G J, Polymer communication 1986;3:161-172 [72] Liang, J. Z. J Mater Process Technol 1996; 59: 268-276. [73] Liang J.Z., J. Appl. Polym. Sci. 2007; 104:70–74. [74] Stabik J., Inter Polym Process 2004; 19(4):350-355. [75] Liang J.Z. Polymer Testing 2002; 21:927–931. [76] Gleissle W., Hochstein B. J. Rheol. 2003;47:897–910.

Viscoelasticity – From Theory to Biological Applications 96
[77] Huang S.X., Lu C.J. J. Non-Newtonian Fluid Mech. 2006; 136:147–156. [78] Meissner J. Pure Appl. Chem. 1975; 42,551–612.