Did First-Mover Advantage Survive the Dot-Com Crash?*
42
Did First-Mover Advantage Survive the Dot-Com Crash?* Marvin B. Lieberman Anderson Graduate School of Management UCLA Los Angeles, CA 90095-1481 Email: [email protected] October 17, 2002 Do not cite or quote without permission ________________________________________________________________________ *This paper has benefited from comments by seminar participants at Wharton, Emory, UCLA and the 2002 Utah Strategy Conference. I thank former students in my course, “Business Strategy and the Internet,” for their appraisals of specific Internet markets, which provided background information for this study. I am particularly grateful to Andrew Bachman and David Binetti, who collected the initial data set, and David Choi, Jeffrey Brown and Tatsuo Ushijima, who enlarged the sample. Anand Bodapati and Vernon Richardson alerted me to data sources, and Marc Usem of Usem-Bergstrand Capital Management provided assistance with the financial data. All errors are my responsibility alone. The Price Center for Entrepreneurship at UCLA provided financial support.
Transcript of Did First-Mover Advantage Survive the Dot-Com Crash?*

Did First-Mover Advantage
Survive the Dot-Com Crash?*
Marvin B. Lieberman
Anderson Graduate School of Management UCLA
Los Angeles, CA 90095-1481
Email: [email protected]
October 17, 2002
Do not cite or quote without permission
________________________________________________________________________
*This paper has benefited from comments by seminar participants at Wharton, Emory, UCLA and the 2002 Utah Strategy Conference. I thank former students in my course, “Business Strategy and the Internet,” for their appraisals of specific Internet markets, which provided background information for this study. I am particularly grateful to Andrew Bachman and David Binetti, who collected the initial data set, and David Choi, Jeffrey Brown and Tatsuo Ushijima, who enlarged the sample. Anand Bodapati and Vernon Richardson alerted me to data sources, and Marc Usem of Usem-Bergstrand Capital Management provided assistance with the financial data. All errors are my responsibility alone. The Price Center for Entrepreneurship at UCLA provided financial support.

2
Did First-Mover Advantage Survive the Dot-Com Crash?
ABSTRACT
Strong expectations of first-mover advantages led to a rush of market entrants during the early
growth phase of the Internet sector. More recently, the sharp decline in the value of Internet
companies has led many to question these early beliefs. This study assesses the magnitude and
sources of first-mover advantages in 46 Internet markets, based on data for more than 200
publicly traded entrants. The findings show a large premium in stock market capitalization for
early entrants in markets with network effects, and for pioneers with patented innovations.
Absent these factors, however, first-mover advantages appear minimal. The first-mover
premium has been persistent in that pioneers have maintained high market valuations relative to
peers, even though the value of the Internet sector has fallen. Similar results apply when
performance is measured in terms of revenues or company survival.

3
1. Introduction
Internet commerce in the late 1990s was widely characterized as a “land grab” where firms
rushed to acquire market positions before competitors had an opportunity to do so. Some
pioneering entrants—such as Amazon, Yahoo and eBay—gained enormous stock market
capitalization as investors anticipated that early entry would translate into large financial returns.
High market valuations and widespread belief in first-mover advantages sustained a gold rush
mentality among Internet entrants. Once the bubble burst in mid-2000, however, serious
doubts arose about the validity of such views.
Was the perception of first-mover advantages an illusion, as Michael Porter (2001) has
claimed? Others have asserted that Internet first-mover advantages exist, but managers vastly
overestimated their importance (Adner and Rangan, 2001). Typically, such assessments have
been impressionistic rather than rooted in systematic empirical analysis. The aim of the present
study is to provide a more comprehensive appraisal of the extent of first-mover advantages in
Internet markets. The study draws upon a broad sample of Internet entrants and tests for
specific conditions under which first-mover advantages might be expected to arise. The results
show advantages for early entrants in markets with network effects, and for pioneers with
patented innovations. Absent these factors, first-mover advantages appear minimal.
The sudden rise of Internet commerce can be viewed as a natural experiment that offers a
unique research opportunity. Many new “market spaces”1 were created almost simultaneously
by a common technology shock. A large proportion of Internet entrants became publicly
traded, often within a year or two of founding, leading to the availability of extensive information
1 In this study, the term “market space” refers to an Internet market or sub-market that is reasonably well defined in terms of the product or service and the competitor set. Methods for identifying the competitor set are described Section 3.

4
on stock market value, revenue, and other factors. Thus, the rise of Internet commerce
provides a unique laboratory for studying the effects of entry timing on firm performance.
This paper proceeds as follows. The next section outlines potential sources of first-mover
advantage in Internet-related markets. It gives special consideration to the role of “network
effects,” which are commonly believed to play an important role in the Internet sector. Section
3 describes the study’s methodology and data sample, covering more than 200 entrants in 46
market spaces. Section 4 presents the statistical tests, which consider whether pioneering firms
maintained higher market capitalization or revenue than their peers, controlling for various
factors. The tests show a large premium in stock market capitalization for early entrants in
markets with network effects, and for firms with patented innovations. Section 5 concludes with
an assessment of the study’s findings and limitations.
2. Potential Sources Of First-Mover Advantages in Internet Markets
First-mover advantages accrue to a firm that gains a first-mover opportunity (through
proficiency or luck) and is able to maintain an edge despite subsequent entry. In their
conceptual survey, Lieberman and Montgomery (1988, 1998) refer to four types of
mechanisms that can sustain a first-mover advantage: (1) proprietary technology, (2)
preemption of scarce resources, (3) customer switching costs, and (4) network effects. The
discussion below considers these four potential sources of first-mover advantage in the Internet
sector, with particular attention given to network effects.
Proprietary Technology
Many observers have noted that the transparency of most Internet business methods makes
imitation by competitors relatively easy. Thus, the Internet would appear to offer relatively
limited opportunities to support first-mover advantages through proprietary technology.

5
Secrecy, the most common method for keeping technological advantage proprietary (Levin et
al, 1987), is virtually impossible in many parts of the Internet environment. Some Internet
pioneers have developed superior technology and sustained a temporary lead by racing down
the learning curve ahead of competitors, as firms such as Amazon have done. But in the
absence of patents and other means of intellectual property protection, the ability to sustain such
a lead for an extended period is open to question.
Patent activity by Internet companies remains well below the rates observed in most other
technology sectors. One notable exception is in the area of “business process” patents (e.g.,
Amazon’s patent on “one click” ordering, and Priceline’s patent for reverse auctions). Such
patents remain controversial, and some have questioned whether they can withstand future
challenges. In this study we consider the degree to which patents by Internet start-ups may
contribute to the sustainability of first-mover advantages.
Preemption of Superior Resources
Prior studies of first-mover advantages have shown that early market entrants may be able to
preempt superior resources of various types: physical assets, geographic positions, and
positions in customer perceptual space. In the Internet sector, however, resource preemption is
likely to be less important than in other industries. Physical assets are inconsequential for most
Internet companies, and human resources, while valuable, are highly mobile. Preemption of
superior positions in geographic space, an effective strategy for many brick and mortar
companies, is obviously irrelevant for Internet firms.2
Preemption of attractive positions in customer perceptual space may, however, be sustainable
and important for some Internet companies. Early entrants such as Yahoo, eBay and Amazon
invested heavily to nurture consumer recognition of their brands. These firms have also
2 One might, however, consider preemption of "domain names" on the Internet to be roughly equivalent to geographic preemption in more traditional industries. Even so, the market prices of superior domain names (which were often captured by early speculators) have fallen precipitously.

6
broadened their product lines to expand and defend their initial position. Subsequent entrants to
Internet markets in the late 1990s mounted huge advertising campaigns in an effort to develop
name recognition. By most accounts, though, these funds were largely wasted, even when firms
entered as pioneers in their market segments. One example is the Internet retailer eToys, which
established huge name recognition but nevertheless failed. Clearly, the ability of Internet
pioneers to capture strong customer perception has not been sufficient by itself to ensure
success or survival.
Customer Switching Costs
Early entrants may enjoy greater opportunities than followers to capture customers through
switching costs (also known as “lock-in” or “stickiness”). Switching costs arise in several
ways. For software products that require large initial investments by the buyer (e.g., e-
commerce transaction platforms) switching costs arise from the fixed cost nature of the basic
investment and incentives to maintain compatibility over time. Switching costs can also develop
more gradually as buyers gain experience with the seller’s product, and as the seller customizes
the product to conform to the buyer’s tastes. One example is the loyalty of many buyers to
Amazon.com: users grow accustomed to features of Amazon's site, which evolve to suit the
individual user’s preferences. These factors allow experienced buyers to search more efficiently
on Amazon than on the web sites of competitors. The resulting lock-in may be compounded by
a third source of switching costs, arising from the desire of buyers to avoid risk and uncertainty.
For example, as Amazon’s reputation for reliability has grown, many consumers are now willing
to pay the firm a premium to avoid the risk of loss or delay associated with purchases from an
unknown, but lower price vendor.
Network Effects
Network effects, the fourth category of mechanisms that support first-mover advantage, tend to
be more important in technology and communications-related industries than in the economy as

7
whole. The potential for network effects was a main reason why many expected substantial
first-mover advantages in Internet markets. Yet many entrants failed to think carefully about the
specific structural conditions under which network effects are likely to be important, and where
they are not.
Network effects (also known as network externalities, or demand side economies of scale)
arise when the value of a product or service to a given user increases with the number of other
users (Shapiro and Varian, 1999). The positive feedback that is generated causes the market
to tip in favor of the firm that emerges as the standard, potentially leading to a winner-take-all
market structure. Thus, in markets with network effects, the leading firm is likely to capture
disproportionate returns. Depending upon the magnitude of the feedback effect, the leading firm
may be able to drive out smaller rivals; and potential rivals may choose not to enter once a
strong bandwagon builds in favor of the leader. Thus, one might expect higher profits, and
perhaps fewer competitors, for the firm that emerges as the leader in a market with substantial
network effects.
While the first entrant into the market has the initial opportunity to exploit the network effect, in
many cases later entrants prove more successful. For example, Netscape introduced the first
commercial Internet browser, but Microsoft entered aggressively and emerged as dominant.
Thus, the presence of network effects gives the first-mover an opportunity but not a birthright
for success. To prevail, the pioneer must recognize and exploit the network opportunity, and
avoid challenges by later entrants who may try to leverage other strengths to build a dominant
network position.
Several different types of network effects can be observed in Internet markets. (This variety
among network effects seems to have been overlooked in the literature.) First, network effects
arise in environments where one firm serves as a “market maker,” coordinating among
numerous buyers and sellers who seek to transact in a common forum. Buyers seek a forum that
maximizes the number of sellers, and sellers seek to maximize the number of buyers. A single

8
forum is likely to emerge as the dominant meeting place (unless groups of buyers and sellers
have highly differentiated needs, leading to a more fragmented market). Internet examples
include eBay, the successful coordinator of consumer auctions; the Monster Board, which
serves a similar matching function in the job market; and DoubleClick, which coordinates
between advertisers and the owners of Web pages on which the ads are displayed. Findings
presented later in this paper suggest that Internet markets with this type of network externality
offer the potential for substantial first-mover advantages.
A second type of network effect arises from what is often called the “virtuous cycle.” A web
site or product with more visitors or customers than rivals becomes perceived as more
successful and is able to attract higher quality alliance partners. These alliances contribute to
further growth in the site’s customer base, leading to more alliances, and so on.3 Such feedback
loops have benefited Amazon, Yahoo, and other early Internet entrants. They were also a
factor in the browser wars, leading to the ascendancy of Microsoft's Internet Explorer over
Netscape—once Explorer attained the majority of users, outside software developers cut back
their support of Netscape in favor of Explorer. Such effects often arise in software markets,
where buyers are influenced to purchase the dominant product in order to maximize
compatibility.
A third type of network effect arises on the World Wide Web, given its nature as a medium for
channeling users among sites. Hyperlinks serve as a primary means of web navigation and can
easily be drawn from independent Web sites to a given company's site.4 Firms may provide
incentives for the creation of these inbound links; for example, Amazon's “Affiliates Program”
makes cash payments to owners of sites that lead customers to Amazon. Other things equal, a
commercial Web site with more inbound links (or more such links coming from influential sites)
3 A similar virtuous cycle operates in the case of “market makers” described above. The difference is largely one of degree: feedback is likely to be stronger when the site serves an explicit matching function where buyers and sellers both seek a broad choice set. 4 In addition to such inbound links, firms make outbound links from their Web site to others. The most prominent examples are Web portals such as Yahoo.

9
is likely to enjoy more traffic and potentially greater sales. We classify this as a type of network
effect, given that it arises from the network properties of the World Wide Web. It is important
to note, however, that this effect fails the standard test for network externalities. (A web site
does not become more valuable to customers as the number of inbound links grows.)
First-mover Disadvantages
The potential advantages of pioneering entry, discussed above, are counterbalanced by various
disadvantages.5 Later entrants may be able to “free ride” on the first-mover’s investments, and
followers may benefit by waiting until key technological and market uncertainties have been
resolved. A more basic failure arises when the pioneer’s market proves not to be commercially
viable. Many Internet entrants discovered that the market spaces that they hoped to develop
were not economically attractive. For example, Webvan and others found that the home
grocery delivery market was not attractive enough to sustain even a single stand-alone
company. To enjoy a first-mover advantage, not only must the pioneering firm be successful
relative to subsequent entrants; the market space must be viable enough to profitably support at
least one firm.
Measurement Issues Relating to First-mover Advantages
This discussion raises the question of how first-mover advantages can be identified and
evaluated by researchers. Lieberman and Montgomery (1988) define first-mover advantage in
terms of the ability of the pioneer to earn economic profits (i.e., profits that exceed the cost of
capital). Given that the Internet sector remains at an early stage of development, such a metric
based on current accounting profits is inappropriate. Successful startup businesses take nearly a
decade, on average, to reach profitability (Biggadike, 1976). Presently, relatively few Internet
ventures are profitable, and the survival of many Internet business categories remains open to
question.

10
To assess potential first-mover advantages at this early stage of industry development, one must
draw upon forward-looking measures such as stock market capitalization, which incorporates
investor expectations of future profitability. Market capitalization, measured quarterly from
1999 to 2002, serves as the primary dependent variable in this study. We compare market
capitalization across firms that compete directly within Internet sub-markets. We also consider
quarterly revenues as a dependent variable, capturing relative firm size. A further metric of
success, company survival, is considered briefly.
These performance measures are clearly imperfect proxies for a firm’s net economic profits
over an extended time period, which if available would be the most suitable performance
measure. Many studies of first-mover advantages have the luxury of a retrospective view and a
long historical series of data. In the case of Internet commerce, only limited information is yet
available on the long-term viability of specific firms and markets. Thus, only guarded
conclusions can be drawn about the ultimate extent of first-mover advantages in the Internet
sector.
3. Data and Methods
The sample for this study includes 206 publicly-traded Internet entrants, classified into 46 sub-
markets or “market spaces,” as described below. Two measures of firm performance, market
capitalization and revenue, were recorded quarterly from early 1999 through September 2002.6
The most general tests for first-mover advantage use dummy variable regression to assess
whether pioneering entrants had higher market value (or revenue) than later entrants within their
5 See Lieberman and Montgomery (1988, 1998) for more detailed discussion of first-mover disadvantages. 6 To supplement the financial data, this study also considers whether early entry enhanced the probability of firm survival. Survival is perhaps the most fundamental measure of firm performance, and it has been used in other first-mover studies. The failure of many Internet companies starting in mid-2000 makes it possible to apply hazard analysis to distinguish the influence of entry timing and other factors. The hazard analysis will be included in a later draft of this paper.

11
market space. If first-movers enjoyed higher market capitalization (or revenue) on average, the
estimated coefficient of the first-mover dummy should appear positive and significant in the
regressions. More specific tests consider whether the magnitude of advantage was related to
market or firm characteristics, such as network effects or patents. Tests to distinguish these
mechanisms were carried out by adding interaction terms to the first-mover dummy (or in some
cases adding new measures directly).
Internet company stock prices rose and fell dramatically over the period of the sample, as
illustrated in Figure 1. This market “bubble” affected the stock prices of virtually all Internet
companies. Hence the anticipated future returns of first-movers, as well as those of follower
firms, shifted markedly over the period of the sample. The regression approach of this study
compares each firm’s market value to that of competitors within their market space; i.e., net of
the average level of Internet stock prices in each period. Consequently, the study identifies
first-mover advantages in a relative sense: the premium enjoyed by first-movers relative to later
entrants. It is conceivable that despite such a premium, the average long-run financial returns to
Internet pioneers will ultimately prove to be negative. Thus, this study isolates the effect of early
entry on relative performance but cannot give definitive answers on the absolute magnitude of
first-mover advantages.
With quarterly financial data, one can observe whether the relative advantage of early
entrants—as anticipated by investors and reflected in stock prices—has been changing over
time. Shifts in the impact of firm and market characteristics on the first-mover premium can
also be identified. The results of the study show that most effects remained fairly stable despite
large movements in the average level of Internet stock prices.
Data Sample
The sample is limited to public firms traded on the NASDAQ or other U.S. exchange. All firms
had their initial public offering (IPO) by the end of 2001. Candidates for inclusion were

12
identified from lists of Internet public companies7 and lists of IPOs issued from 1995 to 2000.
Of the firms included in the sample, about half sold primarily to other businesses (B2B), and half
to consumers (B2C). More than 40% of the companies had exited by late 2002.8 Given entry
and exit from the sample, the number of companies, and the exact identity of the firms, varies by
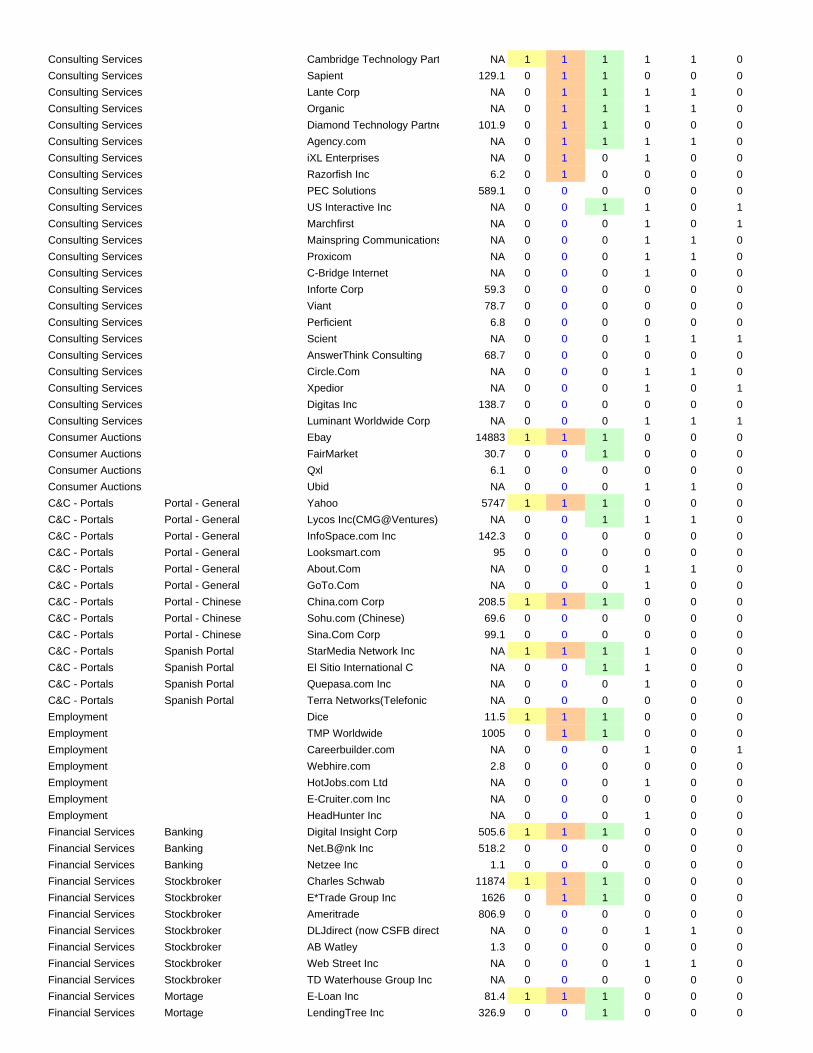
quarter. An Appendix provides detailed information on the sample firms.
The sample is restricted to firms whose primary business involved the provision of Internet-
related services or software. Three major categories of Internet companies have been
excluded: Internet service providers (ISPs), telecommunications companies, and hardware
vendors. We exclude ISPs because of their tendency to serve regional markets, which are hard
to identify.9 We exclude Internet hardware and telecommunications companies because their
product categories tend to overlap with pre-existing markets. In addition, many of these firms
predate the commercial Internet.
Sample selection biases can be problematic in investigations of first-mover advantages (see, for
example, Golder and Tellis (1993) and Vanderwerf and Mahon (1997)), and this study is no
exception. Limitation of a sample to publicly traded companies introduces a potential bias in
markets where the pioneering entrant remained private or failed without issuing an IPO. Under
these circumstances the true first-mover would be omitted from the sample and a follower firm
potentially misclassified as the pioneer. In many industries this is a serious consideration. In the
Internet markets of the late 1990s, however, there was enormous impetus for early entrants to
go public in order to raise capital to sustain their growth. In all of the market spaces in this
study, the firm identified as the first entrant ultimately issued an IPO.10 Moreover, the sample is
homogeneous in the sense that all firms, pioneers and followers alike, have passed the threshold
7 In particular, we used the Internet Stock List, http://www.wsrn.com/apps/internetstocks/. 8 Of the 206 firms in the sample, 87 (42%) exited prior to October 2002. Of the exiting firms, 21 declared Chapter 11 bankruptcy, 50 were acquired without entering bankruptcy, and 17 disappeared or shifted business operations to a new focus outside the market space. There were several mergers… 9 We include one category of ISP, the free segment, whose entrants served the US national market. 10 No case is known where a private firm preceded the public entrants identified in the study. It was, however, necessary to exclude many market spaces because of lack of publicly traded firms.

13
of initial growth and success represented by the IPO. Thus, limitation of the sample to public
companies seems unlikely to induce a bias that would overstate the extent of first-mover
advantages within the markets included in the study.
More serious, though, is the bias of the sample toward successful market spaces. To be
included in the sample, at least two public firms must have been active in the market space.
Many Internet entrants attempted to pioneer novel markets but failed. Most of these firms
never filed an IPO; in a few instances only a single firm went public in the market space.
Exclusion of such cases from this study creates a bias in favor of successful markets, and hence
a likely overstatement of the overall extent of Internet first-mover advantages.11 In effect, our
analysis gauges the performance of pioneers relative to followers, contingent on some minimum
viability of the market space. One might expect to find superior performance by pioneers under
these conditions, even if pioneering was an inferior strategy for Internet start-ups on average.
Classification of “Market Spaces”
An important issue in any empirical study of first-mover advantage is the classification of
markets. The identity of initial entrants depends upon how narrowly or broadly the markets are
defined. In this study, a two-step procedure was used to define the “market spaces.” (The
terms, “market space,” “market,” and “industry” are used interchangeably throughout the
remainder of this paper.) First, classifications were developed based upon the author’s
judgments, given business descriptions found on companies’ web sites and profiles listed on
Yahoo Finance12. These classifications were then refined using information on each firm’s top
three competitors, as denoted by Hoover’s Online.13
11 This is similar to the survivor bias discussed in the literature on first-mover advantages. 12 <http://finance.yahoo.com/> 13 These competitor listings, which are based on assessments made by the Hoover’s staff, are available at http://www.hoovers.com/ .

14
Table 1 gives an illustration of the method for refining the industry classifications, using the
Hoover’s Online data.14 More than two-dozen public firms were initially identified within the
Internet Advertising/Marketing sector, broadly defined. It proved difficult to group these
companies into meaningful sub-markets on the basis of their business descriptions alone. Using
competitor information from Hoover's Online, however, a set of meaningful and objective
classifications could be made. Consider, for example, the firms that compete with DoubleClick,
the pioneer and category leader in the “advertising network” sub-market. The primary business
of DoubleClick and its rivals involves the coordination of online advertisements among three
parties: the company placing the ad, the owner of the web site that displays the ad, and the
consumer who ultimately views the ad. As shown in Table 1, the competitor listings from
Hoover’s imply that six public companies competed with each other in this market.
DoubleClick and 24/7 Media, the largest firms, were listed by Hoover’s as principal
competitors faced by each of their four smaller rivals. By comparison, DoubleClick and 24/7
Media were not generally ranked as top competitors for the other advertising/ marketing firms
identified in the study. Thus, the Hoover’s Online information allows competitors within the
“advertising network” market to be distinguished from firms within the broader
advertising/marketing category.
As indicated by this example, the Hoover’s Online competitor information provides a
reasonably objective method for identifying companies that compete closely in a specific
market. Firms that did not have a clear classification based upon the Hoover’s data were
generally excluded from the study. The result of this process was the identification of 46 market
spaces containing at least two public competitors during some or all of the period from 1999 to
mid-2002. The names of the market spaces, and the identity of the first-mover(s) within each
market space, are shown in Table 2.
14 The method is easy to apply and may be applicable in other studies where it is necessary to identify a coherent set of market competitors.

15
The market spaces were grouped into categories reflecting common Internet business models
(Eisenmann, 2002). These categories are as follows: market maker, broker, portal, retailer,
content provider, software, infrastructure, and other. These groupings play an important role in
the tests for first-mover advantages. In addition, markets were classified as either “B2B”
(business to business) or “B2C” (business to consumer), a common distinction in the Internet
sector.
Identification of the First-Mover Firms
Typically, one of the first actions of a new Internet-related company was to officially register its
domain name. Such registration or “web entry” dates correspond closely to the founding dates
indicated on many company Web sites. Given this correspondence and the availability of
registry information for nearly all firms in the sample, the date of domain registration was taken
as the firm’s date of entry.15 In cases where a large discrepancy was found between the domain
registration date and the founding date indicated by the company, the latter was selected as the
entry date.16
With firms sequenced by entry date, “first-movers” were defined in three alternative ways. In
the first approach, the firm with the earliest date of entry in the market space was identified as
the unique first-mover.17 In the second approach, the first one-third of market entrants were
denoted as first-movers. The third approach (which provides the preferred method for this
study) is intermediate between the first two: if all firms entered after 1995, the earliest entrant
15 These registration dates were obtained by querying the "WhoIs" function on the Network Solutions web site (http://www.netsol.com/cgi-bin/whois/whois ) in mid-2000. (This method is no longer a reliable source of initial entry dates, as many firms’ domain registrations have been changed or renewed, and registration has lapsed for some exiting firms.) 16 One exception is for firms with “bricks and mortar” origins. For such firms we used the date of first entry on the web, as denoted by the date of domain registration or historical information provided on the firm’s web site. 17 In two market spaces, dual first-movers were assigned as the entry dates were within a few days of each other. In one additional market space, the entries were at similar times, but precise dates were unavailable.

16
was taken as the sole first-mover;18 otherwise, firms entering prior to the end of 1995 were
classified as first-movers up to the first 30% of entrants. Based on this definition, ten of the 47
market spaces in the sample have two first-movers, one market space has three (e-business
software suites/platforms) and one has eight (Internet consulting). All others have a unique first-
mover firm.
Dummy variables were defined with their value set equal to 1 if the firm was classified as a first-
mover, and zero otherwise. Thus, three alternative dummy variables for first-movers were
tested in the analysis: FM1 (a single first-mover within each market space), FM33 (the first
third of entrants selected as first-movers), and FM, the preferred, intermediate measure.
All three definitions gave similar results in the regression analysis. However, the third definition
has the advantage that it allows for multiple first-movers in markets with a large number of early
entrants. Hence it is robust to possible error in the recorded entry dates, which are known less
precisely for entrants in the early 1990s. In several cases the second entrant in our sample (who
was still quite early in the entry queue) is the firm that is widely perceived as the market pioneer.
While identification of a unique market pioneer might seem attractive, more inclusive definitions
are common in the empirical literature.
Performance Measures
The main performance measure in this study is stock market capitalization. A secondary
measure is quarterly revenue. These serve as dependent variables in regressions that were run
quarterly from 1999 through 3rd quarter 2002. The market capitalization and revenue data were
obtained from Compustat.
18 If the entry dates of the first two entrants differed by two weeks or less, both were classified as first-movers.

17
Explanatory Factors Relating to First-mover Advantage
Section 2 described four types of mechanisms that can sustain a first-mover advantage. These
mechanisms are not directly observable and thus must be represented by proxies in the
empirical analysis. The measures described below, although highly imperfect, serve as
indicators of the mechanisms that potentially support first-mover advantages.
Proprietary Technology and Patents. For reasons discussed in Section 2, proprietary
technology is likely to be less important as a source of sustainable advantage for Internet
companies than for many other technology businesses. Even so, the ready availability of patent
data makes objective measures of intellectual property feasible. The annual count of US patents
awarded to each firm in the sample was obtained from the Delphion database.19 Typically,
these patents pertain to business processes or software.20
Table 3 lists the patent holders in the sample. Comparatively few Internet companies have
sought patents, but patents appear to be important for some early entrants. First-movers were
about twice as likely as others to patent: 40% of first-movers had at least one patent issued by
mid-2002, as compared with 23% of followers.21 The high patent rates of early entrants
relative to followers suggests that patents have provided a means for pioneers to protect their
innovations.
The patent statistics summarized in Table 3 can be transformed in a variety of ways to yield
testable measures. The most obvious approach is to take the cumulative count of patents by
each firm (i.e., the values shown in Table 3). The distribution of patents among firms is highly
skewed, so a simple count of this sort puts very strong weight on just a few firms. Moreover,
wide variation in firms’ propensity to patent and in the quality of patents makes the raw counts
19 The counts in this study include patents awarded prior to May, 2002, when the data were collected from the Delphion web site, http://www.delphion.com/ . 20 A future version of this paper will categorize the patents by class. 21 This classification uses the intermediate definition of first-movers (FM).

18
extremely noisy. The top patent holder in the sample, E-Stamp Corp., was forced to exit its
main business despite a quantitatively strong patent position. While the cumulative patent counts
were tested in the regression model, the results presented in the next section take patenting as a
dummy variable, distinguishing firms that filed and received patents from those that did not. This
approach ignores potential information in the patent count but reduces the noise level. The
patents>0 dummy proved highly significant in the regression model, whereas the raw patent
counts were not.
The timing of patent applications raises an additional issue. Applications filed many years after
the firm’s founding may be indicative of company success but unrelated to first-mover
advantage. Hence, we distinguished between early and late patents by defining a separate
dummy variable for firms that filed patent applications within two years of the date of entry.
Preemption of Resources. As discussed in Section 2, some sustainability mechanisms are
more important than others in the Internet environment. Resource preemption seems
particularly unlikely to be a major source of first-mover advantages for Internet companies. The
sole exception is in markets where pioneers may be able to preempt customers’ “perceptual
space” to some degree. Unfortunately, we lack objective criteria to identify such markets, so it
is necessary to omit resource preemption from the analysis.
Switching Costs. It was argued in Section 2 that switching costs are likely to be important in
some Internet markets, contributing to first-mover advantage. But here again, objective
empirical measures are unavailable. One might anticipate, however, that switching costs are
greater in certain market categories (e.g., software) than in others (e.g., retailing of products that
are purchased infrequently). To explore such possibilities, dummy variables were tested in the
regressions for various product or business model types: e.g., software, broker, retailer, portal,
etc.22 Such groupings were also used in the tests for network effects, discussed below.

19
Network Effects. Section 2 argued the potential importance of three types of network effects
in Internet markets. Empirical work on network effects has been limited, and unfortunately, no
standard measures have been developed that apply across industries. Therefore, an effort was
made to estimate the magnitude of network effects using rudimentary proxies.
The first type of network effect arises when opportunities exist for a “market maker” to bring
together relatively dispersed sets of buyers and sellers. Such environments, where the market
maker plays a coordinating role, correspond to some of the great success stories of Internet
commerce such as eBay. The following market spaces were assigned to the market maker
category: consumer auctions, advertising network, employment search, real estate, and vertical
marketplace. Other Internet markets where firms perform a brokerage function exhibit similar
characteristics, although some lack the feature that consumer benefits increase with the number
of sellers linked to the site. The brokerage markets in the sample include: stockbroker, auto
broker, mortgage broker, insurance quote aggregator, tickets (entertainment), and travel.
Tests for such network effects were implemented by defining dummy variables corresponding to
first-movers within the market maker and brokerage categories. Positive regression coefficients
for first-movers in one or both of these categories, controlling for general first-mover effects,
potentially denotes the existence of network effects in support of first-mover advantage.
While the first type of network effect arises in markets where the firm serves as a nexus
between buyers and sellers, the second type of network effect is more general: a “virtuous
cycle,” of positive feedback allows a firm with initial success to attract more and better alliance
partners (and/or customers), which contributes in turn to further success, and so on. It is not
clear, however, how this second, more general type of network effect can be effectively
measured. Possibilities include counting the number of alliance partners, assessing their quality,
or measuring the size of the firm's customer base. Such measures, to the extent that they can be
collected, are all endogenous with firm performance. This raises questions of cause and effect
22 See Eisenmann (2002) for a discussion of Internet business models.

20
that are hard to resolve, both conceptually and empirically. Given these difficulties, no explicit
measure of this second type of network effect was included in this study. However, firms in
some of the brokerage markets in the sample may benefit from this type of network effect.
The third type of network effect is represented by the magnitude of inbound links to the firm's
Web site. Estimates of the number of inbound links can be readily obtained from Web search
engines, and such a measure was collected in the course of this study.23 The interpretation of
these counts is problematic, however, given that inbound links grow endogenously in much the
same way as the alliances described above. (Other things equal, more successful firms will have
more inbound links, which may further contribute to the firm’s success, and so on.) It is not
clear whether a count of inbound links should be regarded as a type of performance measure,
or as a factor that helps to explain the firm’s performance. Given this complexity, the inbound
links measures will be assessed in a separate study that explicitly considers the endogeneity of
web links.
Control variable
A further measure was included in the regressions to control for the fact that many Internet
companies have origins that predate the commercial Web. Such firms include spin-offs from
established companies (e.g., DLJ Direct, FTD.com, Expedia, Travelocity) and brick and mortar
firms that were reorganized as Internet-oriented companies (e.g., Charles Schwab,
Ticketmaster, Hotel Reservation Network). Since these two categories did not appear to have
significantly different effects in the regression analysis, they were combined in a single dummy
denoting firms with “brick and mortar” origins. Many of these firms have continuing “brick and
mortar” operations.
23 A count of inbound links was collected from AltaVista by typing “link:www.name.com” in the AltaVista search box to get the number of inbound links that AltaVista detected for “name.com.” Note that because any search engine indexes only a small fraction of the web, these counts must be treated as relative measures.

21
4. Results
Market Value Regressions
Tables 4 and 5 report regression results using the logarithm of market capitalization as the
dependent variable. Both tables include separate constant terms (fixed effects) for each market
space in the sample, plus a dummy variable controlling for “brick and mortar” origins. Table 4
includes the FM dummy to gauge the average net magnitude of the first-mover premium within
market spaces. Table 5 adds to this basic specification the patent dummy and several
interactions with the FM dummy. These measures allow the first-mover premium to be
disaggregated into components relating to network effects and patents.
The tables give estimates for the first and third calendar quarters from 1999 to 2002.
(Intermediate quarters were similar.) By comparing the value of coefficients across quarters, it
is possible to assess whether the effects (as anticipated by investors and incorporated in stock
prices) were changing over time. The number of observations changes by quarter, rising with
net entry into the sample through the middle of 2000, and falling with net exit after that time.
The estimates in Table 4 show that the average premium of first-mover companies, measured in
terms of stock market capitalization, was positive and reasonably constant over time. The first-
mover dummy is statistically significant in each of the quarterly regressions. Its coefficient, which
ranges in magnitude from about 0.7 to 1.1, implies that the average first-mover had a market
value roughly two to three times that of follower firms. Thus, the market value regressions
demonstrate that the advantages early entrants were statistically significant and substantial in
magnitude when assessed within the market spaces of the sample. The dummy for companies
with “bricks and mortar” origins is not significantly different from zero, indicating that these
companies had market values comparable to others.

22
Table 5 gives results of the expanded regressions, which include the measures representing
network effects and patents. The addition of these measures causes the coefficient of the basic
(non-interacted) first-mover dummy to fall to zero and become statistically insignificant. This
suggests that first-mover advantages have been minimal for pioneers that do not benefit from
network effects or patents.
The FM*MarketMaker and FM*Broker interactions capture the market premium of pioneers
in market spaces with potential network effects. The FM*MarketMaker coefficients appear
positive, and they are highly significant in most periods of the sample.24 The coefficient of
FM*Broker increases over time and is highly significant in the final period. The values of 3.69
and 3.63 shown for these coefficients in the third quarter of 2002 imply that pioneers in network
markets had average capitalization roughly fifteen times greater than that of later entrants.25 One
conclusion is that the general market premium shown for first-movers in Table 4 is largely
concentrated within this group of network market pioneers.
The dummy variable for firms with patents also appears highly significant in Table 5. The
estimated coefficients are close to unity in most years, implying that firms with patents had
average market capitalization roughly two to three times greater than other companies in the
sample. (Note that this is a general premium for all patent holders, not limited to first-mover
companies.) The premium appears larger than what might be anticipated in a sector where
patents have been relatively unimportant. Presumably, the premium reflects the economic value
of the patents as well as (unobserved) differences in firms’ underlying innovative capabilities.
24 There is, however, great variation among the market maker pioneers. For example, the employment network (job boards) market space has two first-movers: TMP Worldwide (which owns the ‘Monster Board’) and Dice (which has remained focused on engineering employment in Silicon Valley). Both firms entered at about the same time, but TMP actively exploited the network effect and now has a market value more than one hundred times that of Dice. 25 This multiple is computed by adding the coefficients for the basic first-mover dummy and the “FM*NetworkMarket” dummy, and exponentiating the result.

23
To determine if the patent premium differs between market pioneers and later entrants, an
interaction between the first-mover and patent dummies was tested in the regressions.26 Table 5
shows that this interaction term is not statistically significant. Thus, the market value premium
associated with patents is indistinguishable between first-movers and other patent holders.
Nevertheless, first-movers were about twice as likely as other firms to patent, suggesting that
patents served as a means for pioneering firms to defend against imitation.
The patent measure in Table 5 is a simple dummy variable set equal to 1 for firms with at least
one patent. Other patent measures were also evaluated. As mentioned previously, the
cumulative count of patents awarded to each firm was tested in the model, but the results were
substantially weaker than those shown for the patent dummy. Other experiments, with the
threshold for the dummy variable set at higher patent counts, were similarly unsuccessful. This
suggests that it is the existence of patents, rather than the number of patents, that is important.
In general, the results in Tables 4 and 5 show that first-mover advantages have been substantial
when market capitalization is gauged relative to later entrants within each market space.
However, the advantages of early entry appear to be largely confined to pioneers in markets
with strong network effects, and those with patented innovations. Table 6 assesses the
robustness of these findings by considering alternative definitions of first-movers, and by relaxing
the focus on relative performance among surviving firms. Data for the regressions in Table 6
cover the most recent period of the sample (third quarter, 2002).
The first three regressions in Table 6 show the effects of changing the definition of first-mover.
The first regression uses the preferred definition, FM; the second regression assumes a unique
first-mover in each market space (FM1); and the third regression assigns the earliest 1/3 of
entrants in each market space as first-movers (FM33). The fit is slightly worse with these
26 The dummy for patent applications filed within two years of entry was used for this interaction, but the results are similar if the more general patent dummy is employed.

24
alternative definitions, and significance levels fall slightly, but in general the results appear robust
across the three definitions.
A deficiency of the regression approach in Tables 4 and 5 is that the number of observations
diminishes in recent periods, due to exits. Exits by weaker firms have the perverse effect
reducing the relative premium of surviving first-movers, which are compared with surviving firms
within the market space. Moreover, exit of (all) first-movers in a given market space removes
that space from the sample for the purpose of computing the first-mover premium. In an effort
to overcome such problems, the middle regressions in Table 6 add the exiting firms back into
the sample, at an (arbitrarily) assumed market value of $1 million. Table 6 shows that this
procedure augments the FM*MarketMaker and FM*Broker coefficients, leaving the basic FM
coefficient unchanged (slightly negative but insignificant). Thus, adjustment for exits raises the
estimated magnitude of the network effect but not the magnitude of other first-mover
advantages.
Such adjustment for exits also causes the patent coefficient to fall and lose statistical significance.
The drop in the patents coefficient in these regressions reflects the fact that many firms with
patents failed. (The exit rates of patent holders were virtually identical to those of other firms in
the sample, as discussed below.) Thus, the strong positive patent coefficients in Table 5 may
reflect a selection effect; firms with valuable patents tended to survive, whereas those with weak
patents often did not.
The final columns of Table 6 give the market value regressions based on OLS estimation,
omitting the industry fixed effects. In these regressions, market values are gauged relative to the
mean of the sample rather than the mean of the market space. Results are similar to those with
industry fixed effects, except that the FM*MarketMaker coefficients drop substantially and
become insignificantly different from zero. Thus, on average, the market maker pioneers
enjoyed a large premium relative to followers in their market space, but not relative to firms in

25
the sample as a whole. Indeed, many of the market spaces in this category are now regarded
as failures, despite their initial promise.27
Revenue Regressions
Table 7 reports the regression estimates when quarterly revenues are used as the dependent
variable. The explanatory variables are identical to those in Table 5. The results of the revenue
regressions are similar to those described previously for market capitalization, but several
differences are notable.
The dummy variable for brick and mortar origin, intended largely as a control measure, appears
positive and significant in the revenue regressions. Thus, entrants with brick and mortar origins
had substantially higher revenue than the average firm in their market space. This premium did
not, however, carry over to market value (Table 5). Investors appear to have discounted the
future earnings prospects of firms with brick and mortar origins, relative to independent startups.
An opposite pattern holds for pioneers in network markets, for whom the estimated premium is
much larger in terms of market value (Table 5) than in terms of revenues (Table 7). One
explanation is that investors anticipated higher growth, and hence greater future returns, for
companies with potential network economies. For patent holders, on the other hand, the
estimated coefficients are similar for both revenue and market value. In general, despite some
differences in magnitude of effects, the revenue regressions tend to corroborate the findings
obtained when market capitalization is used as the dependent variable.
Supplemental Analysis of Industry Effects
27 This is particularly true for vertical marketplaces, real estate, and perhaps advertising network. The average market value of follower firms in the “market maker” categories lies significantly below the sample mean.

26
The regression results in this paper demonstrate that first-movers in market spaces
corresponding to the broker and market maker business models, identified as having strong
potential network economies, attained high average market capitalization and revenue.
Additional regressions were estimated to explore whether market values (for first-movers,
followers or both) may have varied systematically with generic business models other than
broker and market maker. Such patterns would be observed if network effects, switching
costs, or other factors favoring first-movers are concentrated within business model categories.
To explore these possibilities, first-mover interaction terms such as those defined for the market
maker and broker categories were defined for the following additional product or business
model types: retailer, broker, software, portal, consultant, and B2B. These interaction terms
were tested in the regression model (in the same manner as the FM*NetworkMarket dummy)
to determine if first-movers enjoyed significantly higher returns in any of these environments.
Results proved negative, except for a temporary market premium enjoyed by first-movers in the
portal category in the early periods of the sample. These supplementary tests confirmed the
concentration of first-mover advantages within the market maker and broker segments of the
sample.
Analysis of Entrant Survival
A final analysis was performed to investigate firm survival. Table 8 gives exit rates for various
subgroups in the sample. For the sample as a whole, 42% of entrants had exited (including
bankruptcies, acquisitions, disappearances, and reorganization outside the Internet sector) by
the last quarter of sample coverage. Table 8 shows that early entry (regardless of definition)
and patent awards had virtually no effect on the probability of exit. Exit rates for brick and
mortar firms (27%) and first-movers that applied for patents soon after entry (29%) are slightly
below the sample mean, but the differences are not statistically significant.

27
The bottom portion of Table 8 gives exit rates of first-movers and followers categorized by type
of business model. None of the pioneers in the market maker segments, and only one of the
first-mover brokers, had exited by the end of the sample period. Hence the net exit rate of first-
movers from these markets was a mere 6%, as compared with a rate of 45% for followers.
These differences are highly significant statistically, and they suggest that first-movers in network
markets enjoyed survival advantages comparable to those relating to market capitalization and
revenue, documented previously.
5. Conclusions
This study has considered the specific conditions under which first-mover advantages would be
expected to arise in Internet-related markets. The empirical analysis shows advantages for
pioneers in environments with network effects, and firms with patented innovations. Absent
these factors, Internet first-mover advantages appear minimal at best.
Thus, first-mover advantages seem to have arisen under roughly the conditions predicted. Even
so, Internet first-mover advantages appear much less extensive than what many early entrants
anticipated. In the euphoria of the early growth of Internet commerce, many entrepreneurs
failed to perform adequate market analysis prior to entry and were disappointed. The view that
first-mover advantages are pervasive throughout the Internet sector is clearly incorrect.
These findings are subject to many caveats. The measures developed in the study are crude
proxies, which correspond only imperfectly to the factors that they are designed to represent.
Moreover, it proved impossible to develop measures for some potentially important
mechanisms, such as switching costs. In addition to these deficiencies of the empirical
measures, sample selection biases may influence the results. The sample is clearly biased
towards relatively successful Internet markets (and hence a finding of successful first-movers); it
omits many pioneering entrants whose markets turned out to be non-viable. The main

28
performance measure in this study, stock market capitalization, reflects investor expectations,
which may add a further unknown bias. In addition, the performance of pioneers has been
compared with that of followers within each market space, so first-mover advantages have been
assessed in relative terms, and not in terms of absolute long run profits.
In general, the study suggests that Internet first-mover advantages have arisen under specific and
limited conditions, consistent with underlying theory. Nevertheless, Internet commerce remains
in its infancy, and it is too early to know for certain if these conclusions will hold over the long
term. Years from now the answers may be clear, but the questions are likely to be less
interesting.

29
References
Biggadike, E. R. (1976). Corporate Diversification: Entry Strategy and Performance. Cambridge, MA, Harvard University Press. Eisenmann, Thomas R. (2002). Internet Business Models. Boston, McGraw-Hill. Golder, P. N., and Gerard J. Tellis (1993). “Pioneer Advantage: Marketing Logic or Marketing Legend?” Journal of Marketing Research 30(2): 158-170. Levin, Richard, Alvin Klevorick, Richard Nelson, and Sidney Winter (1987). “Appropriating the Returns from Industrial Research and Development.” Brookings Papers on Economic Activity 3: 783-820. Lieberman, Marvin B., and David B. Montgomery (1988). “First-Mover Advantages.” Strategic Management Journal 9: 41-58. Lieberman, Marvin B., and David B. Montgomery (1988). “First-Mover (Dis)Advantages: Retrospective and Link with the Resource-Based View.” Strategic Management Journal 19: 1111-1125. Porter, Michael E. (2001). “Strategy and the Internet.” Harvard Business Review (March). Rangan, Subramanian, and Ron Adner (2001). “Profits and the Internet: Seven Misconceptions.” Sloan Management Review 42(4): 44-53. Shapiro, Carl and Hal R. Varian (1998). Information Rules. Boston, MA, Harvard Business School Press. Vanderwerf, Peter, and John F. Mahon (1997). “Meta-Analysis of the Impact of Research Methods on Findings of First-Mover Advantages.” Management Science. 43: 1510-1519

Fig 1. Average Market Capitalization of Internet Companies(27 companies in sample with market prices in all periods)
0
2000
4000
6000
8000
10000
12000
4Qtr1
998
1Qtr1
999
2Qtr1
999
3Qtr1
999
4Qtr1
999
1Qtr2
000
2Qtr2
000
3Qtr2
000
4Qtr2
000
1Qtr2
001
2Qtr2
001
3Qtr2
001
4Qtr2
001
1Qtr2
002
3Qtr2
002
Mill
ion
s o
f Do
llars
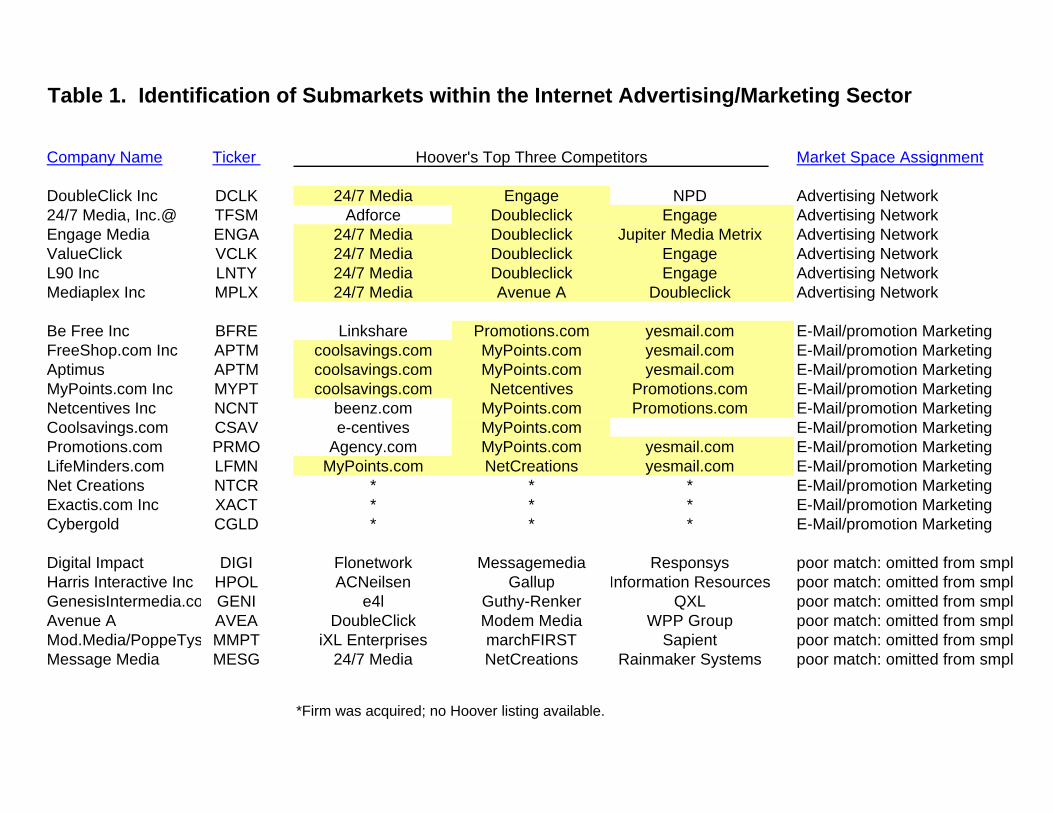
Table 1. Identification of Submarkets within the Internet Advertising/Marketing Sector
Company Name Ticker Hoover's Top Three Competitors Market Space Assignment
DoubleClick Inc DCLK 24/7 Media Engage NPD Advertising Network24/7 Media, Inc.@ TFSM Adforce Doubleclick Engage Advertising NetworkEngage Media ENGA 24/7 Media Doubleclick Jupiter Media Metrix Advertising NetworkValueClick VCLK 24/7 Media Doubleclick Engage Advertising NetworkL90 Inc LNTY 24/7 Media Doubleclick Engage Advertising NetworkMediaplex Inc MPLX 24/7 Media Avenue A Doubleclick Advertising Network
Be Free Inc BFRE Linkshare Promotions.com yesmail.com E-Mail/promotion MarketingFreeShop.com Inc APTM coolsavings.com MyPoints.com yesmail.com E-Mail/promotion MarketingAptimus APTM coolsavings.com MyPoints.com yesmail.com E-Mail/promotion MarketingMyPoints.com Inc MYPT coolsavings.com Netcentives Promotions.com E-Mail/promotion MarketingNetcentives Inc NCNT beenz.com MyPoints.com Promotions.com E-Mail/promotion MarketingCoolsavings.com CSAV e-centives MyPoints.com E-Mail/promotion MarketingPromotions.com PRMO Agency.com MyPoints.com yesmail.com E-Mail/promotion MarketingLifeMinders.com LFMN MyPoints.com NetCreations yesmail.com E-Mail/promotion MarketingNet Creations NTCR * * * E-Mail/promotion MarketingExactis.com Inc XACT * * * E-Mail/promotion MarketingCybergold CGLD * * * E-Mail/promotion Marketing
Digital Impact DIGI Flonetwork Messagemedia Responsys poor match: omitted from smplHarris Interactive Inc HPOL ACNeilsen Gallup Information Resources poor match: omitted from smplGenesisIntermedia.com GENI e4l Guthy-Renker QXL poor match: omitted from smplAvenue A AVEA DoubleClick Modem Media WPP Group poor match: omitted from smplMod.Media/PoppeTysonMMPT iXL Enterprises marchFIRST Sapient poor match: omitted from smplMessage Media MESG 24/7 Media NetCreations Rainmaker Systems poor match: omitted from smpl
*Firm was acquired; no Hoover listing available.

Table 2. Market Spaces Included in the Sample
Bus. Model B2C Business Area Submarket # Firms First-Mover(s)
mkt. maker Advertising/Marketing Advertising Network 6 DoubleClick Incmkt. maker B2B Vertical marketplace 6 FreeMarkets / Vertical Netmkt. maker x Consumer Auctions 4 Ebaymkt. maker x Real Estate 3 Homestore.com / HomeSeekersmkt. maker x Tickets 2 Ticketmastermkt. maker Employment Search 7 Dice / TMP Worldwide
broker x Autos Broker/referral 2 Autowebbroker x Financial Services Insurance-quote aggregator 2 Quotesmith.com Incbroker x Financial Services Mortage 4 E-Loan Incbroker x Financial Services Stockbroker 7 E*Trade / Schwabbroker x Travel 6 Expedia / Hotel Res. Networkcontent x Women Networks 2 Women.com Networkscontent Health and Medicine Content/other 3 HealthGate Data Corpportal x Portals (horizontal) Chinese Portal 3 China.com Corpportal x Portals (horizontal) General Portal 6 Yahooportal x Portals (horizontal) Spanish Portal 4 StarMedia portal x Financial Services Content/portal 3 Multex.com Incportal x Music Portal 6 ARTISTdirect Incretail x B2C Consumer Markets Books 3 Amazonretail x B2C Consumer Markets Electronics 5 Value America Incretail x B2C Consumer Markets Flowers 2 1-800-Flowers.comretail x B2C Consumer Markets Groceries 4 Peapodretail x B2C Consumer Markets Online Fashion Mall 3 Fashionmall.comretail x B2C Consumer Markets Sporting Goods 2 FogDogretail x B2C Consumer Markets Toys 3 Etoys/ Smarterkids.comretail x Health and Medicine Drugstores 2 drugstore.comretail x Health and Medicine Health Stores 2 Mothernature.com
software B2B Transaction platforms 2 Aribasoftware Software e-business suites/platforms 9 Allaire / Broadvision / OpenMktsoftware Software eCRM: E-Services 7 Kana / Delanosoftware Software eCRM: intelligence 5 WebTrends Corporationsoftware Software Infrastucture (EAI) 6 NEON / See Beyondsoftware Software Interactive TV 2 Spyglass Inc
infrastruct. Internet Infrastructure Content Delivery 4 Digital Island / Sandpiperinfrastruct. Internet Services Domain Name 2 Network Solutions (Verisign)infrastruct. Internet Services E-Mail 5 CommTouch / Software.cominfrastruct. Internet Services Hosting 4 Exodusinfrastruct. Internet Services Telephony 7 NetSpeak / Net2Phone
other Advertising/Marketing E-Mail/promotion Marketing 10 Netcentives / Promotions.comother Advertising/Marketing Web Information 3 Media Metrixother Consulting Services 23 CTP/Sapient/Lante/Organicother e-learning 6 Digitalthink Incother x Financial Services Banking 3 Digital Insight Corpother Health and Medicine Rx Management 2 Allscriptsother x ISP Free 2 Juno Online Servicesother Postage 2 Stamps.com Inc
206 TOTAL

Table 3: Firms in the Sample with Patents
First-Movers (FM): Followers:
No. of Filed No. of Filed Company Name Patents < 2yr Exited Company Name Patents < 2yr Exited
Amazon 18 1 0 E-Stamp Corp 29 1 1Open Market Inc 12 1 1 Liberate Technologies 13 1 0Juno Online Services 8 1 1 BEA Systems 9 1 0Yahoo 7 1 0 Priceline.com Inc 9 1 0NetSpeak Corp 7 1 1 Inktomi 6 1 0FreeMarkets 5 0 0 About.Com 5 1 1Stamps.com Inc 4 1 0 Lycos Inc(CMG@Ventures) 5 1 1Digital Island/Sandpiper 3 0 1 SilverStream Software 4 1 1Kana 3 1 0 ITXC Corp. 4 1 0FogDog 2 1 1 Netzero Inc 3 1 0WebTrends Corporation 2 0 1 E.piphany Inc 3 1 0Net2Phone 2 1 0 Exactis.com Inc 2 1 1Ariba Inc. 1 1 0 Cybergold 2 1 1Ebay 1 0 0 Netcentives Inc 2 1 1Charles Schwab 1 0 0 Commerce One Inc 2 1 0Multex.com Inc 1 1 0 Net Perceptions 2 1 0Network Solutions (Verisign) 1 1 0 Vignette 2 0 0Software.com 1 0 1 Crossworlds 2 1 1Exodus 1 1 1 24/7 Media, Inc. 1 1 0Media Metrix Inc 1 1 0 Be Free Inc 1 1 1BroadVision Inc 1 1 0 Ventro 1 1 1Spyglass Inc 1 0 1 Saba Software 1 1 0Sapient 1 0 0 Docent 1 1 0TMP Worldwide 1 1 0 Webvan 1 1 1E*Trade Group Inc 1 0 0 GoTo.Com 1 1 1NEON 1 1 0 InfoSpace.com Inc 1 1 0
Careerbuilder.com 1 0 1LendingTree Inc 1 1 0Critical Path 1 1 0Vitria 1 0 0WorldQuest Networks Inc 1 1 0Travelocity 1 1 1

Table 4. Market Value Regressions
Dependent Variable: log (market capitalization)
3Q/2002 1Q/2002 3Q/2001 1Q/2001 3Q/2000 1Q/2000 3Q/1999
Constant industry industry industry industry industry industry industrydummies dummies dummies dummies dummies dummies dummies
Brick & Mortar -0.10 -0.05 0.16 0.27 0.02 -0.10 0.30(0.1) (0.1) (0.2) (0.5) (0.0) (0.2) (0.6)
First Mover (FM) 1.05 * 1.07 ** 0.67 * 0.68 * 0.75 ** 0.65 ** 0.81 **(2.1) (2.7) (2.1) (2.4) (3.0) (3.2) (3.0)
R-sq 0.40 0.43 0.46 0.44 0.48 0.53 0.44
# observations 112 125 149 174 198 193 132
Numbers in parentheses are t-statistics.
**P<.01; *P<.05
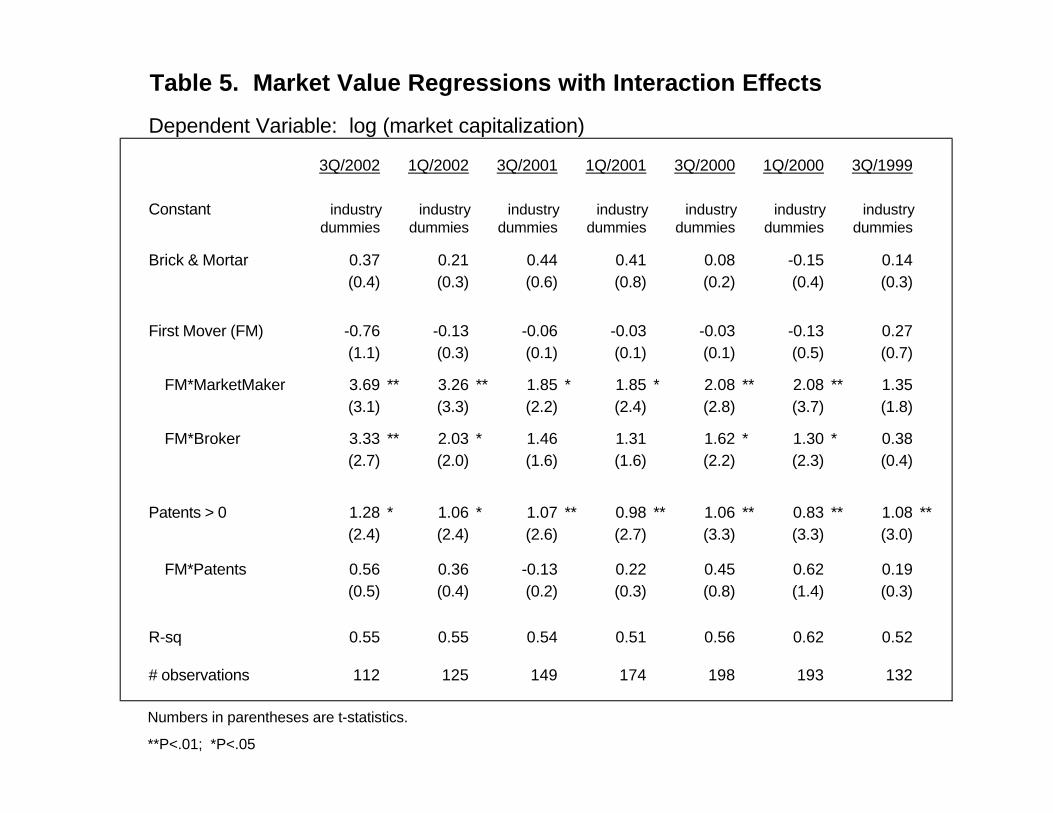
Table 5. Market Value Regressions with Interaction Effects
Dependent Variable: log (market capitalization)
3Q/2002 1Q/2002 3Q/2001 1Q/2001 3Q/2000 1Q/2000 3Q/1999
Constant industry industry industry industry industry industry industrydummies dummies dummies dummies dummies dummies dummies
Brick & Mortar 0.37 0.21 0.44 0.41 0.08 -0.15 0.14(0.4) (0.3) (0.6) (0.8) (0.2) (0.4) (0.3)
First Mover (FM) -0.76 -0.13 -0.06 -0.03 -0.03 -0.13 0.27(1.1) (0.3) (0.1) (0.1) (0.1) (0.5) (0.7)
FM*MarketMaker 3.69 ** 3.26 ** 1.85 * 1.85 * 2.08 ** 2.08 ** 1.35(3.1) (3.3) (2.2) (2.4) (2.8) (3.7) (1.8)
FM*Broker 3.33 ** 2.03 * 1.46 1.31 1.62 * 1.30 * 0.38(2.7) (2.0) (1.6) (1.6) (2.2) (2.3) (0.4)
Patents > 0 1.28 * 1.06 * 1.07 ** 0.98 ** 1.06 ** 0.83 ** 1.08 **(2.4) (2.4) (2.6) (2.7) (3.3) (3.3) (3.0)
FM*Patents 0.56 0.36 -0.13 0.22 0.45 0.62 0.19(0.5) (0.4) (0.2) (0.3) (0.8) (1.4) (0.3)
R-sq 0.55 0.55 0.54 0.51 0.56 0.62 0.52
# observations 112 125 149 174 198 193 132
Numbers in parentheses are t-statistics.
**P<.01; *P<.05

Table 6. Market Value Regressions Based on Alternative Methods
Dependent Variable: log of market capitalization (3Q/2002)
Regression type:
Definition of first-mover : FM FM1 FM33 FM FM1 FM33 FM FM1 FM33
Constant industry industry industry industry industry industry 3.35 ** 3.36 ** 3.40 **dummies dummies dummies dummies dummies dummies (13.5) (13.4) (13.2)
Brick & Mortar 0.44 0.80 0.58 0.44 0.86 0.50 0.85 1.08 0.98(0.5) (0.9) (0.7) (0.7) (1.2) (0.8) (1.4) (1.8) (1.6)
First Mover (FM) -0.54 -0.46 -0.40 -0.44 -0.40 -0.36 0.01 0.13 -0.22(1.0) (0.7) (0.7) (1.1) (0.8) (1.0) (0.0) (0.2) (0.5)
FM*MarketMaker 3.50 ** 3.00 * 2.93 * 4.38 ** 3.93 ** 4.13 ** 0.66 0.45 0.66(3.1) (2.3) (2.5) (4.1) (3.3) (4.2) (0.8) (0.5) (1.0)
FM*Broker 3.12 ** 2.60 * 2.97 * 4.30 ** 3.22 ** 4.37 ** 2.60 ** 2.15 * 2.52 **(2.7) (2.0) (2.5) (4.0) (2.6) (4.2) (3.1) (2.1) (3.2)
Patents > 0 1.40 ** 1.49 ** 1.28 * 0.69 0.82 0.51 1.55 ** 1.61 ** 1.53 **(2.9) (3.1) (2.5) (1.6) (1.8) (1.2) (3.8) (3.9) (3.7)
R-sq 0.55 0.51 0.53 0.44 0.39 0.45 0.23 0.16 0.23
# observations 112 112 112 206 206 206 112 112 112
Numbers in parentheses are t-statistics.**P<.01; *P<.05
^Exiting firms assigned arbitrary market value of $1 million.
Industry Fixed Effects OLS (no fixed effects)Fixed Effects, Exits Included^

Table 7. Revenue Regressions
Dependent Variable: log (market capitalization)
3Q/2001 1Q/2001 3Q/2000 1Q/2000 3Q/1999 1Q/1999
Constant industry industry industry industry industry industrydummies dummies dummies dummies dummies dummies
Brick & Mortar 1.32 * 1.27 ** 0.72 * 0.93 ** 1.10 ** 1.48 **(2.6) (2.9) (2.1) (2.7) (2.8) (3.3)
First Mover (FM) -0.36 -0.02 0.13 0.21 0.39 0.55 *(1.2) (0.1) (0.6) (1.0) (1.7) (2.0)
FM*MarketMaker 2.30 ** 1.33 * 1.15 * 0.88 0.55 0.56(3.5) (2.0) (2.2) (1.6) (0.9) (0.8)
FM*Broker 0.95 0.76 0.65 1.12 * 0.64 0.30(1.3) (1.1) (1.2) (2.1) (1.1) (0.4)
Patents > 0 0.84 ** 0.85 ** 0.78 ** 0.69 ** 0.71 ** 0.70 *(2.9) (3.0) (3.5) (3.2) (2.9) (2.4)
R-sq 0.63 0.52 0.57 0.57 0.56 0.59
# observations 141 168 187 202 202 192
Numbers in parentheses are t-statistics.
**P<.01; *P<.05
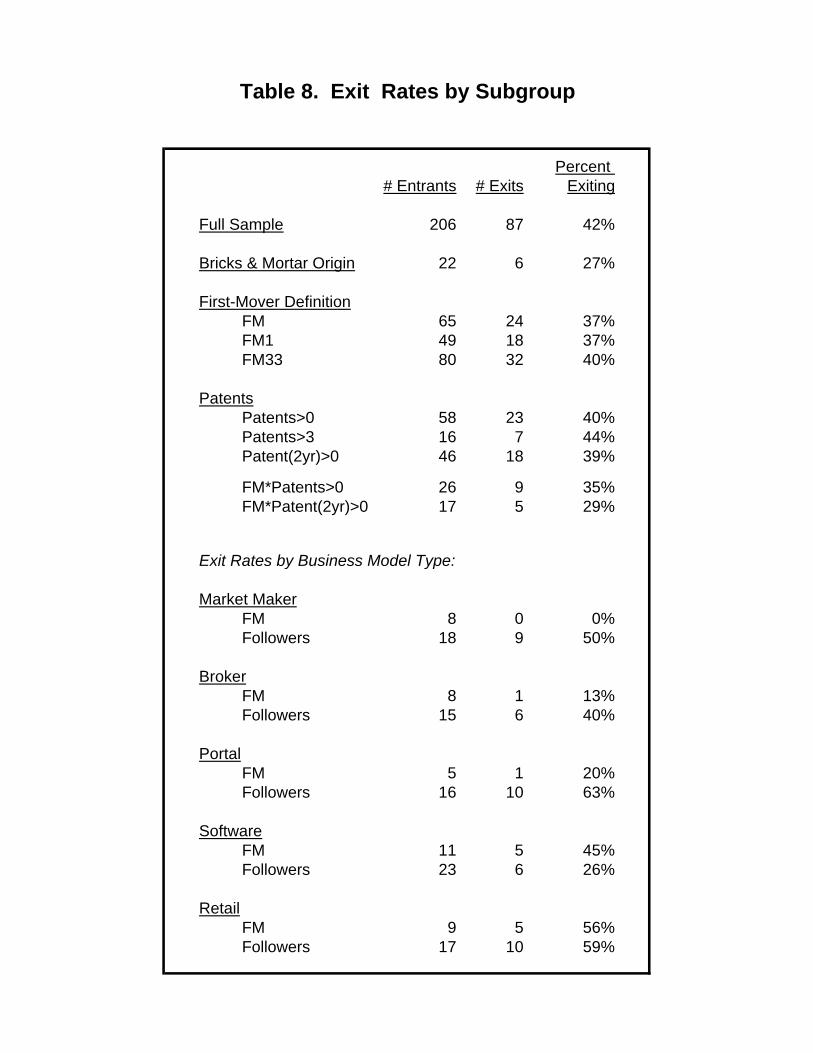
Percent # Entrants # Exits Exiting
Full Sample 206 87 42%
Bricks & Mortar Origin 22 6 27%
First-Mover DefinitionFM 65 24 37%FM1 49 18 37%FM33 80 32 40%
PatentsPatents>0 58 23 40%Patents>3 16 7 44%Patent(2yr)>0 46 18 39%
FM*Patents>0 26 9 35%FM*Patent(2yr)>0 17 5 29%
Exit Rates by Business Model Type:
Market MakerFM 8 0 0%Followers 18 9 50%
BrokerFM 8 1 13%Followers 15 6 40%
PortalFM 5 1 20%Followers 16 10 63%
SoftwareFM 11 5 45%Followers 23 6 26%
RetailFM 9 5 56%Followers 17 10 59%
Table 8. Exit Rates by Subgroup

Appendix
Industry Sub-Industry Company Name MCAP 3Q/02 FM1 FM FM33 EXITED ACQUIREDCHAP11
Advertising/Marketing Advertising Network DoubleClick Inc 698.7 1 1 1 0 0 0
Advertising/Marketing Advertising Network ValueClick 197.2 0 0 1 0 0 0
Advertising/Marketing Advertising Network 24/7 Media, Inc.@ 19.1 0 0 1 0 0 0
Advertising/Marketing Advertising Network Mediaplex Inc NA 0 0 0 1 0 0
Advertising/Marketing Advertising Network Engage Media 3.6 0 0 0 0 0 0
Advertising/Marketing Advertising Network L90 Inc NA 0 0 0 1 1 0
Advertising/Marketing E-Mail/promotion Marketing Promotions.com NA 1 1 1 1 1 0
Advertising/Marketing E-Mail/promotion Marketing Netcentives Inc NA 0 0 1 1 0 1
Advertising/Marketing E-Mail/promotion Marketing Coolsavings.com 3.3 0 0 1 0 0 0
Advertising/Marketing E-Mail/promotion Marketing Be Free Inc NA 0 0 1 1 1 0
Advertising/Marketing E-Mail/promotion Marketing MyPoints.com Inc NA 0 0 0 1 1 0
Advertising/Marketing E-Mail/promotion Marketing Cybergold NA 0 0 0 1 1 0
Advertising/Marketing E-Mail/promotion Marketing Net Creations NA 0 0 0 1 1 0
Advertising/Marketing E-Mail/promotion Marketing FreeShop.com Inc 3 0 0 0 0 0 0
Advertising/Marketing E-Mail/promotion Marketing LifeMinders.com NA 0 0 0 1 0 0
Advertising/Marketing E-Mail/promotion Marketing Exactis.com Inc NA 0 0 0 1 1 0
Autos Broker/referral Autoweb NA 1 1 1 1 1 0
Autos Broker/referral Autobytel 74.8 0 0 0 0 0 0
B2B e-commerce platform Ariba Inc. 358.5 1 1 1 0 0 0
B2B e-commerce platform Commerce One Inc 86.6 0 0 0 0 0 0
B2B vertical marketplace FreeMarkets 207.5 1 1 1 0 0 0
B2B vertical marketplace Vertical Net 12 1 1 1 0 0 0
B2B vertical marketplace Purchasepro.com Inc 0.668 0 0 0 0 0 0
B2B vertical marketplace Sciquest.com 18.7 0 0 0 0 0 0
B2B vertical marketplace Bid NA 0 0 0 1 0 0
B2B vertical marketplace Ventro NA 0 0 0 1 0 0
B2B e-learning Healthstream Inc 18.4 1 1 1 0 0 0
B2B e-learning Click2Learn 15.3 1 1 1 0 0 0
B2B e-learning Digitalthink Inc 45.6 0 0 0 0 0 0
B2B e-learning Docent 32.7 0 0 0 0 0 0
B2B e-learning Saba Software 101.8 0 0 0 0 0 0
B2B e-learning Riverdeep Interactive Le 236.8 0 0 0 0 0 0
B2C Consumer Markets Books Amazon 6061 1 1 1 0 0 0
B2C Consumer Markets Books Barnes and Noble 79.8 0 0 0 0 0 0
B2C Consumer Markets Books Books A Million 54.3 0 0 0 0 0 0
B2C Consumer Markets Electronics Value America Inc NA 1 1 1 1 0 1
B2C Consumer Markets Electronics Egghead.com NA 0 0 1 1 0 1
B2C Consumer Markets Electronics Cyberian Outpost, Inc NA 0 0 0 1 0 0
B2C Consumer Markets Electronics Buy.Com Inc NA 0 0 0 1 1 0
B2C Consumer Markets Electronics Onvia.com Inc 15.8 0 0 0 0 0 0
B2C Consumer Markets Entertainment-Tickets Ticketmaster 2196 1 1 1 0 0 0
B2C Consumer Markets Entertainment-Tickets Tixx.com 5.9 0 0 0 0 0 0
B2C Consumer Markets Flowers 1-800-Flowers.com Inc 455.4 1 1 1 0 0 0
B2C Consumer Markets Flowers FTD.com 230 0 0 0 0 0 0
B2C Consumer Markets Groceries Peapod NA 1 1 1 1 1 0
B2C Consumer Markets Groceries Streamline NA 0 0 1 1 0 0
B2C Consumer Markets Groceries Homegrocer NA 0 0 1 1 1 0
B2C Consumer Markets Groceries Webvan NA 0 0 0 1 0 1
B2C Consumer Markets Online Fashion Mall Fashionmall.com 3.7 1 1 1 0 0 0
B2C Consumer Markets Online Fashion Mall Bluefly.com 8.8 0 0 0 0 0 0
B2C Consumer Markets Online Fashion Mall Ashford.Com Inc NA 0 0 0 1 1 1
B2C Consumer Markets Sporting Goods FogDog NA 1 1 1 1 1 0
B2C Consumer Markets Sporting Goods Global Sports 200.4 0 0 0 0 0 0
B2C Consumer Markets Toys Etoys NA 1 1 1 1 0 1
B2C Consumer Markets Toys Rightstart NA 0 0 0 0 0 0
B2C Consumer Markets Toys smarterkids.com NA 0 0 0 1 0 0
Consulting Services Cambridge Technology Partners NA 1 1 1 1 1 0
Consulting Services Sapient 129.1 0 1 1 0 0 0
Consulting Services Lante Corp NA 0 1 1 1 1 0
Consulting Services Organic NA 0 1 1 1 1 0
Consulting Services Diamond Technology Partners 101.9 0 1 1 0 0 0
Consulting Services Agency.com NA 0 1 1 1 1 0
Consulting Services iXL Enterprises NA 0 1 0 1 0 0
Consulting Services Razorfish Inc 6.2 0 1 0 0 0 0
Consulting Services PEC Solutions 589.1 0 0 0 0 0 0
Consulting Services US Interactive Inc NA 0 0 1 1 0 1
Consulting Services Marchfirst NA 0 0 0 1 0 1
Consulting Services Mainspring Communications NA 0 0 0 1 1 0
Consulting Services Proxicom NA 0 0 0 1 1 0
Consulting Services C-Bridge Internet NA 0 0 0 1 0 0
Consulting Services Inforte Corp 59.3 0 0 0 0 0 0
Consulting Services Viant 78.7 0 0 0 0 0 0
Consulting Services Perficient 6.8 0 0 0 0 0 0
Consulting Services Scient NA 0 0 0 1 1 1
Consulting Services AnswerThink Consulting 68.7 0 0 0 0 0 0
Consulting Services Circle.Com NA 0 0 0 1 1 0
Consulting Services Xpedior NA 0 0 0 1 0 1
Consulting Services Digitas Inc 138.7 0 0 0 0 0 0
Consulting Services Luminant Worldwide Corp NA 0 0 0 1 1 1
Consumer Auctions Ebay 14883 1 1 1 0 0 0
Consumer Auctions FairMarket 30.7 0 0 1 0 0 0
Consumer Auctions Qxl 6.1 0 0 0 0 0 0
Consumer Auctions Ubid NA 0 0 0 1 1 0
C&C - Portals Portal - General Yahoo 5747 1 1 1 0 0 0
C&C - Portals Portal - General Lycos Inc(CMG@Ventures) NA 0 0 1 1 1 0
C&C - Portals Portal - General InfoSpace.com Inc 142.3 0 0 0 0 0 0
C&C - Portals Portal - General Looksmart.com 95 0 0 0 0 0 0
C&C - Portals Portal - General About.Com NA 0 0 0 1 1 0
C&C - Portals Portal - General GoTo.Com NA 0 0 0 1 0 0
C&C - Portals Portal - Chinese China.com Corp 208.5 1 1 1 0 0 0
C&C - Portals Portal - Chinese Sohu.com (Chinese) 69.6 0 0 0 0 0 0
C&C - Portals Portal - Chinese Sina.Com Corp 99.1 0 0 0 0 0 0
C&C - Portals Spanish Portal StarMedia Network Inc NA 1 1 1 1 0 0
C&C - Portals Spanish Portal El Sitio International C NA 0 0 1 1 0 0
C&C - Portals Spanish Portal Quepasa.com Inc NA 0 0 0 1 0 0
C&C - Portals Spanish Portal Terra Networks(Telefonic NA 0 0 0 0 0 0
Employment Dice 11.5 1 1 1 0 0 0
Employment TMP Worldwide 1005 0 1 1 0 0 0
Employment Careerbuilder.com NA 0 0 0 1 0 1
Employment Webhire.com 2.8 0 0 0 0 0 0
Employment HotJobs.com Ltd NA 0 0 0 1 0 0
Employment E-Cruiter.com Inc NA 0 0 0 0 0 0
Employment HeadHunter Inc NA 0 0 0 1 0 0
Financial Services Banking Digital Insight Corp 505.6 1 1 1 0 0 0
Financial Services Banking Net.B@nk Inc 518.2 0 0 0 0 0 0
Financial Services Banking Netzee Inc 1.1 0 0 0 0 0 0
Financial Services Stockbroker Charles Schwab 11874 1 1 1 0 0 0
Financial Services Stockbroker E*Trade Group Inc 1626 0 1 1 0 0 0
Financial Services Stockbroker Ameritrade 806.9 0 0 0 0 0 0
Financial Services Stockbroker DLJdirect (now CSFB direct) NA 0 0 0 1 1 0
Financial Services Stockbroker AB Watley 1.3 0 0 0 0 0 0
Financial Services Stockbroker Web Street Inc NA 0 0 0 1 1 0
Financial Services Stockbroker TD Waterhouse Group Inc NA 0 0 0 0 0 0
Financial Services Mortage E-Loan Inc 81.4 1 1 1 0 0 0
Financial Services Mortage LendingTree Inc 326.9 0 0 1 0 0 0

Financial Services Mortage American Home Mrtg Hldgs 175.2 0 0 0 0 0 0
Financial Services Mortage Mortgage.com Inc NA 0 0 0 1 0 1
Financial Services Insurance-quote aggregator Quotesmith.com Inc 12.3 1 1 1 0 0 0
Financial Services Insurance-quote aggregator Insweb Corp 12.5 0 0 0 0 0 0
Financial Services content/portal Multex.com Inc 101.4 1 1 1 0 0 0
Financial Services content/portal Marketwatch 72.2 0 0 0 0 0 0
Financial Services content/portal TheStreet.com 53 0 0 0 0 0 0
Health and Medicine Drugstores drugstore.com 113.8 1 1 1 0 0 0
Health and Medicine Drugstores Planetrx NA 0 0 0 1 0 0
Health and Medicine Health Stores Mothernature.com NA 1 1 1 1 0 1
Health and Medicine Health Stores Vitaminshoppe.com NA 0 0 0 1 0 0
Health and Medicine Rx management Allscripts Inc 109.9 1 1 1 0 0 0
Health and Medicine Rx management Medscape Inc NA 0 0 0 1 1 1
Health and Medicine Content/other HealthGate Data Corp 0.361 1 1 1 0 0 0
Health and Medicine Content/other Healtheon Corp 1500 0 0 0 0 0 0
Health and Medicine Content/other Healthcentral.com Inc NA 0 0 0 1 1 1
Internet Infrastructure Content Delivery Network Digital Island/Sandpiper NA 1 1 1 1 1 0
Internet Infrastructure Content Delivery Network Inktomi Corp 36.6 0 0 1 0 0 0
Internet Infrastructure Content Delivery Network iBeam NA 0 0 0 1 0 1
Internet Infrastructure Content Delivery Network Akamai Technologies Inc 96.6 0 0 0 0 0 0
Internet Services Domain Name Network Solutions (verisign) NA 1 1 1 0 0 0
Internet Services Domain Name Register.com 121.3 0 0 0 0 0 0
Internet Services E-Mail Software.com NA 1 1 1 1 1 0
Internet Services E-Mail CommTouch Software Ltd NA 0 1 1 0 0 0
Internet Services E-Mail Mail.com NA 0 0 0 1 0 0
Internet Services E-Mail Easy Link 24.4 0 0 0 0 0 0
Internet Services E-Mail Critical Path 50.2 0 0 0 0 0 0
Internet Services Hosting Exodus NA 1 1 1 1 0 1
Internet Services Hosting Digex Inc 11 0 0 1 0 0 0
Internet Services Hosting Data Return Corp NA 0 0 0 1 1 0
Internet Services Hosting Interliant NA 0 0 0 1 0 1
Internet Services Web Information Media Metrix Inc 5.9 1 1 1 0 0 0
Internet Services Web Information NetRatings Inc 194.7 0 0 0 0 0 0
Internet Services Web Information @plan.inc NA 0 0 0 0 1 0
ISP Free Juno Online Services NA 1 1 1 1 1 0
ISP Free Netzero Inc NA 0 0 0 0 0 0
Music Portal ARTISTdirect Inc 19.7 1 1 1 0 0 0
Music Portal Musicmaker.com Inc NA 0 0 1 1 0 0
Music Portal Audiohighway.com NA 0 0 0 1 0 1
Music Portal E-Music.com Inc NA 0 0 0 1 1 0
Music Portal MP3.COM Inc NA 0 0 0 1 1 1
Music Portal Launch Media Inc NA 0 0 0 1 1 0
Postage Stamps.com Inc 218 1 1 1 0 0 0
Postage E-Stamp Corp NA 0 0 0 1 0 0
Real Estate HomeSeekers.com 2.2 1 1 1 0 0 0
Real Estate Homestore.com Inc 35.4 1 1 1 0 0 0
Real Estate Homeservices Com Inc NA 0 0 0 1 1 0
Software - ebusiness eCRM: E-Services Delano Technology Corp NA 1 1 1 1 1 0
Software - ebusiness eCRM: E-Services Kana 18.3 0 1 1 0 0 0
Software - ebusiness eCRM: E-Services Primus Knowledge Solutions 6.1 0 0 1 0 0 0
Software - ebusiness eCRM: E-Services eshare NA 0 0 0 1 1 0
Software - ebusiness eCRM: E-Services E.piphany Inc 259.9 0 0 0 0 0 0
Software - ebusiness eCRM: E-Services Exchange Applications 0.265 0 0 0 0 0 0
Software - ebusiness eCRM: E-Services eGain Communications 4.7 0 0 0 0 0 0
Software - ebusiness eCRM: intelligence WebTrends Corporation NA 1 1 1 1 1 0
Software - ebusiness eCRM: intelligence Broadbase Software Inc NA 0 0 0 1 0 0
Software - ebusiness eCRM: intelligence Net Perceptions 24.6 0 0 0 0 0 0
Software - ebusiness eCRM: intelligence net.Genesis NA 0 0 0 1 1 0
Software - ebusiness eCRM: intelligence Accrue Software Inc 2 0 0 0 0 0 0

Software - ebusiness e-business suites/platforms BroadVision Inc 39.6 1 1 1 0 0 0
Software - ebusiness e-business suites/platforms Open Market Inc NA 0 1 1 1 1 0
Software - ebusiness e-business suites/platforms Allaire Corp NA 0 1 1 1 1 0
Software - ebusiness e-business suites/platforms InterWoven 213 0 0 0 0 0 0
Software - ebusiness e-business suites/platforms BEA Systems 2122 0 0 0 0 0 0
Software - ebusiness e-business suites/platforms Vignette 200.5 0 0 0 0 0 0
Software - ebusiness e-business suites/platforms Art Technology Group Inc (ATG) 67.1 0 0 0 0 0 0
Software - ebusiness e-business suites/platforms SilverStream Software In NA 0 0 0 1 1 0
Software - ebusiness e-business suites/platforms Blue Martini 38.7 0 0 0 0 0 0
Software infrastucture SeeBeyond 116.9 1 1 1 0 0 0
Software infrastucture NEON NA 0 1 1 0 0 0
Software infrastucture Vitria 101.8 0 0 0 0 0 0
Software infrastucture webMethods 245.9 0 0 0 0 0 0
Software infrastucture TIBCO Software Inc 781.2 0 0 0 0 0 0
Software infrastucture Crossworlds NA 0 0 0 1 1 0
Software interactive tv Spyglass Inc NA 1 1 1 1 1 0
Software interactive tv Liberate Technologies 167.9 0 0 0 0 0 0
Telephony NetSpeak Corp NA 1 1 1 1 0 0
Telephony Net2Phone 149.6 0 1 1 0 0 0
Telephony WorldQuest Networks Inc 11.9 0 0 0 0 0 0
Telephony Deltathree 13.9 0 0 0 0 0 0
Telephony Ibasis 11.4 0 0 0 0 0 0
Telephony ITXC Corp 115.4 0 0 0 0 0 0
Telephony Universal Access Inc 18.9 0 0 0 0 0 0
Travel Expedia Inc 2896 1 1 1 0 0 0
Travel Hotel Reservation Network 2920 0 1 1 0 0 0
Travel Travelocity NA 0 0 0 1 0 0
Travel Priceline.com Inc 335.5 0 0 0 0 0 0
Travel Getthere.Com Inc NA 0 0 0 1 1 0
Travel Netcruise.com NA 0 0 0 1 0 0
Women Networks Women.com Networks NA 1 1 1 1 1 0
Women Networks iVillage Inc 32 0 0 0 0 0 0