DICIN PAPR RIftp.iza.org/dp11417.pdfshooting at the headquarters of the satirical newspaper Charlie...
70
DISCUSSION PAPER SERIES IZA DP No. 11417 Marie-Anne Valfort Anti-Muslim Discrimination in France: Evidence from a Field Experiment MARCH 2018
Transcript of DICIN PAPR RIftp.iza.org/dp11417.pdfshooting at the headquarters of the satirical newspaper Charlie...

DISCUSSION PAPER SERIES
IZA DP No. 11417
Marie-Anne Valfort
Anti-Muslim Discrimination in France: Evidence from a Field Experiment
MARCH 2018

Any opinions expressed in this paper are those of the author(s) and not those of IZA. Research published in this series may include views on policy, but IZA takes no institutional policy positions. The IZA research network is committed to the IZA Guiding Principles of Research Integrity.The IZA Institute of Labor Economics is an independent economic research institute that conducts research in labor economics and offers evidence-based policy advice on labor market issues. Supported by the Deutsche Post Foundation, IZA runs the world’s largest network of economists, whose research aims to provide answers to the global labor market challenges of our time. Our key objective is to build bridges between academic research, policymakers and society.IZA Discussion Papers often represent preliminary work and are circulated to encourage discussion. Citation of such a paper should account for its provisional character. A revised version may be available directly from the author.
Schaumburg-Lippe-Straße 5–953113 Bonn, Germany
Phone: +49-228-3894-0Email: [email protected] www.iza.org
IZA – Institute of Labor Economics
DISCUSSION PAPER SERIES
IZA DP No. 11417
Anti-Muslim Discrimination in France: Evidence from a Field Experiment
MARCH 2018
Marie-Anne ValfortPSE - Paris 1 Panthéon Sorbonne University and IZA
ABSTRACT
IZA DP No. 11417 MARCH 2018
Anti-Muslim Discrimination in France: Evidence from a Field Experiment*
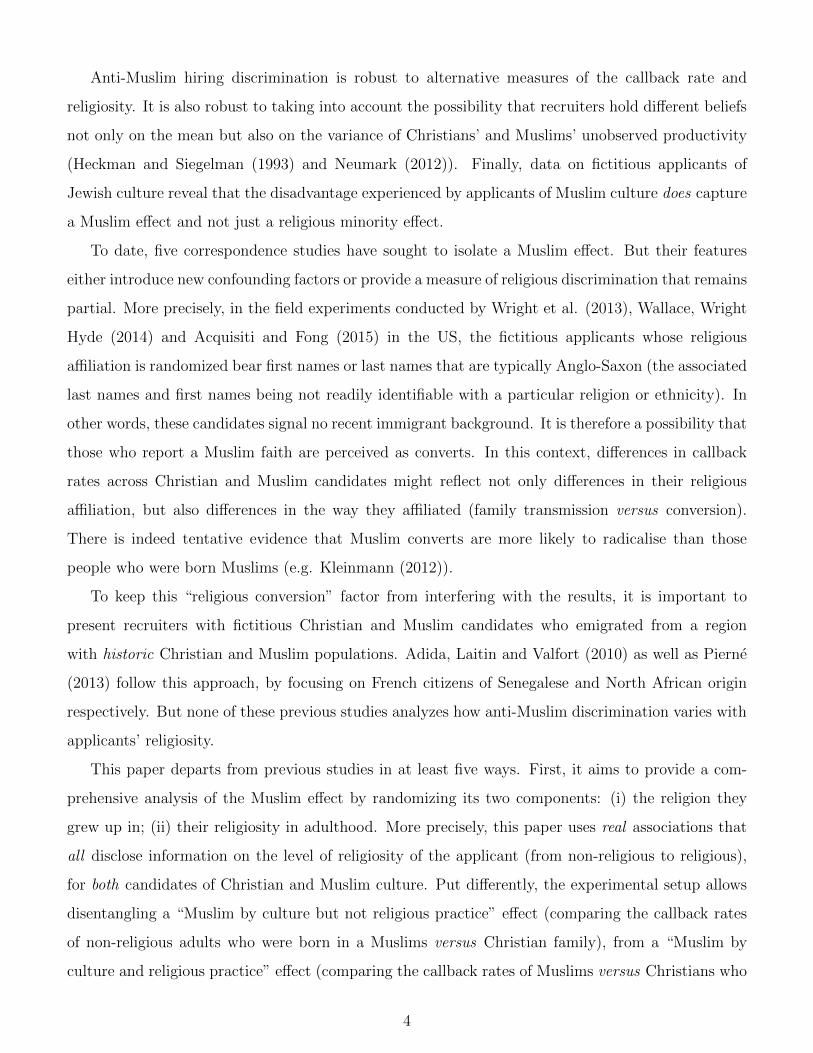
Relying on a correspondence study conducted in France before the 2015 attacks, this paper
compares the callback rates of immigrants of Muslim and Christian culture who originate
from the same country and whose religiosity varies from non-religious to religious. Based on
responses to over 6,200 job ads, the results reveal an insignificant disadvantage for Muslims
when they are not religious. However, Muslims lose further ground when they are religious,
while the reverse occurs for Christians. Consequently, religious Muslims must submit twice
as many applications as religious Christians before being called back by the recruiters. A
follow-up survey confirms that the signal used to convey fictitious applicants’ religiosity is
not only viewed as relevant but that it is also correctly interpreted by employers.
JEL Classification: C93, J15, J71, Z12
Keywords: religion, religiosity, Islam, discrimination, France, correspondence study
Corresponding author:Marie-Anne ValfortParis School of EconomicsParis 1 Panthéon Sorbonne UniversityCampus Jourdan48 Boulevard Jourdan75014 ParisFrance
E-mail: [email protected]
* I thank Pierre Cahuc, Stéphane Carcillo, Christopher S. Carpenter, Hippolyte d’Albis, Muriel Dejemeppe, Frédéric
Docquier, Esther Duflo, Pierre-Yves Geoffard, Daniel S. Hamermesh, Yannick L’Horty, Nicolas Jacquemet, Shulamit
Kahn, Michal Krawczyk, Kevin Lang, Dominique Meurs, William Parienté, Thomas Piketty, Erik Plug, Hillel Rapoport,
Roland Rathelot, Ernesto Reuben, Dan-Olof Rooth, Biagio Speciale, Jean-Robert Tyran, Bruno Van der Linden,
Ekaterina Zhuravskaya and participants at the IZA/CREST/OECD workshop on “Recent advances in the economics
of discrimination”, the Paris Seminar in Demographic Economics, the OECD ELS seminar, the 6th Annual Meeting
of the French Experimental Economics Association, the CENF seminar (King Abdulaziz University (Saudi Arabia) and
University Paris 1 Panth´eon Sorbonne), the IRES research seminar (Universit´e Catholique de Louvain), the Labex OSE
conference day (Paris School of Economics) and the Applied Economics Lunch seminar (Paris School of Economics) for
their generous guidance and helpful comments. I gratefully acknowledge the financial and logistical support of the
Institut Montaigne and of the Agence Nationale de la Recherche [Grant ANR-10-LABX-93-01].

The fact that there is a problem
with Islam is true. Nobody
doubts that.
French President F. Hollande, in
A President Shouldn’t Say That
(October 12, 2016)
1 Introduction
Since January 2015, France has been su↵ering a wave of Islamic violence that is more intense and
lethal than any other seen in the west in the wake of the 9/11 attacks.1 It would be misleading
to explain this French exception by the lower education and employment rate that, on average,
characterize France’s nearly 5 million Muslims (Aeberhardt et al. (2010) and Aeberhardt, Coudin and
Rathelot (2017)). There is indeed growing and consistent evidence that uneducated or impoverished
people are not more likely to support or engage in terrorist activity than better-educated or higher-
income individuals (e.g. Krueger (2008), Blattman and Ralston (2015)).
But a consensus has been emerging among experts on radical Islam in France2 and beyond3 that
anti-Muslim discrimination works as a catalyst in the radicalization process. This view was clearly
expressed by French President Emmanuel Macron in the aftermath of the Paris attacks of November
13, 2015: “Discrimination is not the main cause of jihadism – that is down to the madness of men,
and the totalitarian and manipulating spirit of certain people. But it provides a fertile ground”.4
1From 7 January 2015 to 9 January 2015, terrorist attacks killed a total of 17 people in four shootings (including theshooting at the headquarters of the satirical newspaper Charlie Hebdo and at the Hypercacher kosher supermarket).In November 2015, a series of coordinated terrorist attacks killed 130 people. In July 2016, a truck was deliberatelydriven into crowds celebrating Bastille Day on the Promenade des Anglais in Nice, thereby killing 86 people. Thesethree series of attacks led to a total of 233 deaths and 824 injured people.
2For instance, Khosrokhavar (2016) insists on Muslims’ “economic and social exclusion” that makes them “primetargets for jihadist propaganda”. Even Gilles Kepel and Olivier Roy, known to quarrel on whether France is facing a“radicalization of Islam” (Kepel) or an “Islamization of radicalism” (Roy) provide convergent views on the importantrole of anti-Muslim discrimination. Kepel (2015) acknowledges that the Salafi dynamic from abroad is most likely tospread among French Muslims who endure discrimination. And Roy (2016) points out that the generational revoltby a very specific category of Muslim youth (mainly second-generation Muslim immigrants) flows from their anger atseeing their parents’ religion being marginalized in France: “they are reclaiming, on their own terms, an identity that,in their eyes, their parents have debased”.
3Verwimp (2016) shows that the economic exclusion of Muslims is correlated with radical Islam in Europeancountries.
4This remark was uttered in French on 21 November 2015 when Emmanuel Macron was the French Minister ofEconomy, Industry and Digital A↵airs. Excerpts from the speech are available at https://www.theguardian.com/world/2015/nov/22/unpopular-francois-hollande-modest-poll-boost-paris-attacks (last accessed on May20, 2017).
1

It is striking that all these accounts assume that Muslims qua Muslims are discriminated against
in France, although this surmise has not been thoroughly tested yet. This paper aims to fill the gap
by exploring whether Muslims are unfairly treated in their access to employment. Failure to integrate
in the labor market has indeed been shown to compromise integration broadly speaking, notably by
engendering criminal behavior (Fougere, Kramarz and Pouget (2009)) and unhappiness (Hetschko,
Knabe and Schob (2014)).
Identifying anti-Muslim hiring discrimination constitutes a challenge for two reasons. First, it
requires disentangling a religious culture e↵ect from a geographic origin e↵ect.5 Save for Albania,
Muslim-majority countries are located outside of Christian-majority regions. Individuals originating
from Muslim-majority countries may therefore activate a particularly intense xenophobic feeling
among these regions’ host populations. Isolating a Muslim e↵ect also entails addressing an additional
confounding factor: religiosity. Relying on the World Values Survey, Fish (2011) shows that the
average Muslim respondent worldwide attaches more importance to God than the average Christian
respondent, a general finding that is confirmed when attention is restricted to France (Brouard and
Tiberj (2011) and Adida, Laitin and Valfort (2016a)). Yet, no study to date has disentangled a
Muslim e↵ect from a religiosity e↵ect. This paper is the first to fill this gap.
More precisely, to identify anti-Muslim discrimination, this paper compares the callback rates
of fictitious applicants of Muslim and Christian culture who are identical in every respect save the
religion they grew up in (Islam vs Christianity). Notably, for religion alone to be at play, the
national origin of the applicants is held constant: they emigrated from a country widely known for its
religious pluralism and here used for the first time to identify anti-Muslim discrimination: Lebanon.
Additionally, the experimental setup randomizes the religiosity of the applicants in adulthood (non-
religious vs religious), on top of their gender (female vs male) and quality (good vs outstanding). More
precisely, the “religiosity” treatment consists of varying the type, either non-religious or religious, of
the Scouting association in which the applicants are engaged as educators, in a context where human
5A plethora of correspondence studies (see Jowell and Prescott-Clarke (1970)) have revealed that nationals withMuslim North African or Middle Eastern sounding first and last names face strong hiring discrimination as compared tonationals with no recent immigrant background in Christian-majority countries (e.g. Booth et al. (2012) in Australia,Baert et al. (2015) in Belgium, Oreopoulos (2011) in Canada, Duguet et al. (2010) in France, Kaas and Manger (2012)in Germany, Blommaert et al. (2013) in the Netherlands, Carlsson and Rooth (2007) in Sweden, Widner and Chicoine(2011) in the US). Yet, these correspondence studies fail to isolate a Muslim e↵ect. Consider the correspondencestudy conducted by Duguet et al. (2010). The name of the “minority” candidate, “Yassine Mokraoui”, sends tothe recruiter two pieces of information: the applicant’s region of origin (North Africa) and the applicant’s religiousculture (Islam). Therefore, di↵erences in callback rates between Yassine Mokraoui and Clement Meunier (the native)cannot be attributed to di↵erences in religion only. They may also reflect that these applicants di↵er with respect togeographic origin.
2

resources managers and recruitment consulting firms typically encourage Scouting alumni to disclose
their (past) engagement. Such an engagement, they argue, does indeed reflect socio-emotional skills
that are highly valued by recruiters. A follow-up survey among a set of employers similar to those
who received the fictitious job applications confirms that employers view the mention of a Scouting
experience in a CV as relevant. Moreover, the survey reveals that employers correctly interpret this
signal by assigning a low religiosity to applicants involved in a non-religious Scouting association,
but a high religiosity to applicants involved in a religious Scouting association.
The results of my correspondence study reveal that Muslims qua Muslims are discriminated
against in France: the callback rate of applicants of Muslim culture (11.7%) is 6.7 percentage points
lower than that of their Christian counterparts (18.4%). This general finding masks substantial varia-
tion with respect to religiosity, gender and quality. Although non-religious Muslims show consistently
lower callback rates than non-religious Christians (12.9% vs 16.1%), this di↵erence is modest and
not statistically significant. But Muslims lose more ground when they are religious, unless they show
an outstanding profile. This “religiosity penalty” leads religious Muslims to be discriminated against
relative to non-religious Christians. This gap further widens when religious Muslims are compared
to religious Christians. While religiosity constitutes a penalty for Muslims, it works as a premium
for Christians: their callback rate is boosted when they are religious. Consequently, religious Mus-
lims must submit twice as many applications as religious Christians before being called back by the
recruiters. This result is largely driven by male applicants, due to the strong “religiosity premium”
experienced by Christian men: the callback rate of religious Muslim men (4.7%) is nearly four times
lower than that of their Christian counterparts (17.9%).
These findings suggest that anti-Muslim hiring discrimination is statistical: recruiters do not
discriminate against non-religious Muslims but they do discriminate against religious Muslims unless
they are outstanding. This pattern is consistent with religious Muslims being linked to a risk of
problematic behavior in the workplace that leads to discrimination when the quality of their CV is
not su�cient to counterbalance this risk. By contrast, and consistent with the fact that stereotypes
are context dependent (Bordalo et al. (2016)), religiosity helps Christians convince the recruiters.
But additional results indicate that anti-Muslim discrimination is also likely taste-based outside the
hiring process. More precisely, focusing on recruiters’ behavior toward applicants once they have
made the choice of not interviewing them reveals that applicants of Muslim culture are less likely to
be notified of a negative response. Moreover, the tone of the negative response, when notified, is less
a↵able to them.
3
Anti-Muslim hiring discrimination is robust to alternative measures of the callback rate and
religiosity. It is also robust to taking into account the possibility that recruiters hold di↵erent beliefs
not only on the mean but also on the variance of Christians’ and Muslims’ unobserved productivity
(Heckman and Siegelman (1993) and Neumark (2012)). Finally, data on fictitious applicants of
Jewish culture reveal that the disadvantage experienced by applicants of Muslim culture does capture
a Muslim e↵ect and not just a religious minority e↵ect.
To date, five correspondence studies have sought to isolate a Muslim e↵ect. But their features
either introduce new confounding factors or provide a measure of religious discrimination that remains
partial. More precisely, in the field experiments conducted by Wright et al. (2013), Wallace, Wright
Hyde (2014) and Acquisiti and Fong (2015) in the US, the fictitious applicants whose religious
a�liation is randomized bear first names or last names that are typically Anglo-Saxon (the associated
last names and first names being not readily identifiable with a particular religion or ethnicity). In
other words, these candidates signal no recent immigrant background. It is therefore a possibility that
those who report a Muslim faith are perceived as converts. In this context, di↵erences in callback
rates across Christian and Muslim candidates might reflect not only di↵erences in their religious
a�liation, but also di↵erences in the way they a�liated (family transmission versus conversion).
There is indeed tentative evidence that Muslim converts are more likely to radicalise than those
people who were born Muslims (e.g. Kleinmann (2012)).
To keep this “religious conversion” factor from interfering with the results, it is important to
present recruiters with fictitious Christian and Muslim candidates who emigrated from a region
with historic Christian and Muslim populations. Adida, Laitin and Valfort (2010) as well as Pierne
(2013) follow this approach, by focusing on French citizens of Senegalese and North African origin
respectively. But none of these previous studies analyzes how anti-Muslim discrimination varies with
applicants’ religiosity.
This paper departs from previous studies in at least five ways. First, it aims to provide a com-
prehensive analysis of the Muslim e↵ect by randomizing its two components: (i) the religion they
grew up in; (ii) their religiosity in adulthood. More precisely, this paper uses real associations that
all disclose information on the level of religiosity of the applicant (from non-religious to religious),
for both candidates of Christian and Muslim culture. Put di↵erently, the experimental setup allows
disentangling a “Muslim by culture but not religious practice” e↵ect (comparing the callback rates
of non-religious adults who were born in a Muslims versus Christian family), from a “Muslim by
culture and religious practice” e↵ect (comparing the callback rates of Muslims versus Christians who
4
practice the religion they inherited from their parents).6
The second dimension that this paper seeks to improve upon is related to gender. Adida, Laitin
and Valfort (2010) restrict their attention to female candidates, while Pierne (2013) concentrates on
male applicants. By contrast, this paper is the first to include both male and female applicants and,
hence, address whether anti-Muslim discrimination (if any) varies with gender. Third, the previous
studies do not randomize the quality of the fictitious job applications, thereby limiting the exploration
of whether anti-Muslim hiring discrimination is statistical. Fourth, this correspondence study is the
first to test for taste-based discrimination outside the hiring process by analyzing the probability that
the recruiters notify their response in case it is negative as well as the tone of this negative response.
Fifth, this paper is unique by including fictitious applicants of Jewish culture in order to disentangle
whether anti-Muslim discrimination is directed at Muslims qua Muslims or at any religious minority.
The paper proceeds as follows. Section 2 provides some background on why French recruiters
would discriminate against Muslim applicants. Section 3 describes the experimental setup, including
the follow-up survey that tests for employers’ perception of the “religiosity” signal. Section 4 presents
the main findings of the correspondence study. Section 5 provides robustness checks. Finally, Section
6 concludes and highlights avenues for future research.
2 Background
Why would French recruiters discriminate against Muslim applicants? According to economic theory,
anti-Muslim discrimination could be taste-based (Becker (1957)) and/or statistical (Phelps (1972),
Arrow (1973), Aigner and Cain (1977)). Taste-based anti-Muslim discrimination refers to a situation
in which employers, workers and/or consumers display a weaker taste (or stronger distaste) toward
6By contrast, Adida, Laitin and Valfort (2010) do not vary the religiosity in adulthood of the applicants of Christianand Muslim culture: both are involved in a religious association in adulthood. Pierne (2013) goes a step further byintroducing, on top of applicants of North African background involved in a Christian or Muslim (non Scouting)association, candidates with North African roots who are engaged in an association that reveals no information ontheir religiosity. He shows that these latter candidates (who are surely perceived by recruiters as being of Muslimculture since North Africa is a Muslim-majority region) have a 50% higher chance of being invited to a job interviewthan are their counterparts engaged in a Muslim association. However, this result does not necessarily mean thatapplicants of Muslim culture are penalized when they stress their religiosity. Rather, this finding may reflect thatdisclosing one’s religiosity in a job application is seen as inappropriate (at least when religiosity is not conveyedthrough the applicant’s engagement in a Scouting association), irrespective of the candidate’s religious denomination(see Weichselbaumer (2016) for another illustration of this overlap). Another concern is that the Muslim associationchosen by Pierne (2013) is fictitious. It is therefore impossible to surmise the level of religiosity that recruiters attachto this association, which leaves the di↵erence in callback rates between the religious and the “secular” applicant ofMuslim culture di�cult to interpret. Finally, Pierne’s experimental setup does not include “secular” applicants ofNorth African background and Christian culture. The religiosity e↵ect among applicants of Muslim culture thereforecannot be compared to what this e↵ect would be among applicants of Christian culture.
5
Muslims than toward a reference group. This unequal treatment is irrational to the extent that
it comes about irrespective of Muslims’ productive characteristics. As such, it should be directed
indi↵erently at any person who is perceived as Muslim.
Anti-Muslim taste-based discrimination in France is to be expected, given human beings’ tendency
to irrationally favour their ingroup over their outgroup (see the seminal papers of Tajfel (1970), Billig
and Tajfel (1973) or Locksley, Ortiz et Hepburn (1980) and the more recent studies of Chen and Li
(2009) or Currarini and Mengel (2016)). Although secularization has yielded a continuous decrease
in their proportion among the French population, Christians (who are overwhelmingly Catholic in
France) still account for a majority: according to IFOP (2010), individuals who self-identify as
Catholic amount to 64% of the French population in 2010 (as opposed to 81% in 1952), the remainder
of the population being broken down between those with no religion (28%), who are mainly of
Catholic roots, and those with other religions (8%). Put di↵erently, Christians constitute an ingroup
and Muslims an outgroup for a majority of French citizens.
But anti-Muslim discrimination can be statistical as well. Statistical discrimination emerges due
to a lack of precise information about candidates’ productivity. In this context, recruiters rely on
their beliefs about how unobserved individual productive characteristics correlate, on average, with
group membership. Survey-based evidence suggests that anti-Muslim statistical discrimination is at
work and flows notably from the belief that religiosity increases the risk of transgressive behavior
when it emanates from Muslims rather than from Christians. According to Harris Interactive (2013),
only 26% of a representative sample of French respondents hold a “very good” or “quite good” image
of Islam, compared to 69% for Catholicism. This di↵erence is mainly driven by a large majority of
interviewees (63%) who consider that “Islamic practice is not compatible with French Republican
laws”.
3 Experimental setup
The experimental setup implements the good practices set by earlier correspondence studies with
respect to (i) creating the fictitious applications, (ii) responding to job ads, and (ii) measuring
recruiters’ responses (e.g. Bertrand and Mullainathan (2004), Lahey (2008), Oreopoulos (2011), Kroft
et al. (2013), Eriksson and Rooth (2014), Bartos et al. (2016), Deming et al. (2016) or Neumark,
Burn and Button (2016)). It is unique, however, in its method of devising the “religious culture”
treatment and the “religiosity” treatment, given that no previous study has tried to disentangle their
6
e↵ects. The experimental setup is also distinctive by including a follow-up survey to ensure that
the signal used to convey fictitious applicants’ religiosity is not only viewed as relevant but that it
is also correctly interpreted by employers. Finally, the experimental setup departs from previous
research by not implementing a matched-pairs design, whereby multiple types of applications are
sent to the same job ad. Matched pairs obviously make it possible to achieve su�cient power with a
smaller pool of job postings. Yet, this approach comes with several drawbacks (Lahey and Beasley
(2016)). Notably, it entails a risk of detection by the recruiters and, thus, of bias in the way they deal
with the applicants (Weichselbaumer (2015)).7 Additionally, matched pairs are incompatible with
exactly symmetric applications across treatments. Matched pairs also exacerbate the ethical concerns
associated with correspondence studies since they make greater use of employers’ time without their
consent.
3.1 Creating the fictitious applications
In order to produce a set of realistic applications, the general template used in this correspondence
study derives from resumes of actual job seekers downloaded on the website of Pole Emploi, the
French national employment agency. The scope of the study is restricted to accounting clerk jobs
and accountant jobs for two reasons. First, the accountancy sector is known8 to show low sensitivity
to economic recession, an important condition for the success of a correspondence study in a period
of economic downturn (since otherwise the callback rates might not have risen much above zero for
any of the applicants). Second, accountancy jobs are relevant for a wide range of economic sectors,
thereby increasing the external validity of the results.
The applicants are between 25 and 26 at the time of the correspondence study. They obtained
their senior high school diploma (Baccalaureat) in the field of management science and technology
(STG, Sciences et Technologies de la Gestion) from the senior high school Emile Dubois in the
14th district of Paris. The accountants earned a technical degree taken at the end of a two-year
7In the case of detection, the recruiters may respond more favorably to the minority applicants than they otherwisewould for fear of “naming and shaming”. Consequently, discrimination would be underestimated.
8As an illustration, here is what could be read on French recruitment websites or in French economic newspapersat the time when the correspondence study was conducted: “Against a gloomy economic backdrop and rising unem-ployment, the auditing, accountancy, and finance sector is experiencing stable recruitment. A small rise in intentionsto hire, 4%, was even observed for 2013. Supply remains steady, and applicants do not have trouble finding jobs.”(Source: “Audit, compta, finance: Des metiers qui ne connaissent pas la crise,” on regionsjob.com, last accessed onJanuary 24, 2017). See also Vincent Bouquet, “La finance et la comptabilite d’entreprise recrutent toujours,” in Les
Echos (October 16, 2014): “‘Every business has to keep track of its accounts, control its costs, and steer its financialperformance,’ notes the recruiting firm [Robert Half] to explain the resilience of the labor market in finance andaccountancy.”
7

higher education course (BTS, Brevet de technicien superieur) in accountancy and organizational
management (CGO, Comptabilite et gestion des organisations), while the accounting clerks show
a certificate qualifying them for the position of “managerial assistant in small and medium-sized
business and industry” (Assistant(e) de gestion PME/PMI ). The applicants have each had about
four years of work experience, which they got in Paris and the surrounding region (the Ile-de-France)
by working on successive fixed-term contracts varying in length from six to 18 months.9
3.2 The treatments
The fictitious applicants are identical in every respect save a set of treatment variables. Notably, they
show the same national origin: they were born Lebanese citizens in Beirut in 1988. As an illustration
of this common national origin, all the candidates bear the same last name: “Haddad,” which means
“blacksmith” in Arabic. This last name is as common in Lebanon as the surname “Smith” is in the
English-speaking world, and it may be borne indi↵erently by a Muslim or a Christian.
The fictitious applicants arrived in France at the start of senior high school (lycee) in 2003 and
acquired French citizenship in 2008. The latter information reveals their good integration. In addition
to conditions concerning the age of the applicants and their period of residency in France (conditions
that are all fulfilled by the fictitious candidates), naturalization indeed requires that the applicants
are proficient in French. Moreover, they must show a good knowledge of French history and culture,
as well as of the rights and duties of French citizens. Finally, applicants must have demonstrated
their loyalty toward French institutions.10
The experimental setup randomizes four characteristics of applicants: their religious culture
(Christian vs Muslim), their religiosity in adulthood (non-religious vs religious), their gender (fe-
male vs male), and their quality (good vs outstanding). The sections below describe these four
treatments.
3.2.1 The “religious culture” treatment
The “religious culture” treatment consists of randomizing the religion the applicants grew up in.
Two pieces of information are manipulated to convey this culture. First, the applicants’ first names,
9In France, the maximum duration for a fixed-term contract (CDD, contrat a duree determinee) is 18 months.Source: “Quelle peut etre la duree maximale d’un CDD?”, site vosdroits.service-public.fr, last accessed on January 24,2017.
10See “Naturalisation par decret” (http://www.prefecturedepolice.interieur.gouv.fr/, last accessed on Jan-uary 24, 2017).
8
based on the Name Frequency Dataset (Fichier des prenoms) managed by the French national insti-
tute of statistics and economic studies (Institut national de la statistique et des etudes economiques
(INSEE )). This dataset uses birth certificates to calculate, for each first name and each year since
1946, the number of babies who were registered with this first name. This information permits the
identification, for each gender, of the five most frequent Christian and Muslim first names.11 One first
name among this top five is then randomly selected to produce distinctively Christian and Muslim
identities: “Michel” and “Nathalie” for Christians, and “Mohammed” and “Samira” for Muslims are
the result of this random draw.12
The second piece of information used to convey the religious culture of the applicants relates to
the religious denomination of the junior high school (college) from which they graduated in Beirut.
Michel and Nathalie obtained their middle-high-school diploma (brevet) at the “private bilingual
French-Arab Catholic secondary school Notre-Dame-de-Nazareth (Beirut)” while Mohammed and
Samira did so at the “private bilingual French-Arab Muslim secondary school Amilieh (Beirut).” Of
course, these establishments are real junior high schools in Lebanon.13
Stressing that both the Christian and the Muslim applicants went to a distinguished French-
Arab bilingual school cancels out one potential source of statistical discrimination against Muslims:
recruiters’ beliefs that Christians are more proficient in French (i) because of their schooling in
Christian establishments in Lebanon where French is more likely to be used for teaching purposes,
and (ii) because of their frequentation in France of Christian places of worship where French is more
likely to be the language of prayer than it is in mosques. It is important to note that the mastery of
French by the Christian and Muslim applicants is emphasized not only in their CV, but also in their
letters of application where recruiters read: “I wish to stress that although I was born Lebanese of
Lebanese parents, I command French perfectly, having been schooled in Lebanon up until the time I
arrived in France (at the start of senior high school) in establishments that were bilingual in French
and Arabic.”11A Christian first name is defined as a first name of Hebrew or Latin origin that has become common in France,
i.e. that is part of the French (Christian) culture. A Muslim first name is defined as a first name of Arabic origin.12The top 5 for (i) Christian male first names are “Jean”, “Philippe”, “Michel”, “Alain” and “Nicolas;” (ii) Christian
female first names are “Marie”, “Nathalie”, “Isabelle”, “Sylvie” and “Catherine;” (iii) Muslim male first names are“Mohamed/Mohammed”, “Mehdi”, “Karim”, “Amine” and “Rachid;” (iv) Muslim female first names are “Malika”,“Yasmine/Yasmina”, “Kenza”, “Samia” and “Samira.” The top 5 for Muslim first names is obtained after excludingdual gender first names (“Ali”, “Sofiane” and “Yassine/Yacine”).
13See their websites: http://www.ndn.edu.lb/ and http://www.amilieh.org/.
9
3.2.2 The “religiosity” treatment
The “religiosity” treatment consists of randomizing the type, either non-religious or religious, of the
Scouting association in which the applicants are engaged as volunteer leaders. This information
appears under the heading “outside interests” in their CV. More precisely, the CV of the religious
applicants stresses that Michel and Nathalie “train young people in the Catholic Scouting association
Scouts and Guides of France14,” and that Mohammed and Samira do so in “the Muslim Scouting
association Muslim Scouts of France15.” By contrast, the CV of the non-religious applicants indicates
that they are engaged in the “laıc [a synonym for “non-religious” in French] Scouting association Girl
and Boy Scouts of France.” Individuals engaged in this association will be perceived as non-religious
not only due to the term “laıc” but also because Scouting is historically a religious movement.
Explicitly departing from this tradition by joining the Girl and Boy Scouts of France16 should signal
an attachment to non-religiosity.
Together with Jewish and Protestant sections, the three Scouting associations used in the cor-
respondence study (see above) form the Federation of French Scouting. This federation is part of
the World Organization of the Scout Movement, known for contributing “to the education of young
people (...) to help build a better world where people are self-fulfilled as individuals and play a
constructive role in society”.17 Scouting does indeed convey a positive image among the general
public in France and abroad. According to a poll conducted in January 2014 by Opinionway among
a representative sample of 1,061 interviewees in France, 63% of the respondents report having a good
opinion on this movement, with more than 75% of the sample considering that individuals involved
in Scouting are respectful of others. This pattern notably implies that people a�liated to religious
Scouting associations will not be viewed as fundamentalists willing to impose their views on the rest
of the society but, rather, as religious people valuing prosocial behavior.
This overall good perception explains why Scouting alumni are typically encouraged by human
resources managers and recruitment consulting firms to disclose their (past) engagement. As an
illustration, Forbes Magazine published in 2016 an article entitled “Why hire someone who has been
a Scout” whose conclusion is clear-cut: “If you have been a Scout and Scout educator, include it in
your CV and talk about it during your job interview. If you are looking for talent, don’t miss the
competitive advantages of being a Scout.” In fact, this article considers that “the same as ‘proficiency’
14See https://www.sgdf.fr/.15See http://scoutsmusulmans.fr/#Home.16See http://www.eedf.fr/.17See https://www.scout.org/mission.
10

validates a high level of English language knowledge, to find that a person has been a Scout in a
personal CV guarantees that the person has essential skills to deal with the current job market.”18
France is no exception, with Scouting being regularly presented as a valuable asset throughout one’s
career.19 Put di↵erently, signalling one’s membership in one of the main French Scouting associations
in one’s CV is likely viewed by recruiters as an advantage and, hence, a relevant information. This
surmise is further tested in Section 3.5 which presents the results of a follow-up survey among a set
of employers similar to those who received the fictitious job applications.
3.2.3 The “gender” treatment
As is apparent above, this correspondence study involves candidates whose gender (female or male) is
randomized. This feature allows testing for the first time whether anti-Muslim hiring discrimination
(if any) varies with the gender of the fictitious applicant.
3.2.4 The “quality” treatment
The “quality” treatment consists of randomizing whether an application is “good” or “outstanding”.
Compared to the good CVs, the outstanding ones signal the excellence of the applicant under every
heading. More precisely, the outstanding applicants are distinctive along five dimensions: (i) they
made the honors list when they graduated from high school, whereas good applicants received no
special mention; (ii) they show an accumulated job experience of 4.5 years which exceeds that of the
good applicants by one year: they need less than two months to find a new job, as opposed to almost
six months for the good applicants; (iii) they pro↵er a confirmed level of mastery of four di↵erent
accounting/payroll/ management software systems valued by recruiters, whereas the good profiles
signal an intermediate level of mastery of just one of them; (iv) their proficiency in English is “fluent
(reading +++, writing +++, spoken +++)” as opposed to “beginner (reading +, writing +, spoken
+)”; (v) they practice one of their extra-curricular activities, Sudoku, at competition level.
The “quality” treatment aims to explore the source of anti-Muslim discrimination (statistical
and/or taste-based). Evidence suggests that the screening process is more e�cient as the skill level
18In particular, Scouting alumni are described as people who (i) know how to work in teams; (ii) are creative;(iii) know how to lead and how to be led; (iv) have empathy for others; (v) value e↵ort; (vi) know how to set goalsand how to evaluate them; (vii) are generous; (viii) advocate against injustice; (ix) are resourceful. See https:
//www.scout.org/why-to-hire-someone-who-has-been-a-scout, last accessed on May 23, 2017.19See for instance “Le scoutisme, un tremplin vers la vie professionnelle” (“Scouting, a springboard for one’s career”)
published in 2011 by La Croix, a prominent Catholic daily or “Ces salaries qui font progresser l’entreprise” (“Theseemployees that help the firm make progress”) published in 2015 by L’Express, a weekly news magazine with a centre-right political stance.
11

of the applicant increases (see Arcidiacono, Bayer and Hizmo (2010) or Lang and Manove (2011)).
Put di↵erently, the disappearance of anti-Muslim hiring discrimination when fictitious applicants are
outstanding would be consistent with such discrimination being statistical.
3.2.5 Summary
Overall, this correspondence study involves 30 types of applications that fall into three categories.
The first category, composed of Christians and Muslims, includes 16 types of applications, i.e. (2
religious cultures)⇥(2 religiosity levels)⇥(2 sexes)⇥(2 quality levels). The second and third categories
are devised for robustness check purposes. The second category (6 types of applications) notably aims
to test whether the religiosity penalty for Muslims and religiosity premium for Christians hold with
an alternative measure of religiosity (see Section 5.2). The third category (8 types of applications)
allows me to probe whether Muslims are discriminated against due to their Muslim culture or simply
due to their religious minority status (see Section 5.4).
These applications are spread out across the 96 departements in mainland France.20 Put dif-
ferently, the postal addresses that appear on the CVs and letters of application di↵er from one
departement to another. More precisely, the applicants reside in the chic downtown quarter of what-
ever city serves as the administrative capital (prefecture) of the departement in which the job they are
applying for was posted.21 These addresses were selected via Google Street View to ensure that (i)
the street and the number exist; (ii) they coincide with a residential building (not with a vacant lot
or an o�cial building). However, given that recruiters do not contact job applicants by mail anymore
but rely, instead, on the phone and/or on emails, none of the postal addresses was associated with a
real mailbox including the first name and last name of the fictitious candidates.
Obviously, recruiters located outside Paris might find it odd to receive applications from persons
who, albeit now domiciled locally, completed their secondary schooling, earned their post-secondary
technical degree or certificate, and began their career in Paris. Therefore, for all the applicants
domiciled outside Paris, a recent change of address is signalled by the note “new address from 1
September 2013” to their street address, 1 September 2013 being just before the correspondence
study was launched. The templates for the CV and letter of application of accountants of good
quality are presented in the Appendix (the templates for the CV and letter of application of other
20At the time of the correspondence study, mainland France was divided into 22 regions that were themselvessubdivided into 96 departements.
21Assigning the fictitious candidates to desirable places of residence should contribute to boost their callback rates.Based on a correspondence study conducted in the Paris region, Bunel, L’Horty and Petit (2016) show that a poshpostal address triples one’s chances of being invited to a job interview.
12
types of applicants are available upon request).
3.3 Responding to job ads
My correspondence study unfolded over a period of one year. The first applications were sent out
on Monday 23 September 2013, and the last ones on Friday 19 September 2014. The tally of the
responses of recruiters was completed on Monday 1 December 2014.22 For the sake of external
validity, the experimental setup consists in responding to all o↵ers in accountancy that were posted
on the website of Pole Emploi, the national employment agency.23 As such, it focuses on a set of
recruiters that are likely more open to diversity than recruiters who rely on social networks to fill
a vacancy.24 The recruitment channel used in this correspondence study therefore presumably runs
against measuring anti-Muslim discrimination.
Two special precautions were taken. First, only job ads that allowed the application to be sent
directly to the establishment posting a vacancy were treated. The experimental setup thus excludes
job o↵ers posted by such intermediaries as temporary employment agencies, recruitment consulting
firms, or counselors at Pole Emploi. The recruiting behaviors of such employment intermediaries do
not necessarily reflect that of the establishments looking to hire, while it is the latter entities that
have the last word about whom they choose to recruit. Second, in order to keep recruiters from
detecting the presence of a correspondence study, the experimental setup also bars the experimenter
from responding to more than one job o↵er posted by the same firm, even if these o↵ers concern
branches in di↵erent localities.
For each job ad in each French departement, one of the 30 types of applications is selected at
random and sent to the recruiter by email. More precisely, an email account was created for each of
the eight25 first names used in the correspondence study, with each applicant having an email address
of this kind: [firstname][email protected]. The cover letter reads as follows:26
Sir or Madam,
22The last recruiters to whom applications were sent thus had six weeks to respond. This timeframe far exceeds theaverage response time (17 days) measured for the sample of employers during the whole period of the correspondencestudy.
23By contrast, Adida, Laitin and Valfort (2010) focus on France’s main cities and Pierne (2013) on the Paris region.24As shown by Currarini, Jackson and Pin (2009) or Hitsch, Hortacsdu and Ariely (2010), these networks are
characterized by “homophily”, or the concept that individuals who are similar tend to come together (McPherson,SmithLovin and Cook (2001)).
25Two first names for each religious culture (Christianity, Islam and Judaism) and two first names that can be borneindi↵erently by Christians, Muslims and Jews (see Section 5.2).
26The subject line of the email is “Application (job o↵er number [XXX]).”
13

Please find enclosed my CV and my letter of application in response to o↵er number [XXX] which
appeared today at the website of Pole Emploi. I trust you will find everything in order.
[First name] Haddad
List of enclosures: Curriculum Vitae.pdf and Letter of application.pdf
The random selection of applications ensures that any di↵erence in the callback rates between
two types of application cannot be attributed to external factors (characteristics of the job, of the
firm, of the region, etc.) but, rather, to the di↵erent contents of these applications. Overall, each
type of application was sent to roughly 200 job ads, leading to the treatment of 6,231 job postings. In
particular, each “religious culture by religiosity by gender” profile was sent to 400 job ads, a number
chosen to ensure statistical significance at conventional confidence levels for the e↵ect sizes found by
Adida, Laitin and Valfort (2010) and Pierne (2013).
3.4 Measuring recruiters’ responses
Recruiters do not rely on emails alone to contact job applicants. They can also call them on the
phone. Therefore, as for the email addresses, a cellphone number was created for each of the eight
first names used in the correspondence study. The greeting for each voicemail inbox consists of the
applicant stating his or her first and last names. The same male voice recorded the greetings for the
voicemail of the male applicants, and the same female voice recorded the greetings for the voicemail
of the female applicants. These voices betray no foreign accent.
The email and voicemail inboxes of all the applicants were checked daily. Out of respect for the
recruiters who did issue an invitation to any applicant, and in order to limit the ethical concerns
inherent to a correspondence study, the following email was sent on the day after they contacted the
applicant:
Sir or Madam,
I am very grateful for the interest you have taken in my application. Unfortunately, I am unable
to follow it up, as I have just accepted an o↵er of employment on an open-ended contract. Please
accept, Sir or Madam, my best regards.
[First name] Haddad
14

3.5 A follow-up survey to test for employers’ perception of the “religios-
ity” treatment
The “religiosity” treatment relies on a signal, the Scouting association in which the applicant is
engaged as a volunteer leader, that is less commonly seen in a job application than the signals used
by the “religious culture”, “gender” or “quality” treatments (e.g. the applicant’s first name, name
of the school where the applicant graduated ...etc.). Although volunteering in a Scouting association
is associated by many stakeholders with socio-emotional skills highly valued in the workplace, it is
critical to ensure that a set of employers similar to those who received the fictitious job applications
do view the mention of Scouting experience in a CV as relevant. Otherwise, there is a risk that
the recruiters did not give serious consideration to the fictitious candidates, which would threaten
both the internal and external validity of the correspondence study’s results. It is also important to
test whether the “religiosity” signal is correctly interpreted by employers, i.e. that they do assign a
low religiosity to applicants involved in a non-religious Scouting association, and a high religiosity to
applicants involved in a religious Scouting association.
To this end, an online survey powered by Google Forms was sent by email to 2,200 recruiters in Fall
2017 (see the Appendix for a translation of the survey’s content). To guarantee a strong comparability
between these recruiters and the employers to which the fictitious applications were sent, individuals
in both groups were identified in a similar way, i.e. through all job ads in accountancy posted on the
website of Pole Emploi in a given period.27 The content of the email mentioned that the survey was
part of a research project on the impact of extra-curricular activities in Scouting on job prospects.
A total of 206 recruiters responded to the survey, amounting to a response rate of 9.3%. As
expected, their characteristics are very similar to those of the employers to which the fictitious
applicants were sent. They primarily work in: (i) private establishments (92.2% among survey
respondents vs 92.8% among employers exposed to the correspondence study); (ii) the tertiary sector
(88.2% vs 91.6%); (iii) establishments that count less than 250 employees (82.8% vs 81.6%).
The survey results confirm that a large majority of recruiters view the mention of Scouting
experience in a CV as relevant. To the question “An article published in 2016 in Forbes magazine
advises candidates who have been or are still involved in a Scouting association to mention it in their
CV. What do you think of this advice?”, 67.9% respond that they consider this advice as “very good”
27This period unfolded between July and October 2017 for the recruiters who received the follow-up survey. Asmentioned in Section 3.3, the period for the employers who received the fictitious applications was twelve months,from September 2013 to September 2014.
15
or “pretty good”, as opposed to 5.3% who consider this advice as “very bad” or “pretty bad”. (The
remaining 26.8% “do not know”.) The survey results also reveal that recruiters correctly interpret
the “religiosity signal”. More precisely, they are asked a set of four questions whose general structure
is as follows: “Imagine a candidate who mentions in his/her CV that he/she trains young people
in [name of the Scouting association as it appears in the fictitious candidates’ CV]. What do you
think is the importance of religion for this candidate?”. A large majority of recruiters respond that
the importance of religion for the candidate is “very high” or “rather high” when the candidate is
involved in “the Catholic Scouting association Scouts and Guides of France”28 or in “the Muslim
Scouting association Muslim Scouts of France”29. By contrast, a majority of recruiters respond that
the importance of religion for the candidate is “very little” or “rather little” when the candidate is
involved in the “laıc Scouting association Girl and Boy Scouts of France”30. .
4 Main results of the correspondence study
The final sample for Christian and Muslim fictitious applicants includes 3,331 applications submitted
to 3,331 job ads. Table 1 reports descriptive statistics for the dependent and treatment variables,
as well as for job, firm and region characteristics in this sample. Roughly 15% of applications
received a positive callback from the recruiter, meaning that the recruiter contacted the fictitious
job candidates by phone and/or email in order to invite them to a job interview or collect additional
information about their application.31 Due to the randomization of candidates’ religious culture as
well as religiosity, gender and quality, the sample is divided equally across (i) candidates of Christian
and Muslim culture; (ii) non-religious and religious candidates; (iii) female and male candidates; (iv)
good and outstanding candidates.
Applications were as likely to be sent to ads for accounting clerk jobs as to ads for accountant jobs.
Open-ended contracts (the so-called Contrat a duree indeterminee (CDI) in French) are slightly more
common than fixed-term contracts (the so-called Contrat a duree determinee (CDD) in French).
Firms are chiefly from the private sector. The public sector primarily recruits instead through
28In this case, the share of recruiters who respond “very high” or “rather high” amounts to 74.3%. As a comparison,14% respond “very little” or “rather little”. The remaining 11.7% “do not know”.
29In this case, the share of recruiters who respond “very high” or “rather high” amounts to 77%. As a comparison,9.3% respond “very little” or “rather little”. The remaining 13.7% “do not know”.
30In this case, the share of recruiters who respond “very little” or “rather little” amounts to 61.7%. As a comparison,17.7% respond “very high” or “rather high”. The remaining 20.6% “do not know”.
31To the extent that recruiters typically express their interest in the candidates’ application when they contact themfor additional information, this type of answer is viewed as positive. It is worth stressing however that the results arerobust with alternative measures of the callback rate (see Section 5.1).
16

public entry examination in France. Firms also mainly stem from the tertiary sector, a consequence
of the overrepresentation of this sector in the French economy.32 Regarding firms’ size, 81.6% of
firms have less than 250 employees. This is more than the 50% share that this category makes up
in the French workforce (INSEE (2016)). The overrepresentation of small to medium size firms may
reflect that large firms often advertise their job openings directly through the Careers section of their
website. This oversampling may also flow from the methodological imperative to respond to no more
than one job ad per firm, so as to avoid detection. It is important to note that this restriction o↵ers
the advantage of providing a sample that better reflects the distribution of firms by size, since firms
with less than 250 employees represent roughly 99% of firms in France (INSEE (2016)).
Region characteristics encompass four items that may influence the di↵erence in callback rates
between Christian and Muslim applicants (see Section 4.3.3): (i) the average regional unemployment
rate in 2013 (i.e. at the start of the correspondence study); (ii) the share of votes for the Front
National (the right-wing populist and nationalist political party in France) during the first round
of the 2012 French presidential election; (iii) the average share of respondents who self-identify as
Muslims in the few surveys that include a “religious denomination” question: the 1990, 1999 and
2008 rounds of the European Values Survey and the 2006 round of the World Values Survey; (iv) the
share of immigrants from North Africa and Turkey, as reported by INSEE for year 201333.
Table 2 provides randomization tests. Due to the randomized design of the field experiment, Table
2 by and large confirms that the covariates reported in Table 1 are balanced across the “religious
culture”, “religiosity”, “gender” and “quality” treatments.
4.1 Estimating the impact of being of Muslim vs Christian culture
Figure 1 reports the probability of a positive callback by religious culture. It reveals strong discrim-
ination against Muslim applicants: their callback rate (11.7%) is 6.7 percentage points lower than
that of Christians (18.4%), a di↵erence that is statistically significant at the 99% confidence level.
Put di↵erently, applicants of Christian culture are 60% more likely to be called back by the recruiter.
Equation (1) provides the regression counterpart of this di↵erence-of-means analysis:
yi,a = �0 + �11M(i) + �21
R(i) + �31m(i) + �41
o(i) +Xa�0a + ✏i,a (1)
32As of January 2014, the tertiary sector represents 80% of French firms and employs more than three quarters ofFrench workers (INSEE (2016)).
33See https://www.insee.fr/fr/statistiques/2012727.
17
where yi,a is a dichotomous variable that equals 1 if candidate of type i who applies to job ad a
receives a positive callback from the recruiter. Given the randomized design of the field experiment,
coe�cients �1 to �4 provide unbiased estimates of the mean impact of (i) being of Muslim vs Christian
culture (the dummy 1M(i)); (ii) being religious vs non-religious (the dummy 1R(i)); (iii) being male
vs female (the dummy 1m(i)); (iv) being outstanding vs good (the dummy 1o(i)). Vector Xa denotes
a set of features of job ad a that encompasses job and firm characteristics as well as month and region
fixed e↵ects. Finally, ✏i,a is an error term.
Columns 1 to 6 of Table 3 report the marginal probit estimates of Equation (1) when the controls
are entered stepwise and the standard errors are clustered at the departement level. The results
confirm the findings from Figure 1: the callback rate of applicants of Muslim culture is between 6.7
and 6.9 percentage points lower than that of their Christian counterparts. These estimates remain
unchanged with an OLS approach (Column 7 of Table 3).
Table 3 provides interesting additional findings. Being religious has no impact on the probability
of callback. A preview of the results helps explain this pattern. Only Muslims are penalized for
appearing as religious. By contrast, Christians gain ground by stressing their involvement in a
Christian Scouting association (see Section 4.2.1 for further details).
Male applicants are discriminated against relative to female applicants: their callback rate is
9.4 percentage points lower (Column 7). This result is in line with the literature on gender-based
discrimination: it reveals that discrimination against women increases with the level of responsibility
attached to the occupational category they apply for, while the reverse occurs for men. More precisely,
women are discriminated against in access to high-responsibility jobs (Baert, de Pauw and Deschacht
(2016)), especially when their age entails a risk of maternity (Petit (2007)). But they are favored
in access to lower-responsibility jobs (Riach and Rich (2006) and Booth and Leigh (2010)). Yet,
although accountant jobs involve more autonomy and complexity than accounting clerk jobs, they
still belong to the category of lower-responsibility jobs.34
As expected, being outstanding increases the callback rate by nearly 5 percentage points (Column
7). As for vector Xa, two of its components turn out to be statistically significant: candidates are less
likely to be called back when they apply (i) for an open-ended contract, (ii) in the private sector. This
34Consistent with discrimination against women (resp. men) increasing (resp. decreasing) with the job’s level ofresponsibility, fictitious male applicants are less discriminated against when they apply for accountant rather thanaccounting clerk jobs, although this di↵erence is not statistically significant. (Results available upon request.) Addi-tionally, the 2013 and 2014 rounds of the French labor Force Survey confirm a negative correlation between the job’slevel of responsibility and the proportion of women among accountancy jobs: this proportion is 81% for accountingclerk jobs, 67% for accountant jobs, and 46% for accounting manager jobs.
18
result could reflect lower ethnic-based discrimination in access to a job interview among fixed-term
contracts as well as in the public sector (see Cahuc et al. (2018) for a confirmation), in a context
where all fictitious candidates originate from the Middle East.
It is important to stress that the magnitude of anti-Muslim discrimination identified in Figure 1
and Table 3 could depend on the region of origin used in the experimental setup, i.e. Middle East and
North Africa. Although the results would still be meaningful in this case since the bulk of Muslims
in France stem from this region, it is worthwhile investigating, for the sake of their external validity,
whether they hold if the fictitious applicants originate from other regions. Among the previous
correspondence studies that have sought to isolate a Muslim e↵ect, only Adida, Laitin and Valfort
(2010) focus on fictitious applicants that are comparable to a subset of the fictitious applicants used
in this paper, in terms of religiosity, gender, quality and jobs they apply for. More precisely, Adida,
Laitin and Valfort (2010) rely on religious Christian and Muslim female candidates of good quality
who apply as accounting clerks or accountants.35 Adida, Laitin and Valfort (2010) find that a woman
is 2.5 times less likely to be invited to a hiring interview when she is perceived as Muslim rather than
Catholic, which is very close to the ratio of 2.2 revealed by Figure 5a for religious female applicants
of good quality. Put di↵erently, the hypothesis that the magnitude of anti-Muslim discrimination is
robust to applicants of sub-Saharan African origin cannot be rejected. Yet, further research is needed
to test whether this magnitude is also robust to an Asian or European origin (Bosnia-Herzegovina
would be the ideal country of origin in this case).
4.2 Heterogeneous e↵ects by religiosity, gender and quality
Tables 4a to 4d analyze whether the “Muslim vs Christian culture” e↵ect varies by religiosity, gender
and quality. These tables rely on the following linear probability model:36
yi,a = �0 + �11M(i) + �21
M(i)⇥ 1k(i) + �31R(i) + �41
m(i) + �51o(i) +Xa�
0a + ✏i,a (2)
where k = R in Tables 4a and 4b (heterogeneous e↵ects by religiosity), k = m in Table 4c (hetero-
geneous e↵ects by gender), and k = o in Table 4d (heterogeneous e↵ects by quality).
35These candidates are French citizens of Senegalese background. Their religious culture is signalled by their firstname: Marie (Diouf) for the Christians and Khadija (Diouf) for the Muslims. Their religiosity is conveyed by theirinvolvement in a religious Scouting association.
36Although the dependent variable is binary, OLS are used because of concerns about interaction e↵ects in probitregressions (Ai and Norton (2003)). However, it is worthwhile stressing that probit estimates yield similar findings toOLS estimates, as it is apparent in Table 3. (Further results available upon request.)
19
4.2.1 Heterogeneous e↵ects by religiosity
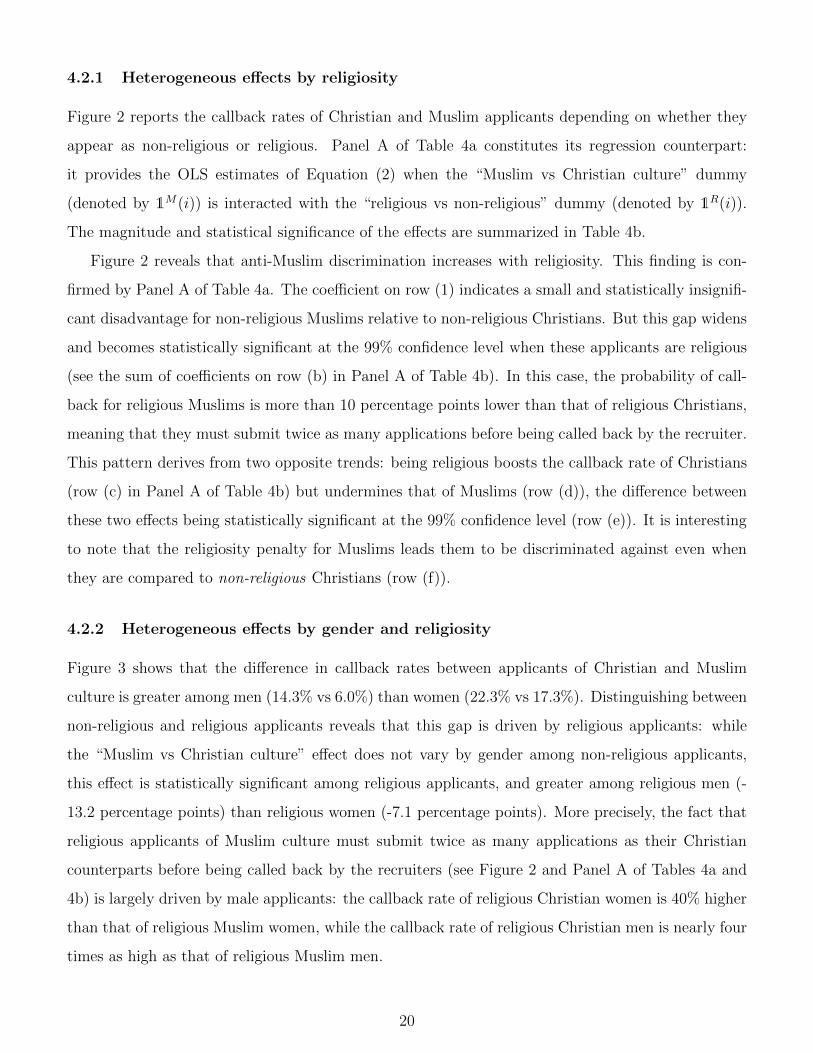
Figure 2 reports the callback rates of Christian and Muslim applicants depending on whether they
appear as non-religious or religious. Panel A of Table 4a constitutes its regression counterpart:
it provides the OLS estimates of Equation (2) when the “Muslim vs Christian culture” dummy
(denoted by 1M(i)) is interacted with the “religious vs non-religious” dummy (denoted by 1R(i)).
The magnitude and statistical significance of the e↵ects are summarized in Table 4b.
Figure 2 reveals that anti-Muslim discrimination increases with religiosity. This finding is con-
firmed by Panel A of Table 4a. The coe�cient on row (1) indicates a small and statistically insignifi-
cant disadvantage for non-religious Muslims relative to non-religious Christians. But this gap widens
and becomes statistically significant at the 99% confidence level when these applicants are religious
(see the sum of coe�cients on row (b) in Panel A of Table 4b). In this case, the probability of call-
back for religious Muslims is more than 10 percentage points lower than that of religious Christians,
meaning that they must submit twice as many applications before being called back by the recruiter.
This pattern derives from two opposite trends: being religious boosts the callback rate of Christians
(row (c) in Panel A of Table 4b) but undermines that of Muslims (row (d)), the di↵erence between
these two e↵ects being statistically significant at the 99% confidence level (row (e)). It is interesting
to note that the religiosity penalty for Muslims leads them to be discriminated against even when
they are compared to non-religious Christians (row (f)).
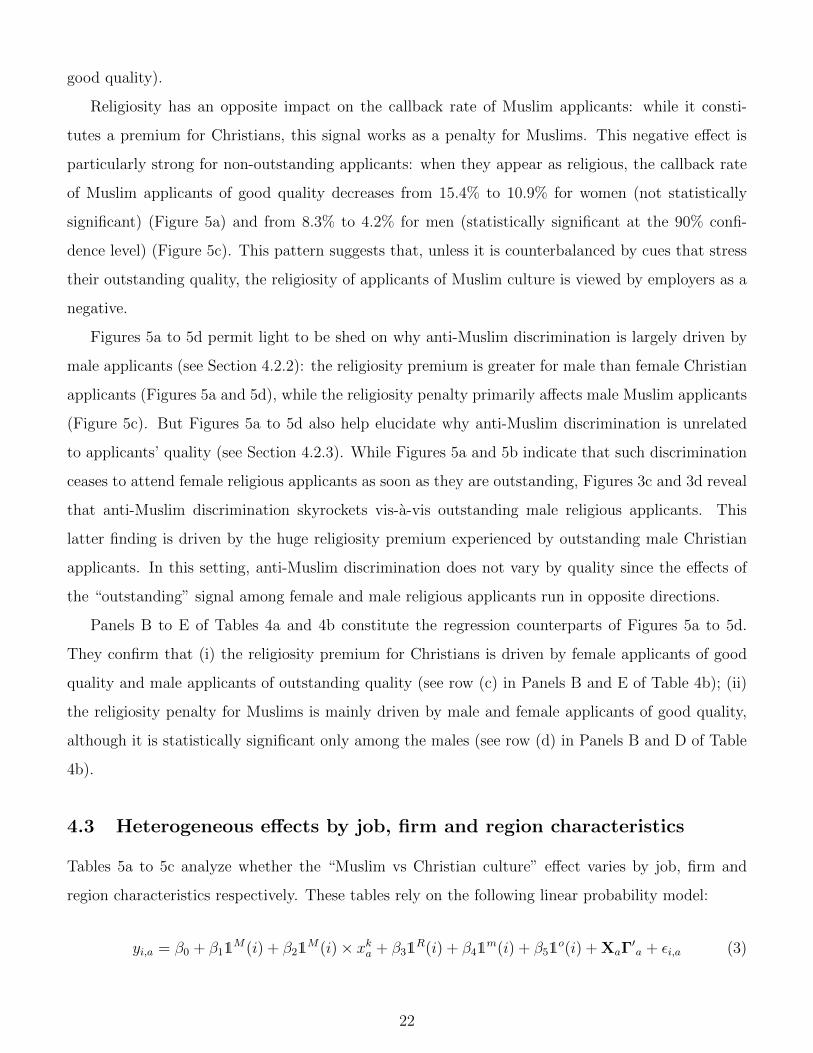
4.2.2 Heterogeneous e↵ects by gender and religiosity
Figure 3 shows that the di↵erence in callback rates between applicants of Christian and Muslim
culture is greater among men (14.3% vs 6.0%) than women (22.3% vs 17.3%). Distinguishing between
non-religious and religious applicants reveals that this gap is driven by religious applicants: while
the “Muslim vs Christian culture” e↵ect does not vary by gender among non-religious applicants,
this e↵ect is statistically significant among religious applicants, and greater among religious men (-
13.2 percentage points) than religious women (-7.1 percentage points). More precisely, the fact that
religious applicants of Muslim culture must submit twice as many applications as their Christian
counterparts before being called back by the recruiters (see Figure 2 and Panel A of Tables 4a and
4b) is largely driven by male applicants: the callback rate of religious Christian women is 40% higher
than that of religious Muslim women, while the callback rate of religious Christian men is nearly four
times as high as that of religious Muslim men.
20

Panels A to C of Table 4c confirm these findings. The interaction term in Equation (2) between
the “Muslim vs Christian culture” dummy (denoted by 1M(i)) and the “male vs female” dummy
(denoted by 1m(i)) is statistically significant (and, in this case, negative) only when one focuses on
religious applicants.
4.2.3 Heterogeneous e↵ects by quality and religiosity
Anti-Muslim discrimination is expected to decrease with applicants’ quality. Yet Figure 4 indicates
that Muslim applicants of outstanding quality are not less likely to be discriminated against than
Muslim applicants of good quality, whether we focus on the whole sample of applicants or on reli-
gious applicants only (recalling that anti-Muslim discrimination does not emerge among non-religious
applicants). Panels A to C of Table 4d confirm this finding: the interaction term in Equation (2)
between the “Muslim vs Christian culture” dummy (denoted by 1M(i)) and the “outstanding vs
good” dummy (denoted by 1o(i)) is never statistically significant.
4.2.4 Heterogeneous e↵ects by religiosity, gender and quality
Figures 5a to 5d report the callback rates of Christian and Muslim applicants depending on whether
they appear as non-religious or religious, among the following groups defined by gender and quality:
female applicants of good quality (Figure 5a), female applicants of outstanding quality (Figure 5b),
male applicants of good quality (Figure 5c) and male applicants of outstanding quality (Figure 5d).
These figures reveal that the “religiosity premium” for Christians is driven by female applicants
of good quality and male applicants of outstanding quality. Religiosity brings the callback rate of
Christian women of good quality from 15.2% to 23.5% (an increase that is statistically significant
at the 95% confidence level), within reach of the callback rate of non-religious Christian women of
outstanding quality (27.6%) (Figure 5a). However, religiosity does not make a di↵erence for Christian
women of outstanding quality (Figure 5b). In other words, being religious reassures the recruiters only
when the application of Christian women is not outstanding. By contrast, religiosity fails to influence
the callback rate of non-religious Christian men of good quality (Figure 5c), which is consistent with
the male penalty emphasized in Section 4.1: their fit with employers’ expectations when the latter seek
to fill a lower-responsibility position may be too low for religiosity to be influential. Yet, religiosity
imparts a powerful boost to the callback rate of Christian men of outstanding quality (Figure 5d):
this rate rises from a low of 9.4% to a high of 26.4% (an e↵ect that is statistically significant at the
99% confidence level and greater than the religiosity premium experienced by Christian women of
21
good quality).
Religiosity has an opposite impact on the callback rate of Muslim applicants: while it consti-
tutes a premium for Christians, this signal works as a penalty for Muslims. This negative e↵ect is
particularly strong for non-outstanding applicants: when they appear as religious, the callback rate
of Muslim applicants of good quality decreases from 15.4% to 10.9% for women (not statistically
significant) (Figure 5a) and from 8.3% to 4.2% for men (statistically significant at the 90% confi-
dence level) (Figure 5c). This pattern suggests that, unless it is counterbalanced by cues that stress
their outstanding quality, the religiosity of applicants of Muslim culture is viewed by employers as a
negative.
Figures 5a to 5d permit light to be shed on why anti-Muslim discrimination is largely driven by
male applicants (see Section 4.2.2): the religiosity premium is greater for male than female Christian
applicants (Figures 5a and 5d), while the religiosity penalty primarily a↵ects male Muslim applicants
(Figure 5c). But Figures 5a to 5d also help elucidate why anti-Muslim discrimination is unrelated
to applicants’ quality (see Section 4.2.3). While Figures 5a and 5b indicate that such discrimination
ceases to attend female religious applicants as soon as they are outstanding, Figures 3c and 3d reveal
that anti-Muslim discrimination skyrockets vis-a-vis outstanding male religious applicants. This
latter finding is driven by the huge religiosity premium experienced by outstanding male Christian
applicants. In this setting, anti-Muslim discrimination does not vary by quality since the e↵ects of
the “outstanding” signal among female and male religious applicants run in opposite directions.
Panels B to E of Tables 4a and 4b constitute the regression counterparts of Figures 5a to 5d.
They confirm that (i) the religiosity premium for Christians is driven by female applicants of good
quality and male applicants of outstanding quality (see row (c) in Panels B and E of Table 4b); (ii)
the religiosity penalty for Muslims is mainly driven by male and female applicants of good quality,
although it is statistically significant only among the males (see row (d) in Panels B and D of Table
4b).
4.3 Heterogeneous e↵ects by job, firm and region characteristics
Tables 5a to 5c analyze whether the “Muslim vs Christian culture” e↵ect varies by job, firm and
region characteristics respectively. These tables rely on the following linear probability model:
yi,a = �0 + �11M(i) + �21
M(i)⇥ xka + �31
R(i) + �41m(i) + �51
o(i) +Xa�0a + ✏i,a (3)
22
where k = j in Table 5a (heterogeneous e↵ects by job characteristics), k = f in Table 5b (het-
erogeneous e↵ects by firm characteristics), and k = r in Table 5c (heterogeneous e↵ects by region
characteristics).
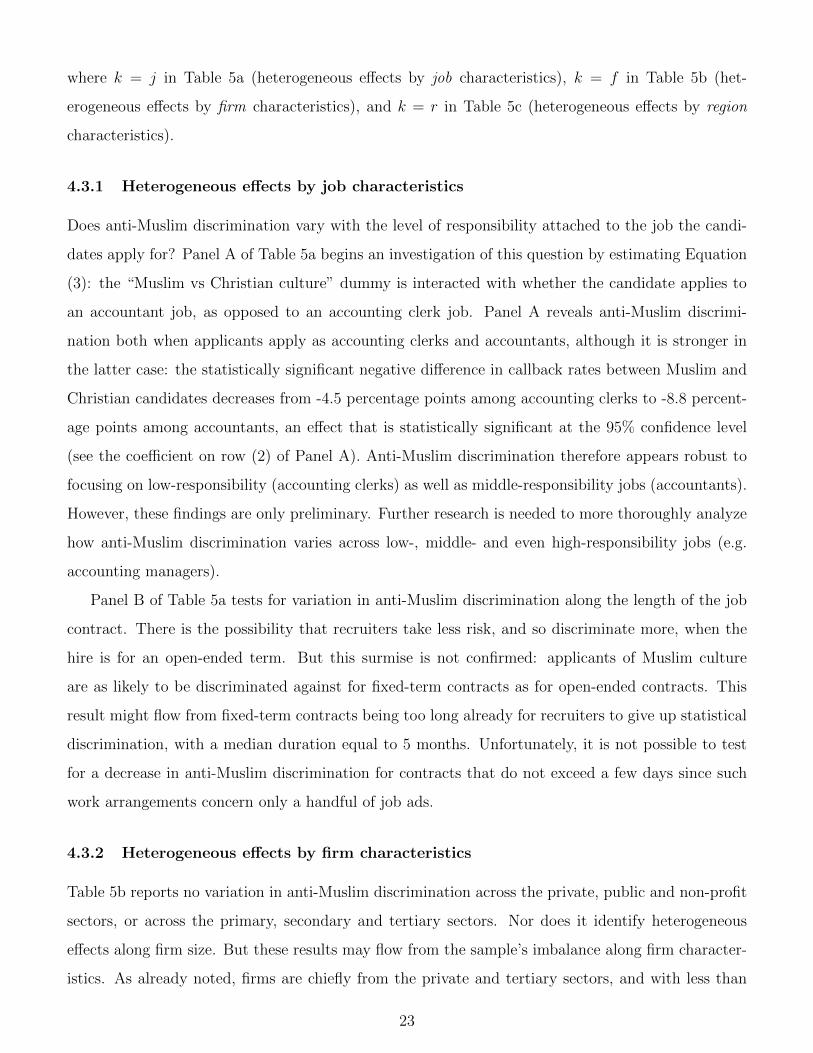
4.3.1 Heterogeneous e↵ects by job characteristics
Does anti-Muslim discrimination vary with the level of responsibility attached to the job the candi-
dates apply for? Panel A of Table 5a begins an investigation of this question by estimating Equation
(3): the “Muslim vs Christian culture” dummy is interacted with whether the candidate applies to
an accountant job, as opposed to an accounting clerk job. Panel A reveals anti-Muslim discrimi-
nation both when applicants apply as accounting clerks and accountants, although it is stronger in
the latter case: the statistically significant negative di↵erence in callback rates between Muslim and
Christian candidates decreases from -4.5 percentage points among accounting clerks to -8.8 percent-
age points among accountants, an e↵ect that is statistically significant at the 95% confidence level
(see the coe�cient on row (2) of Panel A). Anti-Muslim discrimination therefore appears robust to
focusing on low-responsibility (accounting clerks) as well as middle-responsibility jobs (accountants).
However, these findings are only preliminary. Further research is needed to more thoroughly analyze
how anti-Muslim discrimination varies across low-, middle- and even high-responsibility jobs (e.g.
accounting managers).
Panel B of Table 5a tests for variation in anti-Muslim discrimination along the length of the job
contract. There is the possibility that recruiters take less risk, and so discriminate more, when the
hire is for an open-ended term. But this surmise is not confirmed: applicants of Muslim culture
are as likely to be discriminated against for fixed-term contracts as for open-ended contracts. This
result might flow from fixed-term contracts being too long already for recruiters to give up statistical
discrimination, with a median duration equal to 5 months. Unfortunately, it is not possible to test
for a decrease in anti-Muslim discrimination for contracts that do not exceed a few days since such
work arrangements concern only a handful of job ads.
4.3.2 Heterogeneous e↵ects by firm characteristics
Table 5b reports no variation in anti-Muslim discrimination across the private, public and non-profit
sectors, or across the primary, secondary and tertiary sectors. Nor does it identify heterogeneous
e↵ects along firm size. But these results may flow from the sample’s imbalance along firm character-
istics. As already noted, firms are chiefly from the private and tertiary sectors, and with less than
23

250 employees (see Table 1).
4.3.3 Heterogeneous e↵ects by region characteristics
Table 5c tests for variation in the “Muslim vs Christian culture” e↵ect by region characteristics, i.e.
unemployment rate, support for the Front National and the share of Muslims.
Unemployment rate Hiring discrimination should be less costly to recruiters when unemployment
rises. As explained by Biddle and Hamermesch (2013), an increasing ratio of job seekers to vacancies
should give employers more scope to indulge discriminatory behaviors. One penalty of discriminating
does indeed consist in the opportunity cost of the longer expected wait until an acceptable worker
arrives, and this cost decreases with unemployment, in particular due to the higher arrival rate of
workers at vacancies. Baert et al. (2015) provide empirical support for this mechanism. Relying on a
correspondence study, they find that ethnic-based hiring discrimination decreases with labor market
tightness.
In a similar vein, Panel A of Table 5c investigates whether applicants of Muslim culture are
more discriminated against in regions where unemployment is higher. It provides results that are
consistent with the literature. More precisely, Muslims are not discriminated against in regions
with no unemployment (see the coe�cient on row (1)). But they are increasingly penalized as the
unemployment rate rises (see the coe�cient on row (2)) to the point of su↵ering from a statistically
significant penalty in regions that show the maximum level (14.6%) of unemployment rate (see the
Wald test at the bottom of Panel A).
Support for the Front National Does anti-Muslim discrimination vary with the vote share of
the Front National during the first round of the 2012 French presidential election? Since being
elected president of her party on 16 January 2011, Marine Le Pen has adopted an unambiguously
anti-Muslim discourse. In her speech upon becoming leader, she “let it be understood that Europe
and France were at risk of turning into ‘caliphates’, in other words territories subject to the spiritual
and temporal power of Islam... The Front National now perceives immigration primarily through the
filter of religious radicalization.” (Perrineau (2014), p 98). We therefore expect a stronger Muslim
penalty in regions that show a higher political support for the Front National. Panel B of Table 5c
confirms this intuition. Muslims are not discriminated against in regions with no political support
for the Front National (see the coe�cient on row (1)). But they are increasingly penalized as this
24

support rises (see the coe�cient on row (2)) to the point of su↵ering from a statistically significant
disadvantage in regions where this support reaches its maximum value (25.0%) (see the Wald test at
the bottom of Panel B).
Share of Muslims Anti-Muslim discrimination is supposed to vary with the local share of Muslims.
This relationship may be negative. Intergroup contact theory indeed predicts that an increase in the
relative number of Muslims provides contact opportunities with them, which in turn attenuates
anti-Muslim taste-based discrimination (Allport (1954)). Moreover, individuals who harbour anti-
Muslim sentiments are unlikely to choose to live in areas with a large proportion of Muslims (see
Alesina, Baqir and Easterly (1999) and Bayer and McMillan (2012) for a discussion of this Tiebout-
like sorting). But the correlation between anti-Muslim discrimination and the local share of Muslims
may also be positive. Group threat theory predicts that an increase in the relative number of Muslims
generates anti-Muslim taste-based discrimination because of the perception by the dominant group
of a symbolic threat to their cultural integrity (Blalock (1967)). Additionally, an increase in the
relative number of Muslims may undermine their incentives to adhere to secular laws (and, hence,
feed statistical anti-Muslim discrimination), either as a response to anti-Muslim hostility if group
threat theory is at work (Gould and Klor (2016)) and/or because their size allows for their isolation
from society.
Only a few studies have analyzed the relationship between attitudes and behaviors toward Muslims
and the local share of Muslims. Survey-based evidence points to an increase in anti-Muslim sentiment
in geographic areas where the proportion of Muslims is larger. Bowyer (2009) shows that residential
proximity in the UK to Pakistanis and Bangladeshis, who are primarily Muslim, is associated with
more negative attitudes toward them. Similarly, relying on survey data, Savelkoul et al. (2011)
find that the local share of Muslims is related to anti-Muslim attitudes in Dutch citizens with no
recent immigrant background. Adida, Laitin and Valfort (2016b) confirm these preliminary findings
by relying on behavioral games. These games involve French persons with no recent immigrant
background and Christians and Muslims immigrants of the same country of origin (Senegal). They
show that French participants become less altruistic in their interactions with Muslims when the
proportion of Muslims in the game session increases. By contrast, an increase in the proportion of
Christians does not a↵ect the manner in which they are dealt with by the same French persons.
Panel C of Table 5c confirms these “Hortefeux e↵ects”.37 Muslims and Christians are treated on37Adida, Laitin and Valfort (2016b) label their results in reference to the words uttered on 5 September 2009 by the
French Minister of the Interior Brice Hortefeux at the summer gathering of the UMP (the main center-right political
25

a level playing field in regions with no Muslims (see the coe�cient on row (1)). But their callback
rate endures a statistically significant decline following an increase in the proportion of Muslims at
the regional level (see the coe�cient on row (2)). As is apparent in Panel D of Table 5c, these results
are robust to an alternative measure of the local share of Muslims: the proportion of immigrants
from the main Muslim-majority countries of origin (Algeria, Morocco, Tunisia and Turkey).
4.4 Evidence of taste-based anti-Muslim discrimination?
Provided that the labor market is competitive, Becker’s model (1957) predicts that employers who
engage in taste-based discrimination should be driven out of the market since they forfeit profits. The
main results of this paper point to anti-Muslim hiring discrimination indeed not being taste-based,
but statistical: recruiters do not discriminate against non-religious Muslims but they discriminate
against religious Muslims unless they are outstanding. This pattern is consistent with religious
Muslims being linked to a risk of problematic behavior in the workplace that leads to discrimination
when the quality of their CV is not su�cient to counterbalance this risk. This finding is consistent not
only with Becker’s prediction, but also with previous empirical studies that have sought to distinguish
between statistical and taste-based discrimination in competitive markets, and typically failed to find
evidence for the latter (see List (2004), Zussman (2013), Doleac and Stein (2013) and Bryson and
Chevallier (2015)).
Yet, this does not mean that anti-Muslim taste-based discrimination is absent outside the hiring
process. In a laboratory setting that seeks to mimic everyday interactions between strangers, Adida,
Laitin and Valfort (2014) show that French persons with no recent immigrant background exhibit
an unprovoked animus against Muslim immigrants that does not emerge when they interact with
Christian immigrants, holding these immigrants’ country of origin constant.
To test for taste-based discrimination with data from a correspondence study, it would seem
promising to focus on recruiters’ behavior toward applicants once they have made the choice of not
interviewing them. Their beliefs on applicants’ productivity should not influence their behavior at
that stage. By contrast, recruiters may be more prone to indulge their anti-Muslim animus (if any)
since it is not detrimental for the firm’s performance anymore. In this setting, any unequal treatment
formation in France): “When there’s one, that’s OK; it’s when there’s a lot of them that there are problems.” Thecontext of these remarks was an encounter between Brice Hortefeux and Hamid, a young UMP activist of north Africanorigin. “He doesn’t match the prototype at all,” commented the Interior Minister about the young man, “who eatspork and drinks beer” according to other party members. Then Brice Hortefeux added: “You always need one. Whenthere’s one, that’s OK; it’s when there’s a lot of them that there are problems.”
26

between applicants of Christian and Muslim culture should reflect taste-based rather than statistical
discrimination.
Table 6 reports the OLS estimates of Equation (1) when the following alternative dependent
variables are used: the probability of being notified of the recruiter’s negative response and the tone
of the negative response. The tone of the negative response is measured by the sum of seven binary
variables: (i) the “personalization” variable: =1 if the email of refusal is personalized (for example
“Dear Mr/Mrs Haddad”), = 0 if not; (ii) the “thank you” variable: =1 if the recruiter thanks the
applicant for applying, = 0 if not; (iii) the “explanation” variable: =1 if the recruiter gives a reason
for the rejection (job already filled, inadequacy of the profile submitted, etc.), = 0 if not; (iv) the
“reassurance” variable: =1 if the recruiter assures the applicant that the refusal does not reflect
negatively on the quality of his or her profile, = 0 if not; (v) the “encouragement” variable: =1 if
the recruiter encourages the applicant to keep on hunting for a job, = 0 if not; (vi) the “retention”
variable: =1 if the recruiter states that he or she will keep the applicant’s CV on file in case there
is another opening, = 0 if not; (vii) the “politeness in closing” variable: =1 if the recruiter employs
polite expressions in closing, = 0 if not.
Table 6 reveals that anti-Muslim discrimination is likely taste-based outside the hiring process.
Applicants of Muslim culture are less likely to be notified of a negative response (statistically signif-
icant at nearly the 90% confidence level, with a p-value equal to 0.113). Moreover, the tone of the
negative response, when notified, is less a↵able to them (statistically significant at the 90% confidence
level). These results are not driven by a specific type of applicant nor by a specific component of the
sum used to measure the tone of the negative response. (Results available upon request.)
5 Robustness checks
This section implements four types of robustness checks. First, it tests the robustness of the main
results to alternative measures of the callback rate. It also explores whether the religiosity premium
for Christians and religiosity penalty for Muslims hold with an alternative measure of religiosity.
Additionally, it investigates whether anti-Muslim discrimination is robust to taking into account the
possibility that recruiters hold di↵erent beliefs not only on the mean but also on the variance of
Christians’ and Muslims’ unobserved productivity (Heckman and Siegelman (1993) and Neumark
(2012)). Finally, it investigates whether Muslims are discriminated against due to their Islamic
a�liation or simply due to their religious minority status.
27
5.1 Alternative measures of the callback rate
Thus far, the probability of receiving a positive callback from recruiters is defined as taking the
value 1 if the recruiters contact the fictitious job candidates by phone and/or email in order to invite
them to a job interview or collect more information about their application. It is equal to 0 if the
recruiters contact the candidates to turn down their application or if the recruiters do not contact
the candidates at all. As has already been stressed, recruiters typically express their interest in the
candidates’ applications when they contact them to learn more about the application. There would
seem to be no reason, therefore, to view this type of answer as negative.
Yet, Table 7a reports the OLS estimates of Equations (1) and (2) when this outcome is not
considered as (fully) positive anymore. More precisely, Table 7a focuses on two alternative measures
of the callback rate. The first alternative measure takes the value 1 if the recruiters contact the
fictitious job candidates by phone and/or email in order to invite them to a job interview, and 0
otherwise. The second alternative measure is categorical: it takes the value 1 if the recruiters contact
the candidates to turn down their application or if the recruiters do not contact the candidates
at all, the value 2 if the recruiters contact the candidates to collect more information about their
application, and the value 3 if the recruiters contact the candidates by phone and/or email in order
to invite them to a job interview.
Table 7a reveals that the main results are fully robust to these alternative measures of the callback
rate. The only exception is the coe�cient on row (3) in Panel B concerning the first alternative
measure of the callback rate. This coe�cient estimates the religiosity e↵ect for religious applicants of
Christian culture. While it is still positive, it loses statistical significance as compared to an approach
that relies on the original measure, or on the second alternative measure of the callback rate. Yet,
a decomposition by type of candidates similar to that performed in Panels B to E of Tables 4a and
4b reveals that all the results from these tables hold. (Results available upon request.) Notably,
the “religiosity premium” for Christian women of good quality and for Christian men of outstanding
quality remains unchanged.
5.2 An alternative measure of religiosity
Religiosity has an asymmetric impact on the callback rate of Muslim and Christian applicants: it
is detrimental to Muslims of good quality (a result that is statistically significant for men) but it
boosts the probability of a positive callback for Christian women of good quality and Christian men
28
of outstanding quality. This section tests the robustness of these findings with an alternative measure
of religiosity.
More precisely, it compares the callback rates of applicants of Christian and Muslim culture,
depending on whether they bear a typical Christian or Muslim first name, or a Christian first name
compatible with a Muslim culture (i.e. that can be borne by Muslims in France without compromis-
ing their Muslim identity).38 This first name is “Adam” for the men and “Myriam” for the women.
Although these first names do not conflict with a Muslim culture, they are likely perceived as sig-
nalling lower religiosity than typical Muslim first names. However, for the sake of this robustness
check, it is critical that they be perceived as signalling lower religiosity among Christian applicants
as well. Ensuring that their frequency in the French population is lower than the frequency of the
typical Christian first names used in the experiment is therefore important. Unfortunately, it is not
possible to meet this requirement for Christian female first names. According to the INSEE Name
Frequency Dataset, “Adam” is much less frequent than “Michel” in France. But “Myriam” is nearly
as common as “Nathalie”. The robustness check below therefore does not allow testing the robustness
of the religiosity premium for Christian women.
To avoid lengthening the period over which this correspondence study unfolds, applications en-
dowed with the first name “Adam” or “Myriam” were created for only one type of applications
picked at random, among the four possible types defined by religiosity and quality:39 religious appli-
cations of outstanding quality. To be sure, identifying the religiosity penalty with respect to Muslim
outstanding candidates constitutes a challenge since these candidates are not penalized in the main
findings. Yet, to the extent that the alternative signal of religiosity is more public than the original
one (and is therefore more easily observed by the candidates’ colleagues and customers in case of
a hire), it may impact candidates’ callback rates even when they are outstanding. Based on this
assumption, one expects that (i) Christian men gain ground by calling themselves “Michel” rather
than “Adam”; (ii) Muslims lose ground by calling themselves “Samira” rather than “Myriam” for
women and “Mohammed” rather than “Adam” for men (with this e↵ect being statistically significant
at least among Muslim men).
For each of the four groups of applicants defined by their religious culture and gender, Table 7b
38There is no Muslim first name that can be borne by Christians in France without compromising their Christianidentity.
39These four possible types are: non-religious applications of good quality, non-religious applications of outstandingquality, religious applications of good quality and religious applications of outstanding quality.
29

reports the OLS estimates of Equation (4):
yi,a = �0 + �11R0(i) +Xa�
0a + ✏i,a (4)
where 1R0(i) is a dummy that is equal to 1 if the applicant’s first name is typical of his/her religious
culture and 0 otherwise, i.e. “Nathalie” vs “Myriam” for Christian women, “Samira” vs “Myriam”
for Muslim women, “Michel” vs “Adam” for Christian men and “Mohammed” vs “Adam” for Muslim
men.
Table 7b confirms the substantial and statistically significant religiosity premium for Christian
men. Moreover, it endorses the religiosity penalty for Muslims, a finding that is statistically significant
only for Muslim men, as was the case when the original measure of religiosity was used.
5.3 Taking variance-based statistical discrimination into account
According to Heckman and Siegelman (1993), the di↵erence in callback rates between a “major-
ity” and a “minority” applicant might reflect not only employers’ di↵erent preferences (taste-based
discrimination) and/or beliefs on the mean of applicants’ unobserved productivity (the classical no-
tion of statistical discrimination). Provided that employers evaluate applications according to some
threshold level of productivity, this di↵erence may also convey employers’ di↵erent beliefs on the
variance of applicants’ unobserved productivity.
It is important to identify whether employers perceive a group di↵erence in the variance of un-
observed variables since variance-based statistical discrimination potentially threatens the external
validity of the results. Indeed, if such discrimination is at work, the intensity of the overall penalty
endured by Muslim applicants depends on the level at which the experimenter standardizes their
observed characteristics. More precisely, if this level is situated below the threshold above which
the recruiter calls back, then the recruiter favors applicants belonging to the group with the largest
variance – for the probability that their productive characteristics lie above the threshold is higher
within this group. By contrast, if this level exceeds the threshold above which the recruiter calls back,
then the recruiter favors applicants belonging to the group with the smallest variance – for the prob-
ability that their productive characteristics lie above the threshold is higher within this group. Put
di↵erently, anti-Muslim discrimination might simply be an artifact of how the correspondence study
is implemented (Carlsson, Fumarco and Rooth (2014) and Rooth (2014)), i.e. how the standardiza-
tion of applications to particular values of the observables compares with the actual distribution of
30
observables among real applicants to the jobs ads dealt with in the experiment (information that the
experimenter does not observe, unfortunately).
Neumark (2012) develops a statistical procedure that allows disentangling the share of di↵erences
in callback rates that is attributable to di↵erences in preferences and/or beliefs on the first moment of
unobservables (i.e. mean of productivity), and the share that is attributable to di↵erences in beliefs
on the second moment of unobservables (i.e. variance of productivity). This approach requires
estimating an heteroskedastic probit model, since this model allows the variance of the error term to
vary across groups. For identification purposes, the model must control for at least one characteristic
that a↵ects the callback rate of both the majority and the minority applicants in a similar way.
Based on Section 4, the “Muslim vs Christian culture” e↵ect shows substantial variation across
religiosity, gender and quality. It also varies with whether the fictitious candidates apply as account-
ing clerks or accountants, as well as with region characteristics. In fact, the length of the job contract
(“CDI vs CDD”) is the only characteristic that both shows substantial variation across the sample
(which is not the case of firm characteristics) and does not di↵erentially impact the callback rate of
Christian and Muslim applicants. Moreover, this variable is one of the few that is consequential in
the hiring process, another important requirement for identifying variance-based statistical discrimi-
nation: it exerts a statistically significant negative impact on the applicants’ callback rate (see Table
3).
Table 7c implements Neumark’s statistical procedure. Panels A and B report the marginal “Mus-
lim vs Christian culture” e↵ect when one controls for the length of the job contract and relies on
a probit model (Panel A) or on an heteroskedastic probit model (Panel B). These marginal e↵ects
are nearly equivalent: they reveal that the callback rate of applicants of Muslim culture is lower by
6.7 (Panel A) or 6.6 (Panel B) percentage points, as compared to the callback rate of applicants of
Christian culture. This similarity across Panel A and Panel B suggests that recruiters do not perceive
a group di↵erence in the variance of unobserved variables. This surmise is confirmed by the next two
rows of Panel B: the standard deviation of unobservables for Muslims is only 1.131 higher than that
for Christians, a di↵erence that falls short of statistical significance.
Decomposing the overall marginal e↵ect from the heteroskedastic probit model shows that the
e↵ect through the level is more negative. By contrast, the e↵ect through the variance is positive.
Although none of these sub-e↵ects is statistically significant (which is consistent with the absence of
variance-based statistical discrimination), it is important to note that they would not threaten the
external validity of the main results if they were statistically di↵erent from 0 instead. Indeed, coupled
31

with a higher estimated variance of the unobservables for Muslims, the sign of the e↵ect through the
variance is consistent with a low level of standardization of the observables.40 Put di↵erently, the
overall magnitude of anti-Muslim discrimination would be even higher if standardization had settled
at a high level, i.e. one that exceeds the threshold above which the recruiters call back. Anti-Muslim
discrimination is therefore robust to the possibility that the recruiters hold di↵erent beliefs on the
variance of applicants’ unobserved productivity.
5.4 A Muslim e↵ect or a religious minority e↵ect?
To investigate whether Muslims are discriminated against due to their Islamic a�liation or simply
due to their religious minority status, applicants of Jewish culture are introduced into the experi-
mental setup. Similar to the procedure for Christian and Muslim applicants, their religious culture
is conveyed through two pieces of information. First, their first name. Based on the INSEE Name
Frequency Dataset, one among the five most frequent Jewish first names41 is randomly selected. The
outcome of this random draw is “Dov” for Jewish men and “Esther” for Jewish women.42 Contrary
to applicants of Christian and Muslim culture, the second signal of religious culture for Jews does not
concern the religious denomination of the junior high school from which they graduated in Beirut.
Dov and Esther also graduated from a private bilingual French-Arab secondary school. However, it
is not denominational, given that there is no Jewish school in Beirut. Rather, the second signal of
religious culture for Dov and Esther relates to the “language skills” section of their CV. They are
the only candidates who show a second mother tongue, Hebrew, on top of Arabic which is a mother
tongue for all the candidates. To obviate the possibility that this particularity provides an advantage
to Jewish applicants, the CV of Dov and Esther emphasizes that they are proficient in speaking
Hebrew, not in writing or reading it.
As for applicants of Christian and Muslim culture, applicants of Jewish culture are either not
religious or religious, and either good or outstanding. The signal of non-religiosity, as well as the
quality treatment for Jews are the same as for applicants of other religious culture. Only the signal
40Although the quality of the fictitious applications is objectively good, it may still lie below that of the real
applicants who applied to the same job ads due to their young age and, hence, short work experience.41A Jewish first name is defined as a first name of Hebrew origin that has not become common in France, i.e. that
has not become part of the French Christian culture.42The top 5 for (i) Jewish male first names are “Joshua/Josue”, “Isaac”, “Solal”, “Jacob” and “Dov/Dove”; (ii)
Jewish female first names are “Rachel/Rachelle”, “Deborah”, “Esther”, “Rebecca” and “Hannah”. These top 5 areobtained after excluding (i) dual gender first names (e.g. “Noah/Noa”, “Noam”, “Yael”); (ii) the male first names“Israel” and “Levy” since “Israel” would not allow distinguishing between attitudes toward Jews and attitudes towardIsrael and “Levy” is primarily a last name in France.
32
of religiosity di↵ers, since this signal is specific to each religious culture: when they are religious, Dov
and Esther indicate that they “train young people in the Jewish Scouting association Israelite Girl
and Boy Scouts of France”.43 The follow-up survey (see Section 3.5) confirms that a large majority
of recruiters correctly interpret this signal by assigning a high religiosity to these candidates: 78.7%
believe that the importance of religion for these candidates is “very high” or “rather high”. As a
comparison, 9.2% respond “very little” or “rather little”. The remaining 12.1% “do not know”. The
follow-up survey delivers another important piece of information about the credibility of applications
from Jewish candidates of Lebanese background. Historical accounts point to the near extinction of
Lebanese Jews living in Lebanon, since most of them settled in Israel following the establishment of
the State of Israel in 1948 (Schulze (2001)). If recruiters were aware of this situation, they might not
have taken the applications of Jewish fictitious candidates seriously. To test for this possibility, the
follow-up survey includes the following question: “Imagine a job applicant from Lebanon. Would you
be surprised if this candidate was of (i) Christian culture; (ii) Muslim culture; (iii) Jewish culture;
(iv) Buddhist culture; (v) Hindu culture; (vi) Animist culture?”. The results reveal that a large
majority of recruiters would “not be surprised at all” or “not really surprised” if this candidate had
grown up in one of the three monotheistic religious cultures. More precisely, this proportion is equal
to 79%, 85.2% and 65.4% for a candidate of Christian, Muslim or Jewish culture respectively.44 By
contrast, only a minority of recruiters (ranging from 22.6% to 29.6%) would not raise their eyebrows
in the case of a Lebanese-born job applicant of Buddhist, Hindu or Animist culture. These findings
therefore establish that not only the job applications of Christian and Muslim fictitious candidates
but also those of Jewish fictitious candidates are viewed as credible by the recruiters.
Table 7d tests whether the two main results of this correspondence study apply to applicants of
Jewish culture. More precisely, it investigates (i) whether these applicants are discriminated against
relative to applicants of Christian culture ; (ii) whether the religiosity penalty for applicants of
Jewish background is as strong as that experienced by their Muslim counterparts. Panel A of Table
7d reports the OLS estimates of Equation (1) when 1M(i) is replaced by 1J(i), a dummy equal
to 1 if the applicant is of Jewish culture and 0 if he or she is of Christian culture. Contrary to
Table 3, it reveals no anti-Jewish hiring discrimination. Panel B of Table 7d goes a step further by
displaying the OLS estimates of Equation (2) when 1M(i) is replaced by 1J(i) and interacted with
43See https://www.eeif.org/.44As a comparison, 10.2%, 4.9% and 22.5% of recruiters would be “quite surprised” or “very surprised” to learn that
a candidate from Lebanon is of Christian, Muslim or Jewish culture respectively. The remaining respondents “do notknow”.
33

the “religiosity” dummy. It indicates that the religiosity penalty for applicants of Jewish culture is
lower than the religiosity penalty experienced by their Muslim counterparts. Jews and Muslims are
not discriminated against when they are not religious (see row (a) in Panel B of Table 7d and row (a)
in Panel A of Table 4b). But Muslims lose ground when they are religious to a greater extent than
Jews: the probability of a positive callback for religious Muslims is 5.8 percentage points lower than
that of non-religious Christians (statistically significant at the 99% confidence level – see row (f) in
Panel A of Table 4b), while the di↵erence in callback rates between religious Jews and non-religious
Christians is not significant, either statistically or in magnitude (see row (c) in Panel B of Table 7d).
Table 7e complements Panel B of Table 7d by presenting the OLS estimates of Equation (4) when
the dummy 1R0(i) takes the value 1 if the applicant’s first name is typically Jewish and 0 otherwise,
i.e. “Esther” vs “Myriam” for Jewish women and “Dov” vs “Adam” for Jewish men.45 A similar
analysis among Muslims has revealed that Muslims lose ground by calling themselves “Samira” rather
than “Myriam” for women and “Mohammed” rather than “Adam” for men, with these e↵ects being
statistically significant among Muslim men (see Table 7b). By contrast, the penalty associated with
this alternative measure of religiosity is never statistically significant among Jewish candidates (Table
7e). This series of results suggest that Muslims are not discriminated against simply due to their
religious minority status.
6 Conclusion
Relying on a correspondence study conducted in France before the 2015 attacks, this paper compares
the callback rates of immigrants of Muslim and Christian culture who originate from the same
country and whose religiosity varies, from non-religious to religious. The results reveal that Muslims
qua Muslims are discriminated against in France: the callback rate of applicants of Muslim culture
(11.7%) is 6.7 percentage points lower than that of their Christian counterparts (18.4%). This
general finding masks substantial variation along religiosity, gender and quality. Although non-
religious Muslims show consistently lower callback rates than non-religious Christians (12.9% vs
16.1%), this di↵erence is modest and not statistically significant. But Muslims lose further ground
when they are religious, unless they show an outstanding profile. This “religiosity penalty” leads
religious Muslims to be discriminated against relative to non-religious Christians. This gap further
45Applications endowed with the first name “Adam” or “Myriam” were created not only for religious outstandingcandidates of Christian and Muslim culture, but also for religious outstanding candidates of Jewish culture.
34
widens when religious Muslims are compared to religious Christians. While religiosity constitutes a
penalty for Muslims, it works as a premium for Christians: their callback rate is boosted when they
are religious. Consequently, religious Muslims must submit twice as many applications as religious
Christians before being called back by the recruiters. This result is largely driven by male applicants,
due to the strong “religiosity premium” experienced by Christian men: the callback rate of religious
Muslim men (4.7%) is nearly four times lower than that of their Christian counterparts (17.9%).
Anti-Muslim discrimination is robust to alternative measures of the callback rate and religios-
ity. It also holds after taking into account that recruiters may have di↵erent beliefs not only on
the mean but also on the variance of Christians’ and Muslims’ unobserved productivity. Finally,
introducing fictitious applicants of Jewish culture into the experimental setup shows that Muslims
are discriminated against due to their Islamic a�liation, not due to their religious minority status.
One potential limitation of these findings resides in the incapacity of a correspondence study
to measure eventual di↵erences in the rates at which individuals from di↵erent groups get hired.
To detect those, it would be necessary to prolong the correspondence study (and the fiction) by
an audit study, i.e. sending fake applicants, the “auditors”, to the job interviews.46 Cediey and
Foroni (2008) are the only researchers to have combined a correspondence study and an audit study
in France. These authors show that minority applicants (French persons of North African or sub-
Saharan African origins) face discrimination throughout the recruitment process in comparison to
majority applicants (French persons with no recent immigrant background). Their chance of being
invited to a hiring interview is lower, as is their chance of being o↵ered the job once the interview
has taken place. These conclusions suggest that this paper’s main findings are conservative: we risk
underestimating anti-Muslim discrimination, not overestimating it.
This paper contributes to explaining the strong hiring discrimination against French applicants
of North African and Middle Eastern origin (relative to French applicants with no recent immigrant
background) that a series of correspondence studies have been consistently revealing since their
inception in France in the mid-2000s. Indeed, applicants of North African and Middle Eastern origin
tend to be spontaneously associated with Islam by French recruiters (IMS-Entreprendre pour la Cite
survey (2014)).
46Although audit studies became popular in the early 1990s (Cross et al. (1990), Turner, Fix and Struyk (1991)and Bendick, Jackson and Reinoso (1994)), they soon were subject to serious criticism. First, despite e↵orts tomatch auditors on several characteristics, di↵erences that are potentially critical for the recipients of their applicationsinevitably remain. Second, auditors obviously know the purpose of the study they are part of. This can lead them toconsciously or subconsciously behave in a way consistent or inconsistent with their beliefs about how di↵erent groupsare treated. Third, audit studies are extremely expensive, which precludes researchers from generating large samples(Bertrand and Mullainathan (2004)).
35

How to combat such discrimination? This paper suggests that anti-Muslim hiring discrimination
is statistical: recruiters do not discriminate against non-religious Muslims but they do discriminate
against religious Muslims unless they are outstanding. This finding is consistent with religious Mus-
lims being linked to a risk of problematic behavior in the workplace that leads to discrimination
when the quality of their CV is not su�cient to counterbalance this risk (a pattern that is surely
becoming even more pervasive after the 2015 attacks47). Yet, although the large majority of requests
for accommodations of a religious nature that HR managers and sta↵ report having to deal with
emanate from Muslim employees, the 2013 to 2016 OFRE/Randstad surveys indicate that only a
minority (less than 10%) of these requests result in “a stalemate or a conflict” (i.e. the manager is
opposed to the employee’s request although this request is legal or the employee maintains his/her
request although this request is illegal48). A way to reduce anti-Muslim statistical discrimination
would consist in curtailing this proportion through distributing instructional guides that remind em-
ployers, employees as well as job seekers of the legal barriers to the expression of religious convictions
in the workplace. This approach was recently supported by the French Ministry of labor with the
publication in January 2017 of an o�cial guide on dealing with religious issues within French firms.49
It remains however to evaluate whether such a guide is indeed e↵ective at reducing anti-Muslim
discrimination in France.
But anti-Muslim discrimination is not only statistical. Consistent with previous studies, this paper
suggests that it is also taste-based outside the hiring process. Here, prejudice-reducing interventions
as early as primary school might be the adequate strategy, one that Emmanuel Macron has committed
to implement during his presidency.50 Unfortunately, little is known on how these interventions
must be devised to maximize their impact and its persistence (see Broockman and Kalla (2016) for
provisional insights). More research is also needed to figure out how best to limit the expression of
47As an illustration, the proportion of a representative sample of French respondents who perceive Muslims in Franceas a threat has increased between the period before and the period after these attacks: this proportion was equal to43% in 2012 but reaches 47% in 2016 (IFOP (2016)).
48The only legal barriers to the expression of religious convictions are what the anti-discrimination authority inFrance calls “the protection of individuals” (i.e. the practice of one’s religion cannot extend to proselytizing atwork, or get in the way of safety requirements and the requirements of hygiene in the workplace) and “the properfunctioning of the firm” (i.e. religious practice (i) does not negatively a↵ect one’s ability to perform one’s assignedtasks, (ii) does not create organizational problems that hamper teamwork, and (iii) does not undermine the firm’scommercial prospects). In this setting, requests for an adaptation of the work schedule for religious purposes, to misswork for religious festivals, or to pray during breaks are legal. By contrast, requests to pray during working hours,to not work with a woman, to work only with co-religionists or to not perform specific tasks that are part of theemployee’s mission are illegal.
49See http://travail-emploi.gouv.fr/droit-du-travail/relations-au-travail/pouvoir-de-direction/
guide-du-fait-religieux-dans-les-entreprises-privees/.50See the following excerpt from his electoral platform:
https://en-marche.fr/article/reussir-dans-nos-quartiers-propositons
36
cognitive biases and “attention-based discrimination” (Bartos et al. (2016)) with machine learning.51
All in all, it is critical to identify policies that could improve labor market outcomes of Muslims
in France. Anti-Muslim discrimination does indeed generate a discriminatory equilibrium (Adida,
Laitin and Valfort (2016), Glover, Pallais and Pariente (2017)) that has the potential to seriously
hamper France’s social cohesion.
References
[1] Acquisti, Alessandro and Christina M. Fong. 2015. “An experiment in hiring discrimination via
online social networks.” Working paper.
[2] Adida, Claire L., David D. Laitin and Marie-Anne Valfort. 2010. “Identifying barriers to Muslim
integration in France.” PNAS (Proceedings of the National Academy of Sciences of the United
States of America) 107(52): 384-390.
[3] Adida, Claire L., David D. Laitin and Marie-Anne Valfort. 2014. “Muslims in France: Identifying
a discriminatory equilibrium.” Journal of Population Economics 27(4): 1039-1086.
[4] Adida, Claire L., David D. Laitin and Marie-Anne Valfort. 2016a. Why Muslim integration fails
in Christian-heritage societies. Harvard University Press.
[5] Adida, Claire L., David D. Laitin and Marie-Anne Valfort. 2016b. “‘One Muslim is enough!’
Evidence from a field experiment in France.” Annals of Economics and Statistics 121-122: 121-
160.
[6] Aeberhardt, Romain, Elise Coudin and Roland Rathelot. 2017. “The heterogeneity of ethnic
employment gaps.” Journal of Population Economics 30(1): 307-337.
[7] Aeberhardt, Romain, Denis Fougere, Julien Pouget and Roland Rathelot. 2010. “Wages and
employment of French workers with African origin.” Journal of Population Economics 23(3):
881-905.
[8] Ai, Chunrong and Edward Norton. 2003. “Interaction terms in logit and probit models.” Eco-
nomics Letters 80(1): 123-129.
51For instance, Ho↵man, Kahn and Li (2018) evaluate the impact of job-testing recruitment technologies. Theyshow that firms that use these technologies and, hence, rely less on human judgment end up with better hires (a resultconsistent with that of Autor and Scarborough (2008)). See also Kleinberg et al. (2018) on how to improve humandecision making with machine learning.
37

[9] Aigner, Dennis J. and Glen G. Cain. 1977. “Statistical theories of discrimination in labor mar-
kets.” Industrial and Labor Relations Review 30(2): 175-187.
[10] Alesina, Alberto, Reza Baqir and William Easterly. 1999. “Public goods and ethnic divisions.”
The Quarterly Journal of Economics 114(4): 1243-1284.
[11] Allport, Gordon W. 1954. The Nature of Prejudice. Doubleday.
[12] Arcidiacono, Peter, Patrick Bayer and Aurel Hizmo. 2010. “Beyond signaling and human capital:
Education and the revelation of ability.” American Economic Journal: Applied Economics 2(4):
76-104.
[13] Arrow, Kenneth J. 1972. “Models of job discrimination, and, some mathematical models of race
in the labor market.” In: A.H. Pascal (Ed.), Racial discrimination in Economic life. Lexington
Books, pp. 83-102 and 187-204.
[14] Autor, David H. and David Scarborough. 2008. “Does job testing harm minority workers? Evi-
dence from retail establishments.” The Quarterly Journal of Economics 123(1): 219-277.
[15] Baert, Stijn, Bart Cockx, Niels Gheyle and Cora Vandamme. 2015. “Is there less discrimination
in occupations where recruitment is di�cult.” Industrial and Labor Relations Review 68(3):
467-500.
[16] Baert, Stijn, Ann-Sophie De Pauw and Nick Deschacht. 2016. “Do Employer Preferences Con-
tribute to Sticky Floors?” Industrial and Labor Relations Review 69(3): 714-736.
[17] Bartos, Vojtech, Michal Bauer, Julie Chytilova and Filip Matejka. 2016. “Attention discrimi-
nation: Theory and field experiments with monitoring information acquisition.” American Eco-
nomic Review 106(6): 1437-1475.
[18] Bayer, Patrick and Robert McMillan. 2012. “Tiebout sorting and neighborhood stratification.”
Journal of Public Economics 96(11-12): 1129-1143.
[19] Becker, Gary S. 1957. The Economics of Discrimination. University of Chicago Press.
[20] Bendick, Marc Jr., Charles W. Jackson and J. Horacio Romero. 1997. “Employment discrimi-
nation against older workers: An experimental study of hiring practices.” Journal of Aging &
Social Policy 8(4): 25-46.
38
[21] Bertrand, Marianne and Sendhil Mullainathan. 2004. “Are Emily and Greg more employable
than Lakisha and Jamal? A field experiment on labor market discrimination.” American Eco-
nomic Review 94(4): 991-1013.
[22] Biddle, Je↵ E. and Daniel Hamermesh. 2013. “Wage discrimination over the business cycle.”
IZA Journal of Labor Policy 2(7): 1-19.
[23] Billig, Michael et Henri Tajfel. 1973. “Social categorization and similarity in intergroup behav-
ior.” European Journal of Social Psychology 3(1) : 27-52.
[24] Blalock, Hubert M. 1967. Toward a theory of minority-group relations. Capricorn Books.
[25] Blattman, Christopher and Laura Ralston. 2015. “Generating employment in poor and fragile
states: Evidence from labor market and entrepreneurship programs.” Working paper.
[26] Blommaert, Lieselotte, Marcel Coenders and Frank van Tubergen. 2013. “Discrimination of
Arabic-Named applicants in the Netherlands: An Internet-based field experiment examining
di↵erent phases in online recruitment procedures.” Social Forces 92(3): 957-982.
[27] Booth, Alison L., Andrew Leigh and Elena Varganova. 2012. “Does ethnic discrimination vary
across minority groups? Evidence from a field experiment.” Oxford Bulletin of Economics and
Statistics 74(4): 547-573.
[28] Booth, Alison L. and Andrew Leigh. 2010. “Do employers discriminate by gender? A field
experiment in female-dominated occupations.” Economics Letters 107(2): 236-238.
[29] Bordalo, Pedro, Katherine Co↵man, Nicola Gennaioli and Andrei Shleifer. “Stereotypes.” The
Quarterly Journal of Economics 131(4): 1753-1794.
[30] Bowyer, Benjamin T. 2009. “The contextual determinants of Whites’ racial attitudes in Eng-
land.” British Journal of Political Science, 39(3): 559-586.
[31] Broockman, David and Joshua Kalla. 2016. “Durably reducing transphobia: A field experiment
on door-to-door canvassing.” Science 352(6282): 220-224.
[32] Brouard, Sylvain and Vincent Tiberj. 2011. As French as everyone else? A survey of French
citizens of Maghrebin, African, and Turkish Origin. Temple University Press.
39
[33] Bryson, Alex and Arnaud Chevalier. 2015. “Is there a taste for racial discrimination amongst
employers?” labor Economics 34: 51-63.
[34] Bunel, Mathieu, Yannick L’Horty and Pascale Petit. 2016. “Discrimination based on place of
residence and access to employment.” Urban Studies 53(2): 267-286.
[35] Cahuc, Pierre, Stephane Carcillo, Andreea Minea and Marie-Anne Valfort. 2018. “Invitation
discrimination versus hiring discrimination.” Working paper.
[36] Carlsson, Magnus and Dan-Olof Rooth. 2007. “Evidence of ethnic discrimination in the Swedish
labor market using experimental data.” labor Economics 14(4): 716-729.
[37] Carlsson, Magnus, Luca Fumarco and Dan-Olof Rooth. 2014. “Does the design of correspondence
studies influence the measurement of discrimination?” IZA Journal of Migration 3(11): 1-17.
[38] Cediey, Eric and Fabrice Foroni. 2008. “Discrimination in access to employment on grounds of
foreign origin in France. A national survey of discrimination based on the testing methodology
of the International labor O�ce.” International labor Organization.
[39] Chen, Yan and Sherry Xin Li. 2009. “Group identity and social preferences.” American Economic
Review 99(1): 431-457.
[40] Currarini, Sergio, Matthew O. Jackson and Paolo Pin. 2009. “An economic model of friendship:
Homophily, minorities, and segregation.” Econometrica 77(4):1003-1045.
[41] Currarini, Sergio and Friederike Mengel. 2016. “Identity, homophily and in-group bias.” Euro-
pean Economic Review 90: 40-55.
[42] CNCDH (Commission nationale consultative des droits de l’homme). 2013. Rapport annuel sur
le racisme, l’antisemitisme et l’islamophobie.
[43] Cross, Harry, Genevieve Kenney, Jane Mell and Wendy Zimmerman. 1990. Employer hiring
practices: Di↵erential treatment of Hispanic and Anglo job-seekers. Urban Institute Press.
[44] Deming, David J., Noam Yuchtman, Amira Abulafi, Claudia Goldin and Lawrence F. Katz. 2016.
The value of postsecondary credentials in the labor market: An experimental study. American
Economic Review 106(3): 778-806.
40
[45] Doleac, Jennifer L. and Luke C.D. Stein. 2013. “The visible hand: Race and online market
outcomes.” The Economic Journal 123(572): F469-F492.
[46] Duguet, Emmanuel, Noam Leandri, Yannick L’Horty and Pascale Petit. 2010. “Are young French
jobseekers of ethnic immigrant origin discriminated against? A controlled experiment in the Paris
area.” Annals of Economics and Statistics 99-100: 187-215.
[47] Eriksson, Stefan and Dan-Olof Rooth. 2014. “Do employers use unemployment as a sorting
criterion when hiring? Evidence from a field experiment. American Economic Review 104(3):
1014-1039.
[48] Fish, Steven. 2011. Are Muslims distinctive? A look at the evidence. Oxford University Press.
[49] Fougere, Denis, Francis Kramarz and Julien Pouget. 2009. “Youth unemployment and crime in
France.” Journal of the European Economic Association 7(5): 909-938.
[50] Glover, Dylan, Amanda Pallais and William Pariente. 2017. “Discrimination as a self-fulfilling
prophecy: Evidence from French grocery stores.” The Quarterly Journal of Economics 132(3):
1219-1260.
[51] Gould, Eric D. and Esteban F. Klor. 2016. “The long-run e↵ect of 9/11: terrorism, backlash,
and the assimilation of Muslim immigrants in the West.” The Economic Journal 126(597):
2064-2114.
[52] Harris Interactive. 2013. “Le regard des Francais sur la religion musulmane.”
[53] Heckman, James J. and Peter Siegelman. 1993. “The urban institute audit studies: Their meth-
ods and findings.” In: Michael Fix and Raymond Struyk (Eds.), Clear and convincing evidence:
Measurement of discrimination in America. The Urban Institute Press, pp. 187-258.
[54] Hetschko, Clemens, Andreas Knabe and Ronnie Schob. 2014. “Changing identity: Retiring from
unemployment.” The Economic Journal 124(575): 149-166.
[55] Hitsch, Gunter J., Ali Hortacsdu and Dan Ariely. 2010. “Matching and sorting in online dating.”
American Economic Review 100(1): 130-163.
[56] Ho↵man, Mitchell, Lisa B. Kahn and Danielle Li. 2018. “Discretion in hiring.? Forthcoming in
Quarterly Journal of Economics.
41

[57] IFOP. 2010. “Le catholicisme en France en 2010.”
[58] IFOP. 2016. “Regards croises sur l’Islam en France et en Allemagne.”
[59] IMS-Entreprendre pour la Cite. 2014. Stereotypes sur les origines: Comprendre et agir dans
l’entreprise.
[60] INSEE. 2016. Tableaux de l’economie francaise.
[61] Jowell, Roger and Patricia Prescott-Clarke. 1970. “Racial discrimination and whitecollar workers
in Britain.” Race & Class 11(4): 397-417.
[62] Kaas, Leo and Christian Manger. “Ethnic discrimination in Germany’s labor market: A field
experiment.” German Economic Review 13(1): 1-20.
[63] Kepel, Gilles. 2015. Terreur dans l’Hexagone. Genese du djihad francais. Gallimard.
[64] Khosrokhavar, Farhad. 2016. “Jihad and the French Exception.” The New York Times.
[65] Kleinberg, Jon, Himabindu Lakkaraju, Jure Leskovec, Jens Ludwig and Sendhil Mullainathan.
2018. “Human decisions and machine predictions.” The Quarterly Journal of Economics 133(1):
237-293.
[66] Kleinmann, Scott Matthew. 2012. “Radicalization of homegrown Sunni militants in the United
States: Comparing converts and non-converts.” Studies in Conflict & Terrorism 35(4): 278-297.
[67] Kroft, Kory, Fabian Lange and Matthew J. Notowidigdo. 2013. “Duration dependence and labor
market conditions: Evidence from a field experiment.” The Quarterly Journal of Economics
128(3): 1123-1167.
[68] Krueger, Alan B. 2008. What makes a terrorist: Economics and the roots of terrorism. Princeton
University Press.
[69] Lahey Johanna N. 2008. “Age, women, and hiring an experimental study.” Journal of Human
Resources 43(1): 30-56
[70] Lahey Johanna N. and Ryan Beasley. 2016. “Technical aspects of correspondence studies.” NBER
Working Paper No. 22818.
42
[71] Lang, Kevin and Michael Manove. 2011. “Education and labor market discrimination.” American
Economic Review 101(4): 1467-1496.
[72] List, John A. 2004. “The nature and extent of discrimination in the marketplace: Evidence from
the field.” The Quarterly Journal of Economics 119(1): 49-89.
[73] Locksley, Anne, Vilma Ortiz et Christine Hepburn. 1980. “Social categorization and discrimina-
tory behavior: Extinguishing the minimal intergroup discrimination e↵ect.” Journal of Person-
ality and Social Psychology 39(5): 773-783.
[74] McPherson, Miller, Lynn Smith-Lovin, and James M. Cook. 2001. “Birds of a feather: Ho-
mophily in Social Networks.” Annual Review of Sociology 27: 415-444.
[75] Neumark, David. 2012. “Detecting discrimination in audit and correspondence studies.” Journal
of Human Resources 47(4): 1128-1157.
[76] Neumark, David, Ian Burn and Patrick Button 2016. “Experimental age discrimination: Evi-
dence and the Heckman Critique.” American Economic Review 106(5): 303-308.
[77] OFRE (Observatoire du fait religieux en entreprise) and Randstad. 2013, 2014, 2015 and 2016.
Synthese des resultats de l’enquete.
[78] Opinionway. 2014. “Les Francais et le scoutisme.”
[79] Oreopoulos, Philip. 2011. “Why do skilled immigrants struggle in the labor market? A field
experiment with thirteen thousand resumes.” American Economic Journal: Economic Policy
3(4): 148-171.
[80] Petit, Pascale. 2007. “The e↵ects of age and family constraints on gender hiring discrimination:
A field experiment in the French financial sector.” labor Economics 14(3): 371-391.
[81] Perrineau, Pascal. 2014. La France au Front. Fayard.
[82] Pierne, Guillaume. 2013. “Hiring discrimination based on national origin and religious closeness:
Results from a field experiment in the Paris area.” IZA Journal of Labor Economics 2(4): 1-15.
[83] Riach, Peter A. and Judith Rich. 2006a. “An experimental investigation of sexual discrimination
in hiring in the English labor market.” The B.E. Journal of Economic Analysis & Policy 5(2):
1-22.
43

[84] Rooth, Dan-Olof. 2014. “Correspondence testing studies. What can we learn about discrimina-
tion in hiring?” IZA World of Labor 58.
[85] Roy, 2016. “France’s oedipal islamist complex.” Foreign Policy.
[86] Savelkoul, Michael, Peer Scheepers, Jochem Tolsma, and Louk Hagendoorn. 2011. “Anti-Muslim
attitudes in The Netherlands: Tests of contradictory hypotheses derived from ethnic competition
theory and intergroup contact theory.” European Sociological Review 27(6): 741-758.
[87] Schulze, Kirsten E. 2001. The Jews of Lebanon: Between coexistence and conflict. Sussex Aca-
demic Press.
[88] Tajfel, Henri. 1970. “Experiments in intergroup discrimination.” Scientific American 223(5):
96-102.
[89] TNS-Sofres. 2013. “Perception de l’identite, de la laıcite et de la diversite en France.”
[90] Turner, Margery, Michael Fix and Raymond Struyk. 1991. Opportunities denied, opportunities
diminished: Racial discrimination in hiring. Urban Institute Press.
[91] Verwimp, Philip. 2016. “Foreign fighters in Syria and Iraq and the socio-economic environment
they faced at home: A comparison of European countries.” Perspectives on Terrorism 10(6):
68-81.
[92] Wallace, Michael, Bradley R. E. Wright and Allen Hyde. 2014. “Religious a�liation and hiring
discrimination in the American South: A Field Experiment.” Social Currents 1(2): 189-207.
[93] Weichselbaumer, Doris. 2015. “Testing for discrimination against lesbians of di↵erent marital
status: A field experiment.” Industrial Relations: A Journal of Economy and Society 54(1):
131-161.
[94] Weichselbaumer, Doris. 2016. “Discrimination against female migrants wearing headscarves.”
IZA DP No. 10217.
[95] Widner, Daniel and Stephen Chicoine. 2011. “It’s all in the name: Employment discrimination
against Arab Americans.” Sociological Forum 26(4): 806-823.
44
[96] Wright, Bradley R.E., Michael Wallace, John Bailey and Allen Hyde. 2013. “Religious a�liation
and hiring discrimination in New England: A field experiment.” Research in Social Stratification
and Mobility 34: 111-126.
[97] Zussman, Asaf. 2013. “Ethnic discrimination: Lessons from the Israeli online market for used
cars.” The Economic Journal 123(572): F433-F468.
45

Tables
Table 1: Descriptive statistics for the sample composed of fictitious applicants of Christian and Muslim culture
N Mean Std. dev. Min Max
Dependent variablePositive callback from the recruiter 3,331 0.151 0.358 0 1
Main treatment variablesMuslim (vs Christian) religious culture 3,331 0.491 0.500 0 1Religious (vs non-religious) 3,331 0.496 0.500 0 1
Other treatment variablesMale (vs female) 3,331 0.493 0.500 0 1Outstanding (vs good) 3,331 0.498 0.500 0 1
Job characteristicsAccountant (vs accounting clerk) job 3,331 0.515 0.500 0 1CDI (vs CDD) 3,329 0.567 0.496 0 1
Firm characteristicsSector of activity
Private 3,325 0.860 0.347 0 1Public 3,325 0.072 0.258 0 1Non-profit (private) 3,325 0.068 0.252 0 1Primary 3,323 0.007 0.083 0 1Secondary 3,323 0.077 0.266 0 1Tertiary 3,323 0.916 0.277 0 1Size
Less than 250 employees 3,331 0.816 0.388 0 1More than 250 employees 3,331 0.060 0.238 0 1Unknown 3,331 0.124 0.330 0 1
Region characteristicsUnemployment rate 3,331 0.096 0.015 0.069 0.146Vote share of National Front 3,331 0.172 0.044 0.123 0.250Share of EVS/WVS respondents who self-identify as “Muslim” 3,331 0.023 0.014 0.003 0.042Share of immigrants from North Africa and Turkey 3,331 0.035 0.019 0.007 0.059
46

Table 2: Randomization tests
“Religious culture” treatment “Religiosity” treatment
Sample mean P-value of Sample mean P-value ofChristian Muslim test of equality Non-religious Religious test of equality
Accountant (vs accounting clerk job) 0.511 0.519 .643 0.518 0.510 .588CDI (vs CDD) 0.563 0.570 .719 0.569 0.560 .489Private sector 0.856 0.864 .521 0.871 0.850 .040**Public sector 0.071 0.073 .858 0.065 0.076 .134Non-profit sector 0.073 0.064 .286 0.064 0.073 .196Primary sector 0.007 0.007 .892 0.004 0.007 .333Secondary sector 0.079 0.075 .644 0.072 0.080 .254Tertiary sector 0.914 0.919 .628 0.924 0.913 .172Less than 250 employees 0.824 0.807 .203 0.818 0.803 .172More than 250 employees 0.058 0.062 .589 0.062 0.068 .330Unknown firm size 0.118 0.131 .269 0.121 0.129 .372Unemployment rate 0.096 0.096 .661 0.096 0.096 .965Vote share of National Front 0.172 0.172 .979 0.172 0.172 .729Share of EVS/WVS respondents who self-identify as “Muslim” 0.023 0.023 .942 0.023 0.023 .507Share of immigrants from North Africa and Turkey 0.035 0.035 .808 0.035 0.034 .494
“Gender” treatment “Quality” treatment
Sample mean P-value of Sample mean P-value ofFemale Male test of equality Good Outstanding test of equality
Accountant (vs accounting clerk) job 0.507 0.512 .701 0.502 0.526 .087*CDI (vs CDD) 0.559 0.559 .978 0.556 0.573 .236Private sector 0.858 0.863 .547 0.859 0.862 .717Public sector 0.070 0.070 .970 0.068 0.073 .482Non-profit sector 0.073 0.068 .435 0.073 0.064 .226Primary sector 0.008 0.004 .037** 0.006 0.005 .376Secondary sector 0.075 0.078 .682 0.075 0.078 .712Tertiary sector 0.917 0.918 .851 0.919 0.918 .905Less than 250 employees 0.805 0.816 .263 0.807 0.814 .551More than 250 employees 0.066 0.060 .326 0.061 0.069 .291Unknown firm size 0.129 0.124 .548 0.132 0.118 .134Unemployment rate 0.096 0.096 .132 0.096 0.096 .241Vote share of National Front 0.173 0.172 .264 0.173 0.171 .365Share of EVS/WVS respondents who self-identify as “Muslim” 0.023 0.023 .686 0.024 0.023 .233Share of immigrants from North Africa and Turkey 0.034 0.035 .443 0.035 0.035 .737
Note: This table reports means across subsamples of the experimental sample and presents simple randomization tests based on comparing the means across the subsamples. *, **and *** indicate statistical significance at the 90%, 95% and 99% confidence levels respectively.
47
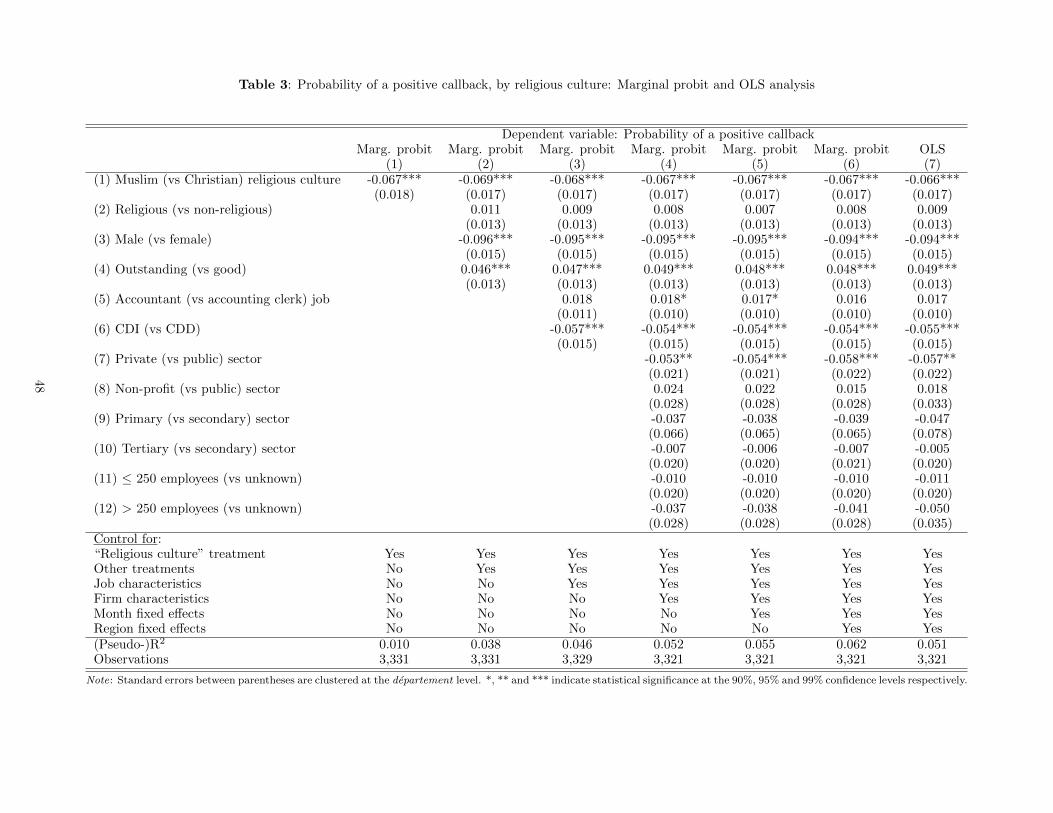
Table 3: Probability of a positive callback, by religious culture: Marginal probit and OLS analysis
Dependent variable: Probability of a positive callbackMarg. probit Marg. probit Marg. probit Marg. probit Marg. probit Marg. probit OLS
(1) (2) (3) (4) (5) (6) (7)(1) Muslim (vs Christian) religious culture -0.067*** -0.069*** -0.068*** -0.067*** -0.067*** -0.067*** -0.066***
(0.018) (0.017) (0.017) (0.017) (0.017) (0.017) (0.017)(2) Religious (vs non-religious) 0.011 0.009 0.008 0.007 0.008 0.009
(0.013) (0.013) (0.013) (0.013) (0.013) (0.013)(3) Male (vs female) -0.096*** -0.095*** -0.095*** -0.095*** -0.094*** -0.094***
(0.015) (0.015) (0.015) (0.015) (0.015) (0.015)(4) Outstanding (vs good) 0.046*** 0.047*** 0.049*** 0.048*** 0.048*** 0.049***
(0.013) (0.013) (0.013) (0.013) (0.013) (0.013)(5) Accountant (vs accounting clerk) job 0.018 0.018* 0.017* 0.016 0.017
(0.011) (0.010) (0.010) (0.010) (0.010)(6) CDI (vs CDD) -0.057*** -0.054*** -0.054*** -0.054*** -0.055***
(0.015) (0.015) (0.015) (0.015) (0.015)(7) Private (vs public) sector -0.053** -0.054*** -0.058*** -0.057**
(0.021) (0.021) (0.022) (0.022)(8) Non-profit (vs public) sector 0.024 0.022 0.015 0.018
(0.028) (0.028) (0.028) (0.033)(9) Primary (vs secondary) sector -0.037 -0.038 -0.039 -0.047
(0.066) (0.065) (0.065) (0.078)(10) Tertiary (vs secondary) sector -0.007 -0.006 -0.007 -0.005
(0.020) (0.020) (0.021) (0.020)(11) 250 employees (vs unknown) -0.010 -0.010 -0.010 -0.011
(0.020) (0.020) (0.020) (0.020)(12) > 250 employees (vs unknown) -0.037 -0.038 -0.041 -0.050
(0.028) (0.028) (0.028) (0.035)Control for:“Religious culture” treatment Yes Yes Yes Yes Yes Yes YesOther treatments No Yes Yes Yes Yes Yes YesJob characteristics No No Yes Yes Yes Yes YesFirm characteristics No No No Yes Yes Yes YesMonth fixed e↵ects No No No No Yes Yes YesRegion fixed e↵ects No No No No No Yes Yes(Pseudo-)R2 0.010 0.038 0.046 0.052 0.055 0.062 0.051Observations 3,331 3,331 3,329 3,321 3,321 3,321 3,321
Note: Standard errors between parentheses are clustered at the departement level. *, ** and *** indicate statistical significance at the 90%, 95% and 99% confidence levels respectively.
48

Table 4a: Heterogeneity of the “Muslim vs Christian culture” e↵ect, by religiosity (as well as gender and quality): OLS analysis
Panel A: All
(1) Muslim (vs Christian) religious culture -0.034 (0.022)(2) Muslim (vs Christian) religious culture ⇥ Religious (vs non-religious) -0.065** (0.025)(3) Religious (vs non-religious) 0.041** (0.020)
R2 =0.053; N=3,321Panel B: Female applicants of good quality
(1) Muslim (vs Christian) religious culture -0.005 (0.041)(2) Muslim (vs Christian) religious culture ⇥ Religious (vs non-religious) -0.124** (0.048)(3) Religious (vs non-religious) 0.083** (0.041)
R2 =0.076; N=830Panel C: Female applicants of outstanding quality
(1) Muslim (vs Christian) religious culture -0.071 (0.044)(2) Muslim (vs Christian) religious culture ⇥ Religious (vs non-religious) 0.048 (0.059)(3) Religious (vs non-religious) -0.045 (0.043)
R2 = 0.078; N=854Panel D: Male applicants of good quality
(1) Muslim (vs Christian) religious culture -0.046* (0.027)(2) Muslim (vs Christian) religious culture ⇥ Religious (vs non-religious) -0.016 (0.032)(3) Religious (vs non-religious) -0.035 (0.029)
R2 =0.078; N=837Panel E: Male applicants of outstanding quality
(1) Muslim (vs Christian) religious culture -0.039 (0.026)(2) Muslim (vs Christian) religious culture ⇥ Religious (vs non-religious) -0.173*** (0.038)(3) Religious (vs non-religious) 0.174*** (0.034)
R2 =0.117; N=800Control for:“Gender” treatment Panel A“Quality” treatment Panel AJob characteristics All panelsFirm characteristics All panelsMonth fixed e↵ects All panelsRegion fixed e↵ects All panels
Note: The dependent variable is the probability of receiving a positive callback from the recruiter. Standard errors between parentheses are clustered at thedepartement level. *, ** and *** indicate statistical significance at the 90%, 95% and 99% confidence levels respectively.
49
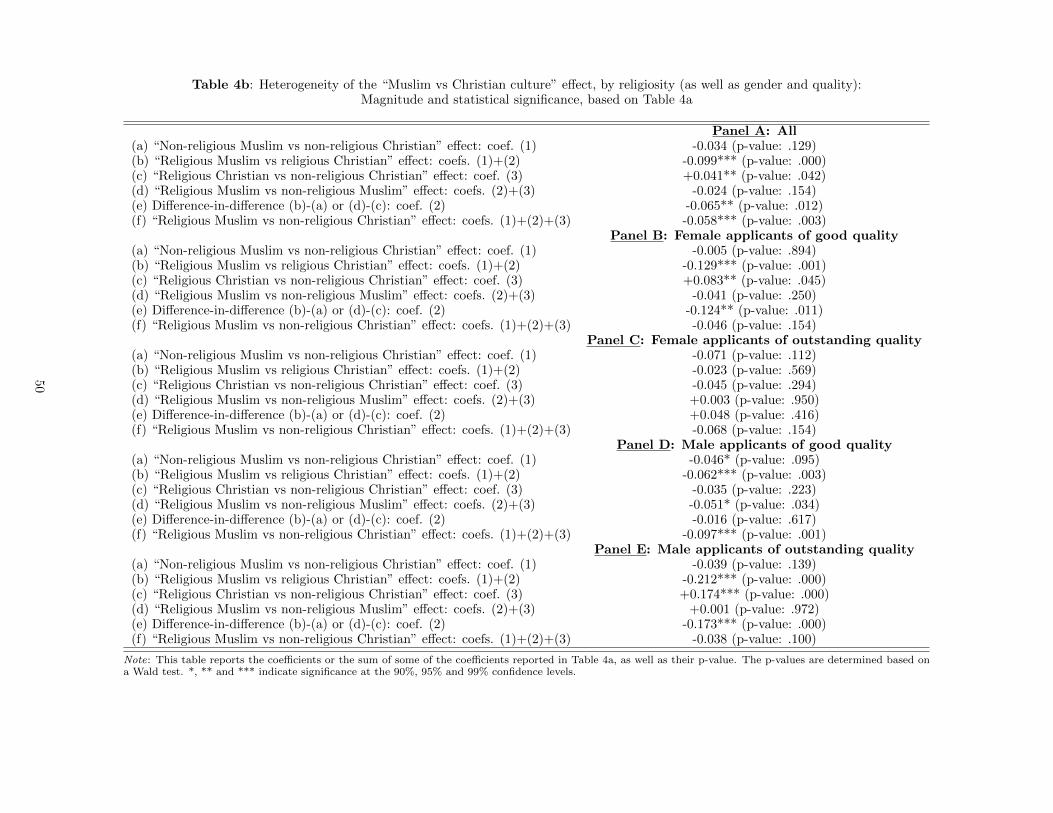
Table 4b: Heterogeneity of the “Muslim vs Christian culture” e↵ect, by religiosity (as well as gender and quality):Magnitude and statistical significance, based on Table 4a
Panel A: All
(a) “Non-religious Muslim vs non-religious Christian” e↵ect: coef. (1) -0.034 (p-value: .129)(b) “Religious Muslim vs religious Christian” e↵ect: coefs. (1)+(2) -0.099*** (p-value: .000)(c) “Religious Christian vs non-religious Christian” e↵ect: coef. (3) +0.041** (p-value: .042)(d) “Religious Muslim vs non-religious Muslim” e↵ect: coefs. (2)+(3) -0.024 (p-value: .154)(e) Di↵erence-in-di↵erence (b)-(a) or (d)-(c): coef. (2) -0.065** (p-value: .012)(f) “Religious Muslim vs non-religious Christian” e↵ect: coefs. (1)+(2)+(3) -0.058*** (p-value: .003)
Panel B: Female applicants of good quality
(a) “Non-religious Muslim vs non-religious Christian” e↵ect: coef. (1) -0.005 (p-value: .894)(b) “Religious Muslim vs religious Christian” e↵ect: coefs. (1)+(2) -0.129*** (p-value: .001)(c) “Religious Christian vs non-religious Christian” e↵ect: coef. (3) +0.083** (p-value: .045)(d) “Religious Muslim vs non-religious Muslim” e↵ect: coefs. (2)+(3) -0.041 (p-value: .250)(e) Di↵erence-in-di↵erence (b)-(a) or (d)-(c): coef. (2) -0.124** (p-value: .011)(f) “Religious Muslim vs non-religious Christian” e↵ect: coefs. (1)+(2)+(3) -0.046 (p-value: .154)
Panel C: Female applicants of outstanding quality
(a) “Non-religious Muslim vs non-religious Christian” e↵ect: coef. (1) -0.071 (p-value: .112)(b) “Religious Muslim vs religious Christian” e↵ect: coefs. (1)+(2) -0.023 (p-value: .569)(c) “Religious Christian vs non-religious Christian” e↵ect: coef. (3) -0.045 (p-value: .294)(d) “Religious Muslim vs non-religious Muslim” e↵ect: coefs. (2)+(3) +0.003 (p-value: .950)(e) Di↵erence-in-di↵erence (b)-(a) or (d)-(c): coef. (2) +0.048 (p-value: .416)(f) “Religious Muslim vs non-religious Christian” e↵ect: coefs. (1)+(2)+(3) -0.068 (p-value: .154)
Panel D: Male applicants of good quality
(a) “Non-religious Muslim vs non-religious Christian” e↵ect: coef. (1) -0.046* (p-value: .095)(b) “Religious Muslim vs religious Christian” e↵ect: coefs. (1)+(2) -0.062*** (p-value: .003)(c) “Religious Christian vs non-religious Christian” e↵ect: coef. (3) -0.035 (p-value: .223)(d) “Religious Muslim vs non-religious Muslim” e↵ect: coefs. (2)+(3) -0.051* (p-value: .034)(e) Di↵erence-in-di↵erence (b)-(a) or (d)-(c): coef. (2) -0.016 (p-value: .617)(f) “Religious Muslim vs non-religious Christian” e↵ect: coefs. (1)+(2)+(3) -0.097*** (p-value: .001)
Panel E: Male applicants of outstanding quality
(a) “Non-religious Muslim vs non-religious Christian” e↵ect: coef. (1) -0.039 (p-value: .139)(b) “Religious Muslim vs religious Christian” e↵ect: coefs. (1)+(2) -0.212*** (p-value: .000)(c) “Religious Christian vs non-religious Christian” e↵ect: coef. (3) +0.174*** (p-value: .000)(d) “Religious Muslim vs non-religious Muslim” e↵ect: coefs. (2)+(3) +0.001 (p-value: .972)(e) Di↵erence-in-di↵erence (b)-(a) or (d)-(c): coef. (2) -0.173*** (p-value: .000)(f) “Religious Muslim vs non-religious Christian” e↵ect: coefs. (1)+(2)+(3) -0.038 (p-value: .100)
Note: This table reports the coe�cients or the sum of some of the coe�cients reported in Table 4a, as well as their p-value. The p-values are determined based ona Wald test. *, ** and *** indicate significance at the 90%, 95% and 99% confidence levels.
50
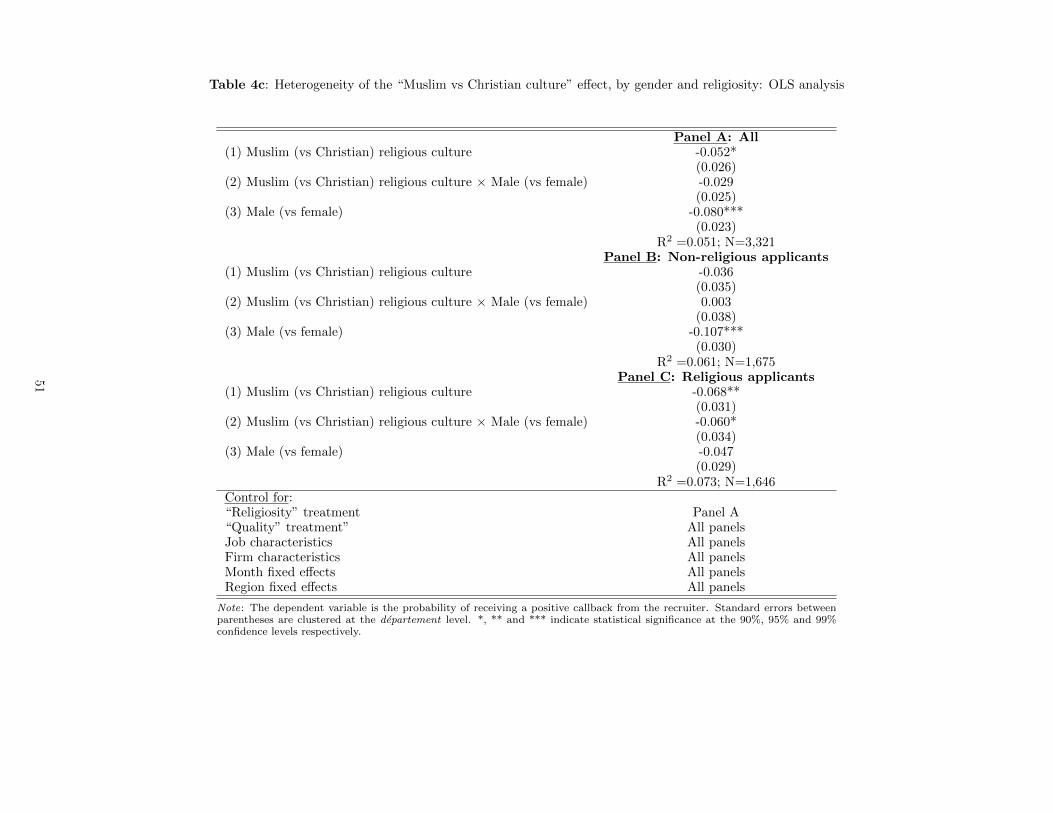
Table 4c: Heterogeneity of the “Muslim vs Christian culture” e↵ect, by gender and religiosity: OLS analysis
Panel A: All
(1) Muslim (vs Christian) religious culture -0.052*(0.026)
(2) Muslim (vs Christian) religious culture ⇥ Male (vs female) -0.029(0.025)
(3) Male (vs female) -0.080***(0.023)
R2 =0.051; N=3,321Panel B: Non-religious applicants
(1) Muslim (vs Christian) religious culture -0.036(0.035)
(2) Muslim (vs Christian) religious culture ⇥ Male (vs female) 0.003(0.038)
(3) Male (vs female) -0.107***(0.030)
R2 =0.061; N=1,675Panel C: Religious applicants
(1) Muslim (vs Christian) religious culture -0.068**(0.031)
(2) Muslim (vs Christian) religious culture ⇥ Male (vs female) -0.060*(0.034)
(3) Male (vs female) -0.047(0.029)
R2 =0.073; N=1,646Control for:“Religiosity” treatment Panel A“Quality” treatment” All panelsJob characteristics All panelsFirm characteristics All panelsMonth fixed e↵ects All panelsRegion fixed e↵ects All panels
Note: The dependent variable is the probability of receiving a positive callback from the recruiter. Standard errors betweenparentheses are clustered at the departement level. *, ** and *** indicate statistical significance at the 90%, 95% and 99%confidence levels respectively.
51
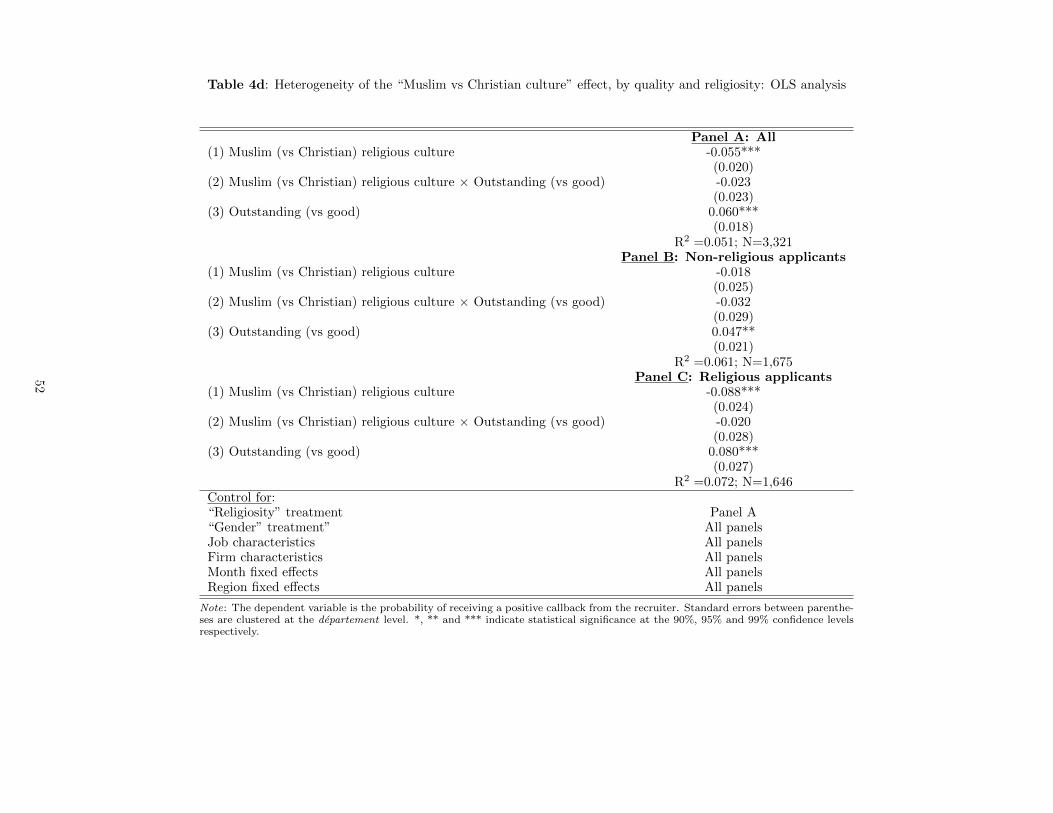
Table 4d: Heterogeneity of the “Muslim vs Christian culture” e↵ect, by quality and religiosity: OLS analysis
Panel A: All
(1) Muslim (vs Christian) religious culture -0.055***(0.020)
(2) Muslim (vs Christian) religious culture ⇥ Outstanding (vs good) -0.023(0.023)
(3) Outstanding (vs good) 0.060***(0.018)
R2 =0.051; N=3,321Panel B: Non-religious applicants
(1) Muslim (vs Christian) religious culture -0.018(0.025)
(2) Muslim (vs Christian) religious culture ⇥ Outstanding (vs good) -0.032(0.029)
(3) Outstanding (vs good) 0.047**(0.021)
R2 =0.061; N=1,675Panel C: Religious applicants
(1) Muslim (vs Christian) religious culture -0.088***(0.024)
(2) Muslim (vs Christian) religious culture ⇥ Outstanding (vs good) -0.020(0.028)
(3) Outstanding (vs good) 0.080***(0.027)
R2 =0.072; N=1,646Control for:“Religiosity” treatment Panel A“Gender” treatment” All panelsJob characteristics All panelsFirm characteristics All panelsMonth fixed e↵ects All panelsRegion fixed e↵ects All panels
Note: The dependent variable is the probability of receiving a positive callback from the recruiter. Standard errors between parenthe-ses are clustered at the departement level. *, ** and *** indicate statistical significance at the 90%, 95% and 99% confidence levelsrespectively.
52

Table 5a: Heterogeneity of the “Muslim vs Christian culture” e↵ect, by job characteristics: OLS analysis
Panel A: Accountant (vs accounting clerk) job
(1) Muslim (vs Christian) religious culture -0.045**(0.018)
(2) Muslim (vs Christian) religious culture ⇥ Accountant (vs accounting clerk) job -0.043**(0.019)
(3) Accountant (vs accounting clerk) job 0.037**(0.016)
R2 0.051Observations 3,321
Panel B: CDI (vs CDD)
(1) Muslim (vs Christian) religious culture -0.082***(0.022)
(2) Muslim (vs Christian) religious culture ⇥ CDI (vs CDD) 0.027(0.023)
(3) CDI (vs CDD) -0.068***(0.020)
R2 0.051Observations 3,321
Control for:“Religiosity” treatment All panels“Gender” treatment” All panels“Quality” treatment” All panelsOther job characteristics All panelsFirm characteristics All panelsMonth fixed e↵ects All panelsRegion fixed e↵ects All panels
Note: The dependent variable is the probability of receiving a positive callback from the recruiter. Standard errors between parentheses are clustered at the departementlevel. *, ** and *** indicate statistical significance at the 90%, 95% and 99% confidence levels respectively.
53

Table 5b: Heterogeneity of the “Muslim vs Christian culture” e↵ect, by firm characteristics: OLS analysis
Panel A: Private/non-profit (vs public) sector
(1) Muslim (vs Christian) religious culture -0.059 (0.053)(2) Muslim (vs Christian) religious culture ⇥ Private (vs public) sector -0.009 (0.055)(3) Muslim (vs Christian) religious culture ⇥ Non-profit (vs public) sector 0.007 (0.071)(4) Private (vs public) sector -0.053 (0.036)(5) Non-profit (vs public) sector 0.015 (0.045)R2 0.051Observations 3,321
Panel B: Primary/tertiary (vs secondary) sector
(1) Muslim (vs Christian) religious culture -0.095* (0.049)(2) Muslim (vs Christian) religious culture ⇥ Primary (vs secondary) sector 0.030 (0.150)(3) Muslim (vs Christian) religious culture ⇥ Tertiary (vs secondary) sector 0.031 (0.053)(4) Primary (vs secondary) sector -0.062 (0.113)(5) Primary (vs tertiary) sector -0.020 (0.037)R2 0.051Observations 3,321
Panel C: Less/more than 250 employees (vs unknown)
(1) Muslim (vs Christian) religious culture -0.112*** (0.033)(2) Muslim (vs Christian) religious culture ⇥ Less than 250 employees (vs unknown) 0.054 (0.035)(3) Muslim (vs Christian) religious culture ⇥ More than 250 employees (vs unknown) 0.023 (0.067)(4) Less than 250 employees (vs unknown) -0.039 (0.031)(5) More than 250 employees (vs unknown) -0.062 (0.057)R2 0.051Observations 3,321Control for:“Religiosity” treatment All panels“Gender” treatment” All panels“Quality” treatment” All panelsJob characteristics All panelsOther firm characteristics All panelsMonth fixed e↵ects All panelsRegion fixed e↵ects All panels
Note: The dependent variable is the probability of receiving a positive callback from the recruiter. Standard errors between parentheses are clustered at the departement level. *, **and *** indicate statistical significance at the 90%, 95% and 99% confidence levels respectively.
54

Table 5c: Heterogeneity of the “Muslim vs Christian culture” e↵ect, by region characteristics: OLS analysis
Panel A: Unemployment rate
(1) Muslim (vs Christian) religious culture -0.024(0.087)
(2) Muslim (vs Christian) religious culture ⇥ Unemployment rate -0.441(0.826)
P-value of the Wald test: (1)+0.146 ⇥(2) = 0 .025**R2 0.051Observations 3,321
Panel B: Vote share of National Front
(1) Muslim (vs Christian) religious culture -0.052(0.073)
(2) Muslim (vs Christian) religious culture ⇥ Vote share of National Front -0.082(0.383)
P-value of the Wald test: (1)+0.250⇥(2) = 0 .016**R2 0.051Observations 3,321
Panel C: Share of Muslims
(1) Muslim (vs Christian) religious culture 0.031(0.076)
(2) Muslim (vs Christian) religious culture ⇥ Share of Muslims -2.004*(1.148)
R2 0.052Observations 3,321
Panel D: Share of immigrants from North Africa/Turkey
(1) Muslim (vs Christian) religious culture 0.028(0.076)
(2) Muslim (vs Christian) religious culture ⇥ Share of immigrants from North Africa/Turkey -1.424 (p-value: .104)(0.867)
R2 0.052Observations 3,321
Control for:“Religiosity”, “Gender” and “Quality” treatments All panelsJob characteristics All panelsFirm characteristics All panelsMonth fixed e↵ects All panelsRegion fixed e↵ects All panels
Note: The dependent variable is the probability of receiving a positive callback from the recruiter. Standard errors between parentheses are clustered at the departement level. *, ** and ***indicate statistical significance at the 90%, 95% and 99% confidence levels respectively. To take into account that Muslims may sort into regions depending on the local level of anti-Muslimprejudice, the interaction term between “Muslim (vs Christian) religious culture” and “Vote share of National Front” is introduced among the controls of Panels C and D.
55

Table 6: Exploring anti-Muslim taste-based discrimination: OLS analysis
Dep. var.: Probability of being notified Dep.var.: Tone of theof the recruiter’s negative response negative response
Muslim (vs Christian) culture -0.023 (p-value: .113) -0.176*(0.014) (0.101)
R2 0.053 0.081Observations 2,821 542
Control for:“Religious culture” treatment Yes YesOther treatments Yes YesJob characteristics Yes YesFirm characteristics Yes YesMonth fixed e↵ects Yes YesRegion fixed e↵ects Yes Yes
Note: Standard errors between parentheses are clustered at the departement level. *, ** and *** indicate statisticalsignificance at the 90%, 95% and 99% confidence levels respectively.
56

Table 7a: Robustness checks: Alternative measures of the callback rate (OLS analysis)
Original measure Alternative measure 1 Alternative measure 2Panel A: Baseline
Muslim (vs Christian) religious culture -0.066*** -0.045*** -0.111***(0.017) (0.012) (0.029)
R2 =0.051; N=3,321 R2 =0.043; N=3,321 R2 =0.049; N=3,321Panel B: Heterogeneity by religiosity
(1) Muslim (vs Christian) religious culture -0.034 -0.019 -0.053(0.022) (0.019) (0.040)
(2) Muslim (vs Christian) religious culture ⇥ Religious (vs non-religious) -0.065** -0.054** -0.119**(0.025) (0.023) (0.047)
(3) Religious (vs non-religious) 0.041** 0.020 0.061*(0.020) (0.018) (0.037)
R2 =0.053; N=3,321 R2 =0.045; N=3,321 R2 =0.052; N=3,321Panel C: Heterogeneity by gender
(1) Muslim (vs Christian) religious culture -0.052* -0.038** -0.090**(0.026) (0.018) (0.042)
(2) Muslim (vs Christian) religious culture ⇥ Male (vs female) -0.029 -0.014 -0.043(0.025) (0.019) (0.041)
(3) Male (vs female) -0.080*** -0.051*** -0.131***(0.023) (0.016) (0.037)
R2 =0.051; N=3,321 R2 =0.043; N=3,321 R2 =0.050; N=3,321Panel D: Heterogeneity by quality
(1) Muslim (vs Christian) religious culture -0.055*** -0.037** -0.091**(0.020) (0.016) (0.035)
(2) Muslim (vs Christian) religious culture ⇥ Outstanding (vs good) -0.023 -0.017 -0.040(0.023) (0.021) (0.042)
(3) Outstanding (vs good) 0.060*** 0.048*** 0.108***(0.018) (0.016) (0.033)
R2 =0.051; N=3,321 R2 =0.043; N=3,321 R2 =0.050; N=3,321Control for:“Religiosity” treatment Panels A, C & D Panels A, C & D Panels A, C & D“Gender” treatment Panels A, B & D Panels A, B & D Panels A, B & D“Quality” treatment Panels A, B & C Panels A, B & C Panels A, B & CJob characteristics All panels All panels All panelsFirm characteristics All panels All panels All panelsMonth fixed e↵ects All panels All panels All panelsRegion fixed e↵ects All panels All panels All panels
Note: The dependent variable is the probability of receiving a positive callback from the recruiter. Standard errors between parentheses are clustered at the departement level.*, ** and *** indicate statistical significance at the 90%, 95% and 99% confidence levels respectively.
57
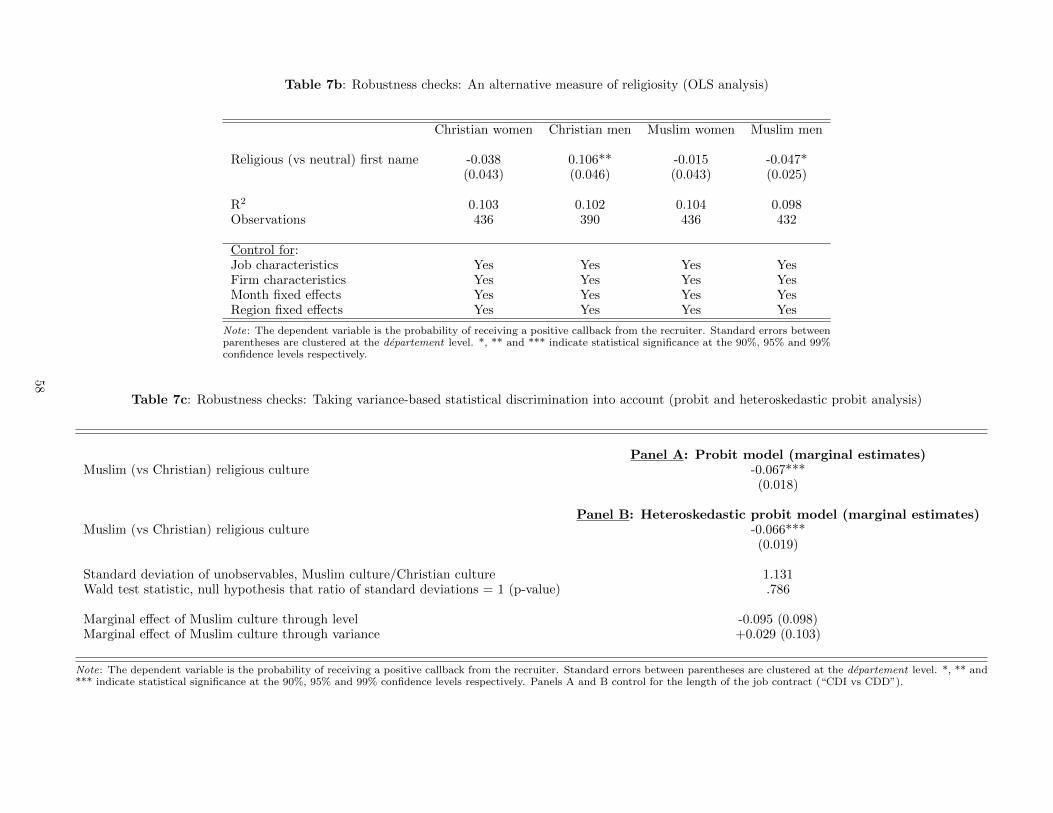
Table 7b: Robustness checks: An alternative measure of religiosity (OLS analysis)
Christian women Christian men Muslim women Muslim men
Religious (vs neutral) first name -0.038 0.106** -0.015 -0.047*(0.043) (0.046) (0.043) (0.025)
R2 0.103 0.102 0.104 0.098Observations 436 390 436 432
Control for:Job characteristics Yes Yes Yes YesFirm characteristics Yes Yes Yes YesMonth fixed e↵ects Yes Yes Yes YesRegion fixed e↵ects Yes Yes Yes Yes
Note: The dependent variable is the probability of receiving a positive callback from the recruiter. Standard errors betweenparentheses are clustered at the departement level. *, ** and *** indicate statistical significance at the 90%, 95% and 99%confidence levels respectively.
Table 7c: Robustness checks: Taking variance-based statistical discrimination into account (probit and heteroskedastic probit analysis)
Panel A: Probit model (marginal estimates)
Muslim (vs Christian) religious culture -0.067***(0.018)
Panel B: Heteroskedastic probit model (marginal estimates)
Muslim (vs Christian) religious culture -0.066***(0.019)
Standard deviation of unobservables, Muslim culture/Christian culture 1.131Wald test statistic, null hypothesis that ratio of standard deviations = 1 (p-value) .786
Marginal e↵ect of Muslim culture through level -0.095 (0.098)Marginal e↵ect of Muslim culture through variance +0.029 (0.103)
Note: The dependent variable is the probability of receiving a positive callback from the recruiter. Standard errors between parentheses are clustered at the departement level. *, ** and*** indicate statistical significance at the 90%, 95% and 99% confidence levels respectively. Panels A and B control for the length of the job contract (“CDI vs CDD”).
58
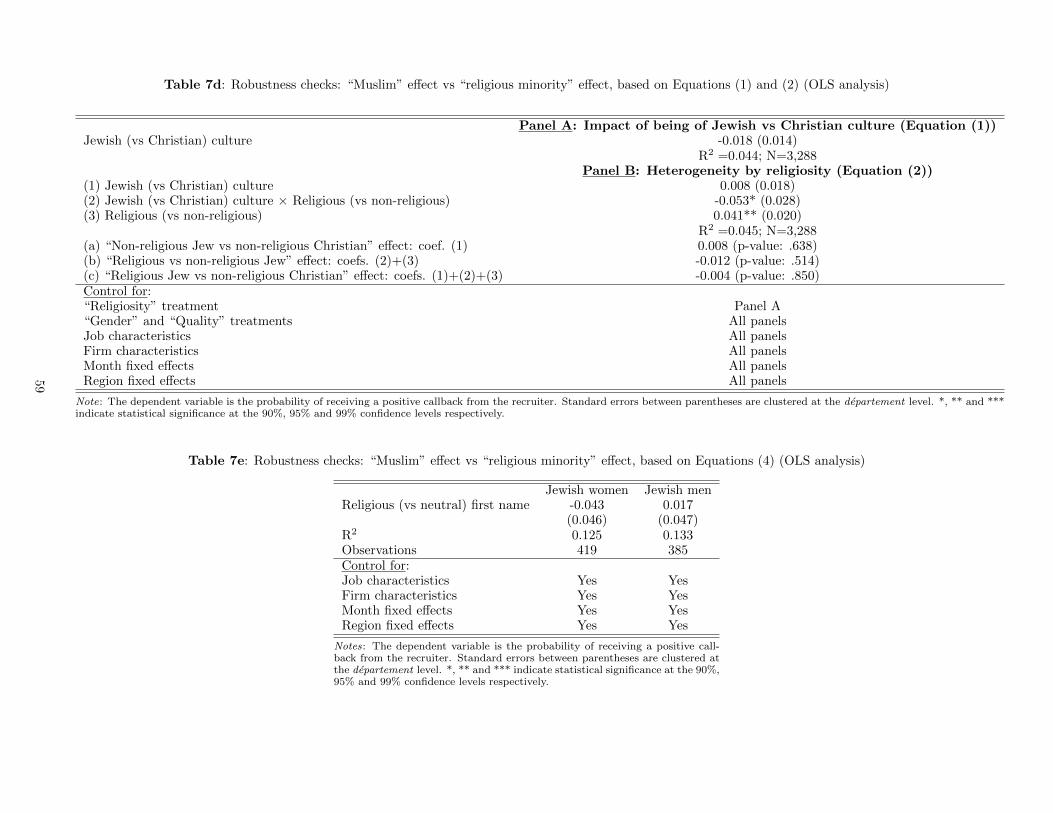
Table 7d: Robustness checks: “Muslim” e↵ect vs “religious minority” e↵ect, based on Equations (1) and (2) (OLS analysis)
Panel A: Impact of being of Jewish vs Christian culture (Equation (1))
Jewish (vs Christian) culture -0.018 (0.014)R2 =0.044; N=3,288
Panel B: Heterogeneity by religiosity (Equation (2))
(1) Jewish (vs Christian) culture 0.008 (0.018)(2) Jewish (vs Christian) culture ⇥ Religious (vs non-religious) -0.053* (0.028)(3) Religious (vs non-religious) 0.041** (0.020)
R2 =0.045; N=3,288(a) “Non-religious Jew vs non-religious Christian” e↵ect: coef. (1) 0.008 (p-value: .638)(b) “Religious vs non-religious Jew” e↵ect: coefs. (2)+(3) -0.012 (p-value: .514)(c) “Religious Jew vs non-religious Christian” e↵ect: coefs. (1)+(2)+(3) -0.004 (p-value: .850)Control for:“Religiosity” treatment Panel A“Gender” and “Quality” treatments All panelsJob characteristics All panelsFirm characteristics All panelsMonth fixed e↵ects All panelsRegion fixed e↵ects All panels
Note: The dependent variable is the probability of receiving a positive callback from the recruiter. Standard errors between parentheses are clustered at the departement level. *, ** and ***indicate statistical significance at the 90%, 95% and 99% confidence levels respectively.
Table 7e: Robustness checks: “Muslim” e↵ect vs “religious minority” e↵ect, based on Equations (4) (OLS analysis)
Jewish women Jewish menReligious (vs neutral) first name -0.043 0.017
(0.046) (0.047)R2 0.125 0.133Observations 419 385Control for:Job characteristics Yes YesFirm characteristics Yes YesMonth fixed e↵ects Yes YesRegion fixed e↵ects Yes Yes
Notes: The dependent variable is the probability of receiving a positive call-back from the recruiter. Standard errors between parentheses are clustered atthe departement level. *, ** and *** indicate statistical significance at the 90%,95% and 99% confidence levels respectively.
59
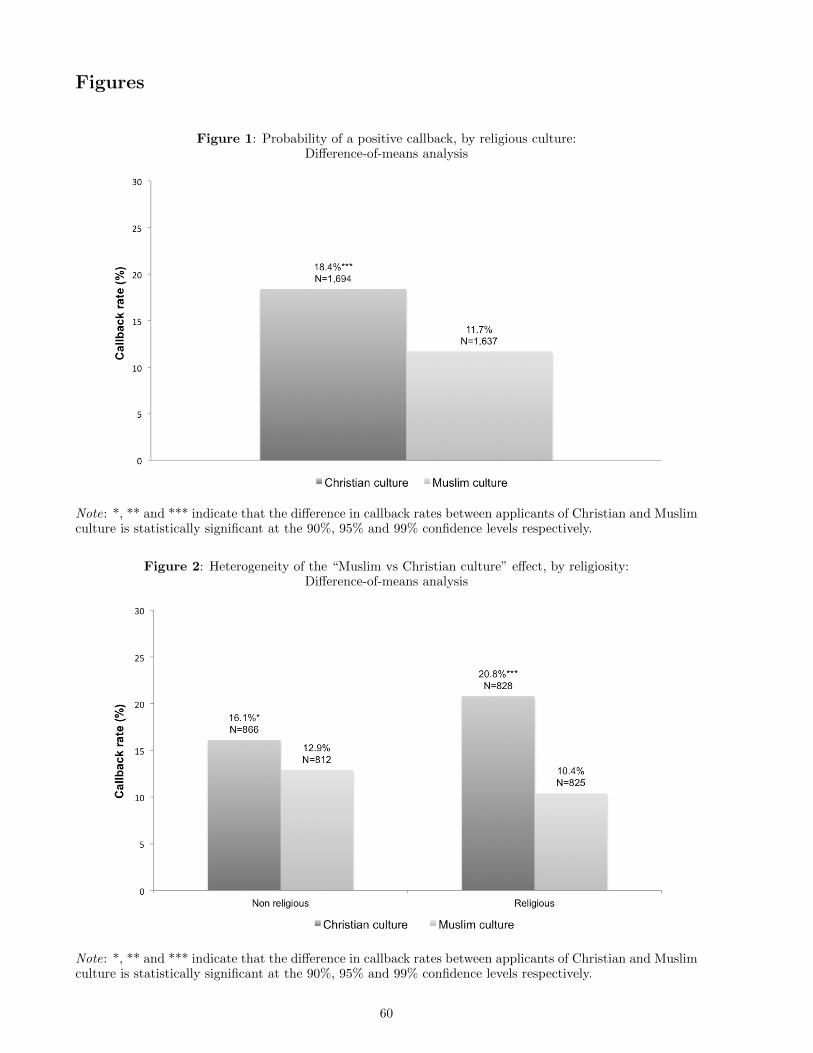
Figures
Figure 1: Probability of a positive callback, by religious culture:Di↵erence-of-means analysis
Note: *, ** and *** indicate that the di↵erence in callback rates between applicants of Christian and Muslimculture is statistically significant at the 90%, 95% and 99% confidence levels respectively.
Figure 2: Heterogeneity of the “Muslim vs Christian culture” e↵ect, by religiosity:Di↵erence-of-means analysis
Note: *, ** and *** indicate that the di↵erence in callback rates between applicants of Christian and Muslimculture is statistically significant at the 90%, 95% and 99% confidence levels respectively.
60

Figure 3: Heterogeneity of the “Muslim vs Christian culture” e↵ect, by gender and religiosity:Di↵erence-of-means analysis
Note: *, ** and *** indicate that the di↵erence in callback rates between applicants of Christian and Muslimculture is statistically significant at the 90%, 95% and 99% confidence levels respectively.
Figure 4: Heterogeneity of the “Muslim vs Christian culture” e↵ect, by quality and religiosity:Di↵erence-of-means analysis
Note: *, ** and *** indicate that the di↵erence in callback rates between applicants of Christian and Muslimculture is statistically significant at the 90%, 95% and 99% confidence levels respectively.
61
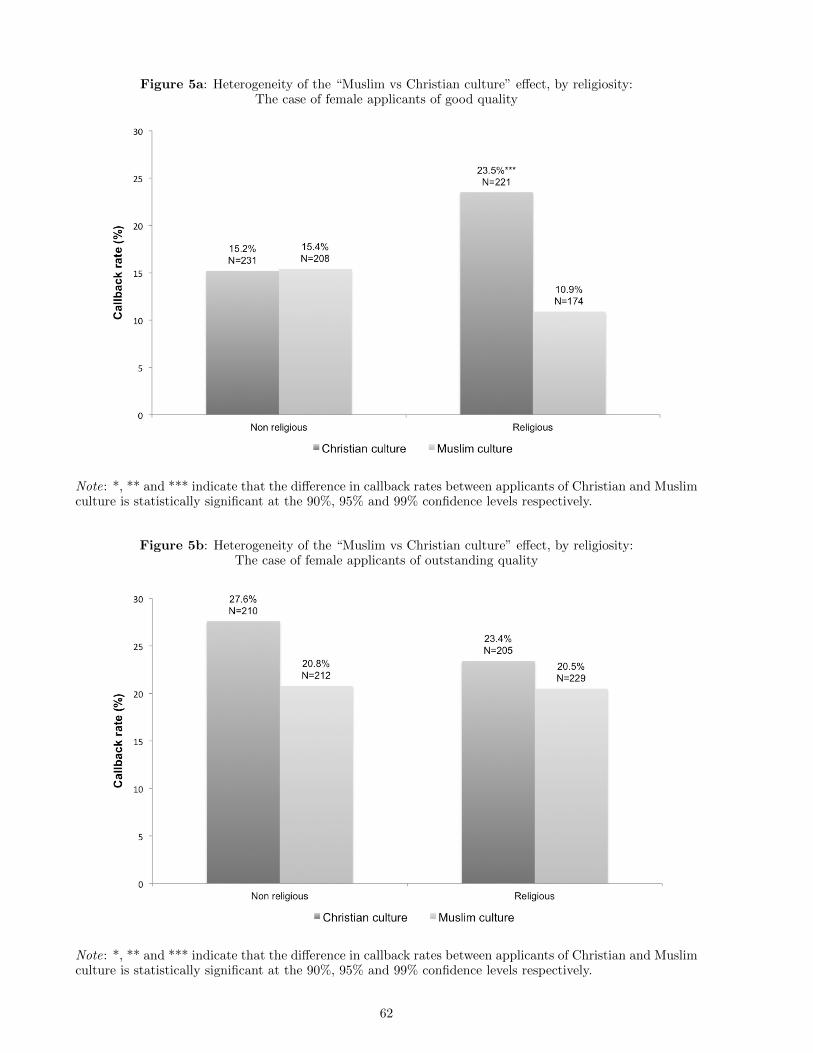
Figure 5a: Heterogeneity of the “Muslim vs Christian culture” e↵ect, by religiosity:The case of female applicants of good quality
Note: *, ** and *** indicate that the di↵erence in callback rates between applicants of Christian and Muslimculture is statistically significant at the 90%, 95% and 99% confidence levels respectively.
Figure 5b: Heterogeneity of the “Muslim vs Christian culture” e↵ect, by religiosity:The case of female applicants of outstanding quality
Note: *, ** and *** indicate that the di↵erence in callback rates between applicants of Christian and Muslimculture is statistically significant at the 90%, 95% and 99% confidence levels respectively.
62

Figure 5c: Heterogeneity of the “Muslim vs Christian culture” e↵ect, by religiosity:The case of male applicants of good quality
Note: *, ** and *** indicate that the di↵erence in callback rates between applicants of Christian and Muslimculture is statistically significant at the 90%, 95% and 99% confidence levels respectively.
Figure 5d: Heterogeneity of the “Muslim vs Christian culture” e↵ect, by religiosity:The case of male applicants of outstanding quality
Note: *, ** and *** indicate that the di↵erence in callback rates between applicants of Christian and Muslimculture is statistically significant at the 90%, 95% and 99% confidence levels respectively.
63
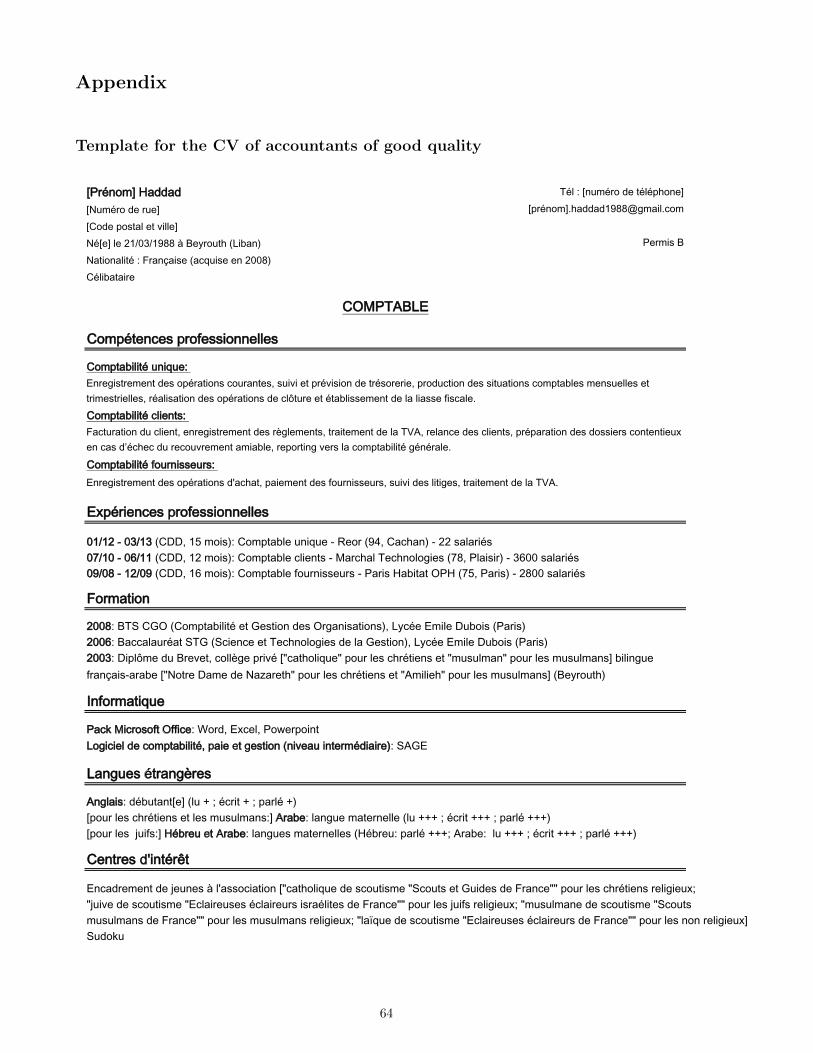
Appendix
Template for the CV of accountants of good quality
!"#$%&'()*+,,+,!-.'$#&),/)#./())))))))))))))))))))))))))))))))))))))))))))))))))))))))))))!0&,/)1&23+4)/3)5644/())))))))))))-$!/()4/)789:;98<==)>)?/@#&.3A)BC6D+%E-+36&%+463$FG)H#+%I+62/)B+JK.62/)/%)7::=E0$46D+3+6#/
0&'13+D6463$).%6K./G)
0&'13+D6463$)J46/%32G)
0&'13+D6463$)L&.#%622/.#2G)
7::=G)?MN)0OP)B0&'13+D6463$)/3)O/236&%),/2)P#Q+%62+36&%2ER)C@J$/)S'64/)T.D&62)B"+#62E
7::;G)T614U'/),.)?#/5/3R)J&44VQ/)1#65$)!WJ+3A&46K./W)1&.#)4/2)JA#$36/%2)/3)W'.2.4'+%W)1&.#)4/2)'.2.4'+%2()D646%Q./L#+%I+62X+#+D/)!W-&3#/)T+'/),/)-+Y+#/3AW)1&.#)4/2)JA#$36/%2)/3)WZ'646/AW)1&.#)4/2)'.2.4'+%2()B?/@#&.3AE
C&Q6J6/4),/)J&'13+D6463$R)1+6/)/3)Q/236&%)B%65/+.)6%3/#'$,6+6#/EG)NZOS
S%J+,#/'/%3),/)[/.%/2)>)4\+22&J6+36&%)!WJ+3A&46K./),/)2J&.362'/)WNJ&.32)/3)O.6,/2),/)H#+%J/WW)1&.#)4/2)JA#$36/%2)#/46Q6/.]^W[.65/),/)2J&.362'/)WSJ4+6#/.2/2)$J4+6#/.#2)62#+$463/2),/)H#+%J/WW)1&.#)4/2)[.6L2)#/46Q6/.]^)W'.2.4'+%/),/)2J&.362'/)WNJ&.32)'.2.4'+%2),/)H#+%J/WW)1&.#)4/2)'.2.4'+%2)#/46Q6/.]^)W4+_K./),/)2J&.362'/)WSJ4+6#/.2/2)$J4+6#/.#2),/)H#+%J/WW)1&.#)4/2)%&%)#/46Q6/.](N.,&`.
0/%3#/2),\6%3$#a3
:b98:)X):c988)B0TTR)87)'&62EG)0&'13+D4/)J46/%32)X)d+#JA+4)M/JA%&4&Q6/2)Bb=R)"4+626#E)X);c::)2+4+#6$2:<9:=)X)879:<)B0TTR)8c)'&62EG)0&'13+D4/)L&.#%622/.#2)X)"+#62)*+D63+3)P"*)BbeR)"+#62E)X)7=::)2+4+#6$2
H&#'+36&%
7::cG)?+JJ+4+.#$+3)NMO)BNJ6/%J/)/3)M/JA%&4&Q6/2),/)4+)O/236&%ER)C@J$/)S'64/)T.D&62)B"+#62E
f%L&#'+36K./
"+J`)d6J#&2&L3)PLL6J/G)g&#,R)S]J/4R)"&h/#1&6%3
C+%Q./2)$3#+%QV#/2
Z%Q4+62G),$D.3+%3!/()B4.)i)^)$J#63)i)^)1+#4$)iE!1&.#)4/2)JA#$36/%2)/3)4/2)'.2.4'+%2G()Z#+D/G)4+%Q./)'+3/#%/44/)B4.)iii)^)$J#63)iii)^)1+#4$)iiiE)!1&.#)4/2))[.6L2G()*$D#/.)/3)Z#+D/G)4+%Q./2)'+3/#%/44/2)B*$D#/.G)1+#4$)iii^)Z#+D/G))4.)iii)^)$J#63)iii)^)1+#4$)iiiE
H+J3.#+36&%),.)J46/%3R)/%#/Q623#/'/%3),/2)#VQ4/'/%32R)3#+63/'/%3),/)4+)MjZR)#/4+%J/),/2)J46/%32R)1#$1+#+36&%),/2),&226/#2)J&%3/%36/.])/%)J+2),k$JA/J),.)#/J&.5#/'/%3)+'6+D4/R)#/1$%Q)5/#2)4+)J&'13+D6463$)Q$%$#+4/l
S%#/Q623#/'/%3),/2)&1$#+36&%2),\+JA+3R)1+6/'/%3),/2)L&.#%622/.#2R)2.656),/2)4636Q/2R)3#+63/'/%3),/)4+)MjZl
S]1$#6/%J/2)1#&L/226&%%/44/2
:8987)X):;98;)B0TTR)8e)'&62EG)0&'13+D4/).%6K./)X)m/&#)B<nR)0+JA+%E)X)77)2+4+#6$2
M$4)G)!%.'$#&),/)3$4$1A&%/(!1#$%&'(lA+,,+,8<==oQ'+64lJ&'
"/#'62)?
0Pd"MZ?CS
0&'1$3/%J/2)1#&L/226&%%/44/2
S%#/Q623#/'/%3),/2)&1$#+36&%2)J&.#+%3/2R)2.656)/3)1#$5626&%),/)3#$2&#/#6/R)1#&,.J36&%),/2)263.+36&%2)J&'13+D4/2)'/%2./44/2)/3)3#6'/23#6/44/2R)#$+462+36&%),/2)&1$#+36&%2),/)J4U3.#/)/3)$3+D4622/'/%3),/)4+)46+22/)L62J+4/l)
64
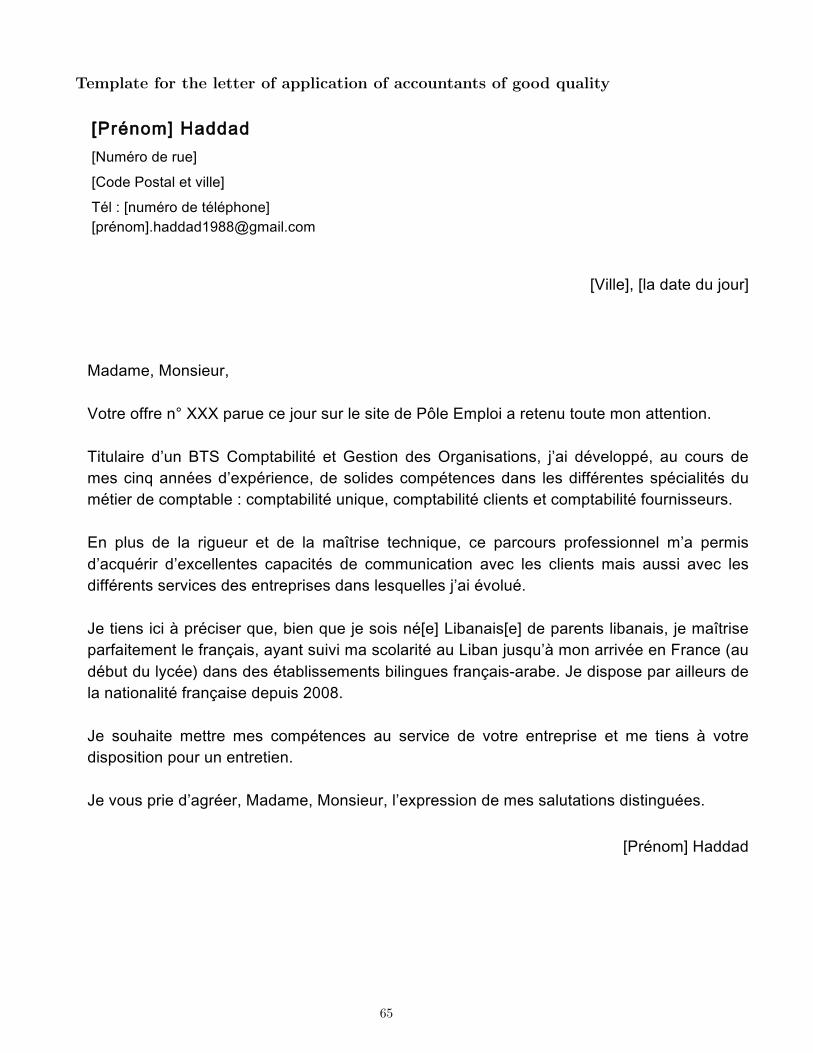
Template for the letter of application of accountants of good quality
!"#$%&'()*+,,+,)!-.'$#&),/)#./()!0&,/)"&12+3)/2)4533/()))))))))))))))))))))))))))))))6$3)7)!%.'$#&),/)2$3$89&%/()!8#$%&'(:9+,,+,;<==>?'+53:@&')
!)))))))))))))))))))))))))))))))))))))))))))))))))))))))))))))!A533/(B)!3+),+2/),.)C&.#()
))
)D+,+'/B)D&%15/.#B))A&2#/)&EE#/)%F)GGG)8+#./)@/)C&.#)1.#)3/)152/),/)"H3/)I'83&5)+)#/2/%.)2&.2/)'&%)+22/%25&%:))652.3+5#/) ,J.%) K6L)0&'82+M5352$) /2)N/125&%) ,/1)O#?+%51+25&%1B) CJ+5) ,$4/3&88$B) +.) @&.#1) ,/)'/1)@5%P)+%%$/1),J/Q8$#5/%@/B),/)1&35,/1)@&'8$2/%@/1),+%1) 3/1),5EE$#/%2/1)18$@5+352$1),.)'$25/#),/)@&'82+M3/)7)@&'82+M5352$).%5P./B)@&'82+M5352$)@35/%21)/2)@&'82+M5352$)E&.#%511/.#1:))I%) 83.1) ,/) 3+) #5?./.#) /2) ,/) 3+) '+R2#51/) 2/@9%5P./B) @/) 8+#@&.#1) 8#&E/115&%%/3) 'J+) 8/#'51),J+@P.$#5#) ,J/Q@/33/%2/1) @+8+@52$1) ,/) @&''.%5@+25&%) +4/@) 3/1) @35/%21) '+51) +.115) +4/@) 3/1),5EE$#/%21)1/#45@/1),/1)/%2#/8#51/1),+%1)3/1P./33/1)CJ+5)$4&3.$:)))S/)25/%1)5@5)T)8#$@51/#)P./B)M5/%)P./)C/)1&51)%$!/()U5M+%+51!/(),/)8+#/%21)35M+%+51B)C/)'+R2#51/)8+#E+52/'/%2)3/)E#+%V+51B)+W+%2)1.545)'+)1@&3+#52$)+.)U5M+%)C.1P.JT)'&%)+##54$/)/%)X#+%@/)Y+.),$M.2),.)3W@$/Z),+%1),/1)$2+M3511/'/%21)M535%?./1)E#+%V+51[+#+M/:)S/),518&1/)8+#)+533/.#1),/)3+)%+25&%+352$)E#+%V+51/),/8.51)\]]=:))S/) 1&.9+52/) '/22#/) '/1) @&'8$2/%@/1) +.) 1/#45@/) ,/) 4&2#/) /%2#/8#51/) /2) '/) 25/%1) T) 4&2#/),518&1525&%)8&.#).%)/%2#/25/%:)))S/)4&.1)8#5/),J+?#$/#B)D+,+'/B)D&%15/.#B)3J/Q8#/115&%),/)'/1)1+3.2+25&%1),5125%?.$/1:)))))))))))))))))))))))))))))))))))))))))))))))))))))))))))))))))))))))))))))))))))))))))))
!"#$%&'()*+,,+,)
65
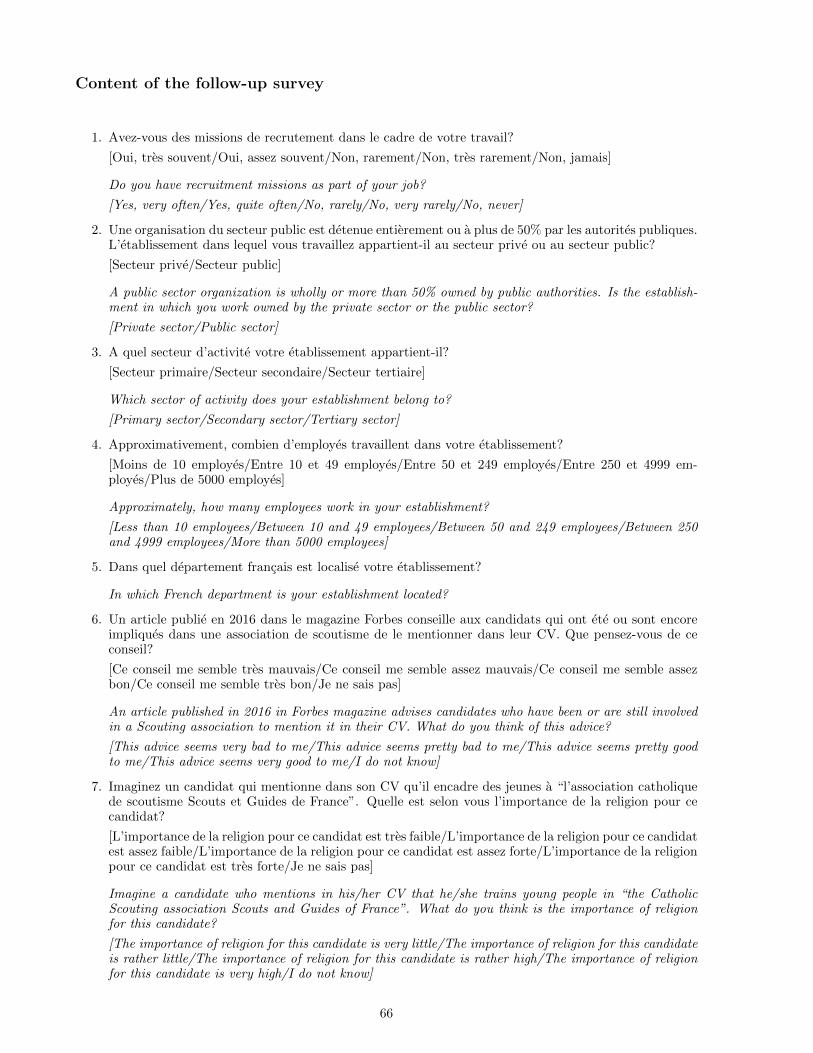
Content of the follow-up survey
1. Avez-vous des missions de recrutement dans le cadre de votre travail?
[Oui, tres souvent/Oui, assez souvent/Non, rarement/Non, tres rarement/Non, jamais]
Do you have recruitment missions as part of your job?
[Yes, very often/Yes, quite often/No, rarely/No, very rarely/No, never]
2. Une organisation du secteur public est detenue entierement ou a plus de 50% par les autorites publiques.L’etablissement dans lequel vous travaillez appartient-il au secteur prive ou au secteur public?
[Secteur prive/Secteur public]
A public sector organization is wholly or more than 50% owned by public authorities. Is the establish-
ment in which you work owned by the private sector or the public sector?
[Private sector/Public sector]
3. A quel secteur d’activite votre etablissement appartient-il?
[Secteur primaire/Secteur secondaire/Secteur tertiaire]
Which sector of activity does your establishment belong to?
[Primary sector/Secondary sector/Tertiary sector]
4. Approximativement, combien d’employes travaillent dans votre etablissement?
[Moins de 10 employes/Entre 10 et 49 employes/Entre 50 et 249 employes/Entre 250 et 4999 em-ployes/Plus de 5000 employes]
Approximately, how many employees work in your establishment?
[Less than 10 employees/Between 10 and 49 employees/Between 50 and 249 employees/Between 250
and 4999 employees/More than 5000 employees]
5. Dans quel departement francais est localise votre etablissement?
In which French department is your establishment located?
6. Un article publie en 2016 dans le magazine Forbes conseille aux candidats qui ont ete ou sont encoreimpliques dans une association de scoutisme de le mentionner dans leur CV. Que pensez-vous de ceconseil?
[Ce conseil me semble tres mauvais/Ce conseil me semble assez mauvais/Ce conseil me semble assezbon/Ce conseil me semble tres bon/Je ne sais pas]
An article published in 2016 in Forbes magazine advises candidates who have been or are still involved
in a Scouting association to mention it in their CV. What do you think of this advice?
[This advice seems very bad to me/This advice seems pretty bad to me/This advice seems pretty good
to me/This advice seems very good to me/I do not know]
7. Imaginez un candidat qui mentionne dans son CV qu’il encadre des jeunes a “l’association catholiquede scoutisme Scouts et Guides de France”. Quelle est selon vous l’importance de la religion pour cecandidat?
[L’importance de la religion pour ce candidat est tres faible/L’importance de la religion pour ce candidatest assez faible/L’importance de la religion pour ce candidat est assez forte/L’importance de la religionpour ce candidat est tres forte/Je ne sais pas]
Imagine a candidate who mentions in his/her CV that he/she trains young people in “the Catholic
Scouting association Scouts and Guides of France”. What do you think is the importance of religion
for this candidate?
[The importance of religion for this candidate is very little/The importance of religion for this candidate
is rather little/The importance of religion for this candidate is rather high/The importance of religion
for this candidate is very high/I do not know]
66
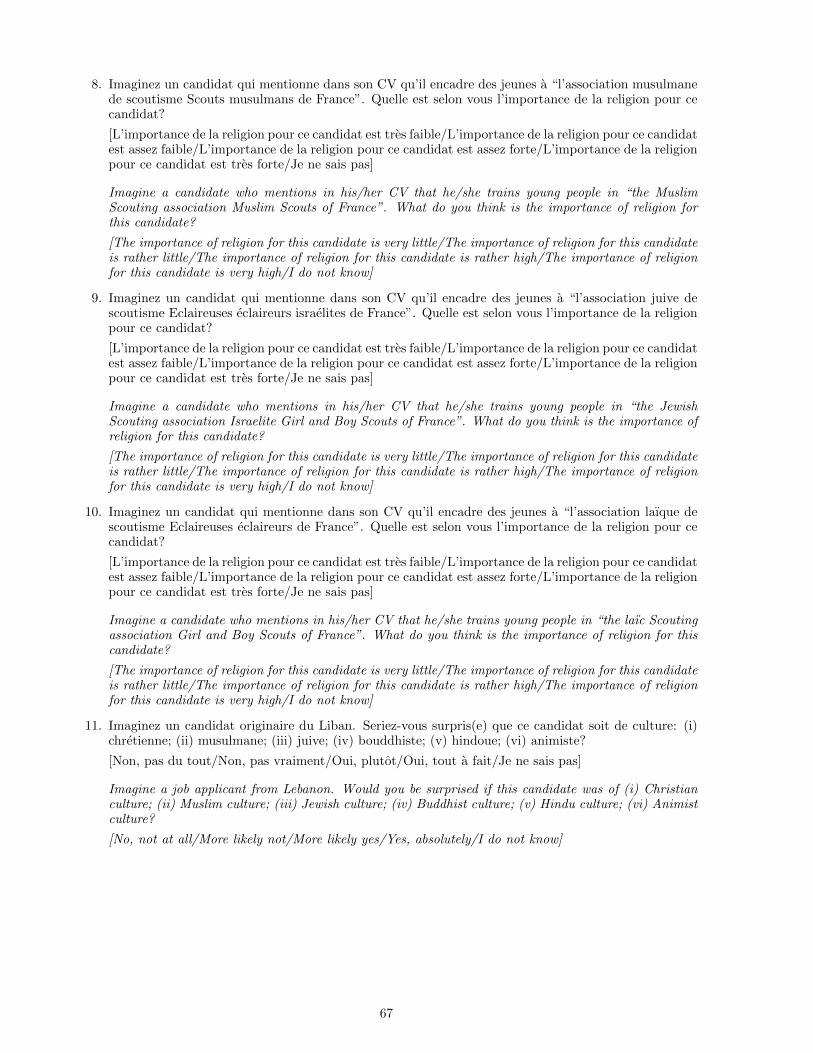
8. Imaginez un candidat qui mentionne dans son CV qu’il encadre des jeunes a “l’association musulmanede scoutisme Scouts musulmans de France”. Quelle est selon vous l’importance de la religion pour cecandidat?
[L’importance de la religion pour ce candidat est tres faible/L’importance de la religion pour ce candidatest assez faible/L’importance de la religion pour ce candidat est assez forte/L’importance de la religionpour ce candidat est tres forte/Je ne sais pas]
Imagine a candidate who mentions in his/her CV that he/she trains young people in “the Muslim
Scouting association Muslim Scouts of France”. What do you think is the importance of religion for
this candidate?
[The importance of religion for this candidate is very little/The importance of religion for this candidate
is rather little/The importance of religion for this candidate is rather high/The importance of religion
for this candidate is very high/I do not know]
9. Imaginez un candidat qui mentionne dans son CV qu’il encadre des jeunes a “l’association juive descoutisme Eclaireuses eclaireurs israelites de France”. Quelle est selon vous l’importance de la religionpour ce candidat?
[L’importance de la religion pour ce candidat est tres faible/L’importance de la religion pour ce candidatest assez faible/L’importance de la religion pour ce candidat est assez forte/L’importance de la religionpour ce candidat est tres forte/Je ne sais pas]
Imagine a candidate who mentions in his/her CV that he/she trains young people in “the Jewish
Scouting association Israelite Girl and Boy Scouts of France”. What do you think is the importance of
religion for this candidate?
[The importance of religion for this candidate is very little/The importance of religion for this candidate
is rather little/The importance of religion for this candidate is rather high/The importance of religion
for this candidate is very high/I do not know]
10. Imaginez un candidat qui mentionne dans son CV qu’il encadre des jeunes a “l’association laıque descoutisme Eclaireuses eclaireurs de France”. Quelle est selon vous l’importance de la religion pour cecandidat?
[L’importance de la religion pour ce candidat est tres faible/L’importance de la religion pour ce candidatest assez faible/L’importance de la religion pour ce candidat est assez forte/L’importance de la religionpour ce candidat est tres forte/Je ne sais pas]
Imagine a candidate who mentions in his/her CV that he/she trains young people in “the laıc Scouting
association Girl and Boy Scouts of France”. What do you think is the importance of religion for this
candidate?
[The importance of religion for this candidate is very little/The importance of religion for this candidate
is rather little/The importance of religion for this candidate is rather high/The importance of religion
for this candidate is very high/I do not know]
11. Imaginez un candidat originaire du Liban. Seriez-vous surpris(e) que ce candidat soit de culture: (i)chretienne; (ii) musulmane; (iii) juive; (iv) bouddhiste; (v) hindoue; (vi) animiste?
[Non, pas du tout/Non, pas vraiment/Oui, plutot/Oui, tout a fait/Je ne sais pas]
Imagine a job applicant from Lebanon. Would you be surprised if this candidate was of (i) Christian
culture; (ii) Muslim culture; (iii) Jewish culture; (iv) Buddhist culture; (v) Hindu culture; (vi) Animist
culture?
[No, not at all/More likely not/More likely yes/Yes, absolutely/I do not know]
67


