
Dialogue DataGrid Motivating Applications
32
-
Upload
len-vincent -
Category
Documents
-
view
24 -
download
0
description
Dialogue DataGrid Motivating Applications. Joel Saltz, MD, PhD Chair Biomedical Informatics College of Medicine The Ohio State University. Dialogue DataGrid. Relational databases, files, XML databases, object stores Strongly typed Multi-tiered metadata management system - PowerPoint PPT Presentation
Transcript of Dialogue DataGrid Motivating Applications


Dialogue DataGridMotivating Applications
Joel Saltz, MD, PhDChair Biomedical Informatics
College of MedicineThe Ohio State University

Dialogue DataGrid
• Relational databases, files, XML databases, object stores
• Strongly typed• Multi-tiered metadata management
system• Incorporates elements from OGSA-DAI,
Mobius, caGrid, STORM, DataCutter, GT4 …
• Scales to very large data, high end platforms

Requirements
• Support or interoperate with caGrid, eScience infrastructure
• Interoperate with or replace SRB• Well defined relationship to Globus
Alliance• Services to support high end large scale
data applications • Design should include semantic metadata
management• Well thought out relationship to
commercial products (e.g. Information Integrator, Oracle)

Motivating Application Class I: Phenotype characterization
• Information heterogeneity, data coordination and data size
• Synthesize information from many high throughput information sources
• Sources can include multiple types of high throughput molecular data and multiple imaging modalities.
• Coordinated efforts at multiple sites
• Detailed understanding of biomedical phenomena will increasingly involve the need to analyze very large high resolution spatio-temporal datasets

Structural Complexity

Example Questions (Phenotypes associated with Rb knockouts)
1. What are the mechanisms of fetal death in mutant mice?
2. What structural changes occur in the placenta?
3. How different are the structural changes between the wild and mutant types?
4. …
Rb-Rb+

Dataset Size: Systems Biology
Future big science animal experiments on cancer, heart disease, pathogen host responseBasic small mouse is 3 cm3
1 μ resolution – very roughly 1013 bytes/mouse
Molecular data (spatial location) multiply by 102
Vary genetic composition, environmental manipulation, systematic mechanisms for varying genetic expression; multiply by 103
Total: 1018 bytes per big science animal experiment

Now: Virtual Slides(roughly 25TB/cm2 tissue)

Compare phenotypes of normal vs Rb deficient mice
Placenta
Slides/Slices Alignment
SegmentationVisualization

Computational Phenotyping Challenges
• Very large datasets• Automated image analysis • Three dimensional reconstruction• Motion• Integration of multiple data sources• Data indexing and retrieval

Large Scale Data Middleware Requirements
• Spatio-temporal datasets• Very large datasets
– Tens of gigabytes to 100+ TB data
• Lots of datasets– Up to thousands of runs for a study are possible
• Data can be stored in distributed collection of files
• Distributed datasets– Data may be captured at multiple locations by multiple groups– Simulations are carried out at multiple sites
• Common operations: subsetting, filtering, interpolations, projections, comparisons, frequency counts

Our Example: Ohio Supercomputing Center Mass Storage
Testbed
D V D
D V D
D V D
D V D
D V D
D V D
MetaData Servers
Core Storage Pool (35/50 TB) with SAN.FS
(4)772 MB/s throughput
(4)772 MB/s throughput
(4)772 MB/s throughput
(4)772 MB/s throughput
SAN Volume Controller(4 servers)
FAStT900 (4)
Backup Storage3584 Tape
1 L32 2 D32Actual: 640 cartridges @ 200
GB for a total of 128 TB4 drives
max drive data rate is 35 MB/s
Cisco Directors 9509
(4)
(2)890 MB/s throughput
(2)890 MB/s Throughput
(2) (2) (2)
(2)
(2) (2)
(16 -
4 per serve
r)
890 MB/s
throughput
Scratch / Archive Storage Pool (310/420 TB)FAStT600 Turbo (20)
LinTel boxes (PvFS/Active Disk Archive) (20)
D V D
D V D
D V D
D V D
D V D
D V D
D V D
D V D
D V D
D V D
D V D
D V D
D V D
D V D
D V D
D V D
D V D
D V D
D V D
D V D
(40 - 2 per T600)384 MB/s throughput
(40 - 2 per xSeries)10 GB/s
• 50 TB of performance storage
– home directories, project storage space, and long-term frequently accessed files.
• 420 TB of performance/capacity storage
– Active Disk Cache - compute jobs that require directly connected storage
– parallel file systems, and scratch space.
– Large temporary holding area
• 128 TB tape library– Backups and long-term
"offline" storage
Very Large Dataset Hardware is Proliferating

STORM Services• Query• Meta-data• Indexing• Data Source• Filtering• Partition
Generation• Data Mover

STORM Results
STORM I/O Performance
0
500
1000
1500
2000
2500
3000
3500
4000
4500
1 2 4 8 16
# XIO nodes
Ban
dw
idth
(M
B/s
)
2 Threads
4 Threads
Max
Seismic Datasets10-25GB per file. About 30-35TB of Data.

Motivating Application II: caBIG In vivo Imaging Workspace
Testbed• Study the effects of image acquisition and reconstruction
parameters (i.e. slice thickness, reconstruction kernel and dose) on CAD and on human ROC. – use multiple datasets and several CAD algorithms to
investigate the relationship between radiation dose and nodule detection ROC.
• Cooperative Group Imaging Study Support– Children’s Oncology Group: quantify whether perfusion
study results add any additional predictive value to the current battery of histopathological and molecular studies
– CALGB: Grid based analysis of PET/CT data to support phase I, II studies
– NTROI: Grid based OMIRAD -- registration, fusion and analysis of MR and Diffusive Optical Tomography (DOT).

CAD Testbed Project RSNA 2005 (joint with Eliot Siegel et al at Univ.
Maryland)• Expose algorithms and data management as Grid Services
• Remote execution of multiple CAD algorithms using multiple image databases
• CAD algorithm validation with larger set of images
• Better research support — recruit from multiple institutions, demographic relationships, outcome management etc.
• Remote CAD execution - reduced data transfer & avoid need to transmit PHI
• CAD compute farms that reduce the turnover time
• Scalable and open source — caBIG standards

Architecture
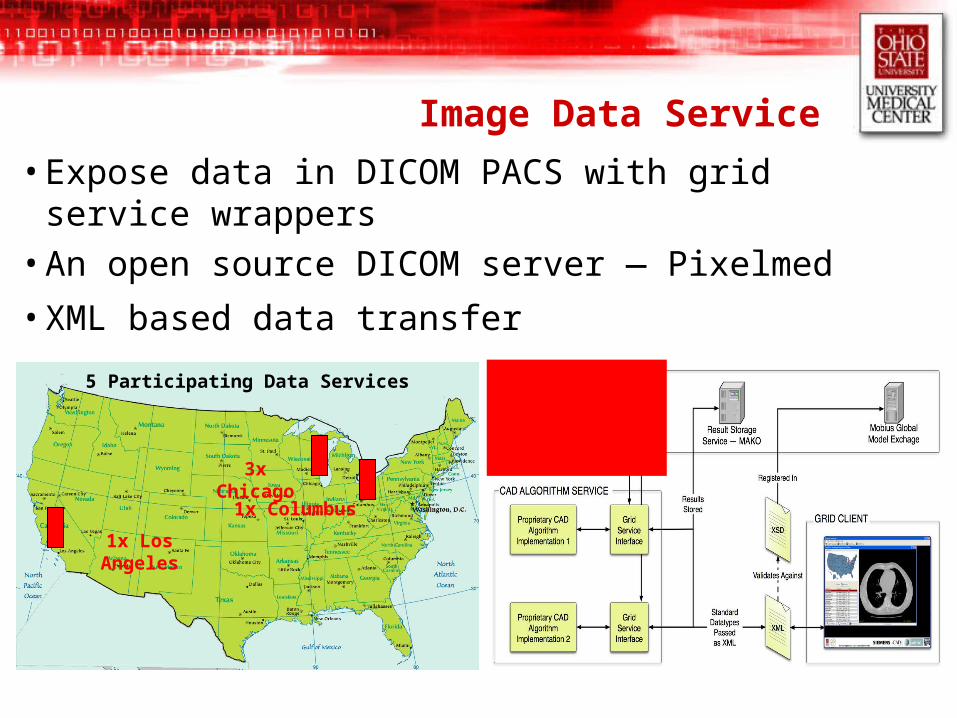
Image Data Service
•Expose data in DICOM PACS with grid service wrappers
•An open source DICOM server — Pixelmed
•XML based data transfer
1x Los Angeles
3x Chicago
1x Columbus
5 Participating Data Services

CAD Algorithm Service• Grid services for algorithm invocation and image retrieval service• caGRID middleware to wrap CAD applications with grid services• Report results to a result storage service
caGrid Introduce facilitates service creation
GUMS/CAMS is used to provide secure data communication and service invocation
CAD algorithms provided by iCAD and Siemens Medical Solutions.Prototypes for investigational use only; not commercially available

Framework Support Services
• Result storage server — A distributed XML database for caching CAD results
• GME — Manage communication and data protocols
16
15
1714
18
5
12
Slice = 127 W/L = 2200/-500
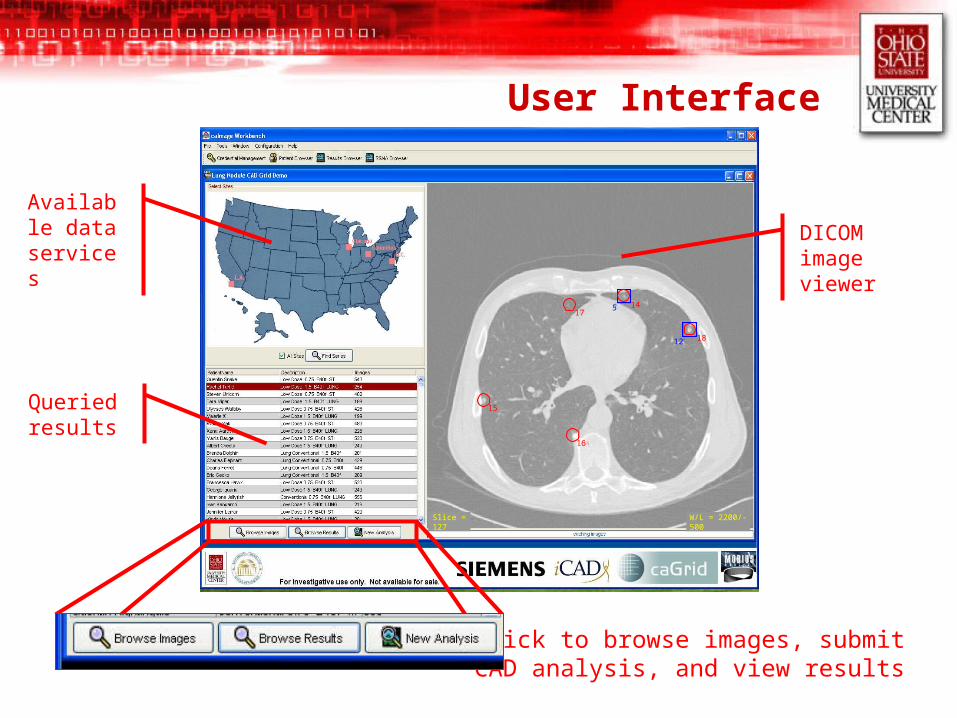
User Interface
Available data services
Queried results
DICOM image viewer
Click to browse images, submit CAD analysis, and view results

Motivating Application III: Integrative Cancer Biology Center
on Epigenetics (PI Tim Huang, OSU)
• TGFβ/Smad4 targets are regulated via epigenetic mechanisms. Promoter hypermethylation is a hallmark of this epigenetically mediated silencing. In this study, we have combined both chromatin immunoprecipitation microarray (ChIP-chip) and differential methylation hybridization (DMH) to investigate this epigenetic mechanism in ovarian cancer

Translating a goal into workflow
Construct KbTSMAD(Knowledgebase of the
TGF-B/SMAD signaling pathway)
Chip-on-chip Experiment DMH Experiment
Data Mining(ex: clustering
Description of Experiment
Description of Experiment
KbTSMAD
DMH Results(Microarray
Data)
Chip-chip Results(Microarray data)
Normilization with statistical tools
Data Collection-Genome-UCSC Genome -BLAT alignment
Literature Survey- Experimentally verified TGF-B target genes- Housekeeping Genes
Chip design
Custom chip design info (e.g. from Agilent)
Candidate cutting Enzyme Information
Clinical data
Experimental ResultsFrom Other Groups
Data source A
Data source B and C
Analytical service F
Data source D and E
Data source G
Analytical service I
Analytical service J Data source K
Data source L
Data source H
A
B C D E
G
H
K
L
n1
n2 n3
n4n5
n6
n7
n8
n9
n10
ArrayAnnotator
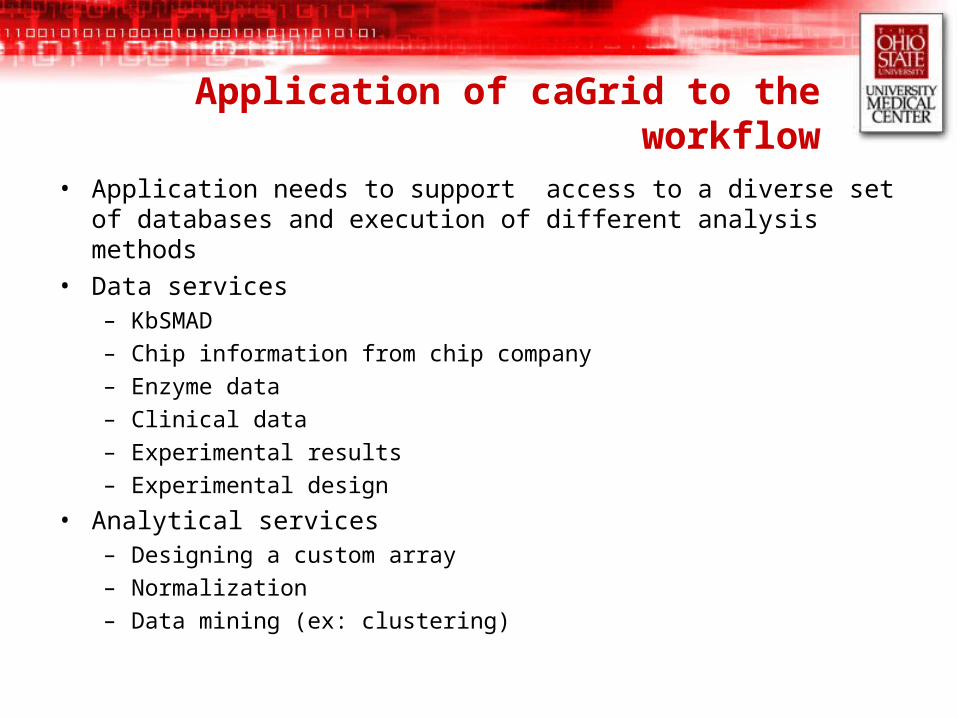
Application of caGrid to the workflow
• Application needs to support access to a diverse set of databases and execution of different analysis methods
• Data services– KbSMAD– Chip information from chip company– Enzyme data– Clinical data– Experimental results– Experimental design
• Analytical services– Designing a custom array– Normalization– Data mining (ex: clustering)

Example: Prototype of Clone Annotation Analytical Service
• Analytical Service: ArrayAnnotator Goal: Provide a annotation for each clone to select a subset of clones
among 400,000 candidate clones to design a custom array for DMH experiment
Clone selection criteria Clones within a promoter region Clones with proper internal and external cuts Clones within CpG island region and/or high CG contents Clones with Transcription Factor binding sites
Input: CloneType information extended sequence, enzyme info, genomic location, etc
Functions• Determine external cut locations around a clone region (e.g., cut-site by
BfaI)• Examine the internal cut around a clone region (e.g., cut-site by HapII,
HinpII, and MCrBc)• Identify the location of clone in genome• Show ether it is within promoter region or not• Calculate CG content and overlapping with CpG islands• Identify which Transcription Factor binding sites are overlapped with clones

Chip design application
Clone InfoData Services
Genome SequenceData Source
Annotation Analytical ServiceQ
uer
y (g
eneI
d)
Query
Example caGrid Usage in P50 chip design application
21
3
5
4
Res
ult
: L
ist
of c
lon
es
Result: extended genome sequence of clone
6
Request (cloneInfo)
Result: annotation (CpG, cutsite, promoter region, etc)

ArrayAnnotator output (Hao Sun, Ramana Davuluri)

Multiscale Laboratory Research Group
Ohio State UniversityJoel SaltzGagan AgrawalUmit CatalyurekDan CowdenMike GrayTahsin KurcShannon HastingsSteve LangellaScott OsterTony PanDK PandaSrini Parthasarathy
P. SadayappanSivaramakrishnan (K2)Michael Zhang
The Ohio Supercomputer Center
Stan AhaltJason BryanDennis SessannaDon StredneyPete Wycoff

Microscopy Image Analysis
• Biomedical Informatics– Tony Pan– Alexandra Gulacy – Dr. Metin Gurcan– Dr. Ashish Sharma– Dr. Kun Huang– Dr. Joel Saltz
• Computer Science and Engineering– Kishore Mosaliganti– Randall Ridgway– Richard Sharp
● Pathology–Dr. Dan Cowden
● Human Cancer Genetics
–Pamela Wenzel–Dr. Gustavo Leone–Dr. Alain deBruin

caGrid Team
• National Cancer Institute– Peter Covitz – Krishnakant
Shanbhag
• Ohio State University– Shannon Hastings – Tahsin Kurc– Stephen Langella – Scott Oster – Joel Saltz
• SAIC– Tara Akhavan– Manav Kher – William Sanchez – Ruowei Wu – Jijin Yan
• Booze | Allen | Hamilton– Manisundaram Arumani
• Panther Informatics Inc.– Nick Encina– Brian Gilman

Tony Pan, Stephen Langella, Shannon Hastings, Scott Oster, Ashish Sharma, Metin Gurcan, Tahsin
Kurc, Joel SaltzDepartment of Biomedical Informatics
The Ohio State University Medical Center, Columbus OH
Eliot Siegel, Khan M. SiddiquiUniversity of Maryland School of Medicine, Baltimore, MD
Thanks to Siemens, ICAD for supplying CAD algorithms
RSNA 2005 Team


![Datagrid: Infraestructura de computación en malla para ...52.0.140.184/typo43/fileadmin/Revista_99/Tres.pdf60 Sistemas DataGrid: un grid orientado a datos El proyecto DataGrid [6]](https://static.fdocuments.net/doc/165x107/5e0da9233f14eb44dd370690/datagrid-infraestructura-de-computacin-en-malla-para-520140184typo43fileadminrevista99trespdf60.jpg)