
Diagnostics of the AML with immunophenotypical datamath.univ-lyon1.fr/~pujo/AcrC9.tmp.pdf · A....
19
Math. Model. Nat. Phenom. Vol. 2, No. 1, 2008, pp. 104-123 Diagnostics of the AML with immunophenotypical data A. Plesa a , G. Ciuperca b V. Louvet b , L. Pujo-Menjouet b 1 S. G´ enieys b , C. Dumontet a X. Thomas a and V. Volpert b a Service d’H´ ematologie clinique, Hospices Civils de Lyon, 69003 Lyon, France b Universit´ e de Lyon, Universit´ e Lyon1, CNRS UMR 5208 Institut Camille Jordan F - 69200 Villeurbanne Cedex, France Abstract. Patients with acute myeloblastic leukemia (AML) are divided according to the French American British (FAB) classification into eight subgroups (M0 to M7) on the basis of their degree of maturation/differentiation. However, even if immunophenotypical characterization by flow cy- tometry is routinely used to distinguish between AML and acute lymphoblastic leukemia (ALL), it is not yet well established for the identification within the AML subgroups. Here we show that cer- tain subgroups of AML can be identified with a good accuracy (80% of the patients we analyzed) by means of the expression of specific markers. Key words: acute myeloblastic leukemia, diagnostic, FAB classification , cell markers, mathemat- ical modelling. AMS subject classification: 62-07, 62P10, 92B15, 92B05 1. Introduction We analyze here the immunophenotypical data obtained with flow cytometry in a group of 213 patients diagnosed with acute myeloblastic leukemia (AML). The diagnosis of this disease is cur- rently established on the basis of cytomorphological analysis accordingly to the French-American- British (FAB) classification, and supported by enzymatic measurements. Immunophenotyping 1 Corresponding author. E-mail: [email protected] 104
Transcript of Diagnostics of the AML with immunophenotypical datamath.univ-lyon1.fr/~pujo/AcrC9.tmp.pdf · A....
Math. Model. Nat. Phenom.Vol. 2, No. 1, 2008, pp. 104-123
Diagnostics of the AML with immunophenotypical data
A. Plesaa, G. Ciupercab
V. Louvetb, L. Pujo-Menjouetb 1
S. Genieysb, C. DumontetaX. Thomasa and V. Volpertb
a Service d’Hematologie clinique, Hospices Civils de Lyon,69003 Lyon, France
b Universite de Lyon, Universite Lyon1, CNRS UMR 5208 Institut Camille JordanF - 69200 Villeurbanne Cedex, France
Abstract. Patients with acute myeloblastic leukemia (AML) are divided according to the FrenchAmerican British (FAB) classification into eight subgroups (M0 to M7) on the basis of their degreeof maturation/differentiation. However, even if immunophenotypical characterization by flow cy-tometry is routinely used to distinguish between AML and acute lymphoblastic leukemia (ALL), itis not yet well established for the identification within the AML subgroups. Here we show that cer-tain subgroups of AML can be identified with a good accuracy (80% of the patients we analyzed)by means of the expression of specific markers.
Key words: acute myeloblastic leukemia, diagnostic, FAB classification , cell markers, mathemat-ical modelling.AMS subject classification: 62-07, 62P10, 92B15, 92B05
1. IntroductionWe analyze here the immunophenotypical data obtained with flow cytometry in a group of 213patients diagnosed with acute myeloblastic leukemia (AML). The diagnosis of this disease is cur-rently established on the basis of cytomorphological analysis accordingly to the French-American-British (FAB) classification, and supported by enzymatic measurements. Immunophenotyping
1Corresponding author. E-mail: [email protected]
104

A. Plesa et al. Diagnostics of the AML
is routinely used to distinguish acute lymphoblastic leukemia (ALL) from acute myeloblasticleukemia (AML)([9], [10]). This is done by using markers common to AML (CD13, CD33,MPO, CD117, CD65) or to ALL. Some correlations between immunophenotyping and diagno-sis and prognosis are discussed in [4] and [6]. Flow cytometry is used in [5] and [2] to characterizeleukemic blast cells. Our objective is to determine a possible correlation between the FAB classi-fication and the immunophenotypic profiles. Indeed, from the best of our knowledge, we realizedthat despite numerous reports devoted to this question, there has been no consensus yet regardinga standardized immunophenotypic profile of AML subgroups. Consequently, it appears naturalto us to suggest here as a first step a simple approach which allows a rather specific identifica-tion of the FAB subgroups by means of expression of certain markers which corresponds to thehematopoietic lineages. The markers used in the immunophenotypical analysis are the follow-ing: CD2, CD4, CD5, CD7, CD9, CD10, CD19 (lymphoid lineage), CD13, CD15, CD33, CD34,CD36, CD41, CD65, CD11c (myeloid lineage), cytoplasmicCD3, CD11b, CD13c, CD14, cyto-plasmicCD22, MPO, TdTc, CD4, CD5, CD38, CD56, cytoCD79a, CD117, HLA-DR (not lineagespecific). Expression of each marker is characterized by the percentage of cells expressing thismarker with the fluorescence level exceeding a background threshold, determined with an isotypecontrol. Therefore each patient is characterized by 30 numbers from 0 to 100 which correspond tothe expression of these 30 markers. Hence we need to analyze the set of 213 points correspondingto the number of patients in the 30-dimensional space and to find some subdomains of this spacethat could correspond to the subgroups M0 to M7 of the FAB classification.
Statistical studies using a cluster analysis as well as a specific software to analyze the datain the 30-dimensional space have been carried out (data not shown here). It came out that thedata analysis was quite efficient for some aspects (to predict survival or relapse of a patient forinstance), but not accurate enough to give a clear idea of the importance of the role of each markerfor each type of leukemia. We develop here another approach which suggests a simple algorithmof identification of some groups of patients in accordance with the FAB classification.
2. CD36-34 immunophenotypical classificationAs indicated above, each patient has been characterized by the expression of 30 markers. The con-ventional approach to analyze these data consists in the introduction of positive or negative expres-sions of the markers, which are greater or less than some (arbitrarily) given value. This thresholdcould be for example 20% in accordance with the EGIL (European Group for Immunophenotypingof Leukemias) criteria (see [3]). After this process, patients are divided into subgroups accordinglyto positive or negative expressions of some markers. In this work we do not impose a priori criticalvalues of expression of the markers. And so we consider all their actual values between 0 and100%. Therefore we consider a set of points in the 30-dimensional space where the coordinates ofthese points are expressions of the corresponding markers. As specified above, this set of pointscan be characterized with cluster analysis. This means that it can be divided into a relatively smallnumber of subsets separated from each other by maximal distance. Some statistical software al-lows the determination of the optimal number of clusters. In the ideal case we could expect that
105

A. Plesa et al. Diagnostics of the AML
the clusters are clearly identified and that each of them corresponds to some of the FAB subgroups.However, this is not what happens in a concrete way. The clusters are not clearly identified andthey do not correspond to the FAB classification. And in fact, the very idea of cluster analysis canbe rather restrictive. We can easily imagine the situation where two sets of points are separated notby space distance but by some other criteria. More particularly, the expression of a marker that canbe greater or less than some given value will divide a set of points into two subsets. This can becompletely independent of the existence and the structure of clusters. At the same time, in somecases clusters can be clearly identified.
At this point, it is also important to specify that we apply our analysis not to all markers atthe same time or to some groups of markers but consecutively to one marker after another. Theadvantage of this approach is that we can apply different markers and different criteria for differentsubgroups of patients which is in some sense an adapting method. Thanks to the methods describedabove, we are able to characterize the FAB subclasses by immunophenotypical analysis. We baseour investigations on the antigenic analysis of hematopoietic lineage in normal hematopoiesis. Thisanalysis has been developed in the past decades and is well known in normal blood formation [7],[8] (see figure 1 based on the work done by Loken et al. in [8]).
CD 11b
HLA-DR
MO
NOBLASTS
PROM
ONO
CYTES
MO
NOCYTES
MACRO
PHAGES
CD 45
Monocytoid Maturation
AN
TIG
EN
D
EN
SIT
Y
CD 34
10
CD 14
CD 13
10
10
1
2
3 CD 33
Erythroid Maturation
AN
TIG
EN
D
EN
SIT
Y
PROERYTHRO
BLAST
ERYTHROBLAST
RETICULO
CYTES
10
10
10
1
2
3
ERYTHROCYTES
CD 45
Glycophorin
CD 71
En
ucl
ea
tio
n
CD 11b
HLA-DR
MYELO
BLASTS
PROM
YELOCYTES
MYELO
CYTES
META
MYRLO
CYTES
CD 45
Neutrophil Maturation
AN
TIG
EN
D
EN
SIT
Y
CD 34
10
CD 16
CD 13
10
10
1
2
3
CD 33
MATURE
NEUTROPHIL
S
CD 15
Figure 1: Schematic diagrams of lineage specific development. Fig.1a: Schematic diagram ofmonocytoid development. Fig 1b: Neutrophil maturation. Fig 1c: Erythroid maturation. Eachstages of maturation can be defined based on the expression of multiple myeloid markers on thesecells in the bone marrow. These figures are based on the work of Loken et al.
106

A. Plesa et al. Diagnostics of the AML
Our approach is based on the difference in the expressions of antigens for different cell lineages(see figure 1).
Let us start with CD36. In normal hematopoiesis this marker is not expressed by the myeloidlineage (also called L0 lineage) (see figure 2). This lineage consists of the undifferentiated cells,the myeloid progenitor cell (MPC) and the myelo-monocytic progenitor cell (MMPC). It is not ex-pressed in the lineage-comitted cells (also called L2 lineage) that consists of myeloblasts, promye-locyte, myelocyte and granulocyte cells (see figure 2). However, it is expressed in the other threelineages, L1 (monoblast, promonocyte, monocyte, macrophage), L3 (proerythroblast, erythrob-last, reticulocyte, erythrocyte), L4 (immature megakaryoblast, megakaryoblast, megakaryocyte,platelets). Thus, in the ”normal” bone marrow, expression of CD36 distinguishes L0 (MPC,MMPC) and L2 from L1, L3, L4. We first consider the patients M0-M5 of the FAB classifica-
MYELOID PROGENITOR
CELL
MYELOID - MONOCYTIC
PROGENITOR CELL
MONOBLAST PROMONOCYTE MONOCYTE MACROPHAGES
MYELOBLAST PROMYELOCYTE MYELOCYTE GRANULOCYTE
PROERYTHROBLAST ERYTHROBLAST RETICULOCYTE ERYTHROCYTE
IMMATURE
MEGACARYOBLASTMEGAKARYOBLAST MEGAKARYOCYTE PLATELETS
M1
M0
M2 M3 CML CML
M6
M7
THLTHLM5M4CD 13, CD 33, CDw65, HLA-DR
MPO
(CD 11c, CD 14, CD 15)
CD 33, CD34, HLA-DR
(CD 13, TdT)
CD 11c, CD13, CD14
CD 33, CD 34, CD 36
CDw65, HLA-DR
MPO
CD 11c, CD13, CD14
CD 33, CD 36
CDw65, HLA-DR
MPO
CD 11c, CD13, CD14
CD 33, CD 36
CDw65, HLA-DR
MPO (CD 4)
CD11c,(CD 13), CD14, (CD15), (CD 33),(CD 36)
CD 45RO, CD 45 RB
HLA-DR, (MPO)
CD 13, CD15
CD 33, CDw65,
MPO (HLA-DR)
CD 13, (CD15)
CD 33, CDw65,
MPO
CD 13, CD15
CD 33, CDw65,
CD 67 MPO
(HLA-DR)
CD 13, CD15
CD 16, CDw65,
CD 67 MPO
CD 36
H antigen
(CD 235 a)
CD 36
H antigen
CD 235 a
H antigen
CD 235 aH antigen
CD 235 a
CD 33, CD 34,
CD 36, CD 41,
CD 42, CD 61
HLA-DR
(CD 9), CD 34,
CD 36, CD 41,
(CD 42), CD 61
HLA-DR
CD 9, CD 36,
CD 41, CD 42,
CD 61
CD 9, CD 36,
CD 41, CD 42,
CD 61
Figure 2: Myeloid cell differentiation - Schematic figure of myeloid differentiation including thecorresponding leukemia and non-Hodgkin lymphomas as well as cell markers involved in eachstage.
tion. They represent 171 patients out of 213. We split them into three subgroups M0-M1, M2-M3,M4-M5 accordingly with the lineages of the normal hematopoiesis. Figure 3 shows these threegroups on the CD34-CD36 plane. We can identify three main regions on this plane:
1. CD34<20%, CD36 < 35% (left lower corner (I)). There are 63 patients in the first region:25 M0-M1 cases, 26 M2-M3 cases, 12 M4-M5 cases,
2. CD34 > 70%, CD36< 20% (right lower corner (II)): 24 patients (19 M0-M1, 2 M2-M3, 3M4-M5),
3. remaining part of the plane (III) : 84 patients (14 M0-M1, 9 M2-M3, 61 M4-M5).The first domain (I) contains all three groups of patients. We split it into two subdomains with theexpression of CD36 more than 20% and less than 20%. The first subdomain contains 12 patients:
107

A. Plesa et al. Diagnostics of the AML
8 cases M2-M3 and 3 cases M4-M5. It can be identified with the M2-M3 diagnostics of the FABclassification. We will see below that there are in fact only M2 cases. In the second domain there
0 10 20 30 40 50 60 70 80 90 1000
10
20
30
40
50
60
70
80
90
100
CD34
CD36
* M0−M1 * M2−M3 * M4−M5
III
III
I
III
Figure 3: Subgroups M0-M1 (red), M2-M3 (green), M4-M5 (blue) of the FAB classification onthe CD34-CD36 plane.
are all three groups of patients without a clear preference to one of them. In the next section wewill use additional markers to distinguish them.
The second domain (II) contains basically M0-M1 patients (79%) while the third domain (III)basically M4-M5 patients (73%). It can be also useful to split the third domain in two subdomains:with CD36 greater than 35% and less than 35%. The first subdomain contains 37 M4-M5 casesfrom 44 (84%) and can be identified with this diagnostics. There are more M0-M1 and M2-M3cases in the second subdomain. We will discuss below how to distinguish them with additionalmarkers.
Thus, M0-M1 patients are basically in the first and second domain. The second domain withhigh expression of CD34 and small expression of CD36 corresponds to the L0 lineage of the normalhematopoiesis. In the first subdomain, where the expression of CD34 is also small correspondsto the beginning of cell maturation in the direction of L1 and L2 lineages where its expressiondecreases. M2-M3 cases are basically located in the first domain with low expressions of CD34and CD36 as it is the case at the L2 lineage for the normal hematopoiesis. There are also someM2-M3 cases with a greater expression of CD34 (lower subdomain of the third domain) whichcorresponds to a partial cell differentiation in the direction of this lineage. Finally, M4-M5 casesare basically located in the third domain with a partial overlapping with the first and the seconddomains.
The splitting of all M0-M5 patients into three subgroups corresponds to the hematopoietic lin-
108

A. Plesa et al. Diagnostics of the AML
eages and simplifies the representation. M6 and M7 subgroups will be discussed below. Here webriefly discuss how to distinguish M0 and M1, M2 and M3, M4 and M5 inside each subgroup.Figure 4 shows all M0 and M1 patients on the CD34 - HLA-DR plane. M0 cases are basically
0 10 20 30 40 50 60 70 80 90 1000
10
20
30
40
50
60
70
80
90
100
CD 34
Hla
−d
r
* M0 * M1
010
2030
4050
6070
8090
100
0
10
20
30
40
50
60
70
80
0
20
40
60
80
100
CD 34
CD 36
Hla
−d
r
* M0 * M1
Figure 4: Subgroups M0 (red) and M1 (green) on the CD34 - HLA-DR plane (top) and on theCD34 - CD 36 - HLA-DR (bottom).
located at the right upper corner where the expression of both markers is high. There is an interme-diate region where there are less M0 cases, and finally the lower left corner where there are onlyM1 cases. This corresponds to the decrease in the expression of both markers in the process of cellmaturation. It is interesting to note that the center region contains only few points. This meansthat the maturation occurs consecutively, first CD34 decreases, then HLA-DR or vice versa but notboth at the same time.
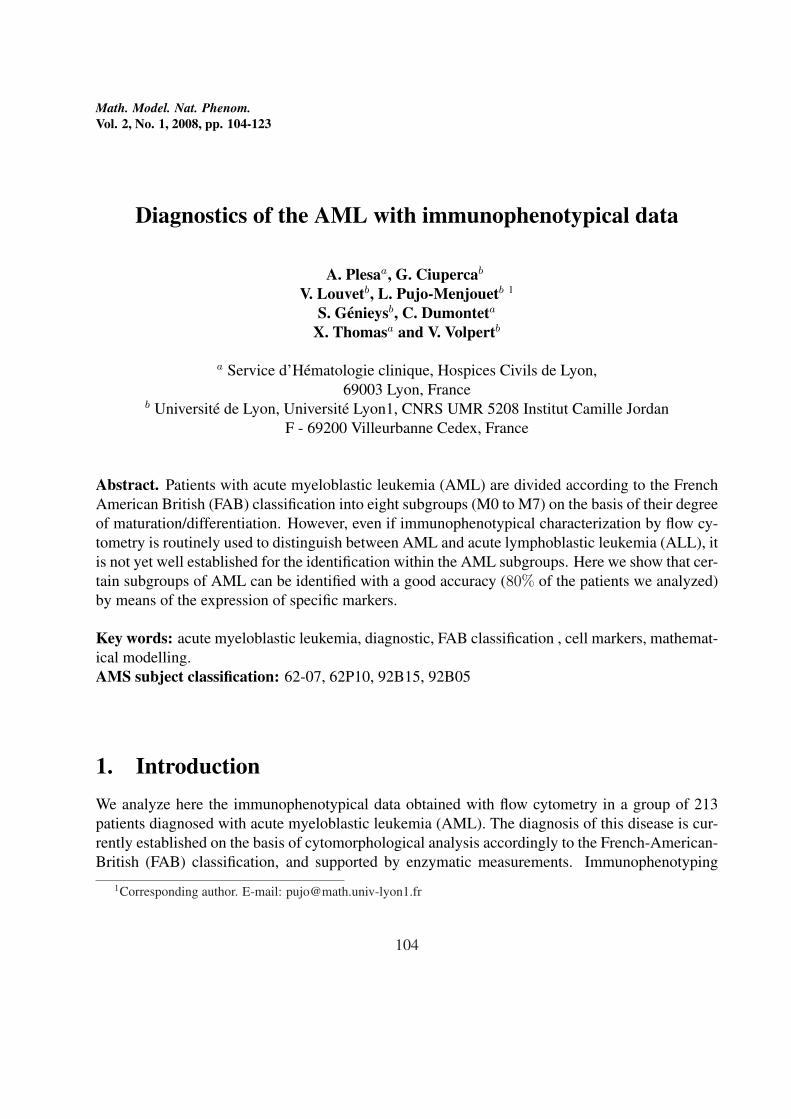
Consider next M2 and M3 cases (figure 5). Most of M3 cases are in the lower left corner whileM2 cases are distributed all over the plane. There are two M3 cases for larger values of CD36.
109
A. Plesa et al. Diagnostics of the AML
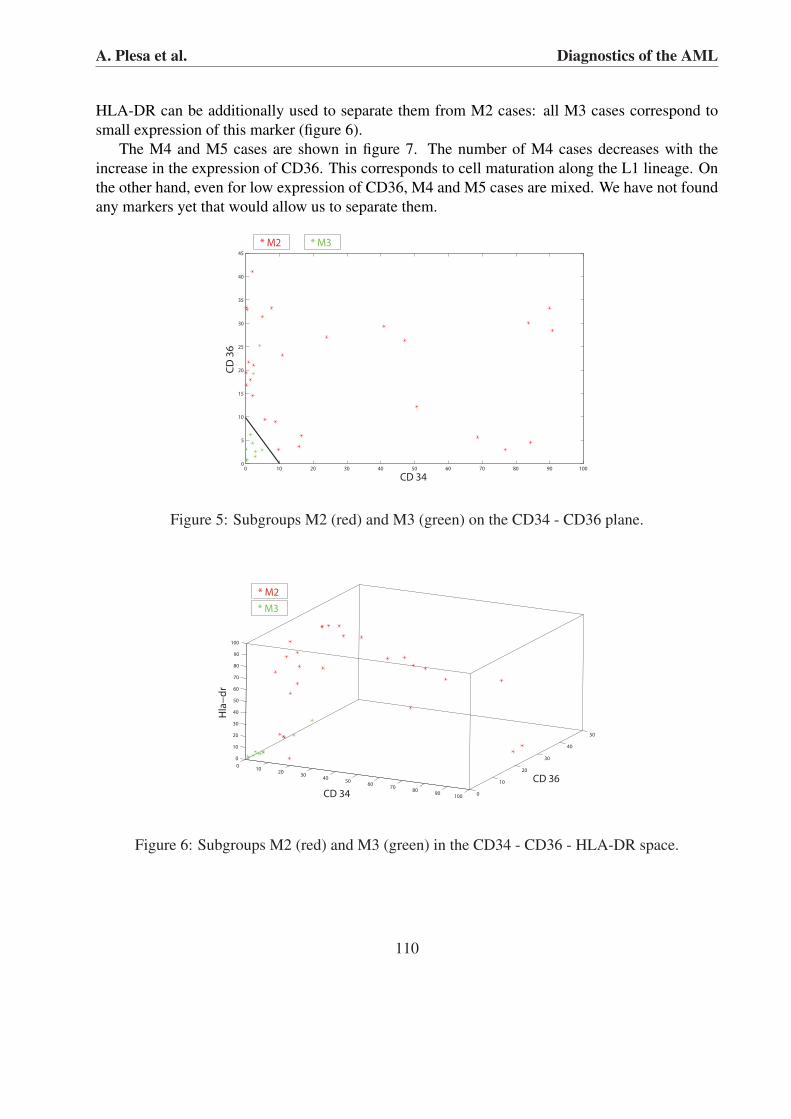
HLA-DR can be additionally used to separate them from M2 cases: all M3 cases correspond tosmall expression of this marker (figure 6).
The M4 and M5 cases are shown in figure 7. The number of M4 cases decreases with theincrease in the expression of CD36. This corresponds to cell maturation along the L1 lineage. Onthe other hand, even for low expression of CD36, M4 and M5 cases are mixed. We have not foundany markers yet that would allow us to separate them.
0 10 20 30 40 50 60 70 80 90 1000
5
10
15
20
25
30
35
40
45
CD 34
CD
36
* M2 * M3
Figure 5: Subgroups M2 (red) and M3 (green) on the CD34 - CD36 plane.
010
2030
4050
6070
8090
1000
10
20
30
40
50
0
10
20
30
40
50
60
70
80
90
100
CD 36
CD 34
Hla
−d
r
* M2
* M3
Figure 6: Subgroups M2 (red) and M3 (green) in the CD34 - CD36 - HLA-DR space.
110

A. Plesa et al. Diagnostics of the AML
0 10 20 30 40 50 60 70 80 90 1000
10
20
30
40
50
60
70
80
90
100
CD 34
CD
36
* M4 * M5
Figure 7: Subgroups M4 (red) and M5 (green) on the CD34 - CD36 plane.
3. CD34 < 20, CD36 < 20In this section we consider patients with the expression of CD34 and of CD36 less than 20%.There are 63 M0-M5 cases: 25 cases M0-M1, 26 cases M1-M2 and 12 cases M5-M6. Figure
0 2 4 6 8 10 12 14 16 18 200
10
20
30
40
50
60
70
80
90
100
CD 36
Hla
−d
r
*M0−M1 *M2−M3 *M4−M5
Figure 8: Subgroups M0-M1 (red), M2-M3 (green), M4-M5 (blue) on the CD36 - HLA-DR plane.
8 shows all three subgroups on the CD36 - HLA-DR plane. For HLA-DR < 6 there are all M3cases (9/9), some M2 cases (3/9), about a half of M0-M1 cases (13/25) and only one M4-5 case(1/10). Consider first the small expression of HLA-DR. Since M2 and M3 cases can be effectivelyseparated, it is sufficient to separate M3 and M0-M1 cases. There is a number of markers that canbe used here, in particular CD9 and CD65 (figure 9). Other markers that separate M0-1(HLA-DR
111

A. Plesa et al. Diagnostics of the AML
< 6) and M3 are:
CD13 < 76 : M0− 1 = 11/13, M3 = 2/9;cytoMPO < 47 : M0− 1 = 9/13, M3 = 3/9;cytoCD13 < 80 : M0− 1 = 12/13, M3 = 2/9.
0 10 20 30 40 50 60 70 80 90 1000
10
20
30
40
50
60
70
80
90
100
CD 65
CD
9
* M0−M1 * M3
Figure 9: Subgroups M0-M1 (red) and M3 (green) on the CD65 - CD9 plane.
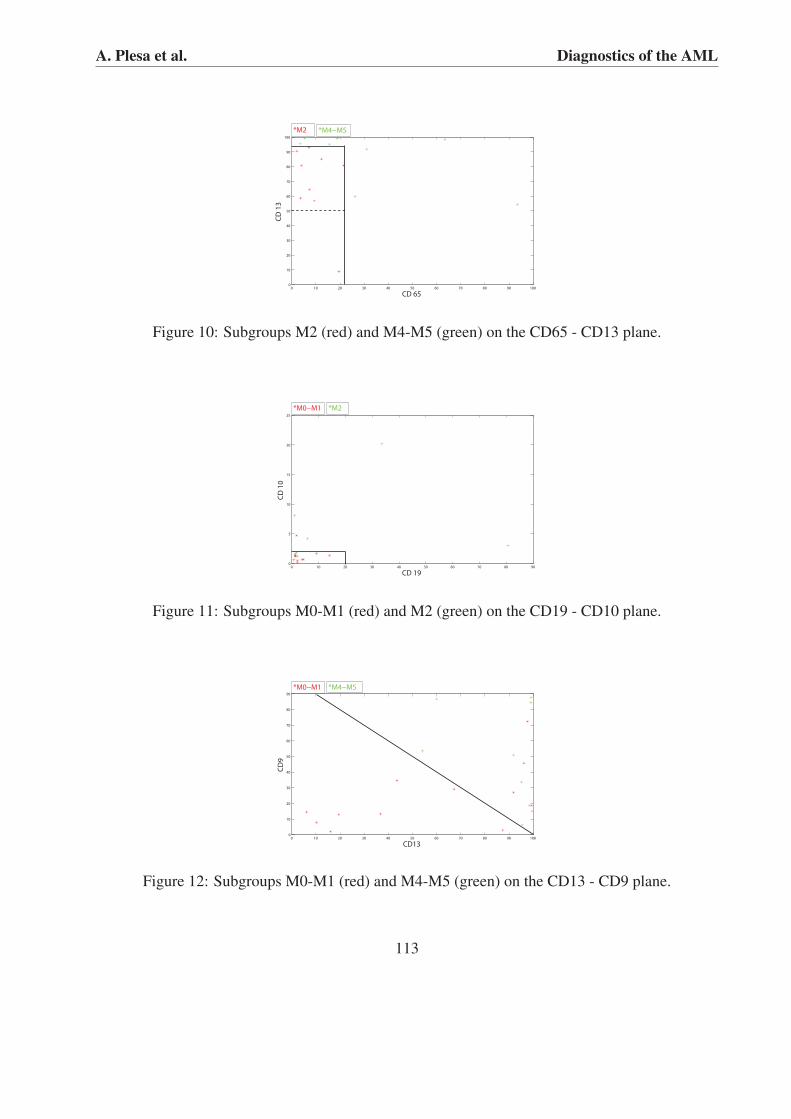
There are only M2 cases from the M2-M3 subgroup for HLA-DR > 6%. Figure 10 shows M2 andM4-M5 cases on the CD65 - CD13 plane. Figures 11 and 12 show M0-M1 (HLA-DR > 6%) casesversus M2 and M4-M5, respectively, on the CD19 - CD10 and CD13 - CD9 planes.
Up to now we have discussed only the M0-M5 cases. For CD34 < 20% and CD36 < 20% thereare also 2 M6 cases and 13 M7 (unidentified) cases. Since two cases are not sufficient to study M6patients we restrict ourselves to the analysis of M7 cases with respect to other patients:1. For M7 - M3 : CD36<5 (M3=7/9, M7=2/13), HLA-DR<10 ( M3=2/9, M7=3/13),CD117<80 ( M3=7/9, M7=2/13)2. For M7 - M2: cytoCD22<4 (M2=2/9, M7=11/13)3. For M7 - M4 : CD15<20 ( M4-5=5/10, M7=12/13)4. For M7 - M0-1: no marker found
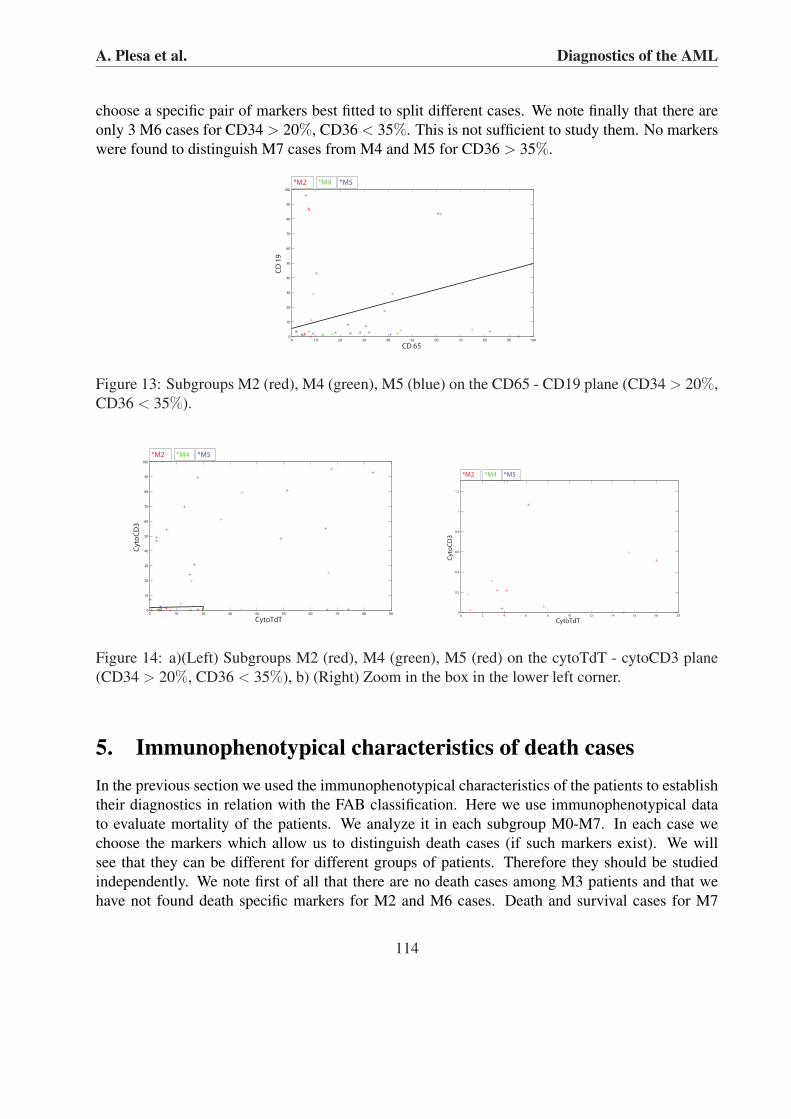
4. CD34 > 20, CD36 < 35We consider in this section the patients with CD34 greater than 20% and CD36 less than 35%.This part of the CD34-CD36 plane contains the second domain (CD34>70%, CD36<35%) andthe lower part of the third domain. The second domain contains basically M0-M1 cases and onlyfew M2 or M4-M5 cases. On the other hand, there is relatively small number of M0-M1 cases inthe lower part of the third domain. Therefore, we restrict ourselves to a short discussion about theseparation of M2 and M4-M5 cases for CD34 > 20% and CD36 < 35%. The results for two pairsof markers, CD65 - CD19 and cytoTdT - cytoCD3 are shown in figures 13 and 14. Figures 15, 16and 17 show M7 cases (unidentified) versus M2, M4 and M5 cases, respectively. Each time we
112
A. Plesa et al. Diagnostics of the AML
0 10 20 30 40 50 60 70 80 90 1000
10
20
30
40
50
60
70
80
90
100
CD 65
CD
13
*M2 *M4−M5
Figure 10: Subgroups M2 (red) and M4-M5 (green) on the CD65 - CD13 plane.
0 10 20 30 40 50 60 70 80 900
5
10
15
20
25
CD 19
CD
10
*M0−M1 *M2
Figure 11: Subgroups M0-M1 (red) and M2 (green) on the CD19 - CD10 plane.
0 10 20 30 40 50 60 70 80 90 1000
10
20
30
40
50
60
70
80
90
CD13
CD9
*M0−M1 *M4−M5
Figure 12: Subgroups M0-M1 (red) and M4-M5 (green) on the CD13 - CD9 plane.
113
A. Plesa et al. Diagnostics of the AML
choose a specific pair of markers best fitted to split different cases. We note finally that there areonly 3 M6 cases for CD34 > 20%, CD36 < 35%. This is not sufficient to study them. No markerswere found to distinguish M7 cases from M4 and M5 for CD36 > 35%.
0 10 20 30 40 50 60 70 80 90 1000
10
20
30
40
50
60
70
80
90
100
CD 65
CD
19
*M2 *M4 *M5
Figure 13: Subgroups M2 (red), M4 (green), M5 (blue) on the CD65 - CD19 plane (CD34 > 20%,CD36 < 35%).
0 10 20 30 40 50 60 70 80 900
10
20
30
40
50
60
70
80
90
100
CytoTdT
CytoCD3
*M2 *M4 *M5
0 2 4 6 8 10 12 14 16 18 200
0.2
0.4
0.6
0.8
1
1.2
CytoTdT
CytoCD3
*M2 *M4 *M5
Figure 14: a)(Left) Subgroups M2 (red), M4 (green), M5 (red) on the cytoTdT - cytoCD3 plane(CD34 > 20%, CD36 < 35%), b) (Right) Zoom in the box in the lower left corner.
5. Immunophenotypical characteristics of death casesIn the previous section we used the immunophenotypical characteristics of the patients to establishtheir diagnostics in relation with the FAB classification. Here we use immunophenotypical datato evaluate mortality of the patients. We analyze it in each subgroup M0-M7. In each case wechoose the markers which allow us to distinguish death cases (if such markers exist). We willsee that they can be different for different groups of patients. Therefore they should be studiedindependently. We note first of all that there are no death cases among M3 patients and that wehave not found death specific markers for M2 and M6 cases. Death and survival cases for M7
114

A. Plesa et al. Diagnostics of the AML
0 5 10 15 20 25 30 35 40 450
10
20
30
40
50
60
70
CD 15C
D 6
5
*M2 *M7
Figure 15: Subgroups M2 (red) and M7 (green) on the CD15 - CD65 plane (CD34 > 20%, CD36< 35%).
20 30 40 50 60 70 80 90 1000
10
20
30
40
50
60
70
80
90
100
CD 34
CD
9
* M4 * M7
Figure 16: Subgroups M4 (red) and M7 (green) on the CD34 - CD9 plane (CD34 > 20%, CD36< 35%).
0 10 20 30 40 50 60 70 80 90 1000
10
20
30
40
50
60
70
80
90
CytoCD3
Cy
toC
D7
9a
* M5 * M7
Figure 17: Subgroups M5 (red) and M7 (green) on the cytoCD3 - cytoCD79a plane (CD34 > 20%,CD36 < 35%).
115

A. Plesa et al. Diagnostics of the AML
patients are well separated by cytoNII: for 6 death cases its expression is more than 80% whilefor 5 survival cases less than 30%. Figure 18 shows M4 and M5 patients on the CD36-CD34plane. Deceased patients are shown with red color. We can observe that the percentage of deathcases decreases from the lower right corner to the upper left corner (data not shown here). Thisis in agreement with the direction of maturation of blood cells in the direction of the L1 lineage:the expression of CD34 specific for myeloid progenitor cells decreases while expression of CD36specific for the L1 lineage increases. M4-M5 patients are distributed rather uniformly on the CD36-CD34 plane without forming clearly identified clusters neither for any cases the whole group ofpatients nor for death cases. No more specific markers are found for M4-M5 cases. M0-M1
0 10 20 30 40 50 60 70 80 90 1000
10
20
30
40
50
60
70
80
90
100
CD 34
CD
36
0 10 20 30 40 50 60 70 80 90 1000
10
20
30
40
50
60
70
80
90
100
CD 34
CD
36
*dead M4−M5 * not dead M4−M5
Figure 18: Death (red) and survival (green) cases for M4-M5 patients on the CD34 - CD36 plane.
patients are presented in Figure 19. The situation here is quite different in comparison with theprevious group of patients. First, as we have already discussed before, there are three subgroupsof M0-M1 patients. The first subgroup is located in the lower right corner, that is, for small valuesof the expression of CD34 and for large values of the expression of CD36. This is specific to themyeloid progenitor cells (L0 lineage). The second subgroup is located in the lower left cornerwhere the expression of both markers is small. This is more specific to the L2 lineage where theexpression of CD34 decreases while CD36 is not expressed. Therefore we can conclude that thereis a partial differentiation of the myeloid progenitor cells in the direction of this lineage. In thefirst and second domains (left and right lower corners) death and survival cases are mixed, forthe left lower corner there are only few death cases. In the third domain death cases are locatedfor larger values of CD36 while survival cases for smaller values. This location of death casescorresponds to a larger discrepancy between morphological characteristics of blasts (M0-M1) andtheir immunophenotypical characteristics more specific for the L1 lineage. Death and survivalcases for M0 patients can also be characterized with cytoCD22 and cytoMPO (Figure 20).
6. DiscussionWe study in this work the inter-relation between the FAB classification of acute myeloid leukemiaand immunophenotypical characteristics of blast cells obtained with flow cytometry. The main
116

A. Plesa et al. Diagnostics of the AML
0 10 20 30 40 50 60 70 80 90 1000
10
20
30
40
50
60
70
80
CD 34
CD
36
*dead M0−M1 * not dead M0−M1
Figure 19: Death (red) and survival (green) cases for M0-M1 patients on the CD34 - CD36 plane.
0 10 20 30 40 50 60 70 80 900
10
20
30
40
50
60
70
80
90
Cyto CD22
Cy
to m
po
* dead M0 *not dead M0
Figure 20: Death (red) and survival (green) cases for M0 patients on the cytoCD22 - cytoMPOplane.
117

A. Plesa et al. Diagnostics of the AML
conclusion is that the FAB groups M0-M7 can be rather well identified by using properly cho-sen markers. This choice is based on the correlation in the expression of certain markers withcell maturation and differentiation (Figure 1). The key point in our reasoning is related to dif-ferentiation of myelo-monocytic progenitor cell (MMPC) into either monoblasts or myeloblasts.In both cases expression of CD34 specific for MMPC decreases. Differentiation into monoblastsis accompanied by the increase of CD36 expression while it is not the case for differentiationinto myeloblasts. Thus, in normal hematopoiesis these two markers allow the identification ofthree lineages: L0 (MPC-MMPC), L1 (monoblasts, promonocytes, monocytes, macrophages), L2(myeloblasts, promyelocyte, myelocyte, granulocyte). In the ideal case, they can be characterizedby the pairs (1,0), (0,1), (0,0) where 1 shows the expression and 0 the absence of expression ofCD34 (first number) or of CD36 (second number). Some additional markers should be used for amore detailed characterization. In the leukemic case there is an imbalance between cell differenti-ation, self-renewal and apoptosis. If, for cells of some particular type, differentiation and apoptosisare less than what they are supposed to be and moreover they begin to self-renew (or to self-renewmore intensively if they do it in non pathological conditions) then this can result in a substantialincrease of the number of immature cells (blasts). The FAB classification of AML is based on thecytomorphological characterization of malignant cells. It is M0 for MPC, M1 for MMPC, M2 andM3 for myeloblasts and promonocytes, M4 and M5 for monoblasts and promonocytes. On theother hand, as it is discussed above, these cells can be characterized by the expression of certainmarkers. Hence we can expect the correlation between the FAB classification and immunopheno-typing. This hypothesis is confirmed by the analysis of medical data for the group of 213 patients.This leads to the following characterization of the FAB groups:
M0 - M1 : two clearly identified subgroups, one for large CD34 expression, another one for small.M0 cases are more specific for large expression, M1 for small expression. There are some inter-mediate cases,M2 - M3 : basically located in the region with small CD34 and small CD36 expressions. There aresome M2 cases outside,M4 - M5 : distributed rather uniformly on the CD34 - CD36 plane with a weak overlapping withother groups basically located at the corners,M6 : not enough cases for a reliable analysis,M7 : contains unidentified FAB cases. They can be characterized with the immunophenotypicaldata.We remind the reader that each patient is characterized by expressions of 30 markers. We have usedin our analysis 3 main markers (CD34, CD36, HLA-DR) and about ten additional markers. Allmarkers which we have found to specify the FAB groups are presented in this work. This meansthat the expressions of the majority of markers are not related to the FAB classification or at least,to the best of our knowledge, it is not clear for us how they can be related. This is also due to thelack of clinical data. Another remark, which is essential for this analysis, is that different groupsof patients should be characterized by different sets of markers. We begin with CD34 and CD36for all patients which allows us to identify three main groups. After that each group is considered
118

A. Plesa et al. Diagnostics of the AML
independently and the markers which can characterize them are chosen.It is known that leukemia often begins with a single malignant cell. It begins to self-renew creatinga rapidly growing population of immature cells. If we assume that all malignant cells for a givenpatient are similar to each other, then expressions of all markers should be either 0% or 100%depending on whether these cells express given marker. However in most cases expressions ofmarkers have some intermediate values. Moreover, even the expression of the markers specificfor certain cells may not correspond to what we can expect according to the FAB classification.For example, M1 patients can have low expression of CD34 while M2 patients can have highexpression of this marker. More often it is opposite and this opposite case correlates with the FABclassification. Nevertheless, abnormal cases are not rare and it would be interesting to explain howthey appear. In the following we try to give a contribution to this explanation using a multi-agentmodelling (see [1] for the details).Let us consider the following scheme of the consecutive differentiations
C0 → 2C1, C1 → 2C2, C2 → 2C3.
The concentration of C0 is assumed to be constant. Let us write the ordinary differential systemof equations describing the evolutions of the concentrations C1 and C2 assuming that the cellsdifferentiate with the rate kd and go to apoptosis with the rate ka:
dC1
dt= 2kdC0 − (kd + ka)C1, (6.1)
dC2
dt= 2kdC1 − (kd + ka)C2. (6.2)
To describe the leukemic case we add self-renewal of C1 cells:
C1 → 2C1
and assume that the rates of differentiation and apoptosis are modified:
dC1
dt= 2kdC0 − (k∗d + k∗a − kr)C1, (6.3)
dC2
dt= 2k∗dC1 − (k∗d + k∗a)C2. (6.4)
We assume here that the differentiation and apoptosis rates for C2 are also modified because theyhave the same genetic changes as for C1. This system has a stationary solution
C01 =
2kdC0
k∗d + k∗a − kr
, C02 =
2k∗dC1
k∗d + k∗a.
Solution of system (6.3), (6.4) has the form
C1(t) =b1
kr − k∗d − k∗ae(kr−k∗d−k∗a)t − 2kdC0
kr − k∗d − k∗a,
119

A. Plesa et al. Diagnostics of the AML
C2(t) = − b2
kd + ka
e−(k∗d+k∗a)t +2b1k
∗d
r(kr − k∗d − k∗a)e(kr−k∗d−k∗a)t.
The constants b1 and b2 are determined by the initial condition. If kr¡k∗d + k∗a, then the solutionconverges to the stationary solution (C0
1 , C02). If kr¿k∗d +k∗a, then the solution exponentially grows.
Thus, if the rate of self-renewal is sufficiently small, then the solution remains bounded. This casecan be interpreted as chronic leukemia, while the second case where the concentration of blastsexponentially grows corresponds to acute leukemia.In the case kr¿k∗d + k∗a we have
C1(t)
C2(t)→ 2k∗d
kr
as t →∞.
Therefore the ratio of the concentrations depends on the rates of self-renewal and differentiation.
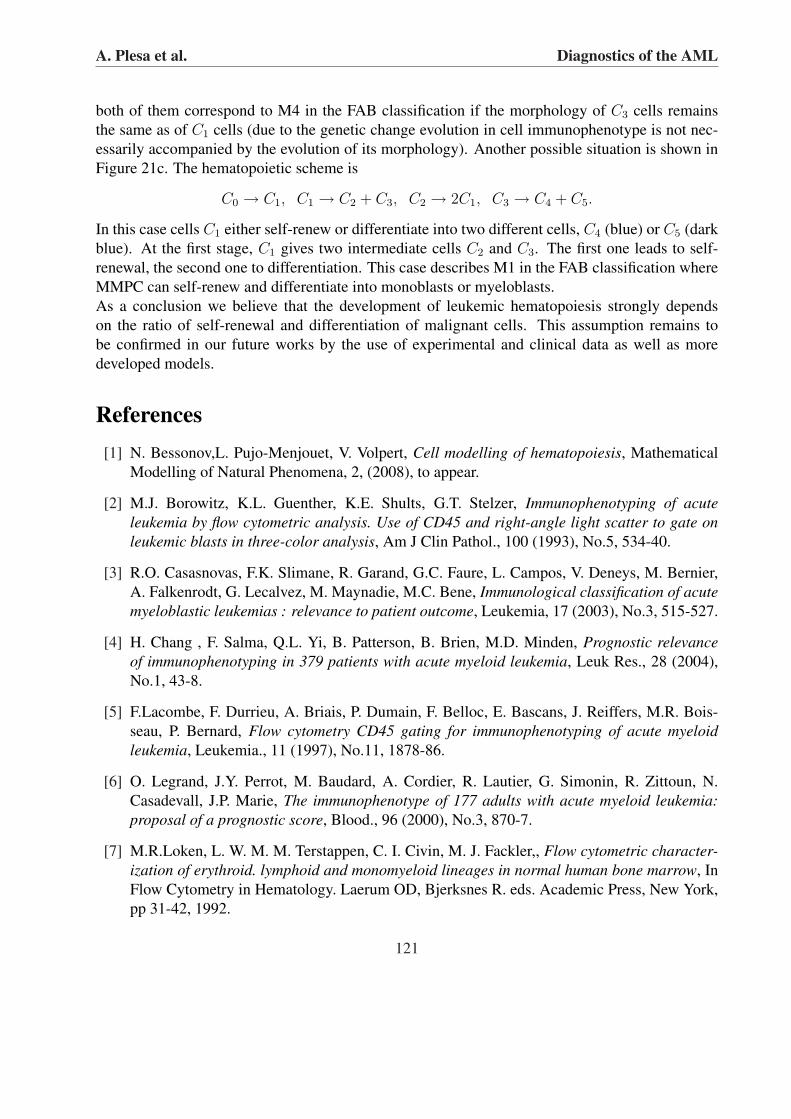
Figure 21: Individually based modelling of leukemia: a) self-renewal dominating cells, b) self-renewal and differentiation, c) self-renewal and differentiation into two lineages (see the explana-tion in the text)
We illustrate possible situations with individually based modelling of hematopoiesis (see [1]for the detailed description of the model and of the software). Consider first the scheme
C0 → C1, C1 → C2 + C3, C2 → 2C1.
Cells C1 can self-renew and differentiate. Their self-renewal occurs through intermediate cells C2.Their differentiation results in appearance of cells C3. If the rate of self-renewal is sufficientlyhigh, then the computational domain is basically filled by cells C1. This case is shown in Figure21a. Cells C1 are red, C3 are crimson, and yellow cells from the left are C0.Another ratio of self-renewal and differentiation is shown in Figure 21b. We add here one morestage of differentiation, C3 → C4. This corresponds in particular to the L1 lineage: monoblasts(red), promonocytes (purple), monocytes (dark green). We recall that CD34 is expressed formonoblasts but not for promonocytes and monocytes. Therefore its expression in the situationshown in Figure 21a can be about 80% while for Figure 21b only about 30%. At the same time
120
A. Plesa et al. Diagnostics of the AML
both of them correspond to M4 in the FAB classification if the morphology of C3 cells remainsthe same as of C1 cells (due to the genetic change evolution in cell immunophenotype is not nec-essarily accompanied by the evolution of its morphology). Another possible situation is shown inFigure 21c. The hematopoietic scheme is
C0 → C1, C1 → C2 + C3, C2 → 2C1, C3 → C4 + C5.
In this case cells C1 either self-renew or differentiate into two different cells, C4 (blue) or C5 (darkblue). At the first stage, C1 gives two intermediate cells C2 and C3. The first one leads to self-renewal, the second one to differentiation. This case describes M1 in the FAB classification whereMMPC can self-renew and differentiate into monoblasts or myeloblasts.As a conclusion we believe that the development of leukemic hematopoiesis strongly dependson the ratio of self-renewal and differentiation of malignant cells. This assumption remains tobe confirmed in our future works by the use of experimental and clinical data as well as moredeveloped models.
References[1] N. Bessonov,L. Pujo-Menjouet, V. Volpert, Cell modelling of hematopoiesis, Mathematical
Modelling of Natural Phenomena, 2, (2008), to appear.
[2] M.J. Borowitz, K.L. Guenther, K.E. Shults, G.T. Stelzer, Immunophenotyping of acuteleukemia by flow cytometric analysis. Use of CD45 and right-angle light scatter to gate onleukemic blasts in three-color analysis, Am J Clin Pathol., 100 (1993), No.5, 534-40.
[3] R.O. Casasnovas, F.K. Slimane, R. Garand, G.C. Faure, L. Campos, V. Deneys, M. Bernier,A. Falkenrodt, G. Lecalvez, M. Maynadie, M.C. Bene, Immunological classification of acutemyeloblastic leukemias : relevance to patient outcome, Leukemia, 17 (2003), No.3, 515-527.
[4] H. Chang , F. Salma, Q.L. Yi, B. Patterson, B. Brien, M.D. Minden, Prognostic relevanceof immunophenotyping in 379 patients with acute myeloid leukemia, Leuk Res., 28 (2004),No.1, 43-8.
[5] F.Lacombe, F. Durrieu, A. Briais, P. Dumain, F. Belloc, E. Bascans, J. Reiffers, M.R. Bois-seau, P. Bernard, Flow cytometry CD45 gating for immunophenotyping of acute myeloidleukemia, Leukemia., 11 (1997), No.11, 1878-86.
[6] O. Legrand, J.Y. Perrot, M. Baudard, A. Cordier, R. Lautier, G. Simonin, R. Zittoun, N.Casadevall, J.P. Marie, The immunophenotype of 177 adults with acute myeloid leukemia:proposal of a prognostic score, Blood., 96 (2000), No.3, 870-7.
[7] M.R.Loken, L. W. M. M. Terstappen, C. I. Civin, M. J. Fackler,, Flow cytometric character-ization of erythroid. lymphoid and monomyeloid lineages in normal human bone marrow, InFlow Cytometry in Hematology. Laerum OD, Bjerksnes R. eds. Academic Press, New York,pp 31-42, 1992.
121

A. Plesa et al. Diagnostics of the AML
[8] M.R.Loken, D.A. Wells, Normal antigen expression in hematopoiesis: basis for interpretingleukemia phenotypes, In: Stewart, C., Nicholson, J., eds. Immunophenotyping. New York:Wiley Liss, pp 133-60, 2000.
[9] M. Qadir, M. Barcos, C.C. Stewart, S.N. Sait, L.A. Ford, M.R. Baer, Routine immunopheno-typing in acute leukemia: Role in lineage assignment and reassignment, Cytometry B Clin.Cytom. 15, (2006), No. 70(5), 329-34.
[10] R.Ratei, L. Karawajew, F. Lacombe, K. Jagoda, G.D. Poeta, J. Kraan, M. De Santiago, J.Kappelmayer, E. Bjorklund, W.D. Ludwig, J.W. Gratama, A. Orfao, Discriminant functionanalysis as decision support system for the diagnosis of acute leukemia with a minimal fourcolor screening panel and multiparameter flow cytometry immunophenotyping, Leukemia,2007. [Epub ahead of print]
122


