
COUNTRY PRIVATE SECTOR DIAGNOSTIC CREATING MARKETS IN JORDAN

Diagnostic study of the power distribution sector Final report
Niti Aayog
April 2019

2
Acknowledgement
The study was sponsored with the financial support of Niti Aayog, Government of India
and conducted by CRISIL Infrastructure Advisory, Gurgaon.
DISCLAIMER: “CRISIL Infrastructure Advisory, Gurgaon has received the grant under the
Research Scheme of NITI Aayog, 2015 to produce this document. However, NITI Aayog
shall not be held responsible for findings or opinions expressed in the document prepared.
This responsibility rests with CRISIL Infrastructure Advisory, Gurgaon.”

3
4
List of abbreviations
Abbreviation Full form
ABR Average Billing Rate
ACOS/ ACS Average Cost of Supply
APDP Accelerated Power Development Programme
APDRP Accelerated Power Development and Reforms Programme
APTEL Appellate Tribunal for Electricity
ARR Average Revenue Requirement
AUX Auxiliary Consumption
BESCOM Bangalore Electricity Supply Company
BPL Below Poverty Line
CAGR Compound Annual Growth Rate
C&I Commercial & Industrial
CCI Competition Commission of India
CEA Central Electricity Authority
CERC Central Electricity Regulatory Commission
CESC Calcutta Electric Supply Corporation
CESCO/ CESU Central Electricity Supply Utility of Odisha
CSPDCL Chhattisgarh State Power Distribution Company Limited
CSS Cross Subsidy Surcharge
CTU Central Transmission Utility
DBT Direct Benefit Transfer
DDUGJY Deen Dayal Upadhyaya Gram Jyoti Yojana
DERC Delhi Electricity Regulatory Commission
DGVCL Dakshin Gujarat Vij Company Ltd.
DHBVN Dakshin Haryana Bijli Vitran Nigam
DIAL Delhi International Airport Limited
DJB Delhi Jal Board
DMRC Delhi Metro Rail Corporation
DVB Delhi Vidyut Board
EHV Extra High Voltage
FOR Forum of Regulators
FRP Financial Restructuring Program
GC Group Captive
GCV Gross Calorific Value
GDP Gross Domestic Product
GERC Gujarat Electricity Regulatory Commission
GETCO Gujarat Energy Transmission Corporation Limited

5
Abbreviation Full form
GNCTD Government of National Capital Territory of Delhi
GRIDCO Grid Corporation of Odisha
HVDS High Voltage Distribution System
IEX Indian Energy Exchange
IPDS Integrated Power Development Scheme
IPP Independent Power Producer
JERC Joint Electricity Regulatory Commission
JVVNL Jaipur Vidyut Vitran Nigam Limited
LED Light Emitting Diode
MMC Monthly Minimum Charges
MYT Multi Year Tariffs
NDMC New Delhi Municipal Council
NDPL North Delhi Power Limited
NEEPCO North Eastern Electric Power Corporation Limited
NEP National Electricity Plan
NPA Non-Performing Asset
NTP National Tariff Policy
OA Open Access (Non-utility consumers)
OERC Odisha Electricity Regulatory Commission
OHPC Odisha Hydro Power Corporation
OPGC Odisha Power Generation Corporation Limited
OSEB Orissa State Electricity Board
PFC Power Finance Corporation
PGCIL Power Grid Corporation of India Limited
PGVCL Paschim Gujarat Vij Company Ltd.
PLF Plant Load Factor
PPA Power Purchase Agreement
PPP Public Private Partnership
PSERC Punjab State Electricity Regulatory Commission
PXIL Power Exchange India Limited
RAPDRP Restructured Accelerated Power Development and Reforms Programme
REC Rural Electrification Corporation
RERC Rajasthan Electricity Regulatory Commission
RGGVY Rajiv Gandhi Grameen Vidyutikaran Yojana
RLDC Regional Load Dispatch Centre
RPO Renewable Purchase Obligation
SEB State Electricity Board
SERC State Electricity Regulatory Commission

6
Abbreviation Full form
SHR Station Heat Rate
SLDC State Load Dispatch Centre
STOA Short Term open Access
TOD Time of Day
UDAY Ujjwal Discom Assurance Yojana
UHBVN Uttar Haryana Bijli Vitran Nigam
UPCL Uttrakhand Power Corporation Limited
USO Universal Service Obligation

7

8
Contents
1. Executive Summary ......................................................................................................................................... 14
2. Background ....................................................................................................................................................... 20
2.1 Objective ................................................................................................................................................... 20
2.2 Scope of work ........................................................................................................................................... 20
2.3 Methodology ............................................................................................................................................. 21
3. Studies undertaken in the distribution sector ............................................................................................... 26
4. Reforms in the power distribution sector ...................................................................................................... 30
5. Empirical evidence of hindrances to OA market ........................................................................................... 36
6. Model to implement carriage and content ..................................................................................................... 46
7. Regulatory effectiveness in addressing OA issues ...................................................................................... 52
8. Inability of discoms to buy low-cost power ................................................................................................... 56
9. Under-recovery of fixed cost by discoms ...................................................................................................... 58
10. Complexity in retail tariff structure ................................................................................................................. 60
Annexure A - Key studies undertaken in distribution sector ............................................................................... 64
A.1 Best practices and strategies for distribution loss reduction .................................................................... 64
A.2 Performance of discoms ........................................................................................................................... 68
A.3 Roadmap for reduction of cross-subsidy .................................................................................................. 72
A.4 Power distribution models in India ............................................................................................................ 73
Annexure B - Reforms in the power distribution sector ....................................................................................... 76
B.1 Overview of the Indian power sector ........................................................................................................ 76
B.2 Reforms in the power distribution sector .................................................................................................. 82
B.3 Structural reforms ..................................................................................................................................... 82
B.4 Operational reforms .................................................................................................................................. 92
B.5 Financial reforms ...................................................................................................................................... 95
Annexure C - Open access in distribution sector (non-utility consumers) and key challenges .................... 100
C.1 Methodology adopted and stakeholders met .......................................................................................... 100
C.2 An overview of the OA market in power distribution ............................................................................... 101
C.3 OA market (non-utility consumers in power distribution) ........................................................................ 102
C.4 Hindrances to OA – created by state utilities and existing policies ........................................................ 106
C.5 Financial barriers .................................................................................................................................... 106
C.6 Operational barriers: Bottlenecks to OA implementation ....................................................................... 116
C.7 Consultations with open-access consumers in different states .............................................................. 120
Annexure D - Content and carriage, USO and DBT ............................................................................................. 125

9
D.1 Separation of content and carriage......................................................................................................... 125
Annexure E - Financial health of discoms ........................................................................................................... 132
E.1 Major challenges in distribution sector ................................................................................................... 132
E.2 Under-recovery of fixed costs by state discoms ..................................................................................... 151
E.3 Steps taken by SERCs to simplify tariff structure ................................................................................... 156
E.4 Interventions for tariff standardisation .................................................................................................... 156
Annexure F - Recommendations and the way forward ...................................................................................... 158
F.1 Enabling provisions in policy and regulatory framework ........................................................................ 158

10
Tables
Table 1: Comparison of CSS (Gujarat case study) .................................................................................................... 15
Table 2: Aggregate AT&C losses at the time of study ................................................................................................ 26
Table 3: AT&C losses and financial losses of CESU ................................................................................................. 30
Table 4: OA applications & rejections ......................................................................................................................... 43
Table 5: Comparison of CSS (Gujarat case study) .................................................................................................... 53
Table 6 : Region-wise AT&C losses ........................................................................................................................... 64
Table 7: AT&C losses and financial losses of CESU ................................................................................................. 84
Table 8: Capex in different states ............................................................................................................................... 90
Table 9: Identified circles and selected DFs ............................................................................................................... 91
Table 10: Scheme cost and budget ............................................................................................................................ 94
Table 11: Performance of states after adopting UDAY .............................................................................................. 98
Table 12: Components of OA charges and losses applicable to a buyer................................................................. 107
Table 13 : Comparison of cross-subsidy calculation (new and old formulae) .......................................................... 110
Table 14 : Comparison of CSS (Gujarat case study) ............................................................................................... 111
Table 15: Evidential cases depicting rejection of OA application ............................................................................. 123
Table 16: Realisation (Rs /kWh) ............................................................................................................................... 140
Table 17: Latest tariff ................................................................................................................................................ 141
Table 18: Realisations (Rs /kWh) ............................................................................................................................. 141
Table 19: Latest tariff for domestic and commercial ................................................................................................. 142
Table 20: Realisation of JVVNL (Rs/kWh) ................................................................................................................ 143
Table 21: Latest tariff for domestic and commercial ................................................................................................. 143
Table 22: Realisations (Rs /Kwh) DGVCL ................................................................................................................ 145
Table 23: Tariff structure ........................................................................................................................................... 146
Table 24: Realisations (Rs /kWh) ............................................................................................................................. 147
Table 25: Tariff in West Bengal (WBSEDCL) ........................................................................................................... 148
Table 26: Number of categories and sub-categories/slabs varies across select states........................................... 149
Table 27: Tariff categorisation of select states ......................................................................................................... 150
Table 28: TOD implementation status across select states ..................................................................................... 150
Table 29: Fixed and variable charges for different categories of consumers ........................................................... 153
Table 30: Revenue requirement and revenue proposed to be realised from tariff ................................................... 154
Table 31: Impact on total monthly bill of domestic consumers for fiscal 2019 ......................................................... 154

11

12
Figures
Figure 1: Classification of reforms .............................................................................................................................. 30
Figure 2: Key features of the Electricity Act, 2003 ...................................................................................................... 31
Figure 3: Difference in AT&C losses from 2007 to 2014 (%) ..................................................................................... 33
Figure 4: OA market vis a vis Indian power market .................................................................................................... 37
Figure 5: OA market (excluding Group Captive) vis a vis Indian power market ......................................................... 38
Figure 6: OA Energy transactions (excluding Railways & GC) .................................................................................. 38
Figure 7: Share of OA on Exchange (Short Term Market) ......................................................................................... 39
Figure 8: Growth in Captive Power ............................................................................................................................. 40
Figure 9: Cross-subsidy for industrial consumers ...................................................................................................... 53
Figure 10: Creditor to Debtor days ............................................................................................................................. 57
Figure 11: Aggregate AT&C losses at the time of study ............................................................................................ 64
Figure 12: Initial broad level structuring of loss reduction initiatives .......................................................................... 66
Figure 13: Loss reduction strategy ............................................................................................................................. 67
Figure 14: Constructs and KPIs .................................................................................................................................. 69
Figure 15: Roadmap of structural changes for the distribution utilities....................................................................... 70
Figure 16: Recommendations to improve the performance of distribution utilities ..................................................... 71
Figure 17: Market and regulatory structure of the power sector in India .................................................................... 78
Figure 18: Evolution of power exchanges in India ...................................................................................................... 81
Figure 19: Power distribution sector performance ...................................................................................................... 82
Figure 20: Reform measures in Odisha ...................................................................................................................... 83
Figure 21: Losses booked by DVB (Rs crore) ............................................................................................................ 87
Figure 22: AT&C losses in Delhi ................................................................................................................................. 88
Figure 23: Financial performance of NESCO ............................................................................................................. 90
Figure 24: AT&C losses in the franchised area for FEDCO ....................................................................................... 91
Figure 25: Difference between ACOS and ARR (without subsidy) in Rs/kWh (fiscal 2014) ...................................... 92
Figure 26: Difference in AT&C losses from 2007 to 2014 (%) ................................................................................... 95
Figure 27: Financial and operational Indicators .......................................................................................................... 99
Figure 28: Role assigned to stakeholders in ensuring implementation of OA .......................................................... 102
Figure 29: OA market vis a vis Indian power market ................................................................................................ 103
Figure 30: Consumer category wise OA (%) ............................................................................................................ 103
Figure 31: Number of OA consumers ....................................................................................................................... 104
Figure 32: Share of OA on Exchange (Short Term Market) ..................................................................................... 104
Figure 33: Landed cost for OA consumer based on different fuel source of power plant (Gujarat) ......................... 105
Figure 34: Landed cost for OA consumer based on different fuel sources of power plants (Andhra Pradesh) ....... 106
Figure 35: OA charges applicable for the 33 kV voltage level for fiscal 2018 .......................................................... 109

13
Figure 36: Comparison of OA charges with consumer tariffs (domestic and industrial) .......................................... 111
Figure 37: OA in Punjab at the 33 kV level ............................................................................................................... 112
Figure 38: OA in Rajasthan at the 33 kV level .......................................................................................................... 112
Figure 39: OA in Maharashtra at the 33 kV level...................................................................................................... 113
Figure 40: OA in Karnataka at the 33 kV level ......................................................................................................... 113
Figure 41: OA in Uttarakhand at the 33 kV level ...................................................................................................... 114
Figure 42: Margins left for open consumers to procure power from market ............................................................ 114
Figure 43: Market clearing price in IEX .................................................................................................................... 115
Figure 44: Market clearing prices in IEX ................................................................................................................... 115
Figure 45: Defining categories of OA consumers ..................................................................................................... 116
Figure 46: Typical process for grant of short-term OA ............................................................................................. 117
Figure 47: Rejected applications based on the route and type ................................................................................ 119
Figure 48: Analysis on cause for application rejection ............................................................................................. 120
Figure 49: Steps for separation of content and carriage .......................................................................................... 125
Figure 50: Stakeholders Involved in DBT Framework .............................................................................................. 129
Figure 51: AT&C losses across states during fiscals 2013 to 2015 (%) .................................................................. 133
Figure 52: Average power purchase cost (Rs/kWh) for fiscal 2017 (estimated) ...................................................... 134
Figure 53: Import volumes of thermal coal in fiscals 2013 to 2017 (in MTPA) ......................................................... 134
Figure 54: Category-wise average tariff charged vis-à-vis average tariff from all consumers (Rs/kWh) ................. 135
Figure 55: Revenue as percentage of sales to agriculture and industrial consumers .............................................. 136
Figure 56: Debtor days of states............................................................................................................................... 136
Figure 57: Creditor days of states............................................................................................................................. 137
Figure 58: Volume transacted through traders by discoms (2015-16) ..................................................................... 137
Figure 59: Peak demand and availability (MW) ........................................................................................................ 138
Figure 60: Cost components for utilities ................................................................................................................... 138
Figure 61: Tariff determination process for discoms ................................................................................................ 139
Figure 62: Tariff trajectory of DHBVN ....................................................................................................................... 140
Figure 63: Average tariff of Punjab State Power Corporation Limited) (Rs /kWh) ................................................... 142
Figure 64: Tariff trajectory (Rs /kWh) ....................................................................................................................... 143
Figure 65: Average tariff (Rs /kWh) .......................................................................................................................... 145
Figure 66: Average tariff (Rs/kWh) ........................................................................................................................... 147
Figure 67: Percentage of fixed and variable components in total cost ..................................................................... 152
Figure 68: Recovery of fixed cost as a percentage of revenue ................................................................................ 152
Figure 69: Cross-subsidy for industrial consumers .................................................................................................. 153

14
1. Executive Summary
Between fiscals 2006 and 2018, India’s installed capacity for generation of power logged a breezy 8.9% compound
annual growth rate (CAGR) to 344 GW, from 124 GW, making it the third-largest electricity generator1 in the world.
Indeed, capacity addition was faster than the 5% rate at which peak demand increased, to ~160 GW, with the latest
draft National Electricity Plan 2016 projecting peak demand of 235 GW at the end of 2021-22. Transmission, too,
took rapid strides, to enable evacuation of the generated power with a CAGR of 7.2% over the six year period FY’12-
18 taking the transmission line capacity to 3.9 lac ckm.
However, distribution remained a weak link, despite a raft of reforms mounted over the years to improve the fiscal
health of electricity distribution companies (discoms).
Studies have flagged several issues, but not all
Numerous studies undertaken to analyse and recommend measures have focused on critical issues that have
hobbled distribution, including poor operational performance and rising accumulated losses of discoms, tremendous
pressure on tariffs, and little/ no improvement in cross-subsidy levels.
However, several other critical areas have not been addressed as meaningfully so far. These include:
Poor quality of baseline data as well as inadequate capturing of real time data
Widening aggregate technical and commercial (AT&C) gaps owing to intensive last mile connectivity efforts
(addition of rural consumers)
Under-recovery of fixed costs through fixed charges in tariffs and the fact that the tariff structure does not reflect
the costs
Cross-subsidy levels for most discoms still not within the limits prescribed under the Electricity Act and the
National Tariff Policy
While un-electrified households are being electrified, universal service obligation (USO) and direct benefit
transfer (DBT) remain areas of concern
Reforms have helped, but there is a long way to go
Various reforms have been launched to boost the sector’s commercial viability and meet targets, drawing inference
from the studies. These reforms can be broadly classified as structural, operational and financial.
Major structural reforms undertaken include the Electricity Act, intended to turn the sector around and promote
competition, besides the Odisha Electricity Reforms Act, Electricity regulatory commission Act and privatisation of
Odisha and Delhi distribution entity. However through privatization of Delhi was successful, the Odisha privatization
was not able to achieve the desired result. Similarly while Electricity Act and subsequent policies have enabled
promotion of competition in generation & transmission, however PPP and competition in the distribution sector has
not been able to pick up.
Operational reforms introduced to improve power supply and system performance include Rajiv Gandhi Grameen
Vidyutikaran Yojana and Deen Dayal Upadhyaya Gram Jyoti Yojana for rural electrification, and Restructured
Accelerated Power Development and Reforms Programme and the Integrated Power Development Scheme for
urban areas. Household electrification has been achieved2, though loss levels continue to remain high for many
1 BP Statistical Review of World Energy 2014 Report
2 Source : Saubhagya Dashboard

15
Discoms as well as quality of supply & service remains poor in most of the areas including Urban districts (because
of local breakdown of transformers).
The sector has needed financial reforms from time to time, primarily to help discoms pare their mounting losses. The
most recent of these is the Ujwal Discom Assurance Yojana (UDAY), aimed at improving performance and reducing
losses. While it is too early to access the success of the scheme, however Discom data needs to be closely monitored
over the span of the scheme. There is a dire need for improvement of data quality and also take into account the
possible negative impact of adding and providing 24x7 power to rural consumers/ hugely subsidized consumers on
the financial & operational losses of the Discoms.
Barriers hinder growth of open access (non-utility consumers) market
Open access (OA) in power distribution, mandated as an operational reform in the Electricity Act, 2003, was expected
to allow consumers to choose from among power suppliers on the basis of price and reliability, and also promote
competition among distribution licensees to improve their service delivery.
This is yet achieve its full potential, although many generators and consumers have been able to opt for it. Another
reason why OA has not picked up in many states, and there are limited takers due to commercial viability or
operational constraints of such transactions.
It has been observed that while overall OA transactions (including the subsidy exempt category) have risen, the share
of OA consumers in the exchanges has dipped drastically in the last 1 year from 60% in FY’17 to 33% in FY’18. This
dip is largely on account of significant reduction in component “C” of surcharge, which has led to increase in the cross
subsidy surcharge.
Table 1: Comparison of CSS (Gujarat case study)
Particulars (Rs kWh) Calculation of surcharge as per NTP 2016
Calculation of surcharge as per NTP 2006
Formula S = T – [ C (1- L / 100) + D + R ] S = T – [ C (1+ L / 100) + D ]
Tariff payable by relevant category of consumer (T) 7.34 7.34
Cost of power purchase (C) 4.223 6.0745
Wheeling charge (D) 0.15 0.15
Losses (L) 10% 10%
Cost of carrying regulatory assets (R) 0 0
Surcharge (S) as calculated using formulae 2.51 0.52
Applicable cross-subsidy surcharge as per the policy 1.47 0.52
Source: Tariff orders published by GERC (for 2016 calculation) and CRIS analysis (for 2006 calculation)
Financial barriers such as high levels of cross-subsidy surcharge and additional surcharge reduce viability for open
access consumers. Cross-subsidy remains higher than 20% of the average cost of supply for industrial and
commercial consumers.
Most open access consumers are high-tariff ones (industrial and commercial), who cross-subsidise the other
consumers. From the discoms’ viewpoint, it becomes critical to reduce their financial losses, which could mount
3 C is the per unit weighted average cost of power purchase by the Licensee, including meeting the Renewable Purchase Obligation
4 For the sake of calculations, the value of “C” has been taken from the GERC tariff order issued for 2016, as determined by the Commission
based on tariff policy 2006. Assuming the same will remain applicable for the present year as there is no change in the power purchase portfolio.
5 C is the Weighted average cost of power purchase of top 5% at the margin excluding liquid fuel based generation and renewable power

16
further in case these high-paying consumers went to the OA market. This also explains the operational barriers posed
by discoms in the form of procedural delays/ rejection on unreasonable grounds, etc.
Apart from high open access charges, supply-side constraints on account of limited availability of domestic coal and
high cost of imported coal have increased short-term market prices and thus the overall cost of power for generators
selling power on the exchange or through bilateral transactions.
Separation of content and carriage can change market dynamics, but adoption a challenge
In 2015, the Forum of Regulators (FoR) commissioned a study on ‘Rollout plan for introduction of competition in retail
sale of electricity’.
The report envisaged the stages of implementation of separate content and carriage (C&C) starting from functional
segregation of discoms, preparation for competition and onset of competition. Among key areas marked for
immediate focus were the formation of intermediary companies, transfer of existing power purchase agreements,
treatment of existing financial losses, allocation of technical and commercial losses between distribution and supply
companies, balance sheet segregation, tariff-setting mechanism for new entities, defining the framework for
consumer interface, and phasing of retail supply competition.
Additionally there is a need for restructuring tariffs i.e. fixed charge in line with fixed costs as well as implementation
of direct benefit transfer (DBT) and Universal Service Obligation (USO). This will help in making wheeling and retail
supply both viable on a standalone basis.
The need for restructuring tariffs…
The retail supply tariff comprises two parts: fixed/demand charge and energy/variable charge.
Fixed/demand charge is designed to recover utility costs that are fixed in nature, such as capacity charges payable
to power generators, transmission charges, operation and maintenance expenses, depreciation, interest on loans,
and return on equity. This is generally recovered on the basis of sanctioned load/ connected load/ contract demand
or maximum demand of consumers.
Energy/variable charge is designed to recover utility costs that are variable in nature, such as variable cost
component of power purchase. This cost is recovered on the basis of the actual consumption of consumers during
the billing period (per kWh or per kVAh basis).
However, there is a wide gap between the actual fixed cost paid and the revenue recovered through fixed charge.
Data of various discoms indicates that a large portion of the fixed costs is loaded on energy charges. This raises the
proportion of energy charges in total discom revenue. As more consumers move to open access, there is a possible
worry of Discoms on account of under recovery of fixed costs and therefore exacerbating the Discoms poor financial
health.
Ensuring full recovery of the distribution wires business – which has a major share in the total fixed costs of a utility
would obviate levying higher open access charges. In this case, discoms would be able to support competition in the
long run, whether it is in the form of open access or C&C separation.
…and making subsidy delivery targeted
DBT, which involves transfer of subsidies directly to the beneficiary’s bank account, can help reduce cross-subsidy
and keep rural tariffs low as only actual consumption is subsidised, and not power pilferage or losses.
State governments give subsidies to power distribution utilities for selling electricity to consumers below the
procurement cost. However, subsidy payments by states are not made regularly, adding to the financial misery of
the utilities.
Implementation of DBT, including full recovery of the costs, will help discoms stay out of the subsidy loop and recover
the full price of electricity, thus improving their financial profile.

17
Besides, competition through open access can flourish if tariff rationalisation is introduced along with DBT, providing
a platform for future reform agenda. Judicious cost recovery will also shield discoms financially from any exodus of
consumers and create a conducive environment for other players.
Regulators haven’t quite succeeded in promoting competition through open access
Despite structural reforms, the tariffs determined for discoms don’t reflect the cost of supply due to high AT&C losses
leading to financial losses. State Electricity Regulatory Commissions (SERCs) have tended to create regulatory
assets through partial approval of the actual cost. The gap between tariffs and costs, in turn, has forced discoms to
take short-term loans to meet the power requirement, while most of the regulators has not penalized the Discoms for
meeting the loss target levels. The issue has snowballed in the past and the regulator needs to be very cautious
going forward.
Post UDAY, the SERCs need to regularly change tariffs without any delay, approve adequate tariff hikes to meet the
increased cost of supply (including by adding increased rural/subsidised consumers), reduce the cross subsidy going
forward, follow AT&C losses as per the UDAY, and implement DBT in alignment w
Discoms unable to tap lowest-cost power
A discoms ability to buy power from the open market depends on its current tied-up power — higher the capacity tied
up, lower the ability, given the fixed-charge liability.
Further, a delay in receiving money from consumers has a cascading effect on debtor days, which is higher in case
the state has a higher proportion of subsidised consumers. Delays in subsidy realisation from the state government
also creates a cash crunch.
The delays in the cash cycle, in turn, increase the discoms’ dependence on industrial and commercial consumers for
providing adequate cushion to their working capital, and make them resist provision of open access to such
consumers.
Tariffs still too complex
There are numerous categories and sub-categories/slabs in the tariff structures, with no consistency among states,
adding to the complexity as indicated in the table below –
Haryana Punjab Rajasthan Gujarat Karnataka West Bengal Delhi
No of categories 15 17 8 18 12 9 9
No of slabs 45 43 25 34 62 72 14
Complexity Moderate Moderate Simple Moderate Complicated Complicated Simple
Besides, states follow a different mechanism to recover costs, apart from a two-part structure such as the concept of
monthly minimum charge for domestic consumers which is still prevalent in some states.

18
Way forward for promoting competition
Addressing the issues outlined above is imperative for improving the open access market and separating content
and carriage. Here are some recommendations, based on our analysis:
Issues Recommendation
Rationalisation of fixed and variable cost to reduce overall tariff of industrial consumers
Review the applicability of fixed charge and its coverage to meet fixed obligations
Unless the tariff components (fixed and variable) are reflective of their liabilities, discoms are bound to face under-recovery of fixed costs. This would make them averse to open access, as it would mean losing high-paying consumers.
Recovery of fixed charge for subsidised consumers thus merits consideration.
The Delhi Electricity Regulatory Commission recently revised its fixed charges for domestic consumers to reflect the actual fixed component in their cost structure. A similar approach may be adopted by other states for their residential and other consumers, so as to boost discoms’ cash flows.
Simplification of tariff structure and cost-reflective tariff
Simplify tariff structure
The tariffs set by SERCs for retail consumers are complex in nature, with many sub-categories and conditions, which leads to confusion not just at the consumer level, but also at the discom level. It is, therefore, recommended that tariff structures be reviewed and revenue neutrality ensured while carrying out simplification of tariff categories. Existing tariff categories may be merged/ eliminated based on the following principles:
a. End use
b. Energy consumption
c. Socio-economic profile/ affordability
d. Social factors (rural and urban area differentiation, etc.)
e. Consumption pattern/ load factor, etc.
f. Voltage level
g. Efficient energy use, etc.
Universal supply obligation & subsidy delivery
Implement USO and DBT for domestic consumers in a phased manner as per National Tariff Policy, 2016
DBT for targeted consumers, with direct payment through State budget allocation can help improve accountability, reduce delays, and deliver subsidy to consumers more efficiently. This would plug the cash deficit and help in implementing USO.
High cross subsidy surcharge and additional surcharge
Have uniform methodology to calculate open-access charges & reduce cross subsidy
The National Tariff Policy, 2016 clearly mandates that open access charges should not be so onerous that it kills competition. Prescribing a uniform methodology for determining additional surcharge and re-evaluating parameter “C” of the cross-subsidy surcharge formula as provided in the policy are also required. However the revision in NTP 2016 has allowed a higher cross subsidy surcharge.
Hence the existing methodology under NTP 2016 which has approved higher charges for OA consumers’ needs to be relooked at and a uniform methodology to re-evaluate “C” charge should be developed.
Further cross-subsidy for many industrial and commercial consumers is still higher than the limit of 20% of average cost of supply prescribed under National Tariff Policy 2016. Commissions should follow the guidelines in the policy and the Electricity Act 2003 to gradually reduce cross-subsidy.
Transparency and process-related issues
Set up centralized online registry to improve transparency at the state level
If consumers seek open access up to their contract demand, there should be an automatic provision (if possible without involving discoms) to allow the validity of such no-objection certificate (NOC) up to at least a year. Further, the system of issuance of NOCs for open access is largely manual in majority of the states and requires a lot of manual intervention and endless paper work. The transparency at state load despatch centres (SLDCs) can be increased through:
Centralized online platform & monitoring to accept applications of OA consumers
Defined reasons for possible rejection
Limited interaction with discoms during the application process
One-time creation of account for an open-access consumer and ease in applying multiple short-term open access applications
Document reason for denial of OA connection

19
Issues Recommendation
The platform could be created by MOP. State Discoms & respective agencies could be given separate login IDs for providing NOC
Reasons for OA rejection have no convincing ground
Circulate clear guidelines on requirement and possible list of reasons for rejection
After an application is submitted, many open-access consumers face rejections on frivolous grounds without proper explanation. This discourages them from applying for open access. Some steps which can address this are:
Discom/ SLDC can provide acceptable justification and reason on applications rejected
Discom/ SLDC can provide Dos and Don’ts for consumers applying for open access
Maintaining registry and transparent records (at the central level as well)
Coal resources not available for plants without PPA
Coal for All (with/ without PPAs)
The LTSLC (Long Term Standing Linkage Committee) has not awarded Coal linkage to any plant since 20106. Further there is a condition of usage of linkage coal only for long term PPA holders. Thus in the absence of coal linkages, power plants are unable to supply power at commercially viable rates to the Open Access consumers.
This has significantly restricted the growth of long/ medium term power supply market for OA consumers. Thus there is a dire need for coal allotment to all the plants (with or without PPA).
6 Source – Press Information Bureau

20
2. Background
2.1 Objective
There have been multiple attempts by the Indian government in the past two decades to revive the domestic power
distribution sector. Despite that, it continues to be the weakest link in the country’s electricity value chain. Inadequate
tariffs; huge aggregate technical and commercial (AT&C) losses; lack of sufficient investment in infrastructure; old
and outdated networks; inadequate maintenance; and indebtedness are some of the issues that still plague the
sector, a decade and a half after the Electricity Act, 2003, was notified.
The Ujjwal Discom Assurance Yojana (UDAY) is the latest in a series of financial restructuring schemes introduced
to improve distribution companies’ (discoms) operational efficiency and to make state governments accountable for
their losses. As part of the Electricity Act, 2003, structural reforms, such as unbundling and corporatisation of state
electricity boards, and operational reforms, such as schemes to strengthen the transmission and distribution networks
of the discoms, were undertaken. Though the measures varied in scope, extent and detail, the common objective
was to make the distribution sector operationally and financially viable.
Open access (OA) as an operational reform was mandated as part of the Electricity Act, 2003. It was expected that
OA in distribution would not only allow a consumer to choose a power supplier on the basis of price and reliability,
but also promote competition among the discoms, in turn improving their services and helping them retain high-
paying consumers.
Though many consumers and companies today are able to opt for OA power – other than electricity
purchased/supplied by distribution licensees – offtake volume has remained sub-optimal in the segment. Reasons
preventing non-discriminatory OA in distribution include:
Increase in cross-subsidy surcharge and additional surcharge: The Electricity Act, 2003, envisaged a
gradual reduction in cross-subsidy surcharge (CSS) to promote OA. However, this has not been achieved till
date. OA charges, such as CSS and additional surcharge (AS), and losses, are also kept at higher levels to
discourage migration of high-paying industrial/ commercial consumers.
Procedural hindrance: In order to discourage migration, the discoms often cite procedural impediments in
processing consumers’ request for OA.
One of the main objectives of this study is to empirically assess the domestic power distribution sector and study the
challenges/ hindrances faced by OA consumers’ i.e. non-utility consumers in power distribution. The other objective
is to evaluate solutions/options to improve the viability of the power distribution sector.
2.2 Scope of work
In this report, a diagnostic analysis has been carried out on the power distribution sector based on terms of reference
mentioned below:
1. Review of select studies undertaken in the distribution sector and key takeaways from them
2. Brief overview of distribution sector reforms:
a. Key measures undertaken
b. Analysis of inferences from previous studies on the sector and steps proposed in those studies
c. Need for separation of carriage and content and integration with universal service obligation (USO) and
direct benefit transfer (DBT)
3. Empirical evidences of incidents that show states are blocking/creating hindrance to OA (non-utility
consumers) of electricity and uses of carriage for transmission of content

21
a. Carry out a desktop study of actual OA consumers vis-a-vis potential/applied OA consumers in states
b. Select diversified and representative states where the system was successful and where it is still not
very favourable
c. Carry out discussions through structured questionnaire with key private generators, energy exchanges,
traders, and industry associations on their OA experience
d. Identify issues and bottlenecks, if any, in the implementation of OA
4. Explore sustainable model to implement carriage and content, USO and DBT in the power distribution sector
5. Evaluating the effectiveness of regulators in addressing the issues in the OA system, including those related
to tariff, that hinder its successful implementation
a. A dipstick assessment of the cross-subsidy trajectory followed by state electricity regulatory commissions
(SERCs) and its impact on implementing OA
b. Role the Central Electricity Regulatory Commission (CERC) or Forum of Regulators (FOR) can play in
standardising the approach
6. Inability of the discoms to buy cheaper power generated inside their respective states and outside
a. Assessing the discoms’ discipline in following merit-based dispatch vis-a-vis cheaper sources of power
available
b. Assessment of cost of power procured from long-term sources and corresponding costs in alternative
short-term power exchange at the same time period
c. Reasons for not buying power from independent power producers (IPPs) and also assessment of
concerns around fixed charges versus marginal cost/exchange pricing.
7. Case study of under-recovery of fixed costs by discoms under two-part tariff, which is hindering competition
in the distribution sector, and empirical evidence thereof.
a. Assessment of reflectiveness of fixed and variable costs in the retail tariff structure
b. A dipstick assessment of approach followed by SERCs when determining tariffs, including fixed charge
and energy charges, versus cost
c. Identification of underlying issues for misalignment in cost
d. Way forward/suggestions to correct the misalignment
8. Review of complexity in the retail tariff structure and methodology adopted by SERCs
a. Identify the categories/slabs in various states, differences between them and reasons
b. Grouping of the tariff of the discoms in three category: (a) complicated tariff structure states, (b) moderate
tariff structure states and (c) simplest tariff structure states
c. Present status of actions taken by SERCs towards simplification of tariff structure as mandated by the
National Tariff Policy 2016 (NTP 2016)
d. Identify possibilities of interventions by the CERC or FOR to standardise tariff structure
2.3 Methodology
2.3.1 Literature review
Given below are studies reviewed and analysed for different sections of the terms of reference for the present study:
Terms of reference Literature reviewed
Task 1: Review of studies already
undertaken in the distribution sector CRISIL Infrastructure Advisory (CRIS) has undertaken desktop study of reports published by Forum of Regulators & planning commission on the distribution sector:
1. Best practices and strategies to reduce distribution loss

22
Terms of reference Literature reviewed
2. Road map to cut cross-subsidy
3. Study on performance of distribution utilities
4. Various power distribution models in India
Broadly, CRIS’s study analysed the following:
a) Study objective
b) Approach followed
c) Recommendation and inferences
Task 2: Brief overview of distribution
sector reforms CRIS has identified and segregated the reforms into 3 categories i.e. structural, operational and financial reforms. CRIS has also analysed the important reform measures undertaken in India:
a) Privatisation model in Delhi and Odisha
b) Distribution franchisee model in Agra and Bhiwandi
Task 4: Implementation of separation of
content and carriage CRIS has identified the key measures to be adopted for the implementation of separation of content and carriage and its integration with the USO & DBT
Task 3: Empirical evidence of the incident
that shows states are blocking/ creating hindrance for OA and uses of carriage for transmission of content
Task 5: Evaluating the effectiveness of
regulatory framework in addressing tariff-related and OA-related issues for its successful implementation
CRIS has reviewed issues prevalent in the OA market. In general, barriers to the implementation of OA have been classified into financial and operational. The consultation paper on issues pertaining to OA prepared by the by Ministry of Power has the same categorisation too.
Analysis of financial barriers: Financial barriers are the biggest roadblock in
operationalising the OA market and its success in India. These have been analysed to point out issues in tariff methodology used for OA consumers. Areas covered:
1. OA market in India and its share in the overall generation
2. Different regulatory provisions and policy guidelines driving the OA market
3. Comparison of present applicable formula for the CSS and formula under the previous national tariff policy (NTP)
4. Viability in terms of financial margin for OA consumers for select states
Operational barriers: Apart from financial barriers, there are operational constraints
that restrict the open-access consumers. To identify the same, CRIS met many IPPs, traders, power exchange, and the consumers who opt for OA in their respective states. CRIS formulated a questionnaire to solicit their independent views. Key issues pointed out during the interactions are as follows:
1. No clear methodology is followed by the state load dispatch centres (SLDCs)/ discoms while evaluating the OA applications.
2. The discoms cite transmission constraints and deny approval.
3. Even in states where OA is allowed, the SLDC deny clearances on unconvincing reasons and grounds.
4. Unlike the regional load dispatch centres (RLDCs) that maintain information on applications received and their status, few SLDCs maintain data base on applications rejected.
5. Above all, there are operational bindings, which, if not followed, result in heavy penalty.
Task 6: Inability of the discoms to buy
cheaper power available in their respective state and outside
The discoms’ inability to buy cheaper power has been looked into keeping in mind their financial health. Following aspects have been analysed:
1. Debtor and creditor days
2. Cross-subsidised consumers and their paying capacity
3. Extent of subsidy
Task 7: Case study of the discoms’ under-
recovery of fixed cost under two-part tariff structure, which is hindering competition in the power distribution sector and its empirical evidences.
CRIS has analysed the mismatch in fixed and variable cost recovery of the discoms through their existing tariff structure for the following states:
a. Gujarat
b. Madhya Pradesh
c. Chhattisgarh

23
Terms of reference Literature reviewed
d. Karnataka
e. Maharashtra
f. Uttarakhand
Task 8: Review of complexity in the retail
tariff structure and methodology adopted by SERCs
CRIS has analysed the following to review the complexity in retail tariff structure:
Current tariff framework and identity gaps
Approach to identify and target lifeline consumers
Consumer classes and consumption slabs
Case study of Delhi
2.3.2 Questionnaire shared with the stakeholders
The following questionnaire was shared with IPPs, traders and exchanges for their inputs on challenges faced by OA
consumers.
Particulars
Name of the organisation
Consumer or IPP/ trader
Capacity under OA
State/s of operation/ supply
Industry type, if consumer
Set 1: Consumer
S No Questions
1 Was power procured through the OA route competitive versus discom tariff? (In which state did you find it competitive and in which you did not)
2 What is the share of cost of power in your overall expenditure? How did you know about the OA route?
3 What were the operational challenges you faced while procuring power through the OA route?
4 Did you take help from any external expert or agency to apply for OA? If yes, how did it help you gain OA?
5 Is the process for getting OA well-defined and accessible? If no, can you give any suggestion on how it can be improved?
6 Did you face any hidden charges or roadblock while applying for OA? (If yes, please specify in which state)
7 Did the nodal agency concerned, i.e., SLDC/RLDC, give the required clearances easily? What were the issues faced, if any?
8 Can the process followed by the discom/ SLDC to provide OA be improved? Any specific aspect which needs to be addressed?

24
S No Questions
9 How much time did it take for you to get such regulatory clearances?
10 What was the OA route adopted – short term, medium term or long term?
11 Did you face any issues in case you had to return to the discom?
12 Frequent shifting of consumers has been cited as a big issue for the discoms. How many times have you shifted and any particular reason?
13 The CSS, AS and stand-by charges have inflated the charges consumers pay for OA. Any suggestions on the way to reduce the burden on consumers?
14 How many times did your application for OA get rejected and what were the reasons given?
15 After getting OA to power, did you face any complicated process-related and cost-related issue?
16 Any other suggestions?
Set 2: IPPs/ Industry associations/ traders
S No Questions
1 What are the regulatory and operational challenges you faced while selling power through the OA route? Can you specify the states where it is easy and where it is a challenge?
2 Do you think the OA route is viable on a long-term basis, considering transmission constraints in the country?
3 What, according to you, is the greatest hurdle for the OA market to succeed in India?
4 Did the nodal agency, i.e., SLDC/RLDC, give you the required clearances easily?
5 What was the mode adopted for sale of power, i.e., via exchanges, traders, bilateral contracts, etc.?
6 Do you think the present regulatory regime is favourable for renewable energy generators? Any suggestions to improve it?
7 Which state has the maximum participation at the Indian Energy Exchange (IEX) via OA route?
8 Will a single-window clearance system, without any interaction with discom, work for OA? Any other suggestions?
25
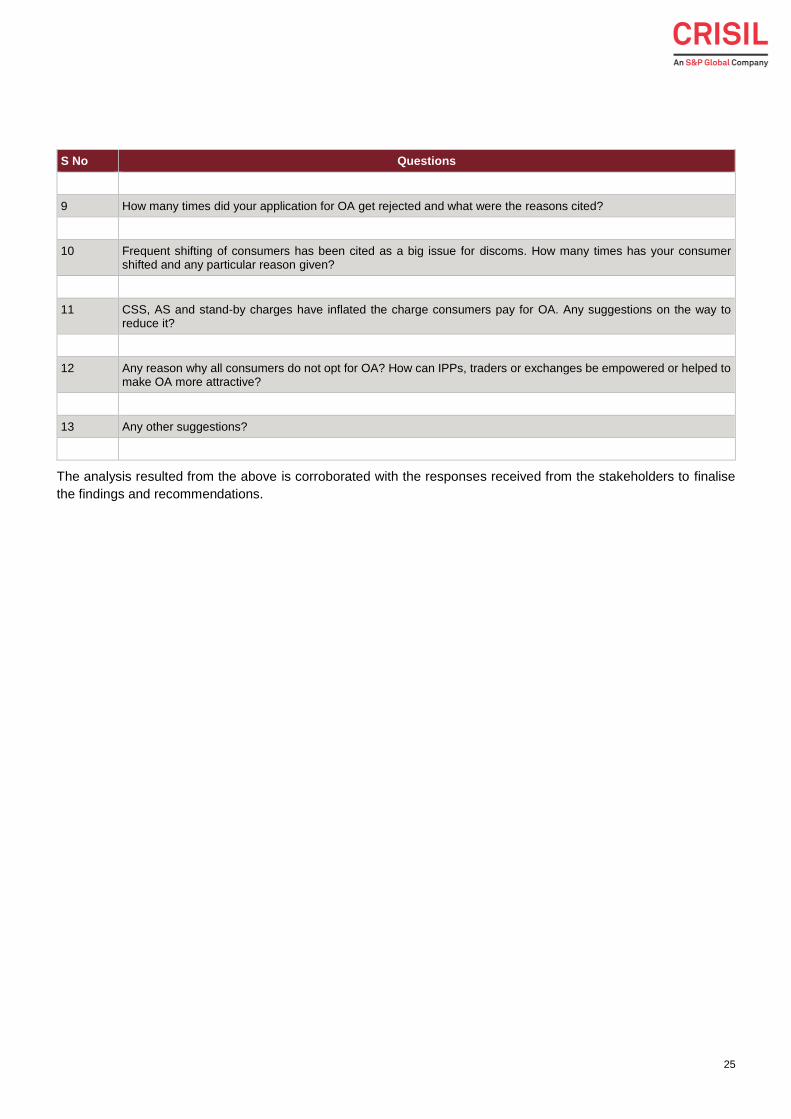
S No Questions
9 How many times did your application for OA get rejected and what were the reasons cited?
10 Frequent shifting of consumers has been cited as a big issue for discoms. How many times has your consumer shifted and any particular reason given?
11 CSS, AS and stand-by charges have inflated the charge consumers pay for OA. Any suggestions on the way to reduce it?
12 Any reason why all consumers do not opt for OA? How can IPPs, traders or exchanges be empowered or helped to make OA more attractive?
13 Any other suggestions?
The analysis resulted from the above is corroborated with the responses received from the stakeholders to finalise
the findings and recommendations.

26
3. Studies undertaken in the distribution sector
Despite India’s commendable strides in boosting its power generation and transmission capacity over the past few
years, the country is lagging in distribution. Numerous studies have also been undertaken to analyse and recommend
measures to fix the critical gaps in the distribution sector.
The following studies have been selected on the basis of relevance and coverage of key sectoral issues:
Best practices and strategies for distribution loss reduction (2016, FOR)
A study on ‘Performance of distribution utilities’ (2016, FOR)
A study on ‘Roadmap for reduction in cross-subsidy’ (2015, FOR)
Study of various power distribution models in India (2011, Planning Commission)
Study 1: Best practices and strategies for distribution loss reduction (2016, FOR)
Need for the study
The discoms’ AT&C losses improved only marginally to 23.98% in fiscal 16 from 27.70% in fiscal 2009, despite
schemes such as the Restructured Accelerated Power Development and Reforms Programme (R-APDRP).
Table 2: Aggregate AT&C losses at the time of study
Year FY 09 FY 10 FY 11 FY 12 FY 13 FY 14 FY 15 FY 16
AT&C loss level 27.70% 26.60% 26.35% 26.63% 25.38% 22.70% 25.72% 23.98%
Source: PFC annual utilities report
The study was conducted in the backdrop of weakening financial health of the discoms due to mounting losses and
regulatory tariffs coming under pressure. (Details in annexure A.1.1).
Key Takeaways
A FOR study on loss reduction strategies in India conducted in 2008 formed the background of this study. The key
issues identified in the 2008 study were lack of clarity in the definition of distribution and AT&C losses as well as in
the method of computation of AT&C loss; lack of segregation of technical and commercial losses; unavailability of
baseline data; lack of third-party verification of data and energy audit; lack of clarity on methodology for loss reduction
in a time-bound manner; and the relative inadequacy of technical solutions.
A framework was developed to select states on the basis of AT&C losses, percentage of consumer category sales
(agricultural and industrial) and effectiveness of loss reduction (initiatives undertaken). Once the states were
selected, the data was collected and loss reduction initiatives identified. The loss reduction initiatives have broadly
been classified as administrative, regulatory, governance framework, competition promotion, process strengthening,
network strengthening, government support and soft initiatives (details in annexure A.1.2).
The loss reduction initiatives were classified as ‘must-have’, ‘strongly desirable’, ‘good to have’, and ‘other initiatives’,
based on adoption levels by the states. Finally, a loss reduction strategy was defined, recommending that defining
goals, measuring and verifying losses, energy audits, planning improvement, and controlling and sustaining losses
were critical (details in annexure A.1.2).
Areas not covered as a part of the study
While the report clearly identifies the loss reduction initiatives, the coverage of the study didn’t include lack of baseline
data and data quality. The impact of capex on loss reduction initiatives, offset by increase in losses due to addition

27
of rural consumers, has not been assessed. Further, it did not analyse how tariff restructuring can address the
mismatch in fixed cost and fixed charge (as detailed in later sections) and thereby reduce the piling up of losses.
On-ground implementation of the initiatives suggested has been slow and loss levels continue to remain a matter of
concern.
Study 2: Study on ‘Performance of Distribution Utilities’ (2016, FOR)
Need for the study
Most of the discoms continued to reel under huge accumulated losses and their operations suffered. Hence, it was
important to study their performance across various states and introduce reforms. This study captured the financial
and operational performance of the distribution sector and analysed the impact of various policy/ regulatory decisions
on them (details in annexure A.2.1).
Key Takeaways
The distribution utilities under consideration in the study were compared and grouped into five categories based on
the four constructs and 12 related, mutually exclusive and collectively exhaustive parameters. The four main
constructs were profitability, channel efficiency, solvency, and techno-commercial efficiency (see Figure 14). The
utilities were graded on each key performance indicator (KPI) and the performance benchmarked against the national
average (details in annexure A.2.2).
Further, the study created a roadmap for Discom improvement as per their grading, suggesting structural changes
in the short, medium and long term (see Figure 15). It recommended steps for improvement in the areas of regulatory
framework (including quality, consistency and timely reporting of financial data; tariff rationalisation; timely fulfilment
of subsidy commitment; strengthening corporate governance); operational excellence (strengthening techno-
commercial efficiency; consumer sensitisation); changing industry landscape; and improving financial aspects
(details in annexure A.2.2).
Areas not covered as a part of the study
The study did not recommend steps to enhance timely reporting and consistency/ reliability of data. Data quality and
reliability in the power distribution sector continue to be a critical issue. While the overall regulatory framework has
improved, the performance of most discoms remains dismal.
Study 3- Report on Road Map for Reduction in Cross-subsidy (2015, FOR)
Need for the study
The Electricity Act, 2003, requires the SERCs to progressively reduce tariff cross-subsidies to ensure that tariffs
reflect the cost of supply. However, there has been little improvement in the level of cross-subsidies for industrial and
commercial consumers. FOR undertook this study in order to devise a way forward to determine optimum cross-
subsidies possible, and to suggest a roadmap towards their reduction, in line with the Act, the National Electricity
Policy and the tariff policy (details in annexure A.3.1).
Key Takeaways
The key areas for intervention as identified by the report are the calculation of cost of supply (category-wise cost of
supply instead of average cost of supply (ACOS) in tariff determination) and the reduction of cross-subsidies,
including factors for determining them. It also gives broad level measures for states both within and outside the (+/-)
20% ACOS range.
The study also recommends a universal charge, bill segregation (i.e. cross-subsidy given to a customer should be
clearly shown as a separate item in the customer billing statement) and defining of know-your-customer, or KYC,
norms to enable the direct transfer of subsidy (details in annexure A.3.2).

28
Areas not covered as a part of the study
While the study recommends measures for reduction of cross-subsidies to the (+/-) 20% ACOS range, the tariff issues
(cost reflective tariffs and under recovery of fixed costs via fixed charges) haven’t been addressed.
The poor financial health of discoms and political inertia in significantly increasing domestic and agricultural tariffs
continue to be some of the core issues which haven’t been covered adequately.
Study 4: Various power distribution models in India (2011, Planning Commission)
Need for the study
Most states had unbundled their respective state electricity boards (SEBs) and corporatised their successor entities
by 2011. The central government was facilitating efficiency improvement and expanding distribution networks to rural
areas through its flagship programmes of R-APDRP and Rajiv Gandhi Grameen Vidyutikaran Yojana (RGGVY)
(details in operational reforms, Section 4).
However, the financial health of distribution utilities remained critical to the overall success of the power sector
reforms. With mounting financial losses and limited private participation in the sector, a need was felt to analyse both
the emerging and established models of electricity distribution and evaluating their relative strengths and
weaknesses, in order to evolve feasible models for electricity distribution in India (details in annexure A.4.1).
Key Takeaways
The study provided an overview of the distribution models in India (government ownership, private ownership, public-
private partnership or PPP – distribution franchisees), and analysed the existing companies (across varying
distribution models). Further, it assesses distribution models on various parameters such as financial performance,
technical performance, benefits to customers and demand-side management.
The study provides a snapshot of the strengths and weaknesses of the various distribution models, bringing out the
marked difference in performance between privately managed entities and those owned and controlled by the
government. The study also explains the benefits of privatisation and the incapability of the private sector to serve
the poor. It, hence, recommends that revenue from a cess levied should go into a separate corpus such as the
Universal Service Obligation Fund and should be utilised to subsidise operations in these residual areas (details in
annexure A.4.2).
Areas not covered as a part of the study
While the report identifies the way forward by setting up a Universal Service Obligation Fund to subsidise rural
electrification, it doesn’t give an action plan to operationalise the fund and DBT. The report doesn’t provide a road
map for tariff restructuring required to implement privatisation.
Summary
S.No. Study Objectives/ Issues to be addressed
Findings Areas not covered
1.
Best practices and strategies for distribution loss reduction
High AT&C losses
Regulatory tariffs under tremendous pressure owing to high distribution losses
Cascading effect on discoms’ financial health
Define loss reduction strategy
Identified loss reduction initiatives
Classified initiatives on the basis of requirement
Doesn’t capture the issue of lack of baseline data and poor data quality
No estimation of capex required for loss reduction initiatives and electrification of rural consumers (which leads to higher losses)

29
S.No. Study Objectives/ Issues to be addressed
Findings Areas not covered
Tariff restructuring (mismatch in fixed cost and fixed charge) not addressed
Slow on-ground implementation
2. Study on ‘Performance of distribution utilities’
Rising accumulated losses
Compared performance of various utilities
Roadmap for improvement of distribution utilities formulated
Crucial data quality issues still remain
Performance of discoms remains dismal
3. Report on Road Map for Reduction in Cross-subsidy
Little/ no improvement in cross-subsidy levels
Defines the key areas for intervention both for states with high levels of CSS and states with CSS within limits
Tariff issues (cost reflective tariffs and under recovery of fixed costs via fixed charges) haven’t been addressed
Poor financial health of discoms
Tariff setting continues to remain politically motivated
4. Study of various power distribution models in India
Poor efficiency and institutional structure
Rising losses
Highlights benefits of privatisation
Defines utilisation of Universal Service Obligation Fund for services to rural consumers
No action plan for operationalisation of the fund and DBT
No proper roadmap for tariff restructuring, a pre-condition for privatisation

30
4. Reforms in the power distribution sector
The power distribution sector has seen various reforms aimed at improving its overall commercial viability to meet
the central government’s target of power for all by 2022 (see sector performance in Figure 19). The reforms have
resulted in various changes in the sector, including unbundling of SEBs, higher competition, introduction of OA,
reduction of losses, rationalisation of tariffs and financial packages (detailed overview in annexure B.1).
Drawing inferences from studies
The reforms drew inferences from the past studies to address key sectoral issues such as reduction in financial and
operational losses, improvement in institutional set-up, etc. (detailed below). The reforms can be broadly classified
into the following categories:
Figure 1: Classification of reforms
Structural reforms: strengthening the governance and institutional set-up
At the outset, in the late-1990s, state discoms, being publicly owned entities with state government ownership, lacked
accountability and transparency, unlike commercial/ listed enterprises. Their poor performance could be attributed to
shortfalls in governance and an institutional set-up which was politically driven, instead of being controlled by a
regulator. It was realised that unless their governance was focused on performance, the regulator would not be able
to improve the performance of the utilities. Thus, structural reforms were formulated to create a more accountable
and commercial performance-driven culture.
Structural reforms kicked off with the Odisha Electricity Reforms Act, 1995
The major structural reforms started with the Odisha Electricity Reform Act in 1995, which unbundled and
corporatised the Odisha State Electricity Board (OSEB) and developed OERC (Odisha Electricity Regulatory
Commission) to regulate the power sector in Odisha, independent of any political interference (see Figure 20).
Reforms were necessary to control the deteriorating financial health of the OSEB, reduce the widening gap between
peak demand and supply of electricity, introduce competition and attract private investments in the power sector.
However, the reforms process failed to bring the continued benefits due to poor consumer mix, high AT&C losses
(above 39% over fiscals 2007-2015) and the tariff not reflecting costs thus leading to dismal financial performance of
utilities (with losses increasing from ~Rs 2,200 crore in fiscal 2007 to ~Rs 5,600 crore in fiscal 2015) mainly due to
inadequacy of baseline data and poor data quality to carry out the reforms.
Table 3: AT&C losses and financial losses of CESU
2007 2009 2011 2013 2015
AT&C loss (%) 39.90% 39.43% 45.60% 42.88% 39.28%
Losses (Rs crore) 2186 2314 3287 4283 5570
Source: PFC report on performance of utilities
Further the newly formed companies were not able to make adequate capital expenditure in distribution networks
because of this (details in annexure B.3.1).
Structural Operational Financial

31
Electricity Regulatory Commission Act, 1998, strengthened the role of the regulator
Soon after the Odisha reforms, a conference of all state Chief Ministers was held. The Electricity Regulatory
Commission Act, 1998, led to the formation of SERCs by states. It was expected that the formation of an independent
regulatory commission would bring transparency in the tariff determination exercise and improve consumer grievance
redressal mechanism.
While this strengthened the role of the regulator, tariff setting and other processes such as subsidy treatment were
not completely freed from political influence. Data quality and tariff restructuring taking into account the fixed charges
portion of the tariff and cost reflectiveness continue to be an issue. Complexity in tariffs and inadequate push towards
OA remain critical challenges (details in annexure A.2).
The Electricity Act, 2003, turned the sector around structurally
With the Electricity Regulatory Commission Act, 1998, failing to have the desired impact, significant reforms were
envisaged under the Electricity Act, 2003, to turn the sector around. It led to many structural and operational changes
in power distribution sector. It was assumed that the Act would bring in much needed changes such as tariff
rationalisation by independent regulatory mechanism, increased competition through OA, transparent policies
regarding subsidies and safeguarding of consumer interests.
Figure 2: Key features of the Electricity Act, 2003
While there have undoubtedly been many changes in the power distribution sector due to the enactment of the
Electricity Act, the state utilities are yet to completely see the desired results. The boards of the utilities continue to
be state dominated and lack sufficient decision-making authority. This has been a hindrance to tariff rationalisation.
In 2014, the Electricity (Amendment) Bill was passed. The key thrust areas include introduction of carriage and
content separation, i.e. segregation of wires and the supply business; further enabling OA, competition and markets;
greater impetus for renewable energy; and greater accountability of the regulatory institutions.
Despite the Act’s intent of introducing competition in the sector, OA and separation of content and carriage (C&C)
has not taken place at the desired level. Political influence remains the critical bottleneck for increasing the pricing
power of the utilities and reducing the inappropriate levels of subsidy (details in annexure B.3.3).
Privatisation (2002) – move towards commercialisation and performance improvement
The state-owned electricity boards were neither able to pare AT&C losses nor provide end consumers access to
high-quality electricity supply, necessitating the need for privatisation of distribution utilities. It was expected that the
private sector expertise would ensure affordable and reliable electricity supply to consumers across India and
improve the sector’s performance.
The privatisation of distribution licensee was undertaken by two states – Odisha and Delhi. The private distribution
licensee model has been successfully adopted in Delhi, wherein the private entity has been able to bring about key
Unbundling : Unbundling of SEBs
Licence: No Licence for IPPs except for
Hydro
OA : Access to T&D network for consumers
and generators
NEP : Plan to be developed every 5
years
Private participation in distribution
Trading : Introduction of the concept for
power trading

32
changes in governance through its initiatives and reduction in losses (AT&C loss reduction from over 40% in 2002 to
~13% in 20167) leading to improvement in performance (see Figure 21 & Figure 22; details in annexure B.3.4).
However, in the case of Odisha, data quality and higher number of rural consumers led to tariff recovery issues. In
Delhi while the consumer mix is better than Odisha, fixing cost reflective tariffs continues to remain an issue (see
Figure 23 & Figure 24).
Various state governments and their distribution utilities were not comfortable with shifting all their rights/
responsibilities to a private entity. Hence, the concept of a franchisee was put into practice. The key difference
between a distribution-franchise model and a privatised distribution company is that the capital expenditure is not
passed through to consumers under the former, while a private discom recovers that expense from consumers.
Besides, employees from discoms are on deputation and go back to their parent company at the end of the franchisee
period.
It was assumed that the distribution franchisee would help achieve the same objectives expected from the private
sector distribution companies, i.e. improved quality of power with less outages and losses, that too at affordable
tariffs. The franchise model was very successful in Bhiwandi, Maharashtra, where AT&C losses reduced substantially
(mostly owing to the consumer mix of high-tariff consumer base, high load densities and no agricultural consumption),
but not quite as successful in other areas.
Other states had limited success with the distribution franchisee model primarily on account of the consumer mix
(larger rural population base and improper subsidy mechanism), poor data quality and improper risk sharing in
(public-private partnership) PPP mode (details in annexure B.3.5).
Operational reforms: improving power supply and system performance
Besides the structural reforms, the central government also brought in many operational reforms to supply power to
all, strengthening the system to pare down losses and improve the performance of utilities. The key operational
reforms include tariff determination process, OA, R-APDRP, Integrated Power Development Scheme (IPDS),
RGGVY, Deen Dayal Upadhyay Gram Jyoti Yojana (DDUGJY) etc.
RGGVY and DDUGJY for rural electrification
RGGVY was introduced in 2005 for electrification of villages, with free access given to below poverty line (BPL)
families. The scheme provides 90% grant from the central government and 10% loan from the Rural Electrification
Corporation (REC), the nodal agency, to the respective state governments. The scheme was aimed at electrifying
over 1 lakh un-electrified villages, while providing connections to 2.34 crore rural households at an estimated cost of
over ~Rs 50,000 crore.
DDUGJY was introduced as a continuation of RGGVY, focusing on three components:
1) Separation of agricultural and non-agricultural feeders; 2) strengthening and augmentation of sub-transmission
and distribution, including metering of distribution transformers, feeders, and consumer; and 3) rural electrification.
The scheme envisaged a total outlay of ~Rs 44,0008 crore for components 1 and 2, and ~Rs 40,000 crore for rural
electrification (RGGVY carried over to the DDUGJY scheme; see Table 10).
Through the schemes, the central government has been able to achieve its target of 100% village electrification in
2018. 100% household electrification has recently been achieved. However the rise in AT&C losses due to increasing
rural consumer base and poor quality baseline data for electrification purpose continue to remain a challenge (details
in annexure B.4.3).
7 Source – PFC report on performance of state utilities
8 As per the Ministry of Power

33
R-APDRP and IPDS for urban areas
In order to curtail the poor operational performance of the state utilities through a reduction in loss levels and ring-
fencing, the government approved the Accelerated Power Development Programme (APDP) scheme in 2001, with
a provision of Rs 1,000 crore for upgrading distribution systems via 90% grant and 10% loan. Further, the Accelerated
Power Development Reforms Programme (APDRP) was initiated in fiscal 2003 as additional central assistance to
improve the distribution sector’s performance.
In fiscal 2008, the APDRP scheme was revised to Restructured Accelerated Power Development and Reforms
Programme, or R-APDRP, covering urban areas – towns and cities with a population of more than 30,000 people
each. The scheme envisaged reduction of AT&C losses at utility level by 3% per year for the utilities having losses
above 30% and by 1.5% per year for the utilities having losses below 30%.
Figure 3: Difference in AT&C losses from 2007 to 2014 (%)
The estimated outlay required for the RAPDRP scheme (fiscals 2008 to 2017) was Rs 44,000 crore9 with the central
grant of ~Rs 28,000 crore in the Eleventh and Twelfth Plan periods (over fiscals 2008–2017). The Ministry of Power
had budgeted ~Rs 12,000 crore (over fiscals 2008-2015) and final release was only ~Rs 8,000 crore, implying slow
pace of implementation and underachievement of the targets.
The IPDS was introduced in 2014, aimed at reducing the AT&C losses, establishing information technology (IT)-
enabled systems for energy accounting and auditing, improving billed energy based on metered consumption, and
improving collection efficiency with a total outlay of ~Rs 33,000 crore10. Further, the IT component of the distribution
sector and strengthening of the distribution network in the form of RAPDRP for XII and XIII Plans got subsumed in
this scheme and the approved scheme outlay of Rs 44,000 crore carried over to the IPDS.
It was assumed that incentivising the distribution utilities to improve their performance would prompt them to build
efficient infrastructure. There have been improvements on this count in the urban areas. Consumer service is better
with automation of billing processes. However, despite the disbursement of large amounts of funds, the AT&C losses
remain high (details in annexure B.4.4).
Tariff determination by the regulator (2003)
The Electricity Act, 2003, made it compulsory for states to form SERCs. It was a key operational reform aimed at
stonewalling political interference and strengthening the role of the regulator.
9 CCEA note, May 2013; Performance audit report No. 30 of 2016 (CAG)
10 As per the Ministry of Power
20.4919.31 18.44 17.82 17.66
15.12
10.11
6.88 6.264.93
2.49 1.42-1.31 -8.81
-15
-10
-5
0
5
10
15
20
25

34
Despite the fact that SERCs, by and large, now regularly determine the tariff for supply of electricity in almost all
states, the actual electricity tariff still does not reflect the actual cost of supply due to various factors (see Figure 25).
The tariffs for domestic and agricultural consumers continue to remain low as it is assumed their capacity to pay is
low. The fixed charge recovery is also quite low (as detailed in subsequent sections).
The recent Appellate Tribunal for Electricity (APTEL) judgment directing SERCs to suo motu determine the tariff in
the absence of a tariff petition filed by the licensee, is expected to ensure some improvement. However, the gap
between the average cost of supply and average revenue realised (ARR), and non-adherence to cross-subsidy
reduction trajectory, as mandated in the national tariff policy, remain key concern areas (details in annexure B.4.1).
Implementation of OA is still a challenge (2002)
The Electricity Act, 2003, mandated SERCs to introduce an OA regulatory framework within one year to promote
competition and improve performance. Procedural impediments and high cross-subsidy charges continue to deter
private players from entering into OA, as detailed subsequently (details in annexure B.4.2).
Financial reforms: reducing the financial losses of utilities
Other than these structural and operational reforms, the power sector in India was in need of financial reforms from
time to time, primarily to help the discoms pare their mounting losses.
2001: Bailout package to reduce accumulated losses
A bailout package was announced for the SEBs in fiscal 2001, with the assumption that this one-time package would
enable them to clean their balance sheets and improve their operational efficiency in order to ensure timely payments
going forward. The bailout converted Rs 35,000 crore ($7.4 billion) of debt (outstanding arrears of the SEBs) into
state government bonds and waived 50% of the interest outstanding. Thus, a number of states began fiscal 2003
with accumulated losses that were lower than in the previous fiscal. Fiscal 2003 served as the starting point for the
reforms that followed (details in annexure B.5.1).
2012: Financial restructuring package to reduce piling debt burden
The discoms borrowed heavily to strengthen their systems and manage their growing loads, leading to build-up of a
huge financial burden as tariffs and revenues did not increase proportionately. Further, to meet the increasing
revenue deficits due to rising fuel/power purchase costs and tariff constraints by SERCs, the discoms borrowed
heavily, leading to the problem of debt entrapment. The banking sector’s short-term exposure to the discoms reached
an estimated Rs 1.5 trillion in 2012, which was primarily used to fund cash losses. Any slippage on the part of the
discoms to repay these loans could have created a huge non-performing asset (NPA) for the banking sector. The
central government introduced a financial restructuring package (FRP) in fiscal 2012 in order to ease the stress of
the discoms and financial institutions. States took over 50% of outstanding short-term loans, or STLs, including
payables for power purchase, as on March 31, 2012, which was converted into bonds backed by government
guarantees and a moratorium of three to five years with a repayment period of 10 years. The balance 50% of STLs
was restructured into long-term loans by lenders, with a moratorium on principal repayments up to three years, lenient
repayment terms and waiver of penal interest (details in annexure B.5.2).
2015: UDAY to improve performance and reduce losses
Despite the FRP scheme, the discoms continued to make losses. As of March 2015, their accumulated losses stood
at approximately Rs 3.8 lakh crore and outstanding debt at approximately Rs 4.3 lakh crore. The high accumulated
debt made it difficult for them to invest in capital schemes to improve the power scenario in the country. The schemes
initiated by the central government towards 100% village electrification, 24 x 7 power supply and clean energy could
not be achieved without relieving the discoms of this high debt. The Ministry of Power (MoP) launched UDAY in this
regard, which was approved by the Union Cabinet on November 5, 2015. Under the scheme, states had to take over
75% of discom debt as on September 30, 2015, over the following two years – that is, 50% in fiscal 2016 and 25%
in fiscal 2017 (see Figure 27).

35
This has helped the discoms reduce their interest cost burden substantially (to ~8-9%, from as high as 14-15%) and
enabled them to improve their payments to Generators (though payments to IPPs is significantly delayed vis a vis
CPSUs with payments of Rs. 11,000cr11 pending for a period of 60 days and above for IPPs. However, discom
sustainability depends on operational efficiency, especially keeping in mind the addition of new rural consumers and
increasing hours of supply.
There has been some improvement in the loss levels at the national level, with the ACS-ARR gap down to less than
half from Rs 0.76/unit in FY’12 to over Rs. 0.30/unit12 (ranging from Rs. 0.30-0.35/unit) as on Jan’2019. Similarly the
AT&C loss levels have reduced from ~27% in FY’12 to ~20% as on Jan’2019.
And though the UDAY scheme is nearing an end in 2019, the ACS-ARR gap and AT&C loss level continues to be
way off the Rs. 0/unit and 15% target respectively set for FY’19. Thus the complete turnaround of the discoms has
not yet been achieved as envisaged. Most of the major states have failed to achieve the yearly targets set under the
UDAY with high operational losses leading to high gap between ACOS and ARR (see Figure 25, Table 11).
The key reasons for the failure to achieve UDAY targets are baseline data quality and slow operational improvement.
Overall data quality continues to remain an issue. An increase in connection/hours of supply can lead to losses unless
tariffs, USO and DBT are addressed (details in annexure B.3.3).
Some of the states continue to reel under losses (despite UDAY scheme). For these states, private sector
participation could be considered through PPP models & risk sharing mechanisms based on market conditions
(customer profile, per capita income, tariff subsidy, population density etc.) in division/ circle, with complete clarity on
tariff pass through and provision of subsidy. Alternatively, the Government could also consider takeover by a National
Distribution Company.
Summary
While the distribution sector has seen reforms in all the three fronts – structural, operational and financial – the
following areas of concern still remain:
Poor quality of baseline data as well as inadequate capturing of real-time data
While schemes such as the UDAY and R-APDRP envisage a reduction in the AT&C losses, they fail to address
the issues of widening AT&C gaps owing to intensive electrification efforts of last-mile connectivity (addition of
rural consumers)
Tariff structure doesn’t reflect the costs and under recovery of fixed cost through fixed charges in tariffs
The Electricity Act and the NTP envisaged a reduction in cross-subsidy; however, most of the state discoms have
not been able to bring this within the prescribed limits
While unelectrified households are being electrified, USO (i.e. both access and 24x7 supply) and DBT remain
areas of concern
11 As per PRAAPTI (data for Dec’18)
12 As per UDAY dashboard – January’2019

36
5. Empirical evidence of hindrances to OA market
One of the key reforms the Electricity Act, 2003, intended to create was competition in the power distribution sector
through private power player participation. OA i.e. non-utility consumption was aimed at this. It allows consumers to
choose the most economical seller of power, thereby introducing competition and fostering efficiency in the system.
Even though it has been 15 years since OA has been allowed, its implementation remains a challenge. This can be
seen prima facie in the overall short-term market size, which has remained at ~9% during the past eight years. The
OA market is still far from realising its real potential (brief overview in annexure C.2 & C.3).
Methodology adopted for empirical analysis
To understand the pressing issues resulting in the slow growth in the OA market, CRISIL Infrastructure Advisory
(CRIS) undertook an empirical analysis. CRIS has used both primary and secondary sources of information in
undertaking this study (details in annexure C.1).
Majority OA stakeholders consulted
The major stakeholders in the OA domain – IPPs, power exchanges, industry bodies, and OA consumers in major
states – were consulted. CRIS has covered a major share of the OA market through consultations with:
Power producers with ~26,000 MW installed capacity (~35 % of the total private installed capacity)
Power exchanges (with majority OA consumers)
Traders (with more than 7,000 OA consumers registered, accounting for ~25,000 MW of short-term trading and
accounting for over 85% of the overall power trader market in India)
OA consumers from 12 major states across the country covering various industries (Steel manufacturing, auto
manufacturing, chemicals, textile, cement manufacturer etc.)
Ministry of Power for information on OA market and related issues
Central Electricity Regulatory Commission (CERC) for information on OA transactions
State Discoms for gathering first-hand information on the OA market as well as key challenges
Secondary research conducted to analyse the OA market
Along with primary interactions, CRIS also analysed in-house information collected over a period of time and
information available from the Central Electricity Authority (CEA), FOR, and CERC; reports by the Power Finance
Corporation (PFC); the tariff orders of different states; and short-term market trends (including OA share). The major
reports utilitized include-
Growth in electricity sector in India from 1947-2018 (CEA)
Annual Report (CEA)
Report on Short Term Power Market in India (CERC)
Market Monitoring Report (CERC)
Regional Energy Account reports
‒ Northern Regional Power Committee
‒ Eastern Region Power Committee
‒ Western Region Power Committee
‒ Southern Region Power Committee

37
Approach to cover the entire OA market transactions
The OA market allows large users of power (with load of 1MW and above) to buy cheaper power from the open
market. The key idea behind Open Access being that consumers can choose from a large number of competing
companies instead of being forced to buy from existing Discoms, thus enabling them to procure power at competitive
prices.
Post discussion with the key stakeholders (MOP, CERC, IEX, POSOCO and state discoms) – the overall OA market
has been covered considering the following modes of consumption and transactions –
1. Private consumers
‒ Traders/ Bilateral (covering short, medium and long term transactions)
‒ Power Exchanges – IEX and PXIL
2. Railways/ Traction
3. Group Captive Consumers
Another set of consumers is the Group Captive consumers, which are different from the private consumers owing
to two factors –
These consumers are exempt from Cross Subsidy Surcharge
These consumers have a stake in generation units (ownership of at least 26% of equity) and self-consumption
of at least 51% of the power.
Findings
OA transactions (as a % of the overall power market) have dipped in the last year
The overall OA transactions (covering the short/ medium and long term transactions), have grown at a CAGR of 6.3%
(FY 11-18) and in comparison to the overall electricity generation has remained range bound from 15.0% to 17.0%.
However, with overall power market growth outpacing OA growth in the last year, OA transactions as a % of the
overall power market witnessed a dip in FY 18.
Figure 4: OA market vis a vis Indian power market
Source: CEA; Regional energy accounts; Data of key traders; CERC; CRIS estimates
139 157 170 184 192 207 213 214
15.3%
16.6%
16.1%16.3%
15.4%
14.5%
15.0%
15.5%
16.0%
16.5%
17.0%
0
200
400
600
800
1000
1200
1400
1600
FY 11 FY 12 FY 13 FY 14 FY 15 FY 16 FY 17 FY 18
OA market share in the Indian power market (BU)
OA transactions (BU) Overall Energy (BU) % OA transactions

38
Breakup of the OA transactions in FY’18 according to the consumer category indicates that the private consumption
i.e. exchange and traders/ bilateral form only 8% of the overall OA transactions with major share by Group Captive
consumers.
Since both Group Captive and railways transact predominantly through medium/ long term mode, thus highlighting
that majority OA transactions are via the medium/ long term route at over 90%, while the remaining short term OA
transactions are lower than 10%.
OA transactions excluding Group Captive consumption dipped in the last year
The overall OA transaction excluding the Group Captive consumption has dipped from 3.1% (FY’17) to 2.2% (FY’18).
The same is indicated in the figure below:
Figure 5: OA market (excluding Group Captive) vis a vis Indian power market
Source: Regional energy accounts; Data of key traders; CERC; CRIS estimates
OA market (excluding railways & GC) has also dipped
The Indian railways is a deemed licensee under third proviso to Section 14 of Electricity Act and hence is exempt
from Cross Subsidy Surcharges, which other private players have to pay. Thus it is critical to consider the OA
transactions excluding railways & GC also.
On an overall basis, while the OA market excluding railways & GC has grown over the past few years at a CAGR of
~18% (FY 11-18), however it has witnessed a drastic dip in transactions in FY 18:
Figure 6: OA Energy transactions (excluding Railways & GC)
Source: CEA; CRIS analysis
18 22 26 35 30 38 41 31
2.0%
3.2%
2.5%
3.1%
2.2%
0.0%
1.0%
2.0%
3.0%
4.0%
5.0%
6.0%
7.0%
8.0%
0
200
400
600
800
1000
1200
1400
1600
FY 11 FY 12 FY 13 FY 14 FY 15 FY 16 FY 17 FY 18
OA market share (excluding GC) in the Indian power market (BU)
OA transactions (BU) Overall Energy Availability (BU) % OA transactions
58
12
20
14
22
25
17
0
10
20
30
FY 11 FY 12 FY 13 FY 14 FY 15 FY 16 FY 17 FY 18
OA exluding railways & GC (BU)

39
An analysis of the energy accounts and data of key traders, clearly indicates the fact that there have been very limited
long & medium term OA transactions for OA consumers (excluding railways and GC). The long and medium term
power (which comprises 89% of the electricity procured as of FY’18), has been procured mainly by the distribution
companies, a fact well corroborated by CERC, which clearly indicates that the OA transactions via traders/ bilateral
and exchanges represent only a miniscule proportion of the long and medium term transactions.
The key reason for limited medium and long term OA transactions, have been the non-availability of coal
(especially for those plants without a PPA), which has been discussed in detail subsequently.
OA consumers (except railways & GC) continue to transact in the ST market
A very high concentration of OA consumers (excluding railways & GC) continue to be limited to the short term market
(with long and medium transactions limited to only ~10-15% of the OA transactions excluding railways & GC). The
number of OA consumers trading on the Energy Exchanges in India, has increased significantly from 995 as of March
2011 to 4,807 as of March 2018. However, the transaction volumes haven’t picked up significantly, with majority of
the OA transactions concentrated in six states accounting for ~80% of the total consumers.
In the exchange, while the share of transactions by the discoms has increased in the recent years, OA’s share has
declined from ~60% in fiscal 2017 to ~32% in fiscal 2018 owing to a change in CSS (discussed below; details in
annexure Error! Reference source not found.).
Figure 7: Share of OA on Exchange (Short Term Market)
Source: Report on short-term power market in India published by CERC
While OA transactions (via competitive market) have declined, Group Captive transactions have risen
The group captive segment, owing to the fact that it is exempt from Cross subsidy surcharge as per section 42 of
Electricity Act, has been able to witness a rapid growth at a CAGR of 6.1% (over the period FY 2011-18)
31%
60%
32%
0%
10%
20%
30%
40%
50%
60%
70%
-
10,000
20,000
30,000
40,000
50,000
2010-11 2011-12 2012-13 2013-14 2014-15 2015-16 2016-17 2017-18
Share of OA in Exchange
OAC Purchase (MU) Exchange Volume (MU) % of OAC

40
Figure 8: Growth in Captive Power
Source: CEA; CRIS analysis; *Provisional
A rise in the group captive mode is an indicator of the fact that removal of surcharges is an enabler of Open Access
transactions.
The slow growth of the OA market can be attributed to uncertainty in market dynamics and regulations, with yearly
changes in SERC-determined tariffs. Owing to this also private OA consumers do not opt for long-term supply
arrangements. Along with cost-competitiveness, operational issues are the major hurdles to OA. The critical issues
faced by OA consumers can thus be classified into financial and operational barriers which have been discussed
subsequently.
Issues and bottlenecks in OA: financial barriers
CSS and AS continue to remain high
The charges for OA are determined based on the average cost of supply at different voltage levels. These include
eight OA charges. The major ones are wheeling charges, which represent costs related to the network or physical
infrastructure at the target voltage level; CSS to compensate the discoms for the cross-subsidy built into the tariff;
and additional surcharge (AS). Apart from these, there are five charges related to ancillary services. These charges
include renewable purchase obligation (RPO) and transmission charges. In addition, OA consumes are also required
to take network losses into consideration while procuring power.
Among these charges, the highest are CSS and AS, which form 60-70% of the overall cost structure. This makes
them the major determinants of cost-competitiveness for OA consumers.
As per the Electricity Act, 2003, the CSS was to be progressively reduced to make OA more favourable with an intent
to provide consumers various options to choose their supplier. However, the NTP 2016 has revised the formula for
CSS. In comparison with the NTP 2006 formula, this revision has increased the CSS (through higher cost recovery
from OA consumers), thereby adversely impacting the OA market (details in Table 13).
An analysis of Gujarat shows that the CSS is up almost ~Re 1/unit when calculated by the NTP 2016 formula as
against the NTP 2006 (details in Table 14).
Andhra Pradesh, Karnataka, Uttar Pradesh, Uttarakhand, and Rajasthan have increased their CSS and AS recently
as compared with the previous years. The charges have jumped almost 200% in some states, making OA completely
unviable (details in annexure C.5.1.1).
The NTP 2016 has capped the CSS at 20% of the tariff, considering the tariff is determined within the permissible
range of +/-20% of ACOS, while in case of the NTP 2006 there was no such cap. The change in the formula has
increased the overall CSS (details in annexure C.5).
100
150
200
FY 11 FY 12 FY 13 FY 14 FY 15 FY 16 FY 17 FY 18*
Captive Power (BU)

41
Thus, it is important to review the calculation methodology adopted to determine the CSS and AS. It should be
designed to protect the interest of the discoms and OA consumers, while promoting competition.
Short-term market prices have increased in the recent past
Apart from the high charges, supply-side constraints on account of limited availability of domestic coal and high cost
of imported coal have also played a part in slowing down the OA market growth. They have led to increase in the
overall cost of power for generators selling power on the exchange or through bilateral transactions.
The average landed cost of the linkage coal is almost half the cost of the imported coal of the same quality. Even if
we add a premium of 30% (as per the recent e-auctions), linkage coal would be more cost-efficient than the imported
coal (details in annexure C.3.1).
A look at cost of power generation using domestic, e-auction and imported coal shows that it will be difficult for IPPs
to offer power to OA consumers at competitive rates on the exchanges or through bilateral means. Only plants run
on domestic linkage coal can provide some margin for the IPPs.
The market clearing price for the past three years on the IEX has remained in at Rs 2-3 per unit for 80% of the time
in 2016, 62% of the time in 2017, and 16% of the time in the first quarter of 2018 (see figures 38 and 39). This clearly
indicates the opportunity for OA consumers who could trade in this band has reduced substantially during the past
two years. This can be attributed to supply-side constraints as limited coal is available for merchant-based power
plants and there is tough competition from the discoms which procure a large quantum of power through short-term
markets (details in annexure C.5).
Issues and bottlenecks in OA: operational barriers
Most OA consumers are high-tariff consumers (industrial and commercial), who cross-subsidise the other consumers.
From the discoms’ viewpoint, it is critical to reduce mounting losses which may add up further in case they lose their
high-paying consumers to the OA market. Hence, the health of the discoms is a major deterrent in allowing
consumers from shifting to OA.
Coal unavailability
The key reasons for limited medium and long term OA transactions, have been the non-availability of PPAs and
hence coal linkage availability for thermal power plants. In the absence of coal linkages, thermal power plants
are unable to supply power at commercially viable rates to the Open Access consumers.
These norms are stringent and have created an artificial barrier, disallowing the thermal power generators to compete
for supply of energy on a Long/ Medium term basis to the smaller sized OA consumers.
Procedural challenges quoted as major hurdle for OA adoption13
In the stakeholder interaction, six out of every 10 consumers identified operational challenges as a key concern in
their state for effective OA. Some examples of undocumented practices or issues on ground as per interactions with
stakeholders are as follows: Andhra Pradesh, which has stopped issuing new no-objection certificates (NOCs) while
providing extension or renewal of existing NOCs; Maharashtra and Rajasthan, where consumers are charged
unreasonable tariffs or charges which are not applicable; and Odisha, where discoms do not allow intra-state bilateral
transactions due to fear of losing consumers permanently.
There are many such issues which discourage consumers from opting for OA. Getting through the system of
approvals is onerous, resulting in loss of time and resources. Further, consumers fear by applying for OA, they may
antagonise the discoms.
13 The observations are based on consumer feedback and their experience

42
It is also important to note that in 2017, the Competition Commission of India (CCI) observed, based on a case filed
against the Gujarat discoms, that they are using their monopolistic position to reject OA applications (details in
annexure C.6).
Here is what the order said:14
“Based on the foregoing analysis, the Commission is of the considered view that, prima facie, the contravention with
regard to Section 4(2) (b) (i), Section 4(2) (c) and Section 4(2) (e) of the Act is made out against OP-2, which warrants
detailed investigation into the matter. The DG is, thus, directed to carry out a detailed investigation into the matter, in
terms of Section 26(1) of the Act, and submit a report to the Commission, within 60 days.”
OA applications continue to be rejected on unreasonable grounds
CRIS team interacted with various state discoms & requested data on OA applications to analyse the overall %
rejection & key reasons thereof. The key states discoms which were requested for data via telephone, on mail,
meeting in person include –
Haryana
Punjab
Rajasthan
Uttarakhand
Uttar Pradesh
Himachal Pradesh
Madhya Pradesh
Chhattisgarh
Jharkhand
Bihar
Maharashtra
Kerala
Karnataka
Andhra Pradesh
Telangana
Tamil Nadu
None of the state discoms reverted to mails requesting OA applications, rejections and their pendency, despite
reminders. Even on verbal communications & interactions with state discoms not much information on OA
applications was shared, clearly substantiating the fact that proper documentation is missing and there is a need to
capture and document the data at the central level.
An analysis of the data wherever available, through secondary research (state SLDCs) is indicated below:
1414 HPCL Mittal Pipelines and GETCO, SLDC (GETCO), PGVCL Competition Commission of India. Case no. 39 of 2017

43
Table 4: OA applications & rejections
S. No.
State Year No. of OA application received
No. of OA application rejected
No. of OA applications pending
1 Uttar Pradesh 2018-19 194 6 Data not available
2 Gujarat 2016-17 4298 272 Data not available
2017-18 3458 213 Data not available
2018-19 2026 79 Data not available
3 Tamil Nadu 2018-19 763* Data not available 14
Source: State SLDCs *Data available for 5 months
The above data also highlights that complete data needs to be captured and maintained by all the states.
Based on interaction with other stakeholders, lack of transparency and absence of clearly documented policies are
some of the most common reasons for rejecting applications, as indicated below (details in annexure C.6 & C.7):
a. Rejection of a new application due to some undocumented polices adopted at the discom level
b. No formal communication provided by the discoms for rejecting the application
c. In some cases, no new OA applications have been entertained, and only existing OA consumers are being
allowed to extend their short-term OA
Some of the other reasons for rejection include constraints in operational factors, as mentioned below:
a. Disputed arrears of the consumer
b. The report on the installation of the system enhancement module (SEM) is not in the latest format; it is issued by
the discoms’ own department.
c. Transmission-related constraints
d. Mixed feeder-related constraints
OA consumers face major hurdles in raising these issues as they fail to obtain sufficient evidence since these
incidents do neither have records nor any documentary trail. Also, the fear of the discoms plays a major role in
restricting consumers from raising their concerns.
A critical finding of the discussion is that transparency and lack of documented procedures in the functioning of the
discoms is a crucial impediment to the growth of the OA market.
CRIS recommendations
Reduce CSS
Cross-subsidy for many of the industrial and commercial consumers is still higher than the prescribed limit in the NTP
of 2016. To improve the OA market and bring in efficiencies through private sector participation, the commissions
should follow guidelines given in the NTP 2016 and Electricity Act, 2003, and gradually bring the CSS under the
prescribed limit.
Adopt uniform methodology to calculate OA charges
The NTP 2016 clearly mandates that the OA charges should not be so onerous that they kill competition. A competent
body at the central level can regularly take stock of the OA situation on the ground and ensure the consumers are
given a fair deal. Prescribing a uniform methodology for determining AS and re-evaluating the CSS formula provided
in the NTP 2016 are also required.
Implement DBT for subsidised consumers

44
The CSS needs to be reduced. NTP 2016 mandates implementation of DBT for domestic/ agricultural consumers in
a phased manner. This will improve energy accounting and help better target the subsidy, through segregation of
consumers on the basis of the need of subsidy.
The subsidy for target consumers could be paid through State Budget, directly to the consumers through DBT, which
could in effect also improve financial health of the discoms.
Set up online registry to improve transparency at the state level
If the consumer seeks OA up to their contract demand, there should be an automatic provision (if possible without
involving the discoms) to allow the validity of such an NOC up to a minimum period of one year. Further, the system
of issuance of NOCs for OA is largely manual in most states and requires endless paper work. Transparency at the
SLDC can be increased by:
Setting up an centralized online platform & monitoring mechanism to accept applications of OA consumers
Defining reasons for possible rejection
Limiting interaction with the discom during the application process
Creation of accounts for OA consumers and making applying for multiple short-term OA easy
Document reasons for denial of OA
The platform could be created by MOP. State Discoms & respective agencies could be given separate login IDs
for providing NOC
Clear guidelines on requirement and possible list of reasons for rejection should be circulated
After an application is submitted, many OA consumers face rejections on frivolous grounds without proper
explanation. This discourages consumers from applying for OA. Some steps which can help solve this issue are:
The discoms/ the SLDC should provide an acceptable justification and reason for rejecting applications
The discoms /the SLDC should provide a dos/don’ts checklist for consumers applying for OA
Maintenance of a registry and transparent records (at the central level as well)
Unlike the SLDCs, the RLDCs, who process similar applications for inter-regional OA consumers15, provide a
systematic process of application processing and disposal. The system can be replicated by the SLDCs to improve
transparency at the state level. Currently, the SLDCs do not display or disclose the applications rejected. However,
the RLDCs maintain a systematic data base on the number of applications received and rejected on a daily basis.
Coal allocation to all the plants (with or without PPA)
The LTSLC (Long Term Standing Linkage Committee) has not awarded Coal linkage to any plant since 201016.
Further with requirement of long term PPA as a pre-condition to allocation of coal linkage most of the thermal power
plants end up without coal. In the absence of coal linkages, power plants are unable to supply power at commercially
viable rates to the Open Access consumers.
Thus there is a dire need for coal allotment to all the plants (with or without PPA).
15 https://nrldc.in/nrldc_scripts/stoa2.php
16 Source – Press Information Bureau

45
Key issues and way forward
S No Issues Way forward
Financial barriers
1.
CSS and AS continue to remain high
NTP 2016 has revised the formula for CSS, which, in comparison to the NTP 2006 formula, has resulted in an increase in the CSS
Reduce the CSS going forward as per the Electricity Act, 2003
Uniform methodology to calculate OA charges
Implementation of the DBT scheme to better target subsidised consumers 2.
Short-term market prices have increased in the recent past
Limited options for procuring coal in domestic market and high comparative cost of the imported and e-auctioned coal has also increased the overall cost for power generators, leading to a squeeze in margin for OA consumers
Operational barriers
1.
OA applications continue to be rejected on unreasonable grounds
Lack of transparency and clearly documented policies, and constraints in operational factors
Online registry to improve transparency at the state level
Clear guidelines on requirements and a list of reasons for possible rejection
2.
Coal & connectivity remains restricted
Lack of PPA limits thermal power plants to sell electricity to OA consumers on a long/ medium term
Coal for all

46
6. Model to implement carriage and content
The OA market has not been able to achieve its full potential, owing to high OA charges, inability of discoms to
recover their fixed costs, high level of cross-subsidisation, lack of transparency in providing NOCs, etc.
The Electricity Amendment Bill, 2014, was proposed to boost competition in the Indian power space through the
restructuring of the distribution and supply businesses. As per the amendment, power distribution is to be separated
from the retail portion, i.e. carriage (distribution network) and content (electricity supply business) or C&C are to be
separated. The aim was to provide consumers with more suppliers to choose from, as the amendment proposed
multiple supply licensees to share space within a particular distribution area. However, the amendment has not been
enacted owing to challenges in its implementation.
In 2015, FOR commissioned a study on supplying electricity via OA. The report, ‘Rollout plan for introduction of
competition in retail sale of electricity,’ envisaged a three-stage implementation for separating C&C, beginning with
functional segregation of discoms, laying the groundwork for competition, and encouraging competition (detailed in
Figure 49). The process was to take 5-6 years at the national level owing to various complexities because of multiple
stakeholders. Many of the issues, such as development of a wholesale market, cost-reflective tariff and treatment of
losses, are still prevalent and require policy level intervention by the government, in consultation with state
governments. Until these are addressed, introducing competition will be challenging (refer to annexure D.1 for
details).
Model for separating C&C
The study pointed out key issues that need deliberation and a policy framework to separate C&C in the power
distribution sector:
Area Options
1 Formation of intermediary company
Jurisdiction of intermediary company - state- or discom-wise
Ownership of intermediary company - government or private
Payment obligations of power purchase agreements (PPAs) - Intermediary company acts as a clearing house or supplier pays directly to generators
2 Defining roles and responsibilities of new entities (ambiguous roles)
Customer interface
Commercial loss reduction
Ensure contractual availability of power to customers
Demand aggregation of multiple retail supply companies to enable efficient power procurement
Handling of unrecognised financial losses
Meter reading
3 Treatment of existing financial losses
Amortisation of regulatory assets
– Collection of universal charge
– Support from state government
– Hybrid approach
Amortisation of unrecognised financial losses
– Directing incumbent distribution and supply companies to take a financial hit
– Allow recovery of unrecognised financial losses
4 Transfer of existing PPAs
Transfer all PPAs to intermediary company
Transfer certain PPAs to intermediary company (for instance, certain expensive PPAs or PPAs of plants older than 12 years that have repaid their loans can be dissolved. Thus, their power is to be sold through the wholesale market whereas the remaining PPAs are to be transferred to the intermediary company

47
Area Options
Transfer partial PPAs to intermediary company (a certain percentage of power from all PPAs could be transferred to the intermediary company while the rest of the power is to be sold in the wholesale market)
5 Defining framework for customer interface
Single-window interface by retail supply company
Single-window interface by distribution company
Separate interfaces for distribution and supply/metering. Multiple interfaces will require consumer awareness campaigns
6 Tariff setting mechanism for new entities
SERCs will determine unbundled tariffs individually for distribution business, retail supply business, and intermediary company
While tariff will be calculated separately for new entities, the responsibility for collection will lie with the retail supply business. A mechanism will have to be developed for financial settlement between the distribution business, retail supply business, and intermediary company
7 Balance sheet segregation
No. Allocation of Allocation based on Allocated to
1. Fixed assets Transfer scheme Distribution or supply company
2. Long-term liabilities Fixed asset allocation Distribution or supply company
4. Current assets - Receivables Consumer base Intermediary company
5. Current assets – Security deposits
Consumer base Supply company
6. Current assets – Contractors guarantees
Fixed asset allocation Distribution or supply company
8. Current liabilities – Power purchase
Existing PPA allocation
Intermediary company
9. Current liabilities – Contractor payments
Fixed asset allocation Distribution or supply company
8 Phasing of retail supply competition
Based on increasing or decreasing connected load
Based on increasing or decreasing annual energy consumption
Based on area of supply
Based on consumer categories
9 Allocation of technical and commercial losses between distribution and supply companies
Allocation of collection losses to retail supply company and remaining losses to distribution company
Allocation of technical losses and pegging loss to distribution company and remaining losses to retail the supply company (difficult to implement; requires extensive meter readings)
Allocation of all commercial losses (collection inefficiency, meter tampering/bypassing and hooking losses) to the retail supply company and technical losses to the distribution company
While FOR has extensively deliberated on a separate C&C, a model is required for restructuring tariffs, and
implementing USO and DBT.
Key area: Tariff mismatch and restructuring
A critical aspect that is hindering competition/ C&C is the existing mismatch between fixed cost realisation and tariffs.
The mismatch impacts a discoms financial viability. (Key components of the fixed costs detailed in section 9)
An analysis of the costs (fixed and variable) vis a vis revenue (fixed and variable) as depicted in the tables below
highlights the mismatch across various states –
Gujarat utilities - Fixed cost vs Fixed Charge

48
Particulars Break-Up of Cost % Break-Up of Revenue %
Fixed Component 43% 27%
Variable Component 57% 73%
Cost/Revenue (FY 16) 100% 100%
Fixed charge hike required to meet fixed costs - ~74%
Madhya Pradesh utilities - Fixed cost vs Fixed Charge
Particulars Break-Up of Cost % Break-Up of Revenue %
Fixed Component 58% 15%
Variable Component 42% 85%
Cost/Revenue (FY 16) 100% 100%
Fixed charge hike required to meet fixed costs - ~354%
Chhattisgarh CSPDCL - Fixed cost vs Fixed Charge
Particulars Break-Up of Cost % Break-Up of Revenue %
Fixed Component 49% 23%
Variable Component 51% 77%
Cost/Revenue (FY 17) 100% 100%
Fixed charge hike required to meet fixed costs - ~142%
Karnataka BESCOM - Fixed cost vs Fixed Charge
Particulars Break-Up of Cost % Break-Up of Revenue %17
Fixed Component 36% 11%
Variable Component 64% 89%
Cost/Revenue (FY 17) 100% 100%
Fixed charge hike required to meet fixed costs - ~213%
Maharashtra MSEDCL - Fixed cost vs Fixed Charge
Particulars Break-Up of Cost % Break-Up of Revenue %
Fixed Component 46% 17%
Variable Component 54% 83%
Cost/Revenue (FY 16) 100% 100%
Fixed charge hike required to meet fixed costs - ~181%
17 Numbers as per commission approved; Slight variation may be expected post true up of the numbers

49
Uttrakhand UPCL - Fixed cost vs Fixed Charge
Particulars Break-Up of Cost % Break-Up of Revenue %
Fixed Component 54% 13%
Variable Component 46% 87%
Cost/Revenue (FY 16) 100% 100%
Fixed charge hike required to meet fixed costs - ~307%
Most of the utilities (as studied above) require high fixed charge hikes ranging from 75- 350% to match the fixed
costs. Loading of large portion of the fixed costs on the energy charges, makes the energy charges as a proportion
of the Discom total revenue significantly high.
A huge amount is recovered from energy charges (per unit of electricity supplied) and major share of such costs are
recovered through Commercial and Industrial consumers of the Utilities.
The challenge arises for the distribution utilities when the industrial or commercial consumers opt for an Open Access
(OA), which results in under recovery of fixed costs. As more consumers move to open access, there is a possible
worry of Discoms on account of under recovery of fixed costs and therefore exacerbating the Discoms poor financial
health.
If the full recovery of the distribution wires business is achieved, which has a major share in the total fixed costs of
the utility, there would not be any open access charges levied to OA consumers. In this case discoms will be revenue
neutral to OA and will be able to support competition in the long run, whether it is in the form of OA or C&C. Thus to
enable content carriage separation and open access, it would be important that fixed cost recovery is in same
proportion of fixed revenue.
Key area: Subsidy delivery
USO through DBT could improve subsidy delivery to targeted consumer (with payment via state budget)
USO is the practice of providing a baseline level of services to every consumer. It can be split into two obligations:
The duty to connect – Owned by the distribution business
The duty to supply – Owned by the retail supply entity
The duty to connect a consumer lies with the distribution business, whereas the duty to supply is with the retail supply
provider, wherein if a consumer approaches a retail supplier and demands supply of electricity and service at the
same cost as other consumers in the same category, the retail supplier is obligated to fulfil the demand.
The key steps to integrate USO with separation of C&C are:
Ceiling tariff set by the regulator - with certain DBT to consumers, based on units consumed
Accountability is with retail supplier to supply to a certain proportion of subsidised consumers
Retail supply entity to segment consumers based on units consumed, and not purely based on consumer category
Regulator to define DBT slabs based on units consumed and not purely on consumer category

50
DBT – While there is subsidy to the domestic and agricultural segments, which encourages electricity consumption,
higher tariffs charged to commercial or industrial consumers increase the cost of services. High cross-subsidy leads
to revenue loss for state utilities, as it incentivises industries to scale up captive power generation. The need to
reduce cross-subsidy and at the same time to keep rural tariffs low, DBT is one of the solutions.
Under DBT, the subsidy (with payments through state budget) can be transferred directly to the beneficiary’s bank
account. If the DBT scheme is implemented, only the actual consumption will be subsidised and not power pilferage
or loss.
State governments give subsidy payments to discoms for selling electricity to consumers below the procurement
cost. However, the payments by the states are not made regularly, adding to the financial burden of discoms. For
proper implementation of DBT, states would need to identify and takeout separate budgetary allocation for subsidized
consumers.
If the DBT scheme is implemented efficiently, it will cut down the losses of discoms. In fact, implementation of DBT
will help control delays in transferring benefits and reduce structural expenses in distributing the subsidies.
Online real-time transactions bring transparency to the system and allow implementing agencies to monitor the flow
of funds and prevent leakages. As the DBT mechanism would be online and interoperable, it could be used for a host
of other functions, such as bill payments, etc. (key stakeholders in the DBT framework are outlined in Figure 50).
It is critical to integrate separation of C&C with DBT to enable competition and enhance the efficiency of the power
distribution system, which are detailed in annexure D.1.3.
Measures for DBT implementation
Ministry/department to set up a DBT cell
DBT cell to identify DBT schemes or DBT components and study process/fund flow
DBT cell to develop IT-based system/MIS, create a grievance redressal unit and train officials
Ministry/department/state department/implementing agency to identify beneficiaries
Ministry/department/state department/implementing agency to digitise beneficiary database after verification
Public Financial Management System to send bank/postal account and Aadhaar details of beneficiaries to banks
and the National Payments Corporation of India for validation
Way forward
To ensure competition in the distribution sector, there needs to be a consensus between the Centre and state
governments to resolve issues pertaining to:
Role of intermediary company
Treatment of existing financial losses
Tariff determination process and universal charges
Segregation of existing PPAs
Supply mandate (USO), enabled through DBT with payments via State Budget
Even though these issues need to be addressed before proceeding with the separation of C&C, as a pre-requisite it
is critical to develop a cost-reflective tariff structure (fixed and variable cost recovery mechanism) and introduce DBT
for subsidy transfer.
If tariff rationalisation is introduced and DBT is implemented, competition through OA can flourish and provide a
platform for further reform. Cost recovery will also financially shield discoms in the event of consumer migration. DBT
will help in ensuring direct subsidy to the needy as well, and help discoms recover their full cost.

51

52
7. Regulatory effectiveness in addressing OA issues
Tariffs are not cost-reflective, thereby hampering financial health of discoms
Despite structural reforms, the tariffs determined for discoms still do not reflect the cost of supply, owing to high AT&C
losses and regulatory assets created due to partial approval of the actual cost. Instead of penalizing discoms for not
meeting the AT&C loss level targets, SERCs have relied on creating regulatory assets. The gap in tariff versus cost
has led to a high proportion of short-term loans to meet the power requirement. The issue has snowballed, and has
become unmanageable for discoms.
The financial health of discoms can also be correlated with the consumer mix in the tariff structure. Higher the
industrial consumers, better the realisation. Greater the number of subsidised consumers, greater is the cash crunch
owing to delay in realisation from consumers and government providing the subsidies. Apart from this, the contribution
of such consumers in total revenue is marginal, compared with the effective voltage-wise cost of supply. (Refer to
annexure E.1.5 for details.)
SERCs have not been able to resolve financial barriers faced by discoms
To enhance competition in the distribution sector, it is critical to address the barriers faced by discoms and improve
their commercially viability. The root cause of barriers in introducing competition can be linked to issues faced by
discoms – high number of subsidised consumers; cash flow, tariff and subsidy issues; complicated tariff structure;
and high AT&C losses. These issues are by-products of inefficiencies among discoms, which continue to incur
operating losses even after multiple attempts of bail-out schemes by the Centre and state governments. These issues
have hobbled discoms in a vicious cycle of raising debt to fund their losses. Even SERCs have been unable to take
any bold steps to help discoms (refer to annexure E.1 for details).
Complexity in tariff created by SERCs
The states have numerous categories and sub-categories/slabs in their tariff structures with no consistency among
states, thereby increasing the complexity. In addition, states follow different mechanisms to recover costs, apart from
two-part structure such as monthly minimum charge for domestic consumers in some states (refer to Section 10 for
details).
Cross-subsidy followed by SERC
The cross-subsidy for industrial consumers in Gujarat, Tamil Nadu and Madhya Pradesh is higher than 20% of the
average cost of supply. Even though NTP 2006 and NTP 2016 prescribed a criteria for cross-subsidy, where a
gradual reduction on cross-subsidy was envisaged, still many states have been able to reach only the 20% mark.
This has also resulted in higher tariffs, which are being used in calculating the cross-subsidy surcharge (CSS) in the
formula determined in NTP 2016.
Of the 10 states, four still have cross-subsidies higher than 20% of the average cost of supply.

53
Figure 9: Cross-subsidy for industrial consumers
Source: SERC Tariff Orders 2018-19
There is also a widening gap between the tariffs of subsidising and subsided consumers. As a standard practice in
most states, the gap is covered with additional subsidies from the state government.
DBT implementation far from achieved
In DBT, subsidies are transferred directly to the beneficiaries’ bank accounts. If the DBT scheme is implemented,
only the actual consumption will be subsidised and not power pilferage or losses. This will reduce the burden of
cross-subsidy on consumers. However, the same has yet not been implemented by the SERCs (refer to Section 6
for details).
Increasing OA charges (contrary to promoting competition)
The CSS is payable by all OA consumers, except those who have established captive generating stations. The
formula for calculating CSS, as adopted by NTP 2016, has increased the cross-subsidy surcharge. In the case of
Gujarat, cross-subsidy surcharge was Rs 1.47 per unit in 2016 as compared with Rs 0.52 per unit in 2006.
Table 5: Comparison of CSS (Gujarat case study)
Particulars (Rs kWh) Surcharge (NTP 2016) Surcharge (NTP 2006)
Tariff payable by relevant category of consumer (T) 7.34 7.34
Cost of power purchase (C) 4.2218 6.0719
Wheeling charge (D) 0.15 0.15
Losses (L) 10% 10%
Cost of carrying regulatory assets (R) 0 0
Surcharge (S) as calculated using formulae 2.51 0.52
Applicable cross-subsidy surcharge as per the policy 1.47 0.52
Source: Tariff orders published by GERC (for 2016 calculation) and CRIS analysis (for 2006 calculation)
18 C is the per unit weighted average cost of power purchase by the licensee, including meeting the Renewable Purchase Obligation
19 For the purpose of calculation, the value of “C” has been taken from the GERC tariff order issued for 2016, as determined by the Commission,
based on Tariff Policy 2006. Assumed the same will remain applicable for the current year as there is no change in the power purchase portfolio.
C is the weighted average cost of power purchase of top 5% at the margin, excluding liquid fuel-based generation and renewable power
0%20%40%60%80%
100%120%140%
Ra
jasth
an
Ma
ha
rastr
a
An
dh
ra P
rad
esh
Utt
ar
Pra
desh
Ka
rna
taka
Gu
jara
t
Ta
mil
Na
du
Him
acha
l P
rad
esh
Bih
ar
Ma
dh
ya
Pra
de
sh

54
Clearly, the SERCs have been unable to restrict the cross-subsidy levels, promote competition, simplify the tariff
structure, and rationalise tariffs to reflect costs.
Way ahead
CERC and FOR can play a critical role in reducing the CSS through providing a guiding framework to reduce CSS,
introduce DBT and monitor its implementation. State commissions should follow the guidelines and not provide
leeway to the discoms.

55

56
8. Inability of discoms to buy low-cost power
Despite the three financial reforms, the finances of discoms remains precarious, raising doubts on the discoms’ ability
of purchase power even through cheaper sources. Even UDAY has not been able to improve the situation, with
discoms unable to pay their power bills on time. The outstanding dues of central public sector undertakings have
been on the rise, except in 2017, where the dues declined because of UDAY – Rs 18,891 crore in May 2015, Rs
20,039 crore in August 2016, Rs 12,923 crore in August 2017, and Rs 14,447 crore in November 2017.
CRIS analysed creditor and debtor days of discoms and their procurement pattern from different sources to assess
the reasons for their inability to procure even low-cost power, their financial position, and fixed-cost liability from long-
and medium-term PPAs.
Cash-flow issues with discoms
Currently, the fixed cost of discoms is not reflected in the fixed charges, thereby lowering fixed revenue realisation.
This translates into cash flow issues and prevents discoms from buying more electricity.
Further, the financial health of discoms depends on the level of tariff approved by the SERC and the consumer mix.
The tariff level helps to recover the cost incurred during the year, while the consumer mix helps in maintaining the
required cash flow. Higher the share of industrial consumers, better the realisation. In contrast, greater the number
of subsidised consumers, greater is the cash crunch owing to delays in subsidy realisation. Therefore, commercial
and industrial consumers play a dual role, where they subsidise consumers and contribute towards liquidity of
discoms to manage their liabilities (detailed in annexure E.1.3.).
Consumer mix plays an important role in debtor days
Any delay in receiving money from consumers has a cascading effect on debtor days. It has been observed that
states with higher proportion of subsidised consumers have higher debtor days. For instance, Gujarat has debtor
days of 20-22 days with a high proportion of industrial consumers, while in Maharashtra, agricultural sales are
equivalent to industrial sales and, accordingly, its debtor days is at 160. Similarly, Bihar (127), Haryana (73),
Jharkhand (149) and Uttar Pradesh (365) have high debtor days owing to higher agriculture consumer base (detailed
in annexure E.1.3.).
Subsidy disbursal
Delays in subsidy realisation from the state government leads to a cash crunch. As a result of the delay in the cash
cycle, discoms are dependent on C&I consumers for providing adequate cushion to their working capital. This leads
to resistance in providing OA to such consumers.
If we compare the ratio of creditor/debtor days, states having a higher ratio have higher working capital. This can be
seen for Andhra Pradesh, Haryana, Punjab, Telangana, and West Bengal.

57
Figure 10: Creditor to Debtor days
Source: PFC report on performance of utilities
Cost of power from long-term sources
High quantum and cost of tied-up power
The ability of discoms to purchase power from the open market also depends on its current tied-up power. In case
higher capacity of power is tied-up, the ability of discoms to procure power from the short-term market at lower cost
becomes difficult, considering the fixed-charge liability (refer to Figure 59). Unless there is an abnormal increase in
demand or an issue with the supply source, discoms with tied-up power will refrain from procuring power from the
open market. Gujarat, Karnataka and Rajasthan have almost 100% of their maximum demand tied up, which gives
them limited room for procuring power from the open market (refer to annexure E.1.4 for details).
Way ahead
Discoms are struggling to manage their cash flows with high debtor/creditor days and tied-up power. However,
discoms’ tariffs should reflect the consumers’ actual cost of supply and risks associated with it.
Fixed charges to reflect fixed costs
Fixed charges, if made reflective of fixed costs, will lead to higher fixed revenue. This will improve the cash flow
position of discoms, thereby allowing them to procure more power at cheaper competitive prices.
Introduce DBT and USO
If DBT can be introduced for subsidised marginal consumers, it will help discoms manage cash flows more promptly.
Discoms will also be able to procure power from the open market to meet their 24x7 obligation. Lower cost of power
could be utilised to implement USO and thereby reduce stress on the ACS-ARR gap.
2.69
1.79
0.82 1.36
0.18
1.08 0.57 0.58
0.90 0.96
1.71
3.03
0.41
1.41 1.57
- 0.50 1.00 1.50 2.00 2.50 3.00 3.50
An
dh
raP
rade
sh
Assa
m
Bih
ar
Ch
att
isg
arh
Gu
jara
t
Ha
rya
na
Jh
ark
ha
nd
Ke
rala
Ma
dhya
Pra
de
sh
Ma
hara
shtr
a
Pu
nja
b
Ra
jasth
an
Tam
il N
ad
u
Utt
ar
Pra
desh
West
Ben
gal
Te
lan
ga
na
Creditor/ Debtor days

58
9. Under-recovery of fixed cost by discoms
A critical aspect that has hindered competition in the sector is the mismatch between fixed and variable cost
realisations and tariffs. It is crucial to analyse this variance to understand the impact on the cash flow of discoms.
Assessment of states to build evidence of cost under-recovery
CRIS analysed the mismatch in the fixed and variable cost recovery of discoms in Gujarat, Chhattisgarh, Karnataka,
Madhya Pradesh, Maharashtra and Uttarakhand through their existing tariff structure. The analysis includes
bifurcation of their cost and revenue. The components of fixed costs for a Discom are –
Power purchase cost/ Capacity Charges: ~30%-40% is fixed in nature depending on the extent of thermal /
coal based power
Operations and Maintenance (O&M) Expenses consisting of Employee Expenses, Repairs and Maintenance
Expenses, Administrative and General Expenses [100% fixed]
Depreciation of fixed assets [100% fixed]
Interest on Working Capital consisting of receivables, O&M for one month and consumer security deposit
[100% fixed]
Interest on financial charges and Return on equity [100% fixed]
Provision for Bad and Doubtful Debt [100% fixed]
Non-Tariff income[100% fixed]
Mismatch in fixed and variable cost recovery
Retail tariff comprises two parts: fixed/demand charge and energy/variable charge. In the case of large consumers,
such as industrial and traction, time-of-day (ToD) tariff is also applicable to flatten the demand curve for discoms
during peak hours. The tariff determination process takes into consideration all cost components, starting from power
procurement, transmission charge, operating cost, depreciation, interest, and return on equity. All these costs are
later matched with revenue, based on the projected energy demand.
However, the amount of fixed cost allocated to fixed charge have been disproportionate, with only nominal increase
over the years:
Gujarat - Rs. 45 per month (2011) to Rs 70 per month (2018)
Uttar Pradesh – Rs 50 per kW per month (2005) to Rs 80 per kW per month (2017)
Karnataka - Rs 30 per kW20 (2008) to Rs 60 per kWh (2018)
Uttarakhand – Rs 300 per month (2004) to Rs 22021 per month (2018)
The majority of discoms have a similar bifurcation of fixed and variable cost recovery structure. This approach has
led to loading of all incremental cost on energy-related components of consumers, and has increased the risk of any
change in the sales mix.
This kind of tariff mismatch in the cost structure has also led to a mismatch in the cash flow of discoms, as they have
a fixed-charge obligation to generating and transmission companies, irrespective of the quantum of power procured,
20 Above 1 KW demand Urban Domestic Consumers BESCOM
21 2018 tariff schedule has fixed charges instead of minimum charges

59
besides their own fixed-cost liabilities. As the major part of fixed cost is recovered through energy charges, the fixed
cost recovery for most states remains poor. (Refer to annexure E.1.5E.1.3 for details.)
Underlying issues owing to misalignment
It is also important to note that most of the subsidised categories pay lower fixed charges compared with industrial
and commercial consumers. This is because of high cross-subsidies built into these consumer categories, leading to
a skewed tariff structure.
A case study of Delhi has been analysed, where Delhi Electricity Regulatory Commission (DERC) has set the demand
charge for consumers, reflecting the actual fixed cost liability. (Refer annexure E.2 for details.)
Case study – Rationalisation of tariff structure in Delhi
The DERC has simplified the tariff categories and also rationalised the tariff structure. It has increased the fixed
charges and reduced the energy charges across consumer categories to make tariff and revenue reflective of the
actual cost incurred by the distribution licensee.
As per the earlier mix of cost and revenue recovery, the total fixed cost in the ARR was ~45% as against revenue
from fixed charges at ~10%, whereas the variable cost component in ARR was ~55% as against revenue from
variable charges at ~90%.
After the rationalisation of tariffs, the new mix of cost and corresponding revenue recovery is:
Components of tariff
Old tariff structure Amended tariff structure
ARR Revenue % under recovery
ARR Revenue % under recovery
Fixed 45% 10% (35%) 30% 26% (4%)
Variable 55% 90% 35% 70% 74% 4%
It is evident that the tariff is now more reflective of the actual cost being incurred by the utility. Further, with this tariff
rationalisation, the DERC has ensured that domestic consumers are not impacted by the increase in fixed charges.
Way forward
Taking cue from DERC, a guiding framework could be developed, which can focus on judicious tariff realisation.
Discoms need to adopt systemic changes rather than seek financial support, which lasts only for a few years and
ends up as a debt trap after a few years. Also, most discoms do not pay central generating stations on time because
of the skewed tariff realisation structure, and end up paying late-payment surcharge, which could be avoided by
restructuring the tariff components.
Introducing DBT/USO (with payments through State Budget) can also help discoms manage their cash flow and ease
the cash flow issues. Towards this Forum of Regulators could come up with guidelines to reduce under recovery of
full costs by the Discoms.

60
10. Complexity in retail tariff structure
Apart from determination of tariff levels by SERCs for recovering the ARR for discoms, issues such as credit-to-
debtor cycle and imbalance in retail tariff to recover fixed- and variable-cost components are crucial to ensure the
financial health of discoms. These also impact the ability of OA consumers to competitively procure power, as
envisaged under Electricity Act, 2003.
Apart from tariff levels, the complexity of the tariff structure plays an important role in building transparency and
limiting the discretionary power of discoms. A simpler tariff structure helps easy understanding by consumers of the
tariffs determined by SERCs and builds trust in discoms. On the other hand, creation of many different categories
gives discretionary power to discoms while charging tariffs.
This section covers the importance of simplifying the tariff structure and thereby promoting competition in the
distribution sector.
States and parameters studied to assess tariff complexity
CRIS has analysed the tariff structures of Delhi, Haryana, Karnataka, Punjab, Rajasthan and West Bengal. The
parameters that have been assessed while comparing the complexity of the tariff structure are:
Tariff level for different consumer categories
Current tariff framework and gaps
Approach to identify and target lifeline consumers
Consumer categories and consumption slabs
Case study of Delhi
(Refer to annexure E.1.3 for details.)
Complexity in tariff structure
To understand the complexity of tariffs, we have compared the number of sub-categories and slabs in the states.
The number of categories vary from as low as eight in Rajasthan to as high as 18 in Gujarat. The number of sub-
categories/slabs within these categories vary from 14 in Delhi to as high as 72 in West Bengal. Also, the number of
sub-categories/slabs in the domestic category vary from 6-14; in commercial, 1-17; in industrial, 1-14; in railways, 1-
4; in agriculture 1-5; and others, 4-27.
In addition to the number of categories and slabs, states follow different recovery mechanisms, apart from a two-part
structure.
In Haryana, the concept of monthly minimum charge (MMC) is prevalent for domestic consumers, where no fixed
charges are built. Punjab also followed the MMC method until 2017; however, it has changed. In Rajasthan, fixed
charges are billed on consumption level, whereas in Gujarat it is billed on contracted demand.
Haryana Punjab Rajasthan Gujarat Karnataka West Bengal Delhi
No of categories 15 17 8 18 12 9 9
No of slabs 45 43 25 34 62 72 14
Complexity Moderate Moderate Simple Moderate Complicated Complicated Simple
From the table, it is evident that there is no consistency in the number of categories across states. Rajasthan has a
simple tariff structure with only eight categories, whereas in Haryana there are 15 categories, where industrial
consumers are segregated into 10 sub-categories.

61
Case study: Delhi
In its tariff order for fiscal 2019, the DERC has simplified the tariff structure into only nine broad consumer categories.
Sub-slabs exist for the domestic category; however, the rest of the consumer categories have only one tariff (detailed
in annexure E.2.2). The broad consumer categories in Delhi are:
Domestic
Non-domestic
Industrial
Agriculture and mushroom cultivation
Public utilities
Delhi International Airport Ltd
Advertisement and hoardings
Temporary supply
Charging stations for e-rickshaws/e-vehicles on single-point delivery
The DERC has merged the following categories and created a new category, ‘public utilities’:
1. Delhi Jal Board: Available to Delhi Jal Board for pumping load and water treatment plants
2. Railway traction: Available for Indian Railways for traction load
3. Delhi Metro Rail Corporation: Available to Delhi Metro Rail Corporation for traction load
4. Public lighting: Street lighting, signals and blinkers
Way forward
Over time, because of considerable changes in the consumer mix, consumption pattern, and demand-supply
situation, there has been substantial addition in the number of categories, sub-categories and slabs. While the
introduction of these categories served the intended purpose initially, it has now become difficult for the regulatory
commissions to do away with any of them, owing to socio-political reasons. In fact, the Economic Survey for fiscal
2016 noted the following key points regarding electricity tariffs:
Complexity of tariff schedules prevents economic actors from responding sufficiently to price signals
Price and non-price barriers come in the way of single-nationwide electricity price through OA
Existence of separate and multiple tariff categories, sub-categories and slabs create a complexity, which prevents
consumers from fully responding to tariffs because of the high cost of processing the price information
Currently, the tariffs framed by the SERC for retail consumers are complex with many sub-categories and conditions.
This leads to confusion not just at the consumer level but even at the discom level.
It is, therefore, recommended that the tariff structures should be reviewed. While carrying out simplification of tariff
categories, revenue neutrality needs to be ensured. We may merge/eliminate existing tariff categories, based on:
End-use
Energy consumption
Socio-economic profile/affordability
Social factors (rural and urban area differentiation)
Consumption pattern/load factor

62
Voltage
Efficient energy use
Based on the above exercise, standard tariff categories need to be defined across all states. Also, guidelines need
to be laid out for determination of sub-categories and prescribing limit on the number of slabs under the standard
tariff categories.
Any tariff standardisation exercise at the national level will require a comprehensive assessment of the impact on
revenue of the utilities. The tariff design should reflect the prudent and efficient cost of supply to the consumers while
maintaining revenue neutrality. The new tariff structure should adequately recover fixed costs of the distribution utility
through demand charges and variable costs through energy charge. Socio-economic development of the utility
should be promoted by providing attractive and affordable tariffs to households, agricultural and industrial consumers.
(Refer to annexures E.3 and E.4 for details).

63

64
Annexure A - Key studies undertaken in distribution sector
Various studies have been undertaken to analyse the critical gaps in the power distribution sector and measures
recommended to address these. The key studies based on relevance & coverage of issues in the current context
and their takeaways/ learnings are:
A.1 Best practices and strategies for distribution loss reduction
A.1.1 Need for study
The distribution sector’s losses have not only weakened discoms’ financial health but also affected the health of the
entire power sector. At the time of the study India faced challenges, in terms of:
Achieving 100% electricity access owing to grid connectivity issues in rural areas
Providing 24x7 quality and reliable supply cost effectively
Figure 11: Aggregate AT&C losses at the time of study
Source: PFC annual utilities report
Table 6 : Region-wise AT&C losses
S No Region 2012-13 (%) 2013-14 (%) 2014-15 (%) 2015-16 (%)
1 Eastern 42.04 38.02 39.51 36.88
2 North-eastern 38.31 33.94 35.62 35.06
3 Northern 28.89 24.86 31.49 27.31
4 Southern 17.40 19.06 18.19 16.24
5 Western 23.36 18.37 21.53 22.99
National 25.38 22.70 25.72 23.98
Source: PFC annual utilities report
The study was conducted by FOR to analyse practices followed by discoms and come up with strategies to reduce
losses.
A.1.2 Recommendations and learnings
The study on ‘Loss Reduction Strategies in India (2008)’ identified:
27.70%26.60% 26.35% 26.63%
25.38%
22.70%
25.72%
23.98%
FY09 FY10 FY11 FY12 FY13 FY14 FY 15 FY16
Aggregate Technichal & Commercial losses

65
Definition of distribution loss
Definition of method of computation of AT&C losses
Segregation of technical and commercial losses
Compilation of baseline data
Third-party verification of data and energy audit
Methodology for achieving loss reduction in a time-bound manner
Relative adequacy of technical solutions
The loss reduction programmes were reviewed and states were classified on the basis of a framework.
A.1.2.1 Framework for state selection
A framework was designed to select states for tackling losses. The identification or framework depends on three
intrinsic factors:
AT&C loss levels
% consumer category sales (agricultural and industrial).
Effectiveness of loss reduction (initiatives undertaken).
Once the states were selected, data was collected and loss reduction initiatives identified.
A.1.2.2 Initial loss reduction initiatives
Broad level initial loss reduction initiatives were identified for the states:

66
Figure 12: Initial broad level structuring of loss reduction initiatives
A.1.2.3 Classification of loss reduction initiatives
Based on loss reduction initiatives adopted by the states, an analysis was carried out on:
1. Must-have initiatives: Initiatives adopted by eight or more utilities out of the 10 selected states
2. Strongly desirable initiatives: Initiatives adopted by 5-7 utilities out of the 10 selected states
3. Good to have initiatives: Initiatives adopted by 3-4 utilities out of the 10 selected states
4. Other initiatives: Initiatives adopted by two or less utilities out of the 10 selected states
• Dedicated police stations/staff
• Dedicated courts
Administrative initiatives
• Focused clauses in supply code/ grid code
• Loss reduction-based MYT mechanisms
• Loss level-based tariff design
Regulatory initiatives
• Loss monitoring, audit committee / cells
• Nomination of feeder managers
• Theft reporting consumer incentive scheme
• Employee incentive scheme
• Employee capacity building programme
Governance framework
• Introduction of DF initiatives/ privatisation
• Engagement of local groups
• Outsourcing/third party monitoring bodies
Competition promotion
• AMR, hand-held devices for billing
• SCADA, DMS, OMS, ERP, SAP, etc
• 100% consumer metering
• Replacement of defective meters
• MIS-based periodic reporting
Process strengthening
• Segregation of agricultural/rural feeders
• Implementation of HVDS system
• Installation of LT ABC
• Improving HT:LT ratio
• Substation/DT augmentation
Network strengthening/ technical loss reduction
• Capital injection
• Performance monitoring and review
Government support
• Consumer communication on loss reduction
• Connection regularisation scheme/surcharge waiver of scheme/interest waiver scheme
• Customer feedback programme
• Transformer management system
Soft initiatives

67
A.1.2.4 Development of loss reduction strategy
Figure 13: Loss reduction strategy
A.1.2.5 Key takeaways
Based on a thorough review of the report, following points were identified as major takeaways that could help discoms
reduce losses:
As states continue to face high financial and technical losses, despite adopting various schemes and
mechanisms, the focus should be on identifying the root cause of the losses, after which a strategy should be
formulated
To identify the root cause of losses, the first step is to identify component-wise losses using energy accounting
techniques. Each component, which can have different root causes, should be addressed by a uniquely designed
strategy
Loss reduction strategies should follow the following steps to be effective:
‒ Defining goals: The primary step is to define the current status and future target losses
‒ Measurement and verification of losses: There is a need to measure and verify the loss figures by the
state electricity authority, and also to ensure that the requisite data is available for the same. Initiatives
identified through analysing various states that would help achieve this objective:
o Verification of energy input, energy billed and energy collected. Strengthening of energy accounting
infrastructure by 100% consumer metering, DT metering and feeder metering, Replacement of defective
and electromechanical meters
‒ Energy audit and analysis of network: For the distribution utility to monitor and achieve the targeted
reduction of technical and commercial losses, there is a dire need for complete energy accounting at every
level - starting from energy input at the distribution periphery to the consumer level. Audit is required at four
levels - company, division, feeder and distribution transformer. Through state-wise analysis, certain initiatives
that will help achieve this objective are:
o Implementation of IT application in metering, billing and collection (MBC) activities (AMR/HHD/e-mail,
sums-based intimation), MIS-based periodic reporting of unit-wise business parameters, implementation
Defining goals
Measurement and verification of losses
Energy audit and analysis of network
Planning execution and improvement
Control and sustain losses
Benchmarking with similar utilities

68
of IT application in network management activities (SCADA, DMS, OMS, etc.) and deploying a central
level vigilance team.
‒ Planning execution and improvement: The loss reduction initiative undertaken by the discom for the type
of loss should be based on capex requirement, loss levels and consumer types. After that the discoms need
to plan and execute initiatives appropriately.
o Initiatives for reduction of technical losses: Improving HT: LT ratio, substation/ DT augmentation,
segregation/bifurcation of feeders and implementation of the HVDS system.
o Initiatives for reduction of commercial losses: Connection regularisation scheme/surcharge waiver
of scheme/interest waiver scheme/VDS, outsourcing strategy and installation of LT ABC.
‒ Control and sustain losses: Initiatives are required to control, sustain and prevent future increase in loss
levels for the discoms. Initiatives identified through analysing various states such as:
o Constitution of loss monitoring, energy audit, committee/cells, performance monitoring, dedicated police
stations, nomination of feeder managers, dedicated field level loss management roles, and consumer
communication on loss reduction.
‒ Benchmarking with similar utilities: For the steps discussed above, the loss level and strategies to reduce
them should be benchmarked with the loss-reduction journey of a similar utility.
The initiatives should be prioritised under different categories so that different types of losses are tackled under
various initiatives.
For quantifying the initiatives that have been undertaken, the discoms need to conduct pilot studies in smaller areas,
similar to the one done by Punjab for quantifying the benefits of meter replacement.
A.2 Performance of discoms
A.2.1 Need for the study
The distribution sector is a crucial link in the power sector value chain. The viability of the power sector hinges on the
financial health and operational efficiency of distribution utilities. Rising accumulated losses and dismal operational
performance of distribution utilities necessitated an analysis of their performance across various states, with a view
to introduce reforms focussed on performance improvement areas. Towards this purpose, FOR has captured the
financial and operational performance of the distribution sector, along with analysing the impact of various
policy/regulatory decisions on performance.
A.2.2 Recommendations and learnings
A.2.2.1 Mapping constructs and key performance indicators (KPIs)
Distribution utilities under consideration in the study were compared and grouped into five categories based on the
four constructs linked to 12 mutually exclusive and collectively exhaustive parameters. The constructs and
corresponding KPIs are depicted below:

69
Figure 14: Constructs and KPIs
The utilities were graded on each KPI and the performance was compared with the national average. Further, each
KPI was assigned a weight allowing for overall performance grading of the utility.
A.2.2.2 Roadmap for improvement
Steps for improvement of distribution utilities according to their categories were elucidated as follows:
Category B
‒ Optimise capital structure
‒ Improve AT&C losses
‒ Improve the collection cycle
‒ Make an effort to liquidate regulatory assets
Categories C and D
‒ Improve cost coverage
‒ Reduce AT&C losses
‒ Strengthen the business model
‒ Reduce the receivable days
Categories C,D, and E
‒ Optimise capital structure
‒ Improve financial reporting
Category E
‒ Revamp the entire business process
‒ Formulate a proper roadmap for reduction of AT&C losses
‒ Strengthen the collection mechanism
‒ Streamline cost coverage by adopting prudent power purchase mechanism and tariff rationalisation
‒ Reduce debt service obligation and optimise capital structure
• Profit per unit input energy
• Gross margin (without subsidy)
• Difference in compounded annual growth rate of revenue and costProfitability
• Number of receivable days
• Number of payable days
• Ratio of capex and depreciationChannel efficiency
• Interest service coverage ratio
• Debt to equity ratio
• Fixed coverage ratioSolvency
• Aggregate technical and commercial losses
• Employee cost per unit of input energy (regular employee)
• Trend of AT&C losses
Techno-commercial efficiency

70
Based on the analysis carried out for categorising (grading) the distribution utilities, a 3x3 matrix was derived,
delineating the structural changes required. The X-axis represented the degree of impact of structural change and
the Y-axis, the desired timeline.
Figure 15: Roadmap of structural changes for the distribution utilities
Desired timeline/challenge Low Medium High
Short term
(in 3 years)
Consumer sensitisation on tariff hike
Computer-based segregation of accounts
Unbundling of SEBs
100% metering
Mid term
(in 5 years)
Prudent power procurement
Reduction in debt / interest cost and improvement in efficiency
Regulatory reforms
Each divisions/business unit to be run as profit centres
Distribution franchisee/ other PPP models in power distribution
Tariff rationalisation
Liquidating regulatory assets
Long term
(in 7-10 years)
Reduction in AT&C losses to meet global standards
A.2.2.3 Key takeaways
This study analysed distribution utilities under 12 KPIs. Based on the analysis, it made the following recommendations
to improve performance:

71
Figure 16: Recommendations to improve the performance of distribution utilities
Steps for improving the regulatory framework
Enforce timely tariff filing and quality in financial reporting
Regularly collect primary financial and operational data, ensure third-party monitoring and validations
Regularly revise tariffs
Ensure timely payment of subsidy by the state governments, failing which distribution utilities will be forced to use long-term debts to meet short-term obligations
Improve financial and operational performance by enforcing stronger corporate governance
Steps for improving operational excellence
Strengthen metering, billing, and collections, which will improve commercial and financial health of the distribution utilities
Sensitise and educate consumers about the rationale of setting tariff, benefits of installing meters, and helping the distribution utilities lower theft
Focus on prudent power procurement mechanisms
Complete evaluation of demand and procurement options before entering into a long-term power procurement contract
Steps in changing the industry landscape
Encourage competition by using distribution franchisee models, thereby improving efficiency
Allow scalability where privatisation models are already implemented
Ensure financial and operational independence of distribution utilities
Adopt a lean and decentralised organisational model under which each division is treated as a separate profit centre
Steps in improving financial health
Reduce debt and interest costs for the distribution utilities to turnaround and become profitable
Improve the operational efficiency of the discoms through reduction of losses
Utilise innovative ways to liquidate regulatory assets in a time-bound manner to solve the problems of debt and revenue deficit

72
A.3 Roadmap for reduction of cross-subsidy
A.3.1 Need for the study
The Electricity Act, 2003 requires SERCs to progressively reduce cross subsidies in tariffs so as to ensure that they
reflect the cost of supply. However, there has been little improvement in the level of cross-subsidy on industrial and
commercial consumers. FOR undertook this study to devise a way forward to determine the cross-subsidy and
suggest a roadmap for its reduction, in keeping with the Electricity Act 2003, the NTP and the tariff policy.
A.3.2 Recommendations and learnings
The FoR conducted a detailed analysis of the existing cross subsidies in states and came up with the following
recommendations in its report to reduce them:
1. Calculation of cost of supply: The states should adopt category-wise cost of supply instead of average cost of supply (ACOS) in tariff determination. The regulators can choose between the embedded cost of supply approach or simplified approach for calculating category-wise or voltage-wise cost of supply, based on the data available.
2. Reduction of cross subsidies: Most states in India are outside the +/- 20% ACOS range. Therefore, the state regulators need to implement proper guidelines for gradual reduction in cross subsidies. A roadmap should be designed to align the tariff to the customer cost of supply.
3. Factors for determining cross subsidies: The regulators should consider factors such as the number of units consumed, alternative source of fuel available, etc. for determining cross subsidies.
4. Way forward for states with current subsidies and the method of cost of supply calculation:
a. States where all categories are outside the +/- 20% ACOS range:
i. Formulate a plan within the range of +/- 20% for all the consumer categories within the next 5 years
ii. Get assistance from the government to reach parity and be prepared for tariff shocks
iii. Give a minimum subsidy per unit to the agricultural category
b. States where all categories are within the +/- 20% ACOS range:
i. Aim to move from ACOS-based tariff determination to category-wise cost of supply
ii. Use the simplified method for calculating the cost of supply based on the data available
c. States where all the categories are within the +/- 20% ACOS range and which use a simplified method for calculating the cost of supply:
i. Carry out detailed technical studies for calculating the cost of supply using the embedded methodology
ii. Maintain their cost of coverage and work towards linking retail tariffs to category-wise cost of supply through on-year tariff realisation
5. Bill segregation: Cross-subsidy that is given to a customer should be clearly shown as a separate item in the customer billing statements. The items to be mentioned in the bill are:
a. Cost of supply to the respective consumer category b. Tariff charged from consumers c. The source and amount of cross-subsidy, which is the difference between cost of supply and tariff
6. KYC norms: Introduction of KYC norms such as linking of Aadhar/Permanent Account Number card so that the subsidy is directly transferred in the future.

73
A.4 Power distribution models in India
A.4.1 Need for the study
The financial health of distribution utilities remains crucial for the overall success of power sector reforms. However,
despite introducing competition, private participation in the distribution sector has been limited.
This study was aimed at analysing both emerging and established models of electricity distribution and evaluating
their relative strengths and weakness. The objective was to evolve feasible models for electricity distribution in India.
A.4.2 Recommendations and learnings
The study analysed the performance of utilities (government/ privately owned) on various financial and operational
parameters. It also demarcated the difference between private and government-owned entities.
A.4.2.1 Way forward
The analysis brought out the marked difference in performance between privately managed entities and those owned
and controlled by the government against all selected parameters. This difference was not only in absolute values
but also in trends in the same over the period of study. The private utilities continuously improved their position, as
against the government-owned ones. An obvious explanation for this situation was the difference in the managerial
and work cultures of these entities. The public distribution utilities had to perform within a rigid framework coupled
with low levels of accountability. On the other hand, private utilities enjoyed greater flexibility in their operations, were
more focused on their actual business, and had greater individual accountability at all levels.
Another crucial difference was in the nature of their businesses. All the private entities covered in this study operated
in compact areas with a concentration of consumers, and substantial loads and consumption. The government-
owned utilities operated over much larger areas comprising urban/semi-urban centres, in addition to huge rural areas.
Hence, the consumer profiles of these utilities were totally different. Private utilities operating only in urban and semi-
urban areas had higher customer and load densities. However, public utilities typically had low customer and load
densities because of their spatial distribution, coupled with relatively lower per capita consumption. This was a crucial
difference between these two categories of distribution utilities, and explained to a large extent, the relatively poor
performance of the government-owned ones.
However, this situation also provided the government distribution utilities a cover for their below par performance,
even in high concentration urban and semi-urban areas. Consequently, such utilities aimed at, and were satisfied
performing at sub-optimum levels of efficiency even in their high-density areas, marked by similar characteristics as
the areas of operations of private utilities. It needed to be recognised and accepted that distribution of electricity in
urban/semi-urban areas and that in rural areas are substantially different businesses. The former had the potential
for efficient performance against technical as well as financial parameters; while the same could not be said of the
latter with inherent drawbacks such as sparse distribution of consumers, vastly spread distribution network, low
demand, etc. These were further accentuated by problems such as low metering, meter reading, and related billing
and collection issues.
These factors were a drain on the financial viability of the distribution business and resulted in unavoidable but non-
transparent cross-subsidisation. To raise the high-density areas to optimum levels of efficiency and performance,
these needed to be identified and carved out into separate entities. The potential of such areas could then be fully
exploited as their characteristics are likely to be similar to those which were serviced by the private distribution utilities
covered in the study, which had shown substantial and continuing improvement. These areas need not be identified
on the basis of existing classification norms (such as municipal and non-municipal areas); they could be categorised
based on their electricity distribution characteristics and potential. One parameter could be the total electricity load
of that area and its spatial distribution. These areas could then be privatised for focused attention and a concerted
effort made to pull them up to optimum performance levels. The model of privatisation or public-private partnership

74
(PPP) arrangement would depend on the prevailing conditions of each such area. Recently, some states had adopted
the input-based franchisee model for this purpose.
An obvious argument against the above proposition is that the residual areas with poor potential would remain with
the existing licensee and add to its existing woes. For this, the study (Power distribution models in India) proposed
that a cess or surcharge be imposed on consumers in the high-density areas. The revenue from such cess could go
into a separate fund, such as a universal service obligation fund, and utilised for subsidising the operations in these
residual areas. This would bring about transparency in cross-subsidy and create conditions for the realisation of the
full potential of the high-density areas.

75

76
Annexure B - Reforms in the power distribution sector
B.1 Overview of the Indian power sector
Even as India is the world’s third-largest electricity producer in the world22, the country’s need for energy is increasing
at a fast pace as a result of economic growth and modernisation over the past several years. This is reflected in
India’s per capita electricity consumption figures. Per capita consumption rose from 631.4 kWh in fiscal 2006 to 1075
kWh in fiscal 2016, an increase of 70.2% in 10 years23. Between fiscals 2006 and 2017, India’s peak demand
increased at 5% CAGR to reach 159.54 GW. The installed power generation rose at 9.2% CAGR from 124 GW to
327 GW23. Further, the draft National Electricity Plan, 2016 projects a peak demand of 235 GW by end fiscal 2022.
Electricity appears on the concurrent list of the Indian Constitution, meaning that both state and central governments
participate in the sector’s development. The CEA acts as a statutory body for recommending policies to the Ministry
of Power, monitoring electricity sector performance, advising the ministry on technical issues, data
management/dissemination of the power sector, etc. The Central Electricity Regulatory Commission (CERC)
regulates tariffs of central generating stations as well as for all interstate generation, transmission, and supply of
power. The respective SERCs regulate operations of intrastate transmission and determine bulk and retail tariffs.
A timeline of the sector’s development
The country had a power generation capacity of 1,362 MW at the time of Independence24. Generation and distribution
of electricity were carried out primarily by private utility companies. The Electricity (Supply) Act, 1948, provided an
elaborate institutional framework and financing norms for the performance of the electricity industry. The Act
envisaged creation of central generation companies and SEBs for planning and implementation of power
development programmes at the central and state levels, respectively. It also allowed private licensees to distribute
and/or generate electricity in specified areas designated by the concerned state government/SEBs.
The sector received priority ever since the process of planned development began in 1950. Remarkable growth and
progress led to extensive use of electricity in all sectors of the economy in successive Five Year Plans. The Industrial
Policy Resolution of 1956 envisaged generation, transmission, and distribution of power to completely come under
the purview of the public sector. Further, the GoI focussed on generation and bulk transmission of power to
supplement the efforts of states. The National Thermal Power Corporation (NTPC) and the National Hydro-Electric
Power Corporation (NHPC) were set up in 1975 for generation of electricity. The North-Eastern Electric Power
Corporation (NEEPCO) was set up in 1976 to implement regional power projects in the North-east. Subsequently,
two more power generation corporations were set up in 1988, viz., Tehri Hydro Development Corporation (THDC)
and Nathpa Jhakri Power Corporation (NJPC). The National Power Transmission Corporation was set up in 1989 to
construct, operate and maintain inter-state and interregional transmission systems, and was renamed the Power Grid
Corporation of India Ltd (PGCIL) in 1992.
Economic liberalisation during the 1990s opened up new vistas for private investment in the sector. Substantial
measures were taken by the government to attract them. In 1991, the Electricity (Supply) Act, 1948 was amended to
provide for creation of private generation companies, setting up power-generating facilities, and selling power in bulk
to the grid or other persons. The administrative and legal environment for the power sector was overhauled to simplify
procedures for project clearances. The government allowed 100% foreign equity participation in projects set up by
foreign private investors in India. In 1995, a policy for mega-power projects of 1,000 MW capacity or more was
introduced. This policy allowed for mega-projects to be set up in regions with coal and hydel potential or in coastal
regions based on imported fuel, supply power to more than one state, receive additional incentives in the form of a
22 BP Statistical Review of World Energy 2014 Report
23 Central Electricity Authority (CEA) Annual Reports
24 Ministry of Power, Government of India

77
10-year tax holiday during the first 15 years, receive exemption of customs duty for imports, benefit from fewer
hassles for clearances, etc.
In 1998, the GoI came up with the Electricity Regulatory Commission Act for setting up independent regulatory
bodies, both at the central and state level, viz., the CERC and the SERCs. The Electricity Laws (Amendment) Act,
1998 was passed to recognise transmission as a separate activity, and invite greater participation in investment from
public and private sectors. It provided for creation of central and state transmission utilities. The function of the central
transmission utility was to undertake transmission of energy through the inter-state transmission system and
discharge all functions related to coordination with state transmission utilities, central government, state
governments, generating companies, etc.
Electricity Act, 2003 and regulations relating to the power market
The central government enacted the Electricity Act, 2003 to promote competition and efficiency in the power sector
against the backdrop of the ongoing economic reforms in other key sectors of the economy. The Act replaced the
three existing legislations governing the power sector, viz., the Electricity Act, 1910; Electricity (Supply) Act, 1948;
and the Electricity Regulatory Commissions Act, 1998. Prior to the Electricity Act, 2003, the electricity industry
recognised generation, transmission, and supply as principal activities under ‘electricity supply.’
The Electricity Act, 2003 led to significant structural changes in the power sector since its enactment such as a) shift
from the single-buyer model to the multi-buyer model; b) de-licensing of thermal generation; c) grant of OA in
transmission and distribution; d) identification of trading as a distinct activity; and e) reorganisation of the erstwhile
SEBs. The Act is directed at institutional and regulatory initiatives to promote inter-state and intra-state power trading
within India. Section 66 of the Act mandates the CERC to promote development of markets in electricity (including
trading) in accordance with the National Electricity Policy (NEP).
Following the Electricity Act, 2003, several policies evolved in relation to determination of tariffs, such as the NEP,
National Electricity Plan, NTP, development of hydro power, etc. The Ministry of Power at the national level is
responsible for perspective planning, policy formulation, processing of projects for investment decision, monitoring
of the implementation of power projects, training and manpower development, and the administration and enactment
of legislation with regard to thermal, hydro power generation, transmission, and distribution.
As electricity is a concurrent subject, the Ministry of Power, the government is mainly responsible for creating the
overall policy framework for the power sector in the country, while the respective state governments formulate state
level policies and address issues. All states and union territories have set up regulatory commissions to regulate and
determine tariffs for distribution and transmission companies as well as for generating companies which sell power
to the distribution companies. The CERC fulfils this responsibility for inter-state generation and transmission and also
for central power utilities. The Appellate Tribunal for Electricity was established to hear appeals against the orders of
adjudicating authorities (SERCs, JERC, and CERC).
PGCIL is the central transmission utility responsible for planning inter-state transmission systems, whereas the state
transmission utilities are tasked with the development of intra-state transmission systems. The transmission lines are
operated in accordance with regulations and standards of the CEA, CERC and SERCs. The Power System Operation
Corporation Ltd manages the national and regional grids from the National Load Despatch Centre (NLDC) and its
five Regional Load Despatch Centres (RLDCs) through state-of-the-art unified load despatch and communication
facilities.
The load despatch centres are responsible for co-ordination of generation, transmission, and distribution of electricity
from moment to moment to achieve maximum security and efficiency. While the NLDC controls the load flow within
the country, the RLDCs and the State Load Despatch Centres (SLDCs) are responsible to ensure integrated
operation of the power system in the concerned regions and states, respectively. The RLDCs, SLDCs and NLDC
operate in unison to ensure the integrated operation of the grid in a reliable, efficient and secure manner.
Power distribution is the last leg of the electricity value chain. The main function of the system is to provide power
right up to the individual consumer’s premises. Responsibility for distribution and supply of power to end-consumers

78
rests with the states. The power distribution segment is largely dominated by the state governments, although a few
private entities are also present. Traders and exchanges facilitate trading of power between generation and
distribution utilities. Further, OA allows large consumers to procure power either through traders or exchanges,
subject to transmission corridor availability.
Figure 17: Market and regulatory structure of the power sector in India
Source: CRIS
As per NEP 2005, appropriate commissions were directed to create the enabling regulations for both inter- and intra-
state trading and regulations on the power exchange within six months. The National Electricity Plan pushed for
creation of power exchanges in India.
In 2006, the CERC further initiated the process of organising the electricity market by establishing the power
exchanges. It passed an order for ‘development of a common platform for electricity trading’ towards their
establishment and management. Subsequently, it laid down the guidelines for the grant of permission for setting up
and operation of the exchanges. The CERC Power Market Regulations, 2010, further bestowed upon exchanges a
crucial role in deepening the power markets in the country. These regulations deal with the creation of a
comprehensive market structure that enables the transaction, execution, and contracting of all types of possible
products in the electricity markets. The regulations govern the spot contracts, term-ahead contracts, derivatives, and
other electricity related contracts. Further, as per these regulations, the exchanges are required to take permission
from the CERC for launching any new type of contracts. They also spell out arrangements which are mandatory for
the functioning of exchanges.
Growth phase of the electricity sector in India
With the introduction of the Electricity Act, 2003, private players moved to the forefront in generation. The private
sector contributed to ~45% of the total installed capacity of 344 GW as on March 31, 201825. While power generation
attracted major investments from the private sector, transmission and distribution continues to be dominated by
central and state government utilities.
25 Ministry of Power, Government of India; Ministry of New & Renewable Energy, Government of India

79
As for transmission systems, nearly 55% of the transmission system is under state transmission utilities, ~38% is
owned by the PGCIL, and 7% by private operators25 as of March 31, 2018.
Before the introduction of tariff-based competitive bidding in transmission, PGCIL was the sole entity responsible for
creating and augmenting inter-state transmission infrastructure as per directions from the ministry. Introduction of
tariff-based competitive bidding opened the sector to private participation. Both private players and public utilities
(PGCIL and state transmission utilities) could participate in the bidding individually, or through joint ventures, for
certain earmarked transmission projects. The NTP, 2006 pushed to make the power sector not only financially viable
but also investment-worthy by providing guidelines to the CERC and SERCs to ensure adequate return on
investments for the stakeholders. With this framework in place, the sector witnessed private participation for the first
time in 2010 with the award of the western regional system strengthening to Reliance Infra and the east-north
interconnection line to Sterlite Energy.
Under competitive bidding guidelines, all power transmission projects are to be awarded through competitive bidding,
with the objective of promoting competitive procurement of transmission services, with an exception for projects that
typically involve complex technology or need to be completed in a highly compressed schedule. Since then, the
growth in transmission network in terms of both line length and transformer capacity has been pronounced at higher
voltage levels and with high participation from private players in competitive bidding of transmission projects.
Last mile connectivity is provided by discoms; with every state having one or more discoms in charge of distribution.
The distribution segment in India is predominantly state-owned, catering to ~90% of energy demand in the country.
The balance is catered to by private distribution utilities, which meet demand in cities in a few states (Maharashtra,
West Bengal, Gujarat, and Odisha), as well as in Delhi (NCT).
Key challenges
Distribution, unfortunately, has remained the weakest link of the power sector value chain. The most critical issues
plaguing the distribution sector are high AT&C losses, poor billing and revenue collection efficiency, and inadequate
infrastructure. AT&C losses have two components — technical and commercial losses. Technical loss is the energy
that dissipates into the equipment used for transmission and distribution of energy to end users, commonly known
as transmission and distribution (T&D) losses. Losses which occur mostly due to human errors, theft, meter
tampering, and defective meters, among others, are known as commercial losses.
The GoI launched several initiatives such as the Rajiv Gandhi Gramin Vidyutikaran Yojana (now replaced by
Deendayal Upadhyaya Gram Jyoti Yojana (DDUGJY), Accelerated Power Development and Reform Programme
(APDRP), and IPDS, to strengthen the sub transmission and distribution networks and reduce AT&C losses to 15%
in 5 years. Although the loss level has since declined, the pace of reduction has remained slow.
As many as 18 states still suffer AT&C losses beyond the 15% target threshold; seven of them have registered more
than 30% losses. AT&C losses at the country level had declined to 24.62% in fiscal 201526, but are still much above
acceptable levels. As per the World Bank’s development indicators, the European Union and the US registered T&D
losses of 6-8%, Korea and Germany; 3-4%, and China; merely 2.6%, for fiscal 2015. The high levels of AT&C losses
in India and poor management of utilities have led to unsustainable financial operations and necessitated government
support through multiple rounds of restructuring and financial bailouts.
UDAY is the latest scheme aimed at improving the financial health of discoms. It envisages empowering discoms
with the opportunity to turnaround in the next 2-3 years, through four initiatives (i) improving the operational
efficiencies of discoms; (ii) reducing the cost of power purchase; (iii) lowering the interest cost of discoms; and (iv)
enforcing financial discipline on discoms through alignment with state finances. 26 states and one union territory
have signed the memorandum of understanding under the scheme as of March 201727.
26 PFC Report on Performance of State Utilities 2014-15
27 Press Information Bureau, India

80
With the objective of reducing the interest costs and deleveraging the discoms, states opting for UDAY took over
75% of total debt outstanding in the books of their respective discoms as on September 30, 2015, staggered over
two years, i.e., 50% in the first year and 25% in the second. The debt so taken over is not calculated as part of the
fiscal deficit of the respective states in the first two years, though the interest has to be serviced within the Fiscal
Responsibility and Budget Management limits. The state governments will issue bonds to pay off 75% of the total
debt. The balance 25% of the total outstanding debt is converted by banks into longer dated loans or bonds with
interest rate not more than bank’s base rate plus 10 basis points. Alternatively, this debt (fully or partly) may be issued
by discoms as state guarantee bonds at prevailing market rates.
Climate change and development of renewable energy
India has also been attempting to address concerns about the environmental effects of rapid economic development,
alongside acceleration of economic growth. In 2015, the Paris Agreement pledged to limit the rise of the earth’s
temperature to under two degrees celsius by 2100. As many as 162 countries, including India, submitted their
‘Intended Nationally Determined Contributions’; documents which describe the steps that will be taken to limit global
warming. In view of this, India made a strategic decision in 2016 to move away from coal as a source of electricity in
the long run, by ratifying the Paris Agreement on Climate Change.
Historically, coal has dominated India’s generation capacity mainly because of significant reserves. However, over
the long term, the share of coal-based generation is expected to decline as India gears up to capitalise on its high
potential for generation of renewable energy from various sources such as wind, solar, biomass, small hydro, and
cogeneration bagasse. India’s installed grid-interactive renewable power systems have increased steadily from ~7.7
GW in fiscal 2001 to ~69 GW in fiscal 201828. The government has set a target to achieve 175 GW of renewable
capacity by fiscal 2022 with an intent to tap into the abundant renewable resources and reduce the coal import bill.
Further, as per the draft National Electricity Plan published by the CEA in December 2016, no new coal-based
capacity addition is envisaged between 2017 and 2022. However, 50,025 MW of coal based power projects are
currently under different stages of construction.
Evolution of the power market structure
The market for bulk power was characterised by contracts between generation plants and distribution utilities/SEBs
before the enactment of the Electricity Act, 2003. With its enactment, trading involving the purchase and sale of
electricity have been recognised as a distinct licensed activity, aligned with one of the key objectives of Electricity
Act, 2003, i.e., to encourage competition in all segments of the electricity industry. Open access in inter-state
transmission was introduced in May 2004, which facilitated the development of a bilateral market in the country.
Open access in distribution facilitates large users of power — typically having connected load of 1 MW and above —
to buy power from the open market at competitive prices. The aim is to allow the customers to choose among a large
number of competing power companies instead of being forced to buy electricity from their existing electric utility
monopoly. It helps large consumers, particularly industries such as aluminium, paper, glass, automobile, textile,
cement, and steel industrial units, by ensuring supply of electricity at competitive rates. Open access provisions also
provide opportunities to generators for sale of power in the market including to large consumers.
To further streamline bilateral transactions and facilitate implementation of power trading in India, the CERC took
several significant initiatives. In July 2006, it published a discussion paper on ‘Development of a Common Platform
for Electricity Trading’ as a giant leap forward in developing the electricity market in the country. Post public hearing
in December, 2006, it issued guidelines for setting up of power exchanges in the country. The OA regulations
pertaining to procedures for application, transmission charges, computation of losses, etc. were revised to facilitate
market development. Open access regulations in inter-state transmission were also revised to include collective
transactions discovered on a power exchange.
28 Central Electricity Report (CEA) Annual Reports; MNRE

81
With the above provisions in place, the Indian Energy Exchange (IEX), the country’s first power exchange, made an
application for grant of permission to set up a power exchange in March 2007. In-principle approval was accorded
by the CERC on August 31, 2007 and final approval, on June 9, 2008. IEX commenced operations on June 27,
2008 after the rules and bye-laws were approved by the CERC and permission was granted to commence operations.
The second power exchange, Power Exchange of India (PXIL), was granted in-principle approval on May 27, 2008.
PXIL went through a process of regulatory approval similar to IEX and commenced operations on October 22, 2008.
Currently, trading of power is facilitated by inter-state and intra-state trading licensees and the two power exchanges.
Figure 18: Evolution of power exchanges in India
Source: CRIS analysis
Subdued growth in demand for power in the past 3 years, combined with a lag in long-term capacity contracting,
have pushed generators to sell their surplus power in the short-term market. Cost of procuring power through an
exchange is ~Rs 2 per unit lower than industrial tariffs charged by power distribution companies in several states.
This differential can be primarily attributed to low exchange clearing price despite the high cross-subsidy charge built
in the tariff schedule of discoms and applicable to large industries.
With power tariffs in the open market remaining low, industrial consumers across many states are increasingly buying
electricity from power exchanges. Open access electricity trade, including day-ahead market, accounted for ~60% of
total procurement on the IEX in fiscal 2017. Also, ~3.5% of the total electricity generated from conventional sources
were traded through exchanges that fiscal29. Regulations for OA, inter-state trading, and the power market have
facilitated power trading in an organised manner. Going ahead, record thermal capacity addition in the past 5 years,
largely by the private sector, coupled with slowdown in long-term contracting by discoms, would render a lot of
capacity untied. As on March 31, 2017, ~35 GW of untied capacity is understood to be available in the market.
The electricity produced from such untied generation capacity is also likely to be traded on exchanges. The
contracting of conventional thermal capacities too, is expected to be slow, as renewable capacities are expected to
take centre stage in the long term.
However, availability of transmission corridors and high OA charges charged by discoms have been an area of
concern for the short-term transaction of power. In this regard, the expected improvement in operational and financial
performances of discoms, with the implementation of UDAY, is likely to improve the power purchase capacity of
discoms. Also, the proposed connectivity augmentation between the eastern-northern, western-northern, and
western-southern regions are expected to reduce transmission congestion to a further extent and provide a much-
29 Market Monitoring Reports, CERC
2003 June-Enactment of EA 2003
2006 CERC publishes staff paper on Power Exchanges
2007 February -Guidelines on setting up of Power Exchanges
2008 January -Guidelines on Collective Transaction; June -Guidelines for Scheduling of transactions on exchanges;
October - Second Exchange started operation

82
needed fillip to the short-term power market. Overall, the exchanges are expected to grow their share in the short-
term market, and evolve at a healthy pace in the coming years.
B.2 Reforms in the power distribution sector
The power distribution sector has seen many reforms to improve its commercial viability and meet the GoI’s target of
‘Power for All’. These reforms can be classified into structural, operational, and financial. They have brought in
changes such as unbundling of state electricity boards, promoting competition, OA, reduction of losses, and
rationalisation of tariff and financial packages. However, despite many measures at the central and state government
levels, distribution sector reforms continue to move at very slow speed. High AT&C loss levels, high debt, theft and
pilferage, and high unmetered consumers and feeders, are some of the issues which still plague the sector.
Figure 19: Power distribution sector performance
Source: PFC report on performance of utilities (all India)
The major reform measures taken up in the power distribution sector over the years have been discussed below.
B.3 Structural reforms
B.3.1 Electricity reforms in Odisha
Reforms were introduced in Odisha to improve the quality of electricity supply in the state and stimulate economic
growth in the region.
What triggered the reforms?
The government of Odisha initiated an extensive reforms programme against the backdrop of deteriorating financial
health of the OSEB, which was surviving on subsidies from the state government. Subsidy disbursals were delayed
and the widening gap between peak demand and supply of electricity had reached a staggering 45% in the state,
despite its vast coal resources.
Objectives
The broad objectives of the reforms programme were as follows:
To bring autonomy in the functioning of the distribution companies by keeping them outside governmental control

83
To attract private investments in the power sector
To introduce competition in the power sector
Reforms process
To achieve the above objectives, the Odisha power sector reforms process was designed to:
Establish a separate state legislation - The Orissa Electricity Reform Act enabled a separate legislation
Un-bundle and corporatise OSEB - It was unbundled into two separate generation companies, OHPC and
OPGCL, and one transmission and distribution company, GRIDCO
Develop an autonomous power sector regulatory body - The Odisha Electricity Regulatory Commission (OERC),
for regulating the power sector in Odisha free of political interferences, was set up
Privatise the power distribution businesses - Four distribution zones were identified and hived off into separate
utilities in November 1998 as 100% subsidiaries of Gridco, viz., Wesco, Nesco, Southco, and Cesco. The
corporatised distribution companies were then privatised through international competitive bidding. Two private
companies BSES and AES were chosen to distribute power in the four utilities carved out.
Figure 20: Reform measures in Odisha
Impact of the reforms
First, the reforms programme shifted the responsibility of power sector operation from OSEB to independent
companies created across the generation, transmission and distribution sectors. Second, it extricated the sector from
the Government of Odisha’s control and invested it with an autonomous body, the OERC. Third, it paved the way for
gradual elimination of the cross-subsidy so that tariffs reflected the cost of supply. Fourth, it created an environment
for private sector investment in the sector. On the operations front, the reforms improved the plant load factor levels
of thermal projects, reduced generation tariffs, increased availability of power, reduced government exposure by
savings on account of subsidies given earlier, etc.
However, the reform process failed to bring continued benefits in power distribution, with high AT&C losses, dismal
financial performance of utilities, and steep increase in power tariffs despite increase in overall power availability.
This was mainly owing to inadequate capital expenditure in distribution network by the new companies, among other
reasons.

84
Table 7: AT&C losses and financial losses of CESU
2007 2009 2011 2013 2015
AT&C loss (%) 39.90% 39.43% 45.60% 42.88% 39.28%
Losses (Rs crore) 2186 2314 3287 4283 5570
Source: PFC report on performance of utilities
Strengths and shortcomings of the reforms
Strengths:
Un-bundled and corporatised OSEB to improve performance
Autonomous power sector regulatory body OERC set up
Privatised discoms by competitive bidding
Shortcomings:
High AT&C losses and dismal financial performance continued
Inadequate capital expenditure in distribution network by the new companies
B.3.2 Reforms pursuant to the chief ministers’ conference (1996) and the Electricity
Regulatory Commission Act, 1998
By the 1990s, a separate regulatory body was increasingly seen as vital to the reforms process in the sector. In
general, such a body was expected to act in a rational and transparent manner, eliminating political interference that
acted as a drag on the sector. This, in turn, was expected to strengthen the tariff setting process and promote
independent decision making by the distribution companies, eventually restoring financial viability of the sector.
What triggered the reforms?
There was acute power shortage in the country in the 1990s. The principal reason was that SEBs were unable to
invest in new capacity owing to substantial operational losses because of political interference in the tariff setting
process and mounting inefficiency in electricity supply. As per section 59 of the Electricity Supply Act, 1948, SEBs
were mandated to earn 3% rate of return on their net fixed assets, which was not achieved by many SEBs. The
receivables owed by SEBs to the central public sector undertakings were also inflating owing to the weak financial
conditions of the former.
Reforms process
A meeting of chief ministers was called in New Delhi on December 3, 1996, to develop a viable solution to the
situation. In the meeting, a “Common Minimum National Action Plan for Power” (CMNPP) was finalised, which,
amongst others, led to the following major decisions being taken:
The responsibility of tariff was shifted from state governments to independent SERCs
The tariff should be such that it ensured minimum 3% return on the net fixed asset
No consumer category should pay less than 50% of cost of supply
State governments would restructure SEBs to encourage private participation in distribution of electricity
As a one-time incentive for state governments for agreeing to the CMNPP, their dues from various CPSUs were
waived off.
The meeting led to the enactment of the Electricity Regulatory Act, 1998 by the Centre, leading to the formation of
the CERC. The Act also made provision for constitution of SERCs by state governments.
Impact of the reforms
The reform led to the formation of SERCs by various states (Assam, Andhra Pradesh, Delhi, Madhya Pradesh,
Maharashtra, Odisha, and Tamil Nadu). The remaining states, however, did not take any initiative for establishment

85
of SERCs and tariffs continued to be determined by political interference. It was expected that the formation of
independent regulatory commissions would bring transparency in the tariff determination exercise and improve the
consumer grievance mechanism. Despite that, concerns that the tariff setting process may not happen in an
independent manner surfaced yet again.
Strengths and shortcomings of the reforms
Strengths
Separate regulatory body to act in rational manner and eliminate political interference
Acute power shortage to be addressed
SEBs enabled to invest in new capacity
Shortcomings
SERCs formed by only in seven states, tariff determined by political interference in rest of the states
Even in the seven states, tariff setting was not independent, hence losses piled up
B.3.3 The Electricity Act, 2003
It was presumed that comprehensive legislation in the form of the Electricity Act, 2003, would act as a guiding
principle for states to follow and implement in its true spirit. As regards the distribution sector, it was assumed that
not only would Act lead to rationalisation of electricity tariffs via an independent regulatory mechanism, but also
increased competition, driven by the introduction of OA, rationalisation of electricity tariffs, transparency in subsidy
policies, and increased safeguarding of consumer interest.
Reform drivers
The introduction of the Electricity Act, 2003, was driven by the failure of the Electricity Regulatory Commissions Act,
1998, as well as the subsequent SERC regulations in various states, in producing the desired tariff rationalisation
and attracting private investment in the power sector.
Reform process
The Electricity Act, 2003, marked the beginning of a new era of significant reforms in the electricity sector. The Act,
which came into force on June 10, 2003, aimed to bring about a paradigm shift in the sector by progressively
introducing competition, as well as complete commercial autonomy to buy and sell power. The Act consolidated and
augmented previous legislation such as the Indian Electricity Act, 1910, the Electricity (Supply) Act, 1948, and the
Electricity Regulatory Commissions Act, 1998.
The Electricity Act, 2003, aimed to create a market-based regime in the Indian power sector, consolidating the laws
relating to generation, transmission, distribution, trading, and use of electricity. The Act envisaged competition,
keeping in mind the interests of consumers and supply of electricity to all areas. It also addressed rationalisation of
electricity tariff, ensuring transparent policies regarding subsidies, promotion of efficient environmentally benign
policies, constitution of a Central Electricity Authority and regulatory commissions, establishment of appellate
tribunals, etc. - steps that impacted every segment of the power sector.
The legislative framework of the Electricity Act, 2003, targeted significant reform measures, including:
Open access: Usage of transmission and distribution licensee networks by private generators and bulk
consumers, subject to availability, on payment of the requisite fees.
Distribution licensee: Private parties can distribute power, subject to the receipt of the requisite licenses from
the respective SERCs. A SERC can also grant multiple licenses in the area of a distribution licensee. A
distribution licensee can also share responsibility for distribution with a franchisee.
Rural and remote areas: Standalone systems for generation and distribution are allowed in rural areas.
Distribution in these areas, when managed through panchayats, user associations, co-operatives or franchises
is permitted without a licence (in state government-notified areas).
Unbundling: State governments can unbundle SEBs and create generation, transmission and distribution
companies. At the minimum, the transmission activity needs to be separated from the SEBs. All states should
have regulatory commissions.

86
Tariff: Tariff can either be determined by a SERC on commercial principles, or via free and fair competitive
bidding.
Reform impact
The Electricity Act, 2003, was a major reform in the power sector in general and power distribution in particular,
where it led to many structural and operational changes.
The Act also mandated the central government to introduce the National Electricity Policy, NTP, national policies on
standalone systems for rural areas and on electrification and local distribution in rural areas, while mandating the
CEA to frame a National Electricity Plan once every five years, to be revised from time to time in accordance with the
National Electricity Policy. Some common objectives of these policies are availability of electricity for all, improved
quality of power at affordable tariffs, the promotion of transparency and the improved financial viability of the sector.
The Act also led to a re-structuring of the power sector. Previously, there was a single buyer-single seller model
wherein the SEB either had to use self-generated power or purchase power from CPSUs, while the consumer was
forced to buy power only from the SEB. The Act envisaged a scenario where a buyer (distribution licensee) could
avail of electricity supply from a range of suppliers (generator, traders), depending upon competitive forces. Similarly,
a consumer could either choose to be supplied by a distribution licensee or an OA source.
Despite many changes in the power distribution sector due to the enactment of the Act, the desired outcomes have
not been completely achieved. For example, despite most SEBs having been unbundled, the objectives behind the
same i.e. the functional independence of utilities and encouragement of competition has still not been achieved.
The background, objective and impact of various individual reforms, as laid down by the Electricity Act, 2003, are
described in the succeeding paragraphs.
Strengths and shortcomings
Strengths
Tariff rationalisation and attracting of private investment in the power sector
Increased competition in distribution sector with the introduction of OA
Ensuring transparent policies regarding subsidies, safeguarding of consumer interest
Shortcomings
Despite most SEBs being unbundled, there has been little functional independence of utilities
Cost-plus approach for rate determination was unsustainable in the long run
No/marginal increase in competition
B.3.4 Private distribution licensee (2002 onwards)
The opening of the distribution sector to private sector participation was expected to bring in much needed efficiency
in operations, improving quality of service and power and encouraging new investments to achieve 100%
electrification.
Reform drivers
State government-owned distribution utilities/SEBs were neither able to bring down AT&C losses nor provide
consistent access to quality electricity supply. Reform measures were thus initiated to enable privatisation of
distribution utilities to ensure affordable and reliable electricity supply to consumers across India.
Reform process
The privatisation of discoms was undertaken by the governments of the respective states and union territories, like
Odisha, Delhi, Gujarat and Kolkata, for example, where private discoms like BSES, AES in Torrent and CESC were
set up. Subsequently, the privatisation of distribution companies became even more feasible post the enactment of
the Electricity Act, 2003, which allowed any private entity to apply for a distribution licence.

87
B.3.4.1 The Delhi privatisation model
The Delhi Vidyut Board (DVB) looked after the generation, transmission, and distribution of power in Delhi before
privatisation, with the exception of a small area, which is still served by New Delhi Municipal Corporation (NDMC)
and Military Engineering Services (MES).
Before privatisation, DVB incurred huge losses on account of high AT&C losses. In order to identify the core issues
driving these losses, DVB undertook a detailed study which identified the following pain points:
Theft and pilferage: Illegal use of electricity by many consumers
Connection and metering: Many consumers did not have proper metering
Unauthorised colonies: Many consumers were using power in unauthorised areas where issuing of connections
was impossible
Figure 21: Losses booked by DVB (Rs crore)
Source: The Annual Report (2001–02) on The Working of State Electricity Boards & Electricity Departments: Planning Commission
(Power & Energy Division), Government of India, May 2002
Owing to very low realisation on account of high T&D losses and inadequate tariffs, DVB’s losses spiralled out of
control. Moreover, the stressed balance sheet of DVB made it difficult for it to arrange the finances required to
undertake normal operations.
DVB realised that bold reforms were necessary, unbundling being one measure envisaged. However, after
unbundling DVB, the Government of National Capital Territory of Delhi (GNCTD) decided to invite private players for
the distribution of electricity in three distribution zones in Delhi. According to the model adopted, a private participant
would have a 51% stake and GNCTD would hold a 49% in the new company. Through competitive bidding and
extensive discussions with bidders, Tata Power was declared the winner in one circle, i.e., north and northwest circle,
and BSES in two circles, i.e., the central and east, and south and west circles. The selection criteria for the bids was
the on-year reduction in AT&C losses to be achieved from fiscal 2002 to 2007.
Results after adopting various initiatives under PPP
Tata Power Delhi Distribution Limited (TPDDL), which was contractually obligated to reduce AT&C losses by 19.25%,
was able to pare losses by 25.72% by fiscal 2007. AT&C losses had declined to 9% by end-fiscal 2016.

88
Figure 22: AT&C losses in Delhi
Source: PFC Performance of Distribution Utilities
Initiatives undertaken for achieving reduction in AT&C losses
1. Managerial initiatives
a. A dedicated corporate strategy planning and performance management group
b. A robust management team of 30 professionals with distributed leadership
c. Three-tiered balanced scorecard approach to execute strategy, inculcating a performance-driven culture
and a focus on sustained improvements
d. Assimilating employees of DVB into the TPDDL workforce by taking proper steps to build the capacity
and confidence of these employees
e. Adopting policies such as code of conduct, whistle-blower policy and sexual harassment policy, etc., to
inculcate an ethical and transparent work environment
f. Introduction of various initiatives such as establishment of committees to oversee safety issues, enabling
portals and call centres to register safety concerns, use of media and other tools to disseminate safety
information, etc.
g. Proper communication with workforce by appointing human resource nodal officers at all locations,
surveys to identify workforce satisfaction.
2. Technical initiatives
a. Decreased AT&C losses by replacing electromechanical meters, improving the low tension/high tension
ratio by installing small capacity transformers near the load centre
b. Improving system reliability through various initiatives such as decentralisation of operations and
maintenance with dedicated maintenance, distributed automation across operations, replacement of old
11kV switchgear with state-of-art supervisory control and data acquisition (SCADA), etc.
c. Meeting growth in load by establishing new grid sub-stations and augmenting the capacity of overloaded
grid sub-stations.
3. Consumer-centric initiatives
a. Economically weaker consumers be taken under their ambit so that they don’t resort to thieving electricity
b. Initiatives to reduce electricity theft such as waiving a small part of outstanding dues, establishing
certainty of punishment, and waiver of 25% of the billed amount for those consumers opting for
settlements

89
Reaching out to consumers through initiatives such as conducting meetings with individual resident welfare
associations, consumer satisfaction surveys
Reforms impact
The privatisation of distribution licensees has been able to meet the desired objective of lowering AT&C losses. In
Delhi, for example, private distribution licensees have been able to reduce AT&C losses in their respective areas
from 55% in fiscal 2003 to below 15% in fiscal 2016. Other existing distribution licensees (except for distribution
licensees of Odisha as detailed above) have also kept AT&C losses low in their respective areas.
However, there have been minor issues regarding audit of accounts of these discoms, the role of state governments
in fixation of discom tariffs and payment of dues of CPSUs.
Strengths and shortcomings
Strengths
Introduction of much needed efficiency in operations (reduction in AT&C losses)
Improved service and power quality
Encouragement of new investments to achieve 100% electrification
Shortcomings
Issues regarding audit of discom accounts
Discom tariffs still primarily controlled by state governments
B.3.5 The distribution franchisee model (2003 onwards)
It was assumed that distribution franchises would help achieve the same objectives expected from the private sector
distribution companies i.e. improved quality of power with low power outages and losses at affordable tariffs.
Reform drivers
Various state governments and their distribution utilities were not entirely comfortable transferring all their
rights/responsibilities to a private entity. Hence, the concept of a franchisee, as per clause 14 of the Electricity Act,
2003, was put into practice. The key difference between a distribution franchisee model and a privatised distribution
company is that the capital expenditure is not passed through to consumers under the former, while a private discom
recovers that expense from consumers. Besides, government discom employees are on deputation from the utility
concerned; they return to their parent company at the end of the franchisee period. Hence, this measure was
promoted as an alternative to privatisation.
Reform process
In the franchisee model, contracts for various functions of the distribution licensee are handed over to the franchisee,
based on the extent of private participation sought by the state government/distribution utility. The same may extend
from billing and collection of electricity bills from consumers to an input-based franchisee model where the franchisee
procures power, is involved in repairs and maintenance of distribution network, incurs capital expenditure and also
undertakes billing and revenue collection.
B.3.5.1 The case of Odisha
With the financial health of the OSEB deteriorating, AT&C losses between fiscals 1991 and 1996 ranged between
49.02% and 52.1%. After the introduction of the Electricity Act, 2003, and the unbundling of the power sector in
Odisha, the OPGC was formed to control thermal power stations in India. While OHPC was formed to take care of
the hydro sector, GRIDCO would handle the distribution business.
In order to better manage the distribution business, GRIDCO corporatised and disinvested the distribution business.
Three of the four zones in the distribution business, viz., WESCO, NESCO, and SOUTHCO came under the Bombay
Suburban Electricity Supply (BSES) through a bidding process. The fourth zone, CESCO, after many changes, came
under the control of the central electricity supply utility (CESU). The performance of NESCO is highlighted below:

90
Figure 23: Financial performance of NESCO
Source: OERC
As can be seen, the financial position of NESCO and all the other companies has only worsened since they started
operation. One of the major reasons for not meeting the desired result was because of inadequate capital expenditure
to reduce AT&C losses.
Table 8: Capex in different states
Capex (Rs cr/ MW) FY11 FY12 FY13 FY14 FY15 FY16
Bihar - - 0.02 0.35 0.82 1.39
Chhattisgarh 0.15 0.12 0.14 0.48 0.29 0.05
Delhi 0.21 0.12 0.11 0.12 0.11 0.13
Gujarat 0.12 0.18 0.23 0.23 0.24 0.22
Haryana 0.23 0.10 0.10 0.17 0.12 0.10
Himachal Pradesh 0.41 0.42 0.24 0.18 0.27 0.36
Jharkhand - - - 0.24 1.96 1.77
Madhya Pradesh 0.14 0.26 0.30 0.33 0.26 0.23
Odisha 0.03 0.03 0.03 0.13 0.03 0.08
Source: CRIS Analysis and PFC report on Distribution utilities performance
Due to a financial crunch, CESU planned to implement distribution franchisees in some of its licensee areas. Initially,
it adopted many mechanisms to mitigate technical and financial losses. It identified 15 divisions under five circles
where losses were very high and the revenue realisation per unit against electricity supplied by the utility was less
than the bulk supply tariff. In fiscal 2012, CESU was recovering only Rs 1.57 per unit of electricity supplied, while it
was paying Rs 2.44 to GRIDCO from which it purchased power.
After many discussions with private players, it was decided to adopt an input-based franchise with an incremental
revenue sharing (IBF-IRS) model. In fiscal 2012, bids were invited for five circles and the bidding was carried out on
the basis of a fixed loss reduction trajectory proposed by the bidder and on-year percentage sharing of incremental
revenue with CESU.
(826.41) (906.32) (955.28)(1,082.09)
(1,225.97) (1,308.84) (1,500.00)
(1,000.00)
(500.00)
-
500.00
1,000.00
1,500.00
2,000.00
FY 12 FY 13 FY 14 FY 15 FY 16 FY 17
GFA Receivables Accumulated lossess

91
Table 9: Identified circles and selected DFs
S No Circle Private company (winning bidder)
1 Dhenkanal circle Shyam Indus
2 Cuttack circle Shyam Indus
3 Circle –I Shyam Indus
4 Circle –II Feedback Energy Distribution company ltd (FEDCO)
5 Paradeep circle Enzen Global Solution private ltd
At the time of takeover, AT&C loss of Circle-II was 57.14%. Puri division had the highest loss (67.06%) while Khordha
had the lowest (47.72%) among the four. FEDCO’s billing efficiency, collection efficiency, and AT&C loss levels are
shown below:
Figure 24: AT&C losses in the franchised area for FEDCO
In both the Delhi and Odisha case studies, privatisation was one of the measures adopted. However, in Odisha, the
turnaround achieved was not as expected. Key differences between Odisha and Delhi were in each city’s consumer
mix and capex. Good consumer mix and high population density helped NDPL/BSES to concentrate on specific areas
and achieve its target. However, in the case of Odisha, the consumer mix was not very favourable and the existence
of a large unconnected population added to the challenge.
Reform impact
Various distribution franchisees have been appointed across the country. The appointment of the first private
franchisee, Torrent Power, a power distribution franchisee in the Bhiwandi area of MSEDCL, was touted as a success
as it led to a considerable reduction in AT&C losses. However, the model has been far less successful elsewhere,
including in Uttar Pradesh, Madhya Pradesh and Maharashtra, with respect to its prime objective of reducing AT&C
losses. The model has also met with limited success in Odisha and Jharkhand.
Strengths and shortcomings
Strengths
Many state governments were not entirely comfortable transferring their rights to a private entity, thereby allowing partial rights through the concept of franchisee allowed
Improved quality of power with low power outages and losses, at affordable tariffs
Shortcomings
AT&C losses declined in Bhiwandi, but not in other areas
Transparency in sharing baseline data, rollout plan of capital investment by franchisee, core sector experience of franchisee , regulatory monitoring on franchisee etc. is required
48%
64%60%
59%
43%
59%
55% 52%
30%
35%
40%
45%
50%
55%
60%
65%
70%
Khordha Puri Balugaon Nayagarh
AT&C efficeincy baseline (FY2012) AT&C efficeincy Actual (FY2014)

92
B.4 Operational reforms
B.4.1 Tariff determination by regulatory commissions (2003 onwards)
This reform measure was undertaken to reduce political interference in the functioning of SEBs, via the creation of a
separate regulatory body for the setting of tariffs. It was assumed that an independent regulator would determine
tariffs on rational grounds and not on the basis of political compulsions.
Reform drivers
Tariff determination pre-2003 was driven primarily by political compulsions, with no correlation to actual cost of
supply. This resulted in mounting losses and debts for distribution licensees/SEBs.
Reform process
The central government introduced the Electricity Regulatory Commissions Act, 1998, and later the Electricity Act,
2003, as detailed in earlier paragraphs, in order to set up SERCs to independently determine tariffs in relation to
actual cost of supply. The Electricity Act, 2003, made it compulsory for states to form SERCs to regulate the power
sector in their respective states. Clause 62 of the Electricity Act, 2003, also mandated SERCs to determine tariffs for
supply of electricity by distribution utilities/SEBs. The state government can only intervene to lower tariffs for any
category of consumers via the release of a subsidy to the distribution licensee.
Reform impact
SERCs regularly determine electricity tariffs in almost all states. However, due to various factors, electricity tariffs still
do not reflect the actual cost of supply, causing distribution licensees to continue to accumulate losses. There have
been many instances of state distribution licensees not filing tariff petitions continuously for many years, leading to
the non-determination of tariff for the state. However, recently, the APTEL, in its judgment, directed that SERCs can
suo-motu determine tariff in the absence of a tariff petition filed by the licensee. Trajectory of reduction in cross-
subsidy as per the Electricity Act, 2003, and NTP have also not been adhered to.
Figure 25: Difference between ACOS and ARR (without subsidy) in Rs/kWh (fiscal 2014)
Strengths and shortcomings
Strengths
SERCs can independently determine tariffs with relation to actual cost of supply
Shortcomings
Despite SERCs regularly determining tariff for supply of electricity in almost all states, current tariff still does not reflect actual cost of supply
Distribution licensees continue to accumulate losses
Trajectory of reduction in cross-subsidy as per Electricity Act, 2003, and the NTP have not been adhered to
2.89 2.832.45
2.081.7 1.68
1 0.98 0.92
0.37 0.28 0.18 0.15 0.14 0.12 0.07-0.01 -0.13 -0.27
-0.5
0
0.5
1
1.5
2
2.5
3
3.5

93
B.4.2 OA (2003 onwards)
Not only was OA expected to give consumers the choice to select suppliers providing cheap and reliable power, but
also promote competition between distribution licensees, leading them to improve their performance to retain their
consumer bases.
Reform drivers
In India, pre-2003, power supply was almost completely in the hand of state government utilities, restricting consumer
choice, particularly for bulk consumers like industries which received unreliable power at a high cost. In power
distribution, OA is the only means by which competition, a hallmark of the Electricity Act, 2003, can be promoted.
Reform process
Open access was introduced as a part of the Electricity Act, 2003, which mandated SERCs to introduce an OA
regulatory framework within one year of the commencement of the Act i.e. by 2004. The Electricity Act, 2003,
mandated that the state commission would, not later than five years from the date of commencement of the Electricity
Act, 2003, by separate OA regulations, provide such OA to all consumers who required a supply of electricity where
the maximum power to be made available at any time exceeded 1 MW. This minimum capacity size of 1 MW was
subsequently required to be phased out, enabling retail consumers, irrespective of sanctioned/contracted load, to be
offered non-discriminatory OA.
Reform impact
Though many generators and consumers today have been able to opt for OA power vis-a-vis that purchased/supplied
by distribution licensees, the volume of the same is sub-optimal. Some of the reasons preventing non-discriminatory
OA include:
High cross-subsidy surcharge and applicable OA charges and losses: The Electricity Act, 2003, envisaged
a gradual reduction in cross-subsidy surcharge to promote OA with limit of +/- 20% of average cost of supply by
fiscal 2012. However, the same has not been achieved till date. Open access charges and losses are also kept
at a higher level to discourage migration of high paying industrial/commercial consumers.
Procedural impediments: To discourage migration of high paying industrial/commercial consumers, utilities
often create procedural impediments when processing consumer requests for OA. The utility also doesn’t co-
operate in processes like energy accounting while OA is functional.
Strengths and shortcomings
Strengths
Gave consumers the choice to select suppliers providing cheap and reliable power
Shortcomings
Open access charges and losses were kept at higher level to discourage migration of high paying industrial/commercial consumers
More often than not, utilities create procedural impediments when processing consumer requests for OA
B.4.3 Deen Dayal Upadhyaya Gram Jyoti Yojana (DDUGJY)
Reform drivers
The DDUGJY was introduced to mitigate the following problems:
1. Frequent load shedding in rural areas, affecting power supply to agricultural and non-agricultural consumers
2. Unregulated power supply to agricultural consumers, affecting demand-side management
3. Poor upkeep and maintenance of assets owing to under-investment in distribution assets. The low investments
in discoms were due to their bad financial health
4. High distribution losses and an inability to track the same, exacerbating the poor financial health of discoms

94
Reform process
The following are the main features of the scheme:
a) Component 1: Separation of agricultural and non-agricultural feeders, ensuring judicious power supply to both
agricultural and non-agricultural feeders in rural areas
b) Component 2: Strengthening and augmentation of sub-transmission and distribution, which includes metering
of distribution transformers, feeders, and at the consumer-end
c) Component 3: Rural electrification as per the targets laid down by RGGVY for Twelfth and Thirteenth Five-Year
Plans, by subsuming RGGVY and DDUGJY
Table 10: Scheme cost and budget
Rs crore Scheme cost Approved scheme cost Budgetary support
Components 1&2 43,033 43,033 33,453
Component 3* 39,275 39,275 35,447
*- This is the component approved under RGGVY before it got subsumed under DDUGJY
B.4.4 Accelerated Power Development and Reforms Program (APDRP) and re-structured
APDRP (R-APDRP) (2002 onwards)
APDRP and R-APDRP were expected to reduce the overall AT&C losses in the distribution system by strengthening
transmission and distribution networks. It was assumed that incentivisation of distribution utilities to improve their
performance would drive them to build efficient infrastructure.
Reform drivers
The growth of the sub-transmission and distribution sector was not able to match the investments in generation
capacity addition. Since the power distribution sector was monopolised by state-controlled distribution utilities/SEBs,
customer satisfaction was largely neglected, while there was a limited emphasis by utilities on the reduction of their
AT&C losses. Hence, a need to take a more commercially-focused approach towards the power sector, in order to
encourage investments in the distribution sector was felt, along with usage of an IT framework, leading to the
introduction of APDRP and R-APDRP.
Reform process
The central government decided that funds should be made available to state-controlled discoms for urban areas to
invest in the IT intervention required for better consumer service, metering, SCADA (for metros) and establishment
of baseline losses (Part-A), and to strengthen distribution and sub-transmission (Part-B). Funds were made available
both in the form of loans and grants. After the establishment of the baseline AT&C loss by installing ring-fencing
meters (under Part-A), the performance of the project area was monitored in reference to AT&C losses. If the
reduction in AT&C losses did not follow the trajectory specified under the scheme, the grants were converted into
loans, and alternatively, if the utility was able to achieve the reduction in AT&C losses specified in the project
document, grants were kept as grants.
Reform impact
Despite large fund disbursements under this scheme, AT&C losses of utilities continue to be high. However, the
scheme has led to creation of infrastructure in urban areas, better consumer service and an automated billing
process.
FY11 FY12 FY13 FY14 FY 15 FY 16
AT&C losses 26.35% 26.63% 25.48% 22.58% 25.72% 23.98%
Source: PFC report

95
Figure 26: Difference in AT&C losses from 2007 to 2014 (%)
IPDS
The IPDS scheme was an extension of the ongoing R-APDRP scheme. The objectives under IPDS were:
a) Strengthening of sub-transmission and distribution network in urban areas
b) The metering of distribution transformers /feeders / consumers in urban areas
c) IT-enablement of distribution sector and strengthening of distribution network under R-APDRP for Twelfth
and Thirteenth Five-Year Plans by carrying forward the approved outlay for R-APDRP to IPDS.
The IPDS aimed at reducing AT&C losses, establishing IT-enabled systems for energy accounting and auditing,
improving billed energy based on metered consumption, and improving collection efficiency.
Strengths and shortcomings
Strengths
Investment in IT intervention for better consumer service, metering, SCADA (for metros) and establishment of baseline losses
Strengthening of distribution and sub-transmission
Shortcomings
Despite large fund disbursements, AT&C losses of utilities continue to be high
B.5 Financial reforms
B.5.1 Bailout package (2001)
Considering the mounting commercial losses of SEBs, and their mounting arrears to central public sector
undertakings like the National Thermal Power Corporation and the Power Grid Corporation of India, a one-time bailout
package was announced for SEBs to clean up their balance sheets and improve their operational efficiency so as to
ensure timely payments going forward.
Reforms drivers
Despite significant reform and restructuring during the 1990s, state utilities continued to underperform commercially.
By 2001, power sector commercial losses had risen to about Rs 25,000 crore (1.5% of GDP then). In order to help
SEBs clear mounting pending bills and avoid hurting their creditworthiness, the bailout package was thought to be
the need of the hour.
Reforms process
20.4919.31 18.44 17.82 17.66
15.12
10.11
6.88 6.264.93
2.49 1.42-1.31 -8.81
-15
-10
-5
0
5
10
15
20
25

96
An expert committee under the Deputy Chairman of the Planning Commission recommended and implemented a
bailout plan for the sector to ease the financial situation of SEBs and ensure payment clearance for CPSUs. The
bailout package was subsequently approved by the central government.
Reforms impact
To restore the sector to financial solvency, the bailout converted Rs 35,000 crore ($7.4 billion) of debt (outstanding
SEB arrears) into state government bonds and waived 50% of the interest outstanding. Thus, a number of states
began fiscal 2003 with accumulated losses that were lower than the previous fiscal, fiscal 2003 serving as the starting
point for the reforms that followed.
Strengths and shortcomings
Strengths
One-time bailout package for SEBs to clean their balance sheets
Avoided hurting the creditworthiness of SEBs
Improved operational efficiency of SEBs, ensuring timely payments going forward
Shortcomings
The losses did not stop as tariffs were still politically influenced
It served as a starting point for reforms that followed but this one-time bailout was not a long-term solution for the dismal financial performance of SEBs
B.5.2 Financial restructuring package (2012 onwards)
In keeping with the dismal scenario, the central government introduced a financial restructuring package (FRP) that
was envisaged as one-time mechanism to ease the financial situation of discoms and financial institutions. It was
further envisaged that discoms availing the FRP would improve their operational performance by meeting strict
targets for reduction of the gap between average revenue realisation and actual cost of supply.
Reforms drivers
As in 2012, discoms had borrowed heavily to strengthen their systems and manage growing loads, leading to a
financial burden as revenue did not grow proportionately. Further, to meet increasing revenue deficits due to rising
fuel/ power purchase costs and tariff constraints by SERCs, the discoms borrowed heavily, leading to debt
entrapments. The banking sector’s short-term exposure to discoms reached an estimated Rs 1.5 trillion, which were
primarily availed of to fund cash losses. Any slippage on the part of the discoms in the repayment of these loans
could have created huge NPAs for the banking sector.
Reforms process
As per the scheme, the respective state government would take over 50% of outstanding short-term loans (incl.
payables for power purchase) as on March 31, 2012, to be converted into bonds backed by a government guarantee
and moratorium of 3-5 years, with a repayment period of 10 years. The balance 50% of short-term loans would be
restructured into long-term loans by lenders with moratorium on principal repayments up to 3 years, lenient repayment
terms and waiver of penal interest. The central government would provide additional support through a transitory
financing mechanism (TFM) grant on accelerated reduction in AT&C loss targets in case the gap between ARR &
ACS was reduced by more than 25% within the first three years, and reimbursement support of 25% of principal
repayment in case the state government took over the entire 50% of outstanding short-term loans.
Reforms impact
The scheme was availed by eight states (Tamil Nadu, Uttar Pradesh, Rajasthan, Haryana, Jharkhand, Bihar, Andhra
Pradesh and Telangana). However, none of these states showed the desired improvement in operational
parameters. The states also did not enact the model State Electricity Distribution Responsibility Bill, 2013, as
mandated in the scheme, to enforce discipline in the working of the state power distribution companies.
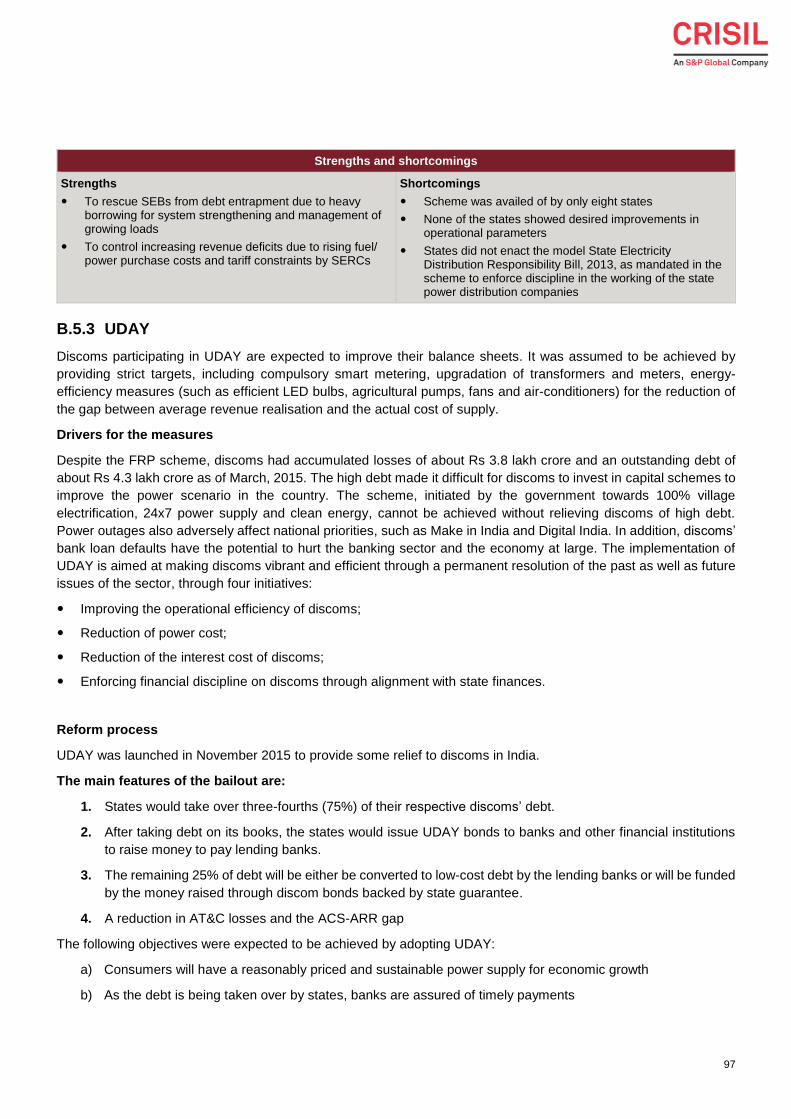
97
Strengths and shortcomings
Strengths
To rescue SEBs from debt entrapment due to heavy borrowing for system strengthening and management of growing loads
To control increasing revenue deficits due to rising fuel/ power purchase costs and tariff constraints by SERCs
Shortcomings
Scheme was availed of by only eight states
None of the states showed desired improvements in operational parameters
States did not enact the model State Electricity Distribution Responsibility Bill, 2013, as mandated in the scheme to enforce discipline in the working of the state power distribution companies
B.5.3 UDAY
Discoms participating in UDAY are expected to improve their balance sheets. It was assumed to be achieved by
providing strict targets, including compulsory smart metering, upgradation of transformers and meters, energy-
efficiency measures (such as efficient LED bulbs, agricultural pumps, fans and air-conditioners) for the reduction of
the gap between average revenue realisation and the actual cost of supply.
Drivers for the measures
Despite the FRP scheme, discoms had accumulated losses of about Rs 3.8 lakh crore and an outstanding debt of
about Rs 4.3 lakh crore as of March, 2015. The high debt made it difficult for discoms to invest in capital schemes to
improve the power scenario in the country. The scheme, initiated by the government towards 100% village
electrification, 24x7 power supply and clean energy, cannot be achieved without relieving discoms of high debt.
Power outages also adversely affect national priorities, such as Make in India and Digital India. In addition, discoms’
bank loan defaults have the potential to hurt the banking sector and the economy at large. The implementation of
UDAY is aimed at making discoms vibrant and efficient through a permanent resolution of the past as well as future
issues of the sector, through four initiatives:
Improving the operational efficiency of discoms;
Reduction of power cost;
Reduction of the interest cost of discoms;
Enforcing financial discipline on discoms through alignment with state finances.
Reform process
UDAY was launched in November 2015 to provide some relief to discoms in India.
The main features of the bailout are:
1. States would take over three-fourths (75%) of their respective discoms’ debt.
2. After taking debt on its books, the states would issue UDAY bonds to banks and other financial institutions
to raise money to pay lending banks.
3. The remaining 25% of debt will be either be converted to low-cost debt by the lending banks or will be funded
by the money raised through discom bonds backed by state guarantee.
4. A reduction in AT&C losses and the ACS-ARR gap
The following objectives were expected to be achieved by adopting UDAY:
a) Consumers will have a reasonably priced and sustainable power supply for economic growth
b) As the debt is being taken over by states, banks are assured of timely payments

98
c) Earlier discoms were constrained with their electricity purchases, leading generation companies’ plants to be
idle. After the bailout, the discoms are expected to increase electricity purchases.
Expected reforms after the bailout:
1. The discoms would be given target dates to meet the efficiency parameters, such as a reduction in the power
lost through transmission, power theft and faulty metering, installing smart meters, and implementing GIS
mapping of loss-making areas.
Table 11: Performance of states after adopting UDAY
S No State/union territory AT&C loss (%) ACS-ARR gap (Rs/unit)
1 Gujarat 11.88 -0.04
2 Andhra Pradesh 9.71 0.03
3 Karnataka 15.28 -0.1
4 Maharashtra 20.15 -0.05
5 Himachal Pradesh 6.1 -0.1
6 Madhya Pradesh 31.63 0.48
7 Haryana 23.28 0.23
8 Tripura 21.4 0.18
9 Goa 17.44 0.44
10 Bihar 36.75 0.48
11 Assam 19.96 0.09
12 Manipur 25 -
13 Punjab 30.91 1.03
14 Rajasthan 24.44 0.26
15 Uttarakhand 26.61 0.03
16 Chhattisgarh 22.25 0.27
17 Puducherry 22.56 -
18 Jharkhand 36.28 0.71
19 Telangana 13.44 0.58
20 Uttar Pradesh 31.43 0.72
21 Meghalaya 32.28 1.05
22 Kerala 11.57 0.24
23 Jammu & Kashmir 57.28 2.72
24 Daman & Diu NA NA
25 Tamil Nadu 14.04 0.24
Source: UDAY

99
Figure 27: Financial and operational Indicators
Impact of the reform
Most of the states still lag in operational efficiency, both in terms of AT&C losses, thereby missing the target for ACS-
ARR gap.
Strengths and shortcomings
Strengths
Reduction of power cost
Reduction of discoms’ interest cost
Enforcing financial discipline in discoms through alignment with state finances
Improving operational efficiency of discoms
Compulsory smart metering, upgradation of transformers and meters
Shortcomings
Most discoms have missed the targets
In many discoms, the losses have actually increased
•Bonds issued: Rs 2,32,163 crore (86.29 %)
•Bonds to be issued: Rs 2,69,056.35 crore
Bonds
•21.63 %
AT&C losses
•Rs 0.32/unit
ACS-ARR gap
•Done for 25 out of 27 states
Tariff Revision
Operational Iindicators
•Feeder metering (Urban) - 100%
•Feeder metering (Rural) - 100%
•DT metering (Urban) - 57%
•DT metering (Rural) - 49%
•Electricity access to unconnected households - 82%
•Smart metering - 3%
•Smart metering above 200 and up to 500 kWH - 1%
•Feeder segregation - 62%
•Rural feeder audit - 100%
•Distribution of feeders under Ujala - 100%

100
Annexure C - Open access in distribution sector (non-utility
consumers) and key challenges
C.1 Methodology adopted and stakeholders met
In this report, a diagnostic analysis has been carried out on the power distribution sector, based on the terms of
reference. The following literature has been reviewed and analysed for different sections of the TOR.
Means Area
Desktop study CRIS has reviewed the issues prevalent in the OA market & undertaken data analysis based on the following reports:
Growth in electricity sector in India from 1947-2018 (CEA)
Annual Report (CEA)
Report on Short Term Power Market in India (CERC)
Market Monitoring Report (CERC)
Regional Energy Account reports
In general, the barriers to OA implementation have been classified into financial and operational.
Analysis of financial barriers: Financial barriers are the biggest roadblock in
operationalising and success of the OA market in India. These have been analysed to point out issues in the tariff methodology used for OA consumers. The covered areas are:
1. Open-access market in India and their share in the overall short-term market
2. Different regulatory provisions and policy guidelines driving the OA market
3. Comparison of the current applicable formula for CSS and the formula under previous NTP
4. Margin for OA consumers for some select states
Operational barriers: Apart from financial barriers, there are operational
constraints that restrict the OA consumers. To identify the same, CRIS has met many IPPs, traders, power exchanges, and consumers who opt for OA in their respective states. CRIS had formulated a questionnaire to solicit their independent views. The issues pointed out during the interactions include:
6. No clear methodology is followed by SLDCs/discoms while evaluating the OA applications.
7. State discoms do not give consent, citing transmission constraints.
8. Even in states, where OA is allowed, SLDCs are not giving clearances on reasons and grounds that are not convincing to them.
9. Unlike RLDCs, which maintain information on the applications received and their status, a few SLDCs maintain a database of applications rejected.
10. Above all, there are operational bindings, which, if not followed, result in heavy penalties.
Primary research/ stakeholder interaction
CRIS has covered most of the OA through direct and indirect consultation with key entities in the power sector including Ministry of Power, CERC & state discoms.
Further interactions were also held with traders/exchanges, such as PTC India Ltd, Manikaran and IEX, to get the general perspective of OA consumers who trade through them.
Share of OA consumers in their portfolios

101
Means Area
Trader /Eexchange Volume Number of OA Consumers
PTC India 25,89630MU -
Manikaran 8000 MW ~2,000
IEX 40,079 MU 4,071
Mittal Processors 600 MU -
Apart from exchanges and traders, we have interacted with associations relevant to the power sector, IPPs and some consumers, who are currently availing of the OA in different states:
Stakeholders State and consumer industry
States covered for consumers
1. Odisha (steel manufacturers)
2. Haryana (steel manufacturers)
3. Uttarakhand (chemical manufacturers)
4. Rajasthan (textile companies)
5. Delhi (electrical companies)
6. Himachal Pradesh (cement manufacturers)
7. Andhra Pradesh (electrical manufacturers and textile spinning mills)
8. Karnataka (oil and gas companies)
9. Telangana (steel manufacturers)
10. Maharashtra (industrial suppliers)
11. West Bengal
12. Tamil Nadu (auto industry)
IPP and associations 1. JSW Energy (3,100 MW)
2. Jindal Power (3,400 MW)
3. Tata Power Company Ltd (6,200MW)
4. Torrent Power (3,100 MW)
5. Moser Baer Projects Pvt Ltd (1,200 MW)
6. Hero Future Energies Pvt Ltd (224 MW Solar)
7. Vedanta
8. Renew Power
9. Sembcorp (2600 MW)
10. GMR (4500 MW)
11. GVK Power (1700 MW)
12. IL&FS Energy (1200 MW)
C.2 An overview of the OA market in power distribution
The Electricity Act, 2003 promotes OA by allowing consumers to have ‘1 MW and above’ demand to procure power
from the open market, based on the most economical tariff realised. Section 42(2) of the Electricity Act, 2003,
mandates the provision of OA to all generators and utilities to promote competition and to open the electricity trading
market. The relevant sections of the Act are mentioned below.
30 Only short term and Exchange for FY 2017

102
Section 2(47) – Definition of OA
“Open access means the non-discriminatory provision for the use of transmission lines or distribution system or
associated facilities with such lines or system by any licensee or consumer or a person engaged in generation in
accordance with the regulations specified by the Appropriate Commission;”
Sections 38, 40, 42 and 86 deal with the responsibility of different parties towards OA consumers and its
implementation. Central transmission utility (CTU)/state transmission utilities (STUs) are the nodal agencies for
providing OA, and discoms/SLDCs are required to provide no-objection certificates (NOCs) to these OA consumers,
based on the criteria set by the respective SERCs.
Figure 28: Role assigned to stakeholders in ensuring implementation of OA
The Electricity Act, 2003, mandates that a state commission shall, not later than five years from the date of
commencement of the Act, by separate OA regulations, provide OA to all consumers, who require electricity supply,
where the maximum power to be made available at any time exceeds 1 MW. This minimum capacity size of 1 MW
was subsequently required to be phased out, which will enable retail consumers, irrespective of
sanctioned/contracted load, to be offered non-discriminatory OA. The relevant section of the Act is mentioned below.
Section 42: Duties of distribution licensee and OA
“Provided also that the State Commission shall, not later than five years from the date of commencement of the
Electricity (Amendment) Act, 2003, by regulations, provide such OA to all consumers who require a supply of
electricity where the maximum power to be made available at any time exceeds one megawatt.”
To follow this, most SERCs have issued OA regulations to allow intra-state OA in their respective states. Even though
the volume of power transacted through OA has been growing, it is yet to achieve its full potential.
C.3 OA market (non-utility consumers in power distribution)
The consumers can apply to procure power through OA under long, medium or short-term arrangement. Accordingly,
the consumers can be categorised into three baskets:
Long-term customer: These
are consumers, which use OA for 12-25 years
Medium-term customer: These
are consumers, which avail of OA for 3 months to 3 years
Short-term customer: These
are consumers, which utilise OA for up to one month at a time

103
Overall OA transactions (as a % of the power market) have dipped in the last year
The overall OA transactions (covering the short/ medium and long term transactions), have grown at a CAGR of 6.3%
(FY 11-18) and in comparison to the overall electricity generation has remained range bound from 15.0% to 17.0%.
However, with overall power market growth outpacing OA growth in the last year, OA transactions as a % of the
overall power market witnessed a dip in FY 18.
Figure 29: OA market vis a vis Indian power market
Source: CEA; Regional energy accounts; Data of key traders; CERC; CRIS estimates
Breakup of the OA transactions in FY’18 according to the consumer category indicates that majority of the OA
transactions are by Group Captive consumers (contributing ~85% of the overall OA transactions). The same is
indicated in the figure below:
Figure 30: Consumer category wise OA (%)
Source: CEA; Regional energy accounts; Data of key traders; CERC; CRIS estimates
The key reasons for limited medium and long term OA transactions (excluding railways and GC), has been the non-
availability of coal, which have been discussed in detail subsequently. Further medium and long-term OA have
many long-term implications such as tariff risk, cost, demand-related uncertainty and other operational challenges.
Hence most private OA consumers (excluding GC) in India opt for short term transactions. Short-term OA in India
has flourished with the introduction of power exchange, which has given these consumers a favourable platform to
procure power at an economical price. However, the OA market is yet to reach its full potential.
139 157 170 184 192 207 213 214
15.3%
16.6%16.1%
16.3%
15.4%
14.5%
15.0%
15.5%
16.0%
16.5%
17.0%
0
200
400
600
800
1000
1200
1400
1600
FY 11 FY 12 FY 13 FY 14 FY 15 FY 16 FY 17 FY 18
OA market share in the Indian power market (BU)
OA transactions (BU) Overall Energy (BU) % OA transactions
Group Captive85%
Railways7% Trader/ Bilateral
1%
Exchange7%
Other8%
Category wise OA (%)
Group Captive Railways Trader/ Bilateral Exchange

104
Short term OA market yet to achieve its full potential
Short-term transactions refer to contracts with a duration of less than one year, transacted bilaterally, through inter-
state trading licensees, directly by discoms and through power exchanges. While the overall short term power market
has grown at a healthy pace from 80 BU to 127 BU in eight years, the share of short-term transactions, as a
percentage of total electricity generation, has been in the 8-10% range. Volume of short-term transactions in fiscal
2018 remained close to 10%.
As per the data published by the CERC on the short-term power market, the number of OA consumers has increased
at a steady pace of 25% CAGR between fiscals 2011 and 2018. The number of OA consumers trading on the power
exchanges stood just above 4,800 as of fiscal 2018.
Figure 31: Number of OA consumers
Source: Reports on short-term power market in India published by CERC
However maximum number of consumers (as of March 2017) on IEX were concentrated in Tamil Nadu, followed by
Gujarat and Andhra Pradesh, which accounted for almost 50% of the total number of OA consumers.
The share of transactions by discoms in the short term markets has increased in the recent years, however the OA
share in exchanges saturated at 60% in fiscal 2017 and almost halved in fisal 2018. One of the main reasons for the
decline is the increase in cross-subsidy surcharge (CSS) and additional surcharge (AS) after the amendment in NTP
2016.
Figure 32: Share of OA on Exchange (Short Term Market)
Source: Report on short-term power market in India published by CERC
995 1199
2446
34313786
41774613 4807
0
1000
2000
3000
4000
5000
6000
FY 11 FY 12 FY 13 FY 14 FY 15 FY 16 FY 17 FY 18
No. of OA consumers in exchange
31%
60%
32%
0%
10%
20%
30%
40%
50%
60%
70%
-
10,000
20,000
30,000
40,000
50,000
2010-11 2011-12 2012-13 2013-14 2014-15 2015-16 2016-17 2017-18
Share of OA in Exchange
OAC Purchase (MU) Exchange Volume (MU) % of OAC

105
C.3.1 Cost economics – OA consumer versus potential OA consumer
CRIS interacted with the stakeholders to ascertain/validate some of the above factors that are adversely impacting
the OA market. The stakeholders include power generating entities, OA consumers, licensed traders, power
associations and the exchanges. The constraints/barriers are discussed in the subsequent section of the report.
Limited coal in the domestic market and the comparatively higher costs of imported and e-auctioned coal have
increased the overall cost for power generators, leading to a squeeze in the margin for potential OA purchase by
consumers.
Apart from high OA charges, supply-side constraints because of limited availability of domestic coal and high cost of
imported coal have led to an increase in the overall cost of power for generators selling power on exchanges or
through bilateral transactions. The average landed cost of linkage coal is almost 50% of the cost incurred for imported
coal of same quality. Even if one compares the e-auction price of coal with a premium of 30%, it will still be lower
than the cost incurred towards imported coal. A comparison of the average variable cost for a 500 MW unit with
domestic, e-auction and imported coal shows that even the variable cost cannot be recovered at the current level of
OA charges, in case of e-auction and imported coal are considered.
Some key parameters considered while computing variable cost of generation from thee different coal sources:
Type of coal Linkage coal E-auction coal Imported coal
Assumptions G6 coal of quality with GCV of 5500
85% PLF and 6% AUX
SHR of 2540 kCal /kWH
Premium of 30% on G6
85% PLF and 6% AUX
SHR of 2540 kCal /kWH
Coal landed cost at 115 USD/ MT
85% PLF and 6% AUX
SHR of 2540 kCal /kWh
Exchange rate of 67 Rs/USD
Landed coal cost (Rs/MT)
4,384 5,579 7,729
Plant capacity 500 MW 500 MW 500 MW
Figure 33: Landed cost for OA consumer based on different fuel source of power plant (Gujarat)
Source: Gujarat PGVCL Tariff order 2018-19, CRIS Analysis
It can be observed that even with linkage coal, the consumer will not be able to benefit from the OA route, with loading
of current OA charges.
3.52 3.52 3.52
2.10 2.67 3.68
-
1.00
2.00
3.00
4.00
5.00
6.00
7.00
8.00
9.00
10.00
Linkage Coal Auction Coal Imported Coal
Total OA Charges (Rs /kWh) Fuel Cost (Rs /kWh) Fixed cost (Rs /kWh)
Tariff 7.34
All options becomes un-viable at present OA charges

106
The landed cost for OA consumer in Andhra Pradesh is also compared.
Figure 34: Landed cost for OA consumer based on different fuel sources of power plants (Andhra Pradesh)
C.4 Hindrances to OA – created by state utilities and existing policies
To understand the cause and effect of various challenges for OA consumers, a detailed review of the issues prevalent
in the market has been done. In general, barriers to OA implementation have been classified as financial and
operational. A similar approach has been used in a consultation paper on issues pertaining to OA by the Ministry of
Power, Government of India31.
Financial barriers: Financial barriers are the biggest roadblock in operationalising the OA market in India, and
making it a success. The following aspects have been looked at to point out the issues in tariff methodology used for
consumers:
Open-access market in India
Different regulatory provisions and policy guidelines driving the market.
A comparison of the current applicable formula for CSS and the formula under previous NTP.
An analysis of the margin for OA consumers in some select states.
Operational barriers: Certain states restrict OA consumers from purchasing power from other sources. To identify
these IPPs, traders and consumers opting for OA were consulted. A questionnaire was shared with them to get their
view. Following are some of the operational barriers pointed out during the interaction:
States do not give NOCs, citing transmission constraints.
SLDCs do not give clearances citing some reason, which is not convincing to the consumers.
No clear methodology is followed by SLDCs/discoms while evaluating the OA applications. Unlike RLDCs, which
maintain information on applications received and their status, very few SLDCs tend to maintain a database on
rejected applications.
C.5 Financial barriers
Consumers opt for OA to benefit from lower prices on the exchanges, as this helps them in lowering the overall
electricity bill. The discoms have been mandated to provide OA to all consumers on payment of certain charges,
31 Ministry of Power Consultation paper on issues pertaining to Open Access (August 2017)
2.10 2.67 3.68
-
1.00
2.00
3.00
4.00
5.00
6.00
7.00
8.00
9.00
10.00
Linkage Coal Auction Coal Imported Coal
Total OA Charges (Rs /kWh) Fuel Cost (Rs /kWh) Fixed cost (Rs /kWh)
7.12

107
including wheeling charges, CSS and AS, based on the regulations set by the SERCs/CERC. To determine the
commercial viability, the consumer has to consider all those charges as well as system losses over and above the
cost of power procured from the IPP/exchange.
The key evidences of financial barriers created by states are:
C.5.1 Progressively increasing charges to hinder OA
Consumers are required to pay certain charges to the discoms for availing of OA. These charges are to be paid to
distribution licensees, transmission licensees and other service providers.
Table 12: Components of OA charges and losses applicable to a buyer
Applicable charges (Rs/kWh) Applicable losses (%)
Point-of-connection charges (for using interstate
transmission network and associated facilities for wheeling of electricity to the state periphery; determined by the commission)
Point-of-connection losses (loss of power during wheeling of
power from the feeding node to the state periphery)
State transmission charges (for using intra-state
transmission network and associated facilities for wheeling of electricity from the state periphery to utility periphery; determined by the commission)
State transmission losses (loss of power during wheeling of
power from the state periphery to the utility periphery)
Distribution wheeling charges (for using distribution network
and associated facilities for wheeling of electricity from the utility periphery to the metering point of the consumer; determined by the commission)
Distribution losses (loss of power during wheeling of power
from the utility periphery to metering point of the consumer)
Cross-subsidy surcharge or CSS (for bridging the gap/losses
for providing subsidised power; determined by the commission)
Additional surcharge or AS (for meeting the fixed cost of such
distribution licensee arising out of its obligation to supply; determined by the commission)
Renewable purchase obligation (RPO) regulatory charges (non-solar and solar) (applicable only in the case of non-
fulfilment of RPO targets; determined by the commission)
Transaction charge (charged by service provider - either
trader or power exchange)
NLDC/RLDC/SLDC scheduling and operating charges
(charges for system operation, energy accounting, energy scheduling)
Other charges (application fees, taxes)
Source: Orders and regulations issued by state commissions
These charges vary from state to state and with different voltage levels (11 kV, 33 kV, 66kV, 132 kV) at which the
consumer is connected. Typically these OA charges32 are higher at lower voltage and vice versa. For instance, for a
buyer at the 11 kV level, the total charges are as high as Rs 4.91 per unit in West Bengal, Rs 4.64 per unit in Delhi
(TPDDL) and as low as Rs 0.32 per unit in Tripura.
State regulatory commissions determine most of these charges based on the submissions made by discoms on an
annual basis. The methodology is set out in state OA regulations as amended from time to time. These regulations
32 Source : IEX

108
are guided by the CERC’s OA regulations and the NTP. The relevant section of the policy is mentioned in the box
below:
“Section 8.5 of NTP
S= T – [C/ (1-L/100) + D+ R]
Where,
S is the surcharge
T is the tariff payable by the relevant category of consumers, including reflecting the Renewable Purchase
Obligation
C is the per unit weighted-average cost of power purchase by the licensee, including meeting the
Renewable Purchase Obligation
D is the aggregate of transmission, distribution and wheeling charge applicable to the relevant voltage
level
L is the aggregate of transmission, distribution and commercial losses, expressed as a percentage
applicable to the relevant voltage level
R is the per-unit cost of carrying regulatory assets.”
“Section 8.5.1 NTP 2016
National Electricity Policy lays down that the amount of cross-subsidy surcharge and the additional surcharge
to be levied from consumers, who are permitted OA, should not be so onerous that it eliminates
competition which is intended to be fostered in generation and supply of power directly to the consumers
through OA”
“Section 8.5.4 NTP 2016
“The additional surcharge for obligation to supply as per section 42(4) of the Act should become applicable
only if it is conclusively demonstrated that the obligation of a licensee, in terms of existing power
purchase commitments, has been and continues to be stranded, or there is an unavoidable obligation and
incidence to bear fixed costs consequent to such a contract. The fixed costs related to network assets would
be recovered through wheeling charges. “
“Section 42 of the Electricity Act, 2003
(2) The State Commission shall introduce OA in such phases and, subject to such conditions, (including
cross-subsidies and other operational constraints) as may be specified within one year of the appointed date
by it and in specifying the extent of OA in successive phases and in determining the charges for wheeling,
it shall have due regard to all relevant factors including such cross-subsidies, and other operational
constraints:
Provided that 1[such OA shall be allowed on payment of a surcharge] in addition to the charges for wheeling
as may be determined by the State Commission:
Provided further that such surcharge shall be utilised to meet the requirements of current level of cross-
subsidy within the area of supply of the distribution licensee:

109
Provided also that such surcharge and cross subsidies shall be progressively reduced 2[***] in the
manner as may be specified by the State Commission:”
(4) Where the State Commission permits a consumer or class of consumers to receive supply of electricity
from a person other than the distribution licensee of his area of supply, such consumer shall be liable to pay
an additional surcharge on the charges of wheeling, as may be specified by the State Commission, to meet
the fixed cost of such distribution licensee arising out of his obligation to supply.
Both CSS and AS account for 60-70% of total OA charges
The CSS is payable by all OA consumers, except those who have
established captive generating stations33. It is also important to note that
the CSS is charged to meet the current level of cross-subsidy for the
consumer in the area of supply. While the Electricity Act, 2003, allows the
CSS, it clearly states that subsidies should progressively reduce. Section
8.5 of the NTP 2016 lays down the methodology for calculating this
surcharge and stresses on the fact that it should not eliminate competition.
NTP 2016 under Section 8.5.4 also lays down the principles to determine the AS to compensate the impact of OA
on discoms’ existing power-purchase commitments.
The below figure depicts the OA charges applicable at the 33 kV level in select states, such as Gujarat, Chhattisgarh,
Rajasthan, Maharashtra, Andhra Pradesh, Uttar Pradesh, Karnataka and Haryana:
Figure 35: OA charges applicable for the 33 kV voltage level for fiscal 2018
Source: IEX and tariff orders issued by state commissions for FY 2018
33 As per Section (38) of the Electricity Act, 2003, Captive users availing OA for carrying the electricity to a destination for their own use, does not
attract CSS
44%
52%
41%42% 63%
33%
61%
38%
21% 23%28%
23%
3.34
2.35
3.43
3.92
2.27
1.81
2.51
4.27
-
0.50
1.00
1.50
2.00
2.50
3.00
3.50
4.00
4.50
0%
10%
20%
30%
40%
50%
60%
70%
80%
90%
100%
Gujarat Chattisgarh Rajasthan Maharastra AndhraPradesh
Uttar Pradesh Karnataka(BESCOM)
Haryana
POC Charges State Transmission Distribution Wheeling Cost
CSS Additional Surcharge RPO Charges
RLDC Charges Total Charges (Rs /kWh)
NTP 2016 has tried to recover
the whole cost from OA
consumers, loading even the
inefficiencies of discoms

110
It is evident from the figure that states such as Gujarat, Maharashtra, Haryana, Rajasthan and New Delhi have higher
OA charges, ranging from Rs 3 to Rs 4 per unit. In addition to the OA charges, the consumer has to pay the fixed
charges, provide additional security deposit and bear network losses. If we combine all the charges, the OA consumer
will be left with very little margin to trade in the OA market. Such high charges have only made commercial viability
of any OA consumer more difficult.
Formula advised in NTP 2016 has increased CSS drastically
The intent of the OA was to provide consumers with various options to
choose their supplier through an open market. However, the revised
formula in NTP 2016 has tried to recover the whole cost of shifting of
consumers from discoms. If we compare with the formula in NTP 2006,
the new formula indirectly increased the CSS, which has impacted the
OA market. NTP 2006 had also suggested a reduction in the CSS to 20%
of its initial level by 2011. However, this provision has been changed.
The comparison of provisions related to CSS are presented below:
Table 13 : Comparison of cross-subsidy calculation (new and old formulae)
NTP 2006 NTP 2016
S = T – [ C (1+ L / 100) + D ] S = T – [ C (1- L / 100) + D + R ]
Where
S is the surcharge
T is the tariff payable by the relevant category of consumers;
C is the weighted-average cost of power purchase of top 5% at the margin, excluding liquid fuel-based generation and renewable power
D is the wheeling charge
L is the system losses for the applicable voltage level, expressed as a percentage
Where
S is the surcharge
T is the tariff payable by the relevant category of consumers, including reflecting the RPO
C is the per-unit weighted-average cost of power purchase by the licensee, including meeting the RPO
D is the aggregate of transmission, distribution and wheeling charge applicable to the relevant voltage level
L is the aggregate of transmission, distribution and commercial losses, expressed as a percentage applicable to the relevant voltage level
R is the per-unit cost of carrying regulatory assets.
The CSS should be brought down progressively and, as far as possible, at a linear rate to a maximum of 20% of its opening level by fiscal 2011.
The above formula may not work for all distribution licensees, particularly for those having power deficit, the state regulatory commissions, while keeping the overall objectives of the Electricity Act, 2003, in view, may review and vary the same, taking into consideration the different circumstances prevailing in the area of the distribution licensee.
Provided that the surcharge shall not exceed 20% of the tariff applicable to the category of the consumers seeking OA.
Provided further that the appropriate commission, in consultation with the relevant government, shall exempt a levy of cross-subsidy charge on the railways, as defined in the Indian Railways Act, 1989, being a deemed licensee, on electricity purchased for its own consumption.
In the above two formulae, the factor of ‘C’ has been changed in the revised tariff policy. As a result of this, the
surcharge has grown manifold in recent times, as can be referred from the calculation for Gujarat below.
In NTP 2016, the component
‘C’ has seen a major change
that has resulted in an
increase in CSS

111
Table 14 : Comparison of CSS (Gujarat case study)
Particulars (Rs kWh) Calculation of surcharge as per NTP 2016
Calculation of surcharge as per NTP 2006
Tariff payable by relevant category of consumer (T) 7.34 7.34
Cost of power purchase (C) 4.2234 6.073536
Wheeling charge (D) 0.15 0.15
Losses (L) 10% 10%
Cost of carrying regulatory assets (R) 0 0
Surcharge (S) as calculated using formulae 2.51 0.52
Applicable cross-subsidy surcharge as per the policy 1.47
(Surcharge cannot be more than 20% of tariff applicable to the
category)
0.52
Source: Tariff orders published by GERC (for 2016 calculation) and CRIS analysis (for 2006 calculation)
The NTP 2016 has capped CSS at 20% of the tariff, considering that the tariff has been determined within the
permissible range of +/-20% of ACOS, while in the case of NTP 2006, no such cap was introduced. However, the C
in the formula has been changed, which has increased the overall CSS.
As can be observed from the above, the CSS would have been much lower, if the previous provisions of the NTP
were followed. Further, as per the NTP 2006 and the Electricity Act 2003, the CSS was required to be tapered down
from its existing level to create a healthy OA market.
OA charges are progressively increasing unlike the intent of Section 42 of the Electricity Act, 2003
OA charges in some states (with major OA potential) are almost 75% of the average billing rate (ABR) for domestic
consumers and 50% for industrial consumers. This is depicted in the figure below:
Figure 36: Comparison of OA charges with consumer tariffs (domestic and industrial)
Source: IEX and Tariff orders for FY 2018
34 C is the per unit weighted average cost of power purchase by the Licensee, including meeting the Renewable Purchase Obligation
35 For the sake of calculations, the value of “C” has been taken from the GERC tariff order issued for 2016, as determined by the Commission
based on tariff policy 2006. Assuming the same will remain applicable for the present year as there is no change in the power purchase portfolio.
36 C is the Weighted average cost of power purchase of top 5% at the margin excluding liquid fuel based generation and renewable power
5.82
8.09 7.40
8.06 7.12
10.06
8.84
3.34
2.35 3.43 3.92
2.27
1.81 2.51
-
2.00
4.00
6.00
8.00
10.00
12.00
Gujarat Chattisgarh Rajasthan Maharastra Andhra Pradesh Uttar Pradesh Karnataka(BESCOM)
RS
/K
WH
ABR for Domestic ABR for Industry OA Charges

112
C.5.1.1 Evidence of increasing charges a deterrent to OA
State-wise trends in OA charges are discussed in this section for select states, including Punjab, Rajasthan,
Maharashtra, Karnataka and Uttarakhand.
Punjab: As can be observed from the below figure, the OA charges have increased from 2014 to 2018. The charges
were higher during fiscals 2016 and 2017 around ~Rs 3.5 per unit. The commission has also determined an additional
surcharge from 2016 that has severely impacted the commercial viability of OA consumers in the state. It is reflecting
in the OA volume on the exchange.
Figure 37: OA in Punjab at the 33 kV level
Source: Tariff orders for FY 2018, CRIS Analysis
Rajasthan:
As can be observed from the figure below, the charges, especially the CSS, are now higher from the 2014 level.
These were the highest during fiscals 2017 and 2018 around ~Rs 2.6 per unit. The commission has also determined
the AS from 2017 that has impacted the commercial viability of OA consumers in the state.
Figure 38: OA in Rajasthan at the 33 kV level
Source: Tariff orders for FY 2018, CRIS Analysis
2.35 2.16
3.51 3.48 2.86
-
0.50
1.00
1.50
2.00
2.50
3.00
3.50
4.00
-
0.20
0.40
0.60
0.80
1.00
1.20
1.40
1.60
33kV 33kV 33kV 33kV 33kV
2014 2015 2016 2017 2018
STU Charges Wheeling/Distribution Charge CSS AS Total
0.60 0.53 0.53
2.60 2.59
-
0.50
1.00
1.50
2.00
2.50
3.00
-
0.20
0.40
0.60
0.80
1.00
1.20
1.40
1.60
33kV 33kV 33kV 33kV 33kV
2014 2015 2016 2017 2018
STU Charges Wheeling/Distribution Charge CSS AS Total

113
Maharashtra:
As can be observed from the below figure, the charges, especially the cross-subsidy charges, gradually increased
since 2014. These were the highest during fiscals 2017 and 2018 around ~Rs 3.20 per unit. The commission has
also determined the AS from 2017 that has impacted the commercial viability of OA consumers in the state.
Figure 39: OA in Maharashtra at the 33 kV level
Source: Tariff orders for FY18, CRIS analysis
Karnataka:
As can be observed from the below figure, the charges, especially cross-subsidy charges, have grown manifold since
2014. These were the highest during fiscals 2017 and 2018 at around ~Rs 2.30 per unit. The commission has also
determined AS from 2017 that has impacted the commercial viability of OA consumers in the state.
Figure 40: OA in Karnataka at the 33 kV level
Source: Tariff orders for FY18, CRIS analysis
Uttarakhand:
As can be observed from the figure below, the charges have gradually increased since 2014. They were the highest
during fiscals 2017 and 2018, around ~Rs 1.40 per unit. The commission has also determined the AS from 2017 that
has impacted the commercial viability of OA consumers in the state.
1.75 1.90 1.90
3.18 3.19
-
0.50
1.00
1.50
2.00
2.50
3.00
3.50
-
0.20
0.40
0.60
0.80
1.00
1.20
1.40
1.60
1.80
33kV 33kV 33kV 33kV 33kV
2014 2015 2016 2017 2018
STU Charges Wheeling/Distribution Charge CSS AS Total
0.35
0.90
1.15
2.28 2.28
-
0.50
1.00
1.50
2.00
2.50
-
0.20
0.40
0.60
0.80
1.00
1.20
1.40
1.60
33kV 33kV 33kV 33kV 33kV
2014 2015 2016 2017 2018
STU Charges Wheeling/Distribution Charge CSS AS Total

114
Figure 41: OA in Uttarakhand at the 33 kV level
Source: Tariff orders for FY18, CRIS analysis
C.5.1.2 Low margins impact viability of existing OA consumers and thwart potential consumers
The OA charges have directly impacted the attractiveness of the market as an option for consumers. As seen from
the figure below, given the high tension industrial tariff with the applicable OA and fixed charges, consumers have
very little margin to purchase power from the open market.
Figure 42: Margins left for open consumers to procure power from market
Source: Tariff Orders.
* For Karnataka, proposal to revise the fixed charges has been taken
If we compare the margins after average market clearing prices, it is observed the years 2017 and 2018 have not
been very favourable for OA consumers. They had less probability of getting the right price in these years as
compared with 2016. Since the margin available for consumers has declined in most states, the overall OA
transactions have also dropped.
0.65 0.63 0.61
1.45 1.4
0
0.2
0.4
0.6
0.8
1
1.2
1.4
1.6
0
0.1
0.2
0.3
0.4
0.5
0.6
0.7
0.8
0.9
33kV 33kV 33kV 33kV 33kV
2014 2015 2016 2017 2018
STU Charges Wheeling/Distribution Charge CSS AS Total
1.36
2.17 2.50
2.91 3.25
3.60
4.54
-
1.00
2.00
3.00
4.00
5.00
-
2.00
4.00
6.00
8.00
10.00
12.00
Karnataka(BESCOM)
Gujarat Maharastra Rajasthan Chattisgarh AndhraPradesh
Uttar Pradesh
Viability/ Margin (Rs/kWh)
Total Charges Payable Total Tariff Margin Left

115
Figure 43: Market clearing price in IEX
Source: MCP IEX
A comparison of minimum clearing prices for the past three years shows prices remained at Rs 2-3 per unit for 80%
of the time in 2016, 62% of the time in 2017, and 16% of the time in the first quarter of 2018.
Figure 44: Market clearing prices in IEX
Histogram: Market clearing prices in 2016
Histogram: Market clearing prices in 2017
5.62 4.95
-
1.00
2.00
3.00
4.00
5.00
6.00
Jan
uary
Fe
bru
ary
Ma
rch
Ap
ril
Ma
y
Jun
e
July
Au
gu
st
Se
p
Oct
No
v
De
c
RS
/K
WH
2017 2018
0
20
40
60
80
100
120
140
2.00 2.25 2.50 2.75 3.00 3.25 3.50 3.75 4.00 4.25 4.50 4.75 5.00 5.25 5.50 5.75 More
Fre
qu
en
cy
Clearing price in INR/kWh
0
20
40
60
80
100
2.00 2.25 2.50 2.75 3.00 3.25 3.50 3.75 4.00 4.25 4.50 4.75 5.00 5.25 5.50 5.75 More
Fre
qu
en
cy
Clearing price in INR/ kWh

116
Histogram: Market clearing prices in 2018 (January to March)
The market clearing prices of power as well as OA charges are the important factors determining commercial viability
for OA consumers. While the market clearing prices of power are purely driven by the demand-supply scenario, OA
charges are driven by several parameters. These include, but are not limited to, rules and regulations governing the
power sector, the demand-supply situation in the state, health of the utility, availability of data points to determine
tariffs, and existing level of cross-subsidisation in the state. More importantly, the calculation methodology to
determine the CSS and AS should be designed to not only protect the interest of discoms but also promote
competition since this is the main factor creating artificial financial barriers.
C.6 Operational barriers: Bottlenecks to OA implementation
Apart from the abovementioned financial barriers, there are process-related impediments to OA. These include
processes adopted for submission of applications to discoms and obtaining an NOC from the SLDC. The application
procedure, fees, and timeline for eligible consumers seeking OA depend on three criteria: connection point, location
of drawl point, and period of the OA. These define the category of the OA consumer.
Figure 45: Defining categories of OA consumers
Typically, any OA consumer seeking short-term OA may follow the route shown in the figure below.
0
5
10
15
20
25
2.00 2.25 2.50 2.75 3.00 3.25 3.50 3.75 4.00 4.25 4.50 4.75 5.00 5.25 5.50 5.75 More
Fre
qu
en
cy
Clearing price in INR/kWh

117
Figure 46: Typical process for grant of short-term OA
Source: Based on the information available on Punjab SLDC website
C.6.1 Operational restrictions
Discoms provide consent to the SLDC if a network is available to absorb power from outside the utility. However,
traders and consumers said stringent restrictions were being imposed by discoms, which cited operational issues
even if the network was appropriate. This was acting as an artificial barrier. There have been cases where the refusal
to grant OA was contested by OA consumers. This is discussed in the latter part of this section.
OA applications being rejected
There is a view that OA applications can be rejected on account of technical constraints such as inadequate
transmission and/or wheeling capacity of the network. But there are also cases where the following reasons are cited:
Disputed arrears of the consumer
SEM installation report not being in the latest format even though it is issued by the discoms’ own department
Further, generators/IPPs are of the view that states (particularly Andhra Pradesh/ Telangana) have stopped giving
any new NOC for OA power sale in the past one to two years. Though the provision exists on paper, utilities ensure
no approval is given to any new consumer even as existing consumers are able to renew their NOCs. This makes
scouting for potential customers challenging. Similarly, Bihar, Uttar Pradesh, West Bengal, Maharashtra, Gujarat,
and Rajasthan have also shown resistance while allowing OA. Karnataka, Telangana and Tamil Nadu are
comparatively easier states for OA.
Operational restrictions imposed by utilities constrain OA volume
The OA regulations of several states impose conditions such as eight hours’ continuous drawl, advance schedule for
the next day by 10 am of the previous day, and contract demand reduction for the entire NOC period. Consumers

118
find it difficult to adhere to these, making OA difficult to implement. While it is important to follow grid discipline, it is
also important utilities make efforts for efficiency improvement, thereby leading to high cost to serve. Some of the
restrictions cited by consumers are discussed below.
i. Reduction in contract demand: The regulation allows consumers to have the choice of maintaining contract
demand by paying demand charges. It allows customers to draw power from discoms in case the OA source trips/
reduces generation to meet technical exigencies. Utilities still insist on reducing the customer's contract demand
equivalent to the OA quantum. OA consumers have to agree through a separate letter to obtain consent from the
utility.
ii. Operational inflexibility: OA consumers have no control over outages at the power generating source or over
system reliability. Issues can crop up on a real-time basis, which can also reduce the volume of power being
transacted. As such, there are no uniform regulatory mechanisms to address these issues. Utilities impose the
following restrictions which could not be controlled/managed if those are not originated from OA consumers:
Power off-take during off-peak hours should not be more than that during peak hours.
There should not be any deviation of more than 25%, in terms of supply quantum, between blocks of eight
hours in a day.
Power off-take during off-peak hours should not be more than that during peak hours.
Power is to be procured on a round-the-clock basis from the day-ahead market.
Any deviation in schedule for a single time block, from the above restriction, leads to contract demand violation and
heavy penalty. These penalties include payment of double / higher demand charges for the entire month and payment
of a higher percentage of the total monthly bill, which is in the range of 150% to 200% of the monthly bill.
iii. Imposing impractical scheduling: Citing provisions under OA regulations, consumers are being forced to provide
a power schedule on a day-ahead basis, before 10 am of the preceding day to the discom. Contrary to this, the bid
results of the exchange are available at 5 pm of the preceding day. Therefore, it becomes difficult for the OA
consumer to schedule power through OA.
iv. Delay in executing maintenance requests: Slow response to consumer requests to address utility network
breakdown also derails the willingness of OA consumers to opt outside the utility.
Necessary infrastructure has already been set up by the distribution utility to cater to the contracted demand of OA
consumers. However, OA consumers have to seek an NOC from the SLDC on a monthly basis, which is viewed as
a major challenge. If consumers seek OA up to their contract demand, there should be an automatic provision (if
possible without involving the utility) to allow the validity of such an NOC up to a minimum period of one year. This is
provided voltage-level connectivity of the consumers remains the same during the period.
Congestion, cited as an important constraint, on grounds not convincing to consumers
Constraints in the inter-state transmission system are a thing of past. No/negligible congestion is observed at the
inter-state level. At the intra-state level, states such as Uttar Pradesh have import constraints, which will be improved
in the near future since the intra-state network is being strengthened.
For instance, in fiscal 201837, the exchange operated in a virtually zero-congestion market with inter-state
transmission congestion having reduced significantly. The southern corridors were congested for only ~8.1% of the
time vis-à-vis 44.6% in the previous fiscal, and the northern corridors were congested for ~1.7% compared with
32.6%. One Nation, One Grid, One Price was realised on 264 days, i.e., 72% of the days in fiscal 2018. Therefore,
37 Source: Indian Energy Exchange

119
it can be concluded there is enough transmission capacity for short-term OA transactions, and entities can rely on
OA sources for the long term.
Status of applications submitted to the RLDC
Applications to the Northern Regional Load Dispatch Centre (NRLDC) are rejected due to various reasons. Data
on rejected applications from January 2015 to March 2018 has been analysed based on various parameters.
Figure 47: Rejected applications based on the route and type
Most applications rejected are for the western region-northern region (WR-NR) route, followed by the eastern
region-northern region (ER-NR) route and the north-eastern region-eastern region-northern region (NER-ER-NR)
routes. In terms of the type of the application, the maximum number of rejections are under the same day category,
followed by the advance reservation category. The maximum number of rejections are in the category of no margin.
These cases cover categories such as no import margin and no STOA margin. This is followed by rejections due
to congestion.
WR-NR39%
ER-NR29%
NER-ER-NR23%
WR-ER-NR4%
WR-NR ER-NR NER-ER-NR WR-ER-NR ER-WR-NR
INTRA-REGIONAL SR-ER-NR SR-WR-NR NER-ER-WR-NR
SD, 45%
AD, 28%
FS, 14%
DA, 13%
SD AD FS DA

120
Figure 48: Analysis on cause for application rejection
Frequent revisions/ uncertainty in OA charges and the absence of predictable multi-year tariff trajectory
constraints in long-term OA
IPPs highlighted the size of the short-term market is quite small (approximately 10% of the total market), and there
is a regulatory bias towards long-term PPAs. As such, it is difficult for a generator to survive on the basis of OA alone
and be able to service its debt. In case of transmission constraints, the OA power supplied under a short-term contract
is the first one to be curtailed. Further, frequent changes in OA costs and rules prevent consumers from entering into
a long-term contract with the generator. If the tariffs of industrial consumers under the multi-year tariff (MYT) regime
are predictable, with a clear roadmap of tariff trajectory, then long-term supply to industries is possible. This would
ensure a win-win situation for consumers and generators under medium- and long-term OA.
Transmission constraints, if any in future, would only add to the problem being faced in the supply of power under
OA. Moreover, components such as additional surcharge, which have been added recently, defeat the very purpose
of OA and promote inefficiencies within utilities. There are cases where utilities are actually facing a power deficit,
but are still asking for additional surcharge.
While it is to be noted the available benefit is marginal, sometimes OA consumers do not want to take the risk of
annoying the utility. Above all, non-tariff barriers such as keeping the schedule fixed for a certain number of hours,
mandatory round-the-clock scheduling, high standby charges, etc., change the overall economics from savings to
excess costs for consumers.
As such, no customer or generator is willing to take the long-term risk of OA sale when discoms / SERCs change the
rules of the game periodically. As a result, the OA route is not preferred on a long-term basis within the present
regulatory framework.
C.7 Consultations with open-access consumers in different states
CRIS also interacted with various open-access consumers as part of stakeholder consultations. The issues as
highlighted by them are summarised in the table below.
S.No State Financial barrier Operational barrier Other issues/suggestions
1 Odisha CSS & AS are very high, making transactions unviable since the past two years.
Odisha is not allowing the sale of power through a bilateral arrangement.
The MYT tariff framework should be followed to have clear visibility for consumers going for OA
No Margin, 71%
Congestion, 17%
No Margin Congestion Other Withdrawn Application Curtailed Payment Default Violation

121
S.No State Financial barrier Operational barrier Other issues/suggestions
- Transactions with IPPs in the state are also not allowed. (Intra-state OA not allowed)
OA consumers need more products owing to scheduling issues and their peculiar demand patterns.
2 Haryana CSS & AS are very high, making transactions unviable since the past two years.
- As per the Electricity Act, 2003, the CSS should have been reduced. However, it has increased.
- - Stopped buying power since the past year.
- - Penalties are very high if buying more than the contract demand.
3 Uttarakhand CSS & AS are very high, making the transactions unviable since the past two years.
The SLDC is not granting NOCs on time
Medium-term OA is very attractive, but the discom should provide a tariff trajectory for at least three years.
Prices of coal have also impacted the margin, thus affecting OA transactions (Coal prices have increased for merchant plants)
States have started importing more power from exchanges due to which prices have increased.
4 Rajasthan Apart from base components of open-access charges, including CSS, AS and wheeling charges etc., states also charge various types of cess such as urban cess and water-conservation cess. This increases the payable amount for availing OA.
The OA consumer is penalised for faults which are in purview of the discom or at the CTU level and not directly linked or caused by the OA consumer.
There is no independent cell to address the grievances of OA consumers.
Shutdown of network taken by discom, but penalty paid by OA consumers
DBT, as launched in LPG, may also be introduced. This will reduce the burden on consumers in the form of cross-subsidy.
Scheduling is an issue since OA consumers are asked to provide a schedule by 10 am while the exchange gives the clearing price by 4 pm.
Case filed in Supreme Court: Ramayana Ispat Vs RERC (Grievances and charges related)
5 Delhi CSS & AS are very high, making the transactions unviable since the past one year.
- Availing OA since past 10 years but it has now become unviable
6 Andhra Pradesh
CSS & AS are very high, making the transactions unviable since the past one year.
Timely NOCs not granted Tariff uncertainty on the utility side constrains OA consumers from availing or opting for 5-10 year agreement with suppliers/IPPs.
OA not granted to new and small industries at present.
If IPPs can take a hit or adjust their tariff every year in case of medium or long-term tariff, entering into contracts can become possible.

122
S.No State Financial barrier Operational barrier Other issues/suggestions
Karnataka CSS & AS are very high, making the transactions unviable since the past one year. The utility has also increased the fixed charges, making the entire transaction commercially unviable.
The SLDC is highly influential as regards the utility as it is governed by the same holding company. Thus there are issues/delays in granting NOCs.
Energy-sufficient discoms are not allowing OA.
- - Banking rules changed from one year to six months in the case of RE power procured through OA.
Some of the evidential cases of non-grant of OA are also highlighted below.

123
Table 15: Evidential cases depicting rejection of OA application
S No Details Contention Decision
Gujarat
1. Petitioner: HPCL Mittal Pipelines Respondents:
GETCO, SLDC (GETCO), PGVCL
Competition Commission of India. Case no. 39 of 2017
The OA application of HPCL Mittal Pipelines was rejected on various counts based on system constraint; however, such a system constraint was not proven
The Competition Commission of India took such a strong position and transferred the case for further enquiry.
2. Petitioner: Duracon Vitrified Pvt Ltd
Respondents: GETCO, Gujarat SLDC, and PGVCL.
Petition no. 1593 of 2016
The petitioner had sought various reliefs which included:
a) Direct respondent no. 2 and 3 to convey a copy of the refusal of consent for STOA for May 2016 to the petitioner.
b) Hold and declare that the respondents have no authority to deny consent/standing clearance to the petitioner on the ground that the petitioner has under-drawn more than 12% of the scheduled energy in previous months.
c) Hold and declare that the respondents have no authority to deny consent/standing clearance to the petitioner on the ground that the petitioner has drawn less than 1 MW of the actual energy in previous months.
d) Direct respondent No. 2 and 3 to grant NOC/consent for the STOA with immediate effect, pending the final disposal of this petition.
The commission directed that in case consent is not granted by the discom within three days, it would be deemed to be granted as per the regulation. It also held denial of OA was in violation of law.
3. Petitioner: Steelcast Ltd
Respondents: SLDC, Gujarat, Paschim Gujarat Vij
Company Ltd, Gujarat Energy Transmission Corporation Ltd. Petition No. 1590 of 2016.
Petition under Section 94 of the Electricity Act, 2003, read with Section 26.1 of GERC Regulation 2 of 2004, read with GERC Regulation 3 of 2011 for Intra-State OA, against notice issued by SLDC for cancellation of consent granted for STOA under the provisions of GERC (Terms and Conditions of Intra-State Open Access) Regulations, 2011, and subsequent abrupt granting/denial of NOC for STOA
The petitioner sought the following relief from the commission:
a. Direct the respondents, particularly Respondent No. 1, the SLDC, to withdraw the impugned communication dated 2.3.2016 and subsequent communications and to grant an NOC for a STOA to the petitioner as per the regulations framed by the commission forthwith in the interest of justice.
b. Direct Respondent No. 2, distribution licensee Paschim Gujarat Vij Company Ltd, to issue an NOC
The commission held the discom shall issue an NOC for the reasons specified in the regulations. It directed the discom not to withhold the same under the guise of reasons, which are bad in law and abrupt. It also directed the discom to follow the guidelines and related orders of the commission in various petitions.
4. Petitioner: Chiripal Poly Films Ltd
Respondents: Gujarat Energy Transmission
Corporation Ltd, Gujarat SLDC, Uttar Gujarat Vij Company.
The petitioner applied for an NOC/clearance from the discom and SLDC. However, the SLDC wrongfully rejected the NOC on the ground that the discom has not consented to the application for OA by the petitioner.
The petitioner sought various reliefs, out of which a few have been noted:
The commission held not granting of an NOC by the SLDC was bad in law, and penal proceedings may also be undertaken against them. However, the petitioner did not proceed

124
S No Details Contention Decision
Petition no. 1592 of 2016, Petition under (I) Section 42 (2) of the Electricity Act and Regulation 3(p) and Regulation 45 of GERC (Terms and Conditions of Intra-State Open Access) Regulations, 2011, has been filed by the petitioner
a. Hold and declare the respondents have no authority to deny consent/standing clearance to the petitioner on the ground the petitioner has underdrawn more/less than 12% of the scheduled energy in previous months.
b. Quash and set aside the impugned rejection letters dated 5.4.2016 and 26.4.2016 issued by Respondent No. 2 to the petitioner denying STOA standing clearance for April and May 2016.
c. Direct respondent No. 2 and 3 to grant NOC/consent for the STOA with immediate effect, pending the final disposal of this petition.
for penal action against the SLDC and the consent for OA was granted.
West Bengal
5. Petitioner: OCL India Ltd
Respondents: Office of chief engineer, SLDC West
Bengal, West Bengal State Electricity Discom, Eastern Regional Load Dispatch Centre, Power System Operation Corporation Ltd.
Petition n. 228/MP/2016. Petition filed under Section 79 (1) (c) read with Regulations 8 and 26 of the Central Electricity Regulatory Commission (Open Access in Inter-State Transmission) Regulations, 2008
The petitioner, OCL India Ltd, has filed the present petition against the denial of an STOA by the SLDC, West Bengal on the ground of constraint in the inter-state network.
The commission held such a denial to be in violation of law as there was no constraint and directed the respondents to allow OA.
6. Petitioner: Millennium Cement Co
Respondents: Office of chief engineer, SLDC West
Bengal, West Bengal State Electricity Discom, Eastern Regional Load Dispatch Centre, IEX.
Petition no. 73/MP/2016 Petition under Section 79 (1) (c) read with Regulations 8 and 26 of the Central Electricity Regulatory Commission (Open Access in Inter-State Transmission) Regulations, 2008.
The petitioner, Millennium Cement Co Pvt Ltd, has filed the present petition challenging the denial of an STOA the by SLDC, West Bengal on the ground of constraint in the inter-state network for the period from 1.12.2015 to 29.2.2016
The commission held such a denial was in violation of law and directed the SLDC to consider an application for OA as per the regulation and not to take any arbitrary decision with regard to such an application.
Rajasthan
7. Petitioner: UltraTech Cement Ltd, RSWM Ltd, JK
Lakshmi Cement Ltd, Sirohi, BLS Ecotech Ltd, Bhiwadi
Respondents: Rajasthan SLDC
Petition no. RERC-923- 924/16, 928/16 & 929/16
Petitioners are industrial consumers of discoms and also draw part of the power from the power exchange. For purchase of a certain quantum of power, the petitioners, as per the OA schedule, had paid the power exchange. Accordingly, electricity was injected in favour of the petitioners. However, the discoms, on the ground of alleged errors in some of the schedules, did not adjust the electricity injected specifically for the petitioners. The discoms have considered the whole quantum of electricity consumed by the petitioners had been claimed to be supplied by them
-

125
Annexure D - Content and carriage, USO and DBT
D.1 Separation of content and carriage
Power retail is the business of buying power from generators and reselling it to final customers. Distribution, on the
other hand, is the business of carrying electricity using the physical distribution network to the consumer.
The Electricity Amendment Bill, 2014, proposes significant restructuring of the distribution and supply framework.
The amendment envisages separation of power distribution from supply. It aims to provide the consumers with more
options to choose a supplier, as multiple supply licensees can share space within a particular distribution area.
In case of separation, the distribution wires would effectively still be a regulated business, while the retail business
would be open to competition.
However, separation of content and carriage has not been implemented in the Indian electricity sector.
D.1.1 Need for separation of content and carriage
The separation of carriage and content will provide:
Transparency and accountability of AT&C losses suffered by the distribution sector. If the content and carriage
are separated and given to two separate entities, theft of electricity cannot be hidden under the head of overall
distribution losses.
Upon separation, carriage or wire would be typically subjected to non-discriminatory OA for allowing competition
in the content segment. This cuts down monopolistic practices and increases competition, thereby giving users
greater opportunity to improve efficiency.
Competition would enrich retailers, generators and distributors to develop technologies to increase efficiency, to
lower costs and increase reliability of supply. Specialisation resulting from competition would further lower costs
and raise consumer welfare.
D.1.2 Key steps
The separation of content and carriage would require the following key steps:
Figure 49: Steps for separation of content and carriage
Opening the market for competition in the retail supply business
Improve conduciveness of the market Competitive market
Segregation of ownership of distribution and retail supply business
Creation of new functional entities Defining roles and responsibilities of
new entitiesTreatment of existing losses, PPAs,
upgrading existing metering
Development of robust whole sale market
Development of market institutions
Reduction in dominant market power in generation
Trading platformsDevelopment of ancillary
market for reliable operations

126
D.1.2.1 Development of robust wholesale market
As a prerequisite to separation of carriage and content, it is critical to develop a conducive wholesale market which
would provide a level-playing field for competition in the retail supply business. The key measures for a wholesale
market would include:
Market institutions: Establishment of institutions where wholesale trading of power/ contracts for sale of power
can be made in an effective and efficient way.
Reducing dominant generators: This would ensure that a few generators cannot manipulate the market/
reducing the risk of gaming.
Platform for trading: Creation of an electronic platform for –
‒ Generators and retail supply parties to make power purchases
‒ Retail supply parties and consumers to make power trades
Development of ancillary market: To ensure reliable operations of the grid, power quality and grid security.
D.1.2.2 Segregation of ownership of distribution and retail supply business
The next step would be to segregate the distribution business from the supply business. This would bring in neutrality
in the distribution network since the consumer can make choices without any constraints due to prevailing cross-
subsidies. The key measures would be:
Distribution business: The distribution business would still be operated by existing discoms and would continue
to have the following features –
‒ Loss assessment: The discoms would be required to assess the actual level of AT&C losses, clearly
segregating the technical and commercial losses. The technical losses would be allocated to the discoms
while the commercial losses would be allocated to the retail supply entities.
‒ System strengthening: Expansion and system strengthening would lie with the discom, thereby giving it
accountability for operation and maintenance of the network, continuous network availability, reduction in
technical losses, etc.
‒ Regulated business: The distribution/ wire business would continue to be regulated with assured returns.
Retail supply business: The retail supply business could be created in the following manner:
‒ Creation of new functional entities: New competitive entities which can trade in the wholesale market
would be registered on the platform for trading of power to service the consumers.
‒ Roles and responsibilities: The retail supply business would be responsible for demand forecasts, efficient
power procurement, revenue collection, fulfilling regulatory obligations, etc.
‒ Commercial loss reduction: The retail supply entities would be responsible for reduction in collection
efficiency and reduce commercial losses.
A few critical aspects at this stage would be:
Allocation of existing PPAs: This can be approached in the following ways –
‒ Creation of a new entity which would hold the existing PPAs and further trade it on the platform.
‒ Initially allow trading only for incremental consumers, thereby letting the existing PPAs run their complete
terms post which the markets would gradually be open for competition.
Regulatory and existing losses: These losses could be taken up in the following ways:
‒ Require government intervention
‒ Gradually passed on to the consumer (through the tariffs set for the distribution business)

127
D.1.2.3 Opening the market for competition in retail supply business
The final step would be to open the market for retail supply competition. This would require the following measure:
Allocation of technical and commercial losses: At this stage, technical and commercial losses would be
allocated to the respective entities for distribution and supply business.
Cross-subsidy reduction: In the initial phase, if present levels of cross-subsidy exist, industrial and commercial
consumers would be the first to shift to competition. This would further increase the losses of discoms. The
following approach could resolve the issue:
‒ USO: During the initial phase of open competition, the retail supply business can be restrained from adding
only high-tariff consumers.
‒ DBT: Introduction of direct benefit transfer, with payments to the targeted consumers through State Budget,
can allow better energy accounting. This would improve the segmentation of needy consumers on the basis
of units rather than on the basis of category. Also, the subsidised consumers would utilise electricity efficiently
otherwise they would move out of the subsidised slabs.
‒ Gradual reduction in cross-subsidy charges: Through tariff hikes, a gradual reduction in CSS would allow
for the complete opening of the market for competition.
Consumer database: It would be important to develop a consumer data base which would allow for competition.
Competitive market: A complete competitive market would require
‒ Licensing area: For supply of power
‒ Consumers switching mechanism: Well-defined mechanism for consumers to switch their retail supplier
‒ Redressal mechanism: Framework for consumer grievances etc.
‒ Procurement of PPAs: PPA mechanism for power procurement through generators
D.1.3 Integration with USO and DBT
USO: The USO refers to the practice of providing a baseline level of services to every consumer. It can be split into
two separate obligations
The duty to connect – Owned by the distribution business
The duty to supply – Owned by the retail supply entity
The duty to connect a consumer would lie with the distribution business. The duty to supply would lie with retail supply
provider wherein, if a consumer approaches a retail supplier and demands supply of electricity and service at the
same cost as other consumers of the same category, the retail supplier would have an obligation to fulfil that demand.
Illustration: USO in the telecom industry
Though the nomenclature is different, the importance of the goal of universal service has been noted by most
countries and similar methods are being implemented to work towards this end. Each country gives certain service
providers the status of Universal Service Provider or Eligible Telecommunications Carrier. This allows the provider
in question to get subsidies from the universal service fund to economically provide the necessary service.
The basic concept of universal service is the below-cost pricing of service to increase the quantity of service as
shown in Fig.1
The figure shows a demand curve where the region in red shows the extent of the original service. The increase
shown by the green area represents the increase in the service area once the subsidy helps reduce the prices.

128
The conclusion is simple, as the prices reduce from P1 to P2, the quantity of customer increases from Q1 to Q2,
thus allowing universal service.
Figure A Figure B
The size of the subsidy paid out to the telecommunication service provider in this case is shown in Fig.2.
Since each call in fact costs price P1 and price P2 in the cash flow from the customer, the rest (P1-P2) comes
from the universal service fund.
This is a simplistic case and most countries have very complex legislation to guarantee the service and have
several subsidy mechanisms to implement universal service. The case shows the idea behind universal service
not the universal service mechanism actually used in any country.
The key steps to integrate USO with separation of content and carriage are –
Direct Benefit Transfer – In the DBT system, payments would be transferred to beneficiaries directly in their bank
accounts through State Budget. If the direct benefit transfer scheme is implemented, only the actual consumption will
be subsidised and not power pilferage or losses.
It is critical to integrate separation of carriage and content with USO and DBT to enable competition and enhance
the efficiency of the power distribution system.

129
Figure 50: Stakeholders Involved in DBT Framework
Example of a successful DBT implementation
The Bolsa Família Program, implemented in Brazil, which has technical and financial support from the World Bank,
is cited as one of the key factors behind the positive social outcomes achieved by Brazil in recent years. The
Program is an innovative social initiative taken by the Brazilian government. It reaches 11 million families, more
than 46 million people, and a major portion of the country’s low-income population. The model emerged in Brazil
more than a decade ago and has been refined since then.
Poor families with children receive an average of R$70.00 (about US$35) in direct transfers. In return, they commit
to keeping their children in school and taking them for regular health checks. So, Bolsa Família has two important
Ultimate Objective
Cash subsidies to be transferred directly to
beneficiaries' respective accounts and in-kind
benefits to be delivered directly to
beneficiaries after they have been duly
authenticated.

130
results: helping to reduce current poverty, and getting families to invest in their children, thus breaking the cycle of
intergenerational transmission and reducing future poverty.
There are some aspects of the programme, which have attracted particular interest. The first is conditionality. The
payments are dependent on the family's children staying in school until 17, and attendance must be at least 85%
up to 14 years and 75% for the remainder. Another form of conditionality is the children get the full set of
vaccinations in their first five years and that mothers attend pre and post-natal care. One of the advantages of the
conditionality is investment in welfare gives a real bang for the buck. For just 1% of GDP, Brazil is simultaneously
boosting education levels, improving dire health indices, and reducing poverty. What has been controversial is the
transparency. All the names of recipients are publicly available on a website. Individual claims can and have been
checked. Anyone can report abuse. But it's working. Independent evaluations found 80% of the money is reaching
the poor; pretty good in a country in which welfare has been dogged by corruption. One clever aspect of the
programme was to put all payments through the banking system. Recipients use a debit card to draw out the
money from their bank accounts at ATMs. The registering of claims is a more complex process and, since the
scheme started in 2003, a network of social services centres has increased from 1,000 to 9,000.
Project cycle of the Bolsa Familia Program
a) Identification of beneficiaries (eligibility and targeting)
b) Enrollment of beneficiaries
c) Payments
i. Types and amounts of Bolsa Família benefits
ii. Payment of benefits
d) Verification of conditions
i. Process for monitoring conditions for health
ii. Process of monitoring conditions for education
e) Relations with other social programs and services
i. Integration with other cash transfer programmes in the country
ii. Integration with cash transfer programmes in the states
iii. Integration with social assistance services
iv. Integration with productive inclusion programmes
f) Updating of beneficiaries’ registration (recertification)
g) Criteria and rules for separation
i. Temporary permanent status in cases of an increase in incomes
ii. Voluntary withdrawal and guaranteed return
h) Client services for beneficiaries

131

132
Annexure E - Financial health of discoms
E.1 Major challenges in distribution sector
Distribution sector, the revenue-generating link in the power sector, has remained the weakest link in the power value
chain. Consolidated outstanding debt of discoms was pegged at Rs 4.3 lakh crore, as of March 2015. The situation
can be attributed to two major reasons: (i) financial performance, and (ii) operational performance (aggregate
technical and commercial (AT&C) losses).
The Electricity Act, 2003, was brought in to reform the power sector and make it productive. In many states, electricity
boards were restructured and the sector unbundled into different entities, responsible for generating, transmitting and
distributing power. Further, independent regulators were established to work at arm’s length relationship to ensure
quality of service and real pricing. Government provided for subsidies to be paid to low-priced consumers and for
states to reimburse the discoms. However, in many instances, the states did not pay up, with the result that the
discoms had to carry the loss in their books. Further, tariffs were supposed to be revised by regulators at periodic
intervals, based on petitions submitted by respective distribution companies. In many cases, the tariff revisions did
not happen for long periods or happened in an irregular fashion, owing to lapses by both regulators and discoms in
filing petitions. While average cost of electricity supply (ACS) has increased due to rising fuel costs and inflation,
growth in aggregate revenue realised (ARR) by discoms has been much lower because of irregular/inadequate tariff
hikes. As a result, the gap between ACS and ARR has widened and subsequent cash constraints have led to
declining capital expenditure, negligible technology interventions, and issues relating to capacity-building and training
of manpower, culminating in high financial and transmission and distribution (T&D) losses.
Energy losses occur in the process of supplying electricity to consumers, due to technical and commercial reasons.
Technical losses result from dissipation of energy in conductors, transformers and other equipment used for
transmission, transformation, sub-transmission, and distribution of power. These technical losses are inherent in a
system and can be reduced to a certain level. Pilferage by hooking, bypassing meters, using defective meters, and
errors in meter reading and in estimating un-metered supply of energy are the main sources of commercial losses.
Commercial losses are also attributable to non-recovery of billed amounts. Commercial and technical losses are
together termed as aggregate technical and commercial losses (AT&C).
During fiscal 2015, India’s AT&C losses were 24.62% as against world average of 10-12%38. As many as 18 states
still suffer losses beyond the 15% target threshold; seven of them have registered over 30% losses. Many states
such as Andhra Pradesh, Delhi, Gujarat, Kerala, Uttarakhand and Maharashtra have reduced their losses
significantly in recent years. States like Rajasthan, Madhya Pradesh and Maharashtra have depicted remarkable
improvement but still fall short of revenue targets of utilities owing to large area of operations and high number of
consumers handled. High level of AT&C losses, indicating operational inefficiencies, has financially stressed state-
owned discoms over the years. As in March 2015, consolidated outstanding debt of discoms was pegged at Rs 4.3
lakh crore.
38 Power Finance Corporation (PFC) report on performance report of state power utilities 2015

133
Figure 51: AT&C losses across states during fiscals 2013 to 2015 (%)
Source: PFC performance report on state power utilities 2015
Government realised that 100% village electrification, 24x7 power supply and clean energy cannot be achieved
without operational and financial turnaround of discoms, which have been under tremendous financial stress over
the last decade. Further, power outages also adversely affect national priorities like ‘Make in India’ and ‘Digital India’
programmes. To address these issues, government approved a new scheme, UDAY that aims at transforming the
financial health of discoms through initiatives such as reduction in interest cost and cost of power, and improvement
in operational efficiencies.
As of March 2017, over 26 states and 1 union territory have signed memorandums of understanding (MoU) under
UDAY scheme. With states issuing UDAY bonds worth ~Rs 1.739 trillion till October 2016, discoms’ financial health
is expected to have improved owing to reduced interest burden after transfer of debt to respective state governments.
UDAY envisages discoms to reduce their AT&C losses to less than 15% by fiscal 2019. UDAY also provides for
assumption of discoms’ future losses by the states in a graded manner. However, if future losses of discoms are to
be taken over by states, the former would have to adhere to loss reduction trajectories agreed upon, under tripartite
MoUs.
This is expected to ease financial stress on discoms and improve their power offtake ability, at least in initial two
years. With implementation of the scheme and significantly slower rise in power purchase cost, the ACS-ARR gap
continues to be over Rs 0.3040 paise per unit.
E.1.1 Cost of power purchase
Power purchase cost constitutes 75-85% of total cost of supply for distribution utilities in India. Average power
purchase cost reflects a wide variation across different states in the country, ranging from Rs 1.9 per unit (in Kerala)
at lowest to the highest at Rs 4.0 per unit (in Maharashtra)41.
39 CRIS Research
40 As per UDAY dashboard – January’2019
41 CRIS Analysis
0
5
10
15
20
25
30
35
40
45
50
An
dh
ra P
rad
esh
De
lhi
Him
acha
l P
rad
esh
Gu
jara
t
Pu
nja
b
Ka
rna
taka
Utt
ara
kha
nd
Ma
ha
rashtr
a
Ta
mil
Na
du
Assa
m
Ch
hatt
isg
arh
Ra
jasth
an
Ma
dh
ya
Pra
de
sh
Ha
rya
na
Utt
ar
Pra
desh
We
st
Ben
ga
l
Od
ish
a
Bih
ar
%
2012-13 2013-14 2014-15

134
Figure 52: Average power purchase cost (Rs/kWh) for fiscal 2017 (estimated)
Source: Tariff orders of state distribution utilities, CRIS analysis
Note: Transmission (interstate and intrastate) and state load dispatch centre (SLDC) charges would be further levied on indicated
power purchase costs
Low power purchase costs in states such as Kerala, Punjab, Odisha and Himachal Pradesh can be attributed to
presence of substantial hydro-based capacity that is a cheaper source of electricity than thermal. Chhattisgarh,
Madhya Pradesh, and Karnataka exhibit lower costs as they save on coal transportation costs. Most discoms procure
a major part of their energy from thermal power stations that operate as base-load generators. Thermal power plants
contributed ~80% of the total country’s generation during fiscal 201742, with coal contributing the most.
During the last decade, on account of economic growth and growing power demand, India’s demand for thermal coal
has grown at an alarmingly high rate, over 12% CAGR, during 2010 to 2015. Starting at modest 25 million tons (MT)
in 2000, thermal coal imports expanded to 50 MT in 2009, 100 MT in 2012, and further to 155 MT in 2015. In 2015,
government directed Coal India Ltd, which accounts for over 80% of domestic coal production, to step up its efforts
towards increasing domestic production and enhancing efficiency. These efforts have resulted in record high
production and lower dependence on coal imports, over last two years. The downtrend may further continue, if Coal
India Ltd succeeds in achieving its envisaged production of 908 million tonnes of coal by fiscal 2020 from 539 MT in
201643.
Figure 53: Import volumes of thermal coal in fiscals 2013 to 2017 (in MTPA)
Source: Ministry of Coal, Government of India
42 Central Electricity Authority (CEA) monthly generation report, March’2017
43 Ministry of Coal, Government of India
1.92.4
3.1 3.2 3.3 3.4 3.5 3.6 3.6 3.6 3.7 3.7 3.8 3.9 4.0 4.0
0.0
1.0
2.0
3.0
4.0
5.0
Ke
rala
Od
ish
a
Ch
hatt
isg
arh
Pu
nja
b
Ka
rna
taka
Ma
dh
ya
Pra
de
sh
Ta
mil
Na
du
Gu
jara
t
Ha
rya
na
Ra
jasth
an
An
dh
ra P
rad
esh
Bih
ar
Utt
ar
Pra
desh
We
st
Ben
ga
l
Te
lan
ga
na
Ma
ha
rashtr
a
Rs
./ k
Wh
82 102 11688
61
1820
3034
302
27
643
13
57
FY 2013 FY 2014 FY 2015 FY 2016 FY 2017 (Estimated)
Indonesia South Africa Australia Others

135
Coal prices have plunged from their all-time high in fiscal 2012, because of lower demand from major takers such as
China, the US and Europe; gradual shift to cleaner fuels; and rising energy efficiency. Indonesia remains the preferred
source of Indian coal imports, accounting for over half of total coal import, as geographical proximity results in lower
transportation and overall costs. However, prices rose significantly between April and October 2016, and are
expected to remain volatile as China’s influence on global commodity prices continues to fluctuate. Further, with
unsubsidised, utility-scale solar electricity now available at less than Rs 3 per unit44, economics of imported coal is
structurally challenged.
E.1.2 Financial position
Tariffs determined for discoms still do not reflect cost of supply due to high AT&C losses and regulatory assets
created because of partial approval of the actual cost. The financial health of discoms can also be correlated with
consumer mix in the tariff structure. Higher the industrial consumers, better is the realisation.
Figure 54: Category-wise average tariff charged vis-à-vis average tariff from all consumers (Rs/kWh)
Source: PFC report on performance of discoms
Greater the number of subsidised consumers, more intense is the cash crunch due to delay in realisation from
consumers/government providing the subsidies. Besides, contribution of such consumers in total revenue is marginal,
compared with effective voltage-wise cost of supply. While commercial and industrial consumers are subsidising
domestic and agricultural consumers, subsidising consumers contribute towards liquidity in discoms to pay their
power purchase cost and fund their other liabilities.
As is depicted in the table below, consumer mix in any state drives the cash situation. Most states including
Karnataka, Madhya Pradesh, Haryana, Punjab, Telangana, and Tamil Nadu have higher/equivalent proportion of
agricultural sales than industrial sales. On the other hand, contribution of agricultural sales in total revenue is nominal,
in comparison with revenue from industrial consumers.
44 Solar tariff bid reached a historic low of Rs 2.97 a unit for Unit I of 750 megawatt Rewa solar park during February 2017
1.46 1.76 1.87 1.71
7.32 7.74
8.19 8.55
4.39
4.72 5.56
4.96
-
1.00
2.00
3.00
4.00
5.00
6.00
7.00
8.00
9.00
-
1.00
2.00
3.00
4.00
5.00
6.00
7.00
8.00
9.00
2012-13 2013-14 2014-15 2015-16
Industry Domestic Agriculture Commercial Railways Total

136
Figure 55: Revenue as percentage of sales to agriculture and industrial consumers
Source: Tariff orders, CRIS analysis
E.1.3 Poor cash flows
Above all, there are delays in receiving payments/subsidies against subsidised sales. This has a cascading effect on
debtor days; states with high proportion of subsidising sales have less debtor days. For instance, Gujarat has debtor
days in the range of 20-22 days with high proportion of industrial consumers, while agricultural sales in Maharashtra
are equivalent to industrial sales and accordingly, its debtor days are high.
Figure 56: Debtor days of states
Source: PFC Report on performance of discoms
Most agriculture-dependent states such as Bihar, Madhya Pradesh, Maharashtra, and Uttar Pradesh have high
debtor and creditor days, because of delay in receiving revenue and creation of high short-term liability on books.
States such as Bihar, Madhya Pradesh and Uttar Pradesh have higher debtor days than creditor days (as mentioned
in the figure below), which shows that they are funding a part of their power purchase cost from short-term borrowings.
37%
38%
0%
10%
20%
30%
40%
50%
60%
70%
0%
10%
20%
30%
40%
50%
60%
Agri (% of Sales) Industry (% of Sales) Agri (% of Revenue) Industry (% of revenue)
120 164
74 30 32
80
177 170
117
42 35 39
409
60
124 127 87
26 18
73
165 149 167
56 39 39
365
86
- 50
100 150 200 250 300 350 400 450
Debtors Days 2013 Debtors Days 2014 Debtors Days 2015 Debtors Days 2016

137
Figure 57: Creditor days of states
Karnataka, Maharashtra, Madhya Pradesh and Telangana have almost equal or higher quantum of agriculture
consumption. However, revenue from agriculture consumers is not even 10% of their total revenue. Further, timely
realisation of subsidies from states can be a problem, which may lead to cash crunch during the year. Consequently,
utilities are more or less dependent on industrial and commercial consumers to adequately cushion their working
capital.
Further, if we compare the ratio of creditor/ debtor days, states with higher ratio are seen to have higher working
capital for disbursal, towards buying power through the pen market. This can be seen for states such as Telangana
Andhra Pradesh, West Bengal, Punjab and Haryana.
Figure 58: Volume transacted through traders by discoms (2015-16)
Source: CERC Short term market report, PFC report on discom performance
E.1.4 Limited scope for procuring low-cost power
Ability of discoms to buy power from open market also depends on their current tied-up power. In case higher capacity
of power is tied-up, ability of discoms to procure power from short-term market at lower cost is compromised. Unless
235
99
-
201
9
124
662
58 114
44 24
149
283
118
222
104 118
441
3
79
280
86
151
54 67 118
150 121
-
100
200
300
400
500
600
700
Creditors Days 2013 Creditors Days 2014 Creditors Days 2015 Creditors Days 2016
5.31
3.24
5.03
3.44
4.33
3.6 3.65
5.26
1.57 1.41
2.69
0.96 1.08
-
1.72
0.57
0
1
2
3
4
5
6
0
500
1000
1500
2000
2500
3000
3500
Telangana West Bengal AndhraPradesh
Punjab Haryana Noida Power& UPPCL
Rajasthan Kerala
Volume (MU) Average Price (Rs/kWh) Creditor/ Debtor days

138
there is abnormal increase in demand or any issue with supply source, discoms with complete tied-up power will limit
themselves in procuring power from open market.
Figure 59: Peak demand and availability (MW)
Source: CRIS Analysis
E.1.5 Insufficient tariff level
Most of the above issues can be linked to tariff levels across states, which do not reflect actual cost. In India, power
sector is regulated and tariff is determined, based on applicable tariff regulation, levied by either the CERC or an
SERC, depending on jurisdiction and type of power utility. CERC /SERC follows a cost plus return approach where
justifiable cost based on set norms and return on equity is computed to forecast required annual revenue requirement
(ARR). This ARR is then divided into different stakeholders based on energy or capacity, depending on the type of
utility. Different cost components that are analysed as part of this exercise are illustrated below.
Figure 60: Cost components for utilities
89%81%
106%
95%103%
0%
20%
40%
60%
80%
100%
120%
0
5,000
10,000
15,000
20,000
25,000
Uttar Pradesh Punjab Karnataka Gujarat Rajasthan
Peak Demand (MW) Availability based contracted capacity (MW) Share of Long term PPA
Generation
Fuel expenses
O&M expenses
Depreciation
Other expenses
Return on equity
Transmission
O&M expenses
Depreciation
Other expenses
Return on equity
Distribution
Power purchase Cost
O&M expenses
Depreciation
Other expenses
Return on equity
State load despatch centre
O&M expenses
Depreciation
Other expenses
Return on equity

139
Cost components are examined on the basis of their reasonability and prudence by their regulator. It is ensured that
the costs are prudent (least cost) and necessary, given the situation that the utility is operating in. Costs are
determined, keeping in mind that such costs would be incurred by an efficient entity operating in similar operational,
structural, and geographical environments or a comparison with all-India averages is made to arrive at right cost
figure. For example, when comparing employee costs (as part of operations and maintenance expenses) across
distribution utilities, it is important to note that this cost would be dependent on parameters like geographical spread
of operations, customer density, and load density. Therefore, factors such as number of consumers per square km
and consumption per consumer are used in selecting comparators.
Tariff determination process for a distribution utility is illustrated below.
Figure 61: Tariff determination process for discoms
Revenue Requirement

140
E.1.5.1 Tariff level in Haryana
Average gap between average cost of supply (ACS) and average billing rate (ABR) for Dakshin Haryana Bijli Vitran
Nigam (DHBVN) and Uttar Haryana Bijli Vitran Nigam Limited (UHBVN) has improved from Rs 0.66/kWh /1.17
RskWh to Rs 0.17/0.15/kWh. Despite this, the state is still dependent on subsidy from state government, on account
of high number of agriculture consumers.
Table 16: Realisation (Rs /kWh)
Year Discom ACS ABR Gap Gap after subsidy booked
Gap after subsidy received
2012-13 DHBVNL 4.76 3.36 1.39 0.66 0.66
UHBVNL 5.52 2.50 3.02 1.17 1.17
2013-14 DHBVNL 5.13 3.78 1.34 0.79 0.79
UHBVNL 5.55 3.19 2.36 0.69 0.69
2014-15 DHBVNL 4.90 3.95 0.96 0.22 0.22
UHBVNL 5.41 3.35 2.05 0.66 0.66
2015-16 DHBVNL 5.49 4.44 1.05 0.17 0.17
UHBVNL 5.67 3.83 1.84 0.15 0.15
Source: PFC’s report on performance of distribution utilities
Tariff in DHBVN in Haryana has steadily increased from fiscal 2012 by almost 50% over five years. Excepting
agriculture consumers, average tariff in all other categories rose during this period.
Figure 62: Tariff trajectory of DHBVN
Haryana is one of the few states where concept of monthly minimum charge (MMC) is still prevalent, even though
national tariff policy stresses on two-part tariff. In the domestic category, the state has highest tariff slab of 7.1
Rs/kWh.
3.42
4.92
6.61
5.8
0
1
2
3
4
5
6
7
FY08 FY09 FY10 FY11 FY12 FY13 FY14 FY15 FY16
RS
/K
WH
Average Tariff (DHBVN) Rs/kWh
Domestic Non Domestic Agricultural Industrial HT Industrial LT Average Tariff

141
Table 17: Latest tariff
Category of consumers Energy charges (Rs)
Energy unit (kWh or kVAh)
Fixed charge (Rs. per kW per month of the connected load / per kVA of sanctioned contract demand (in case supply is on Hi or as indicated
Unit of fixed charge (per connection or per kVA or kW)
MMC (Rs. per kW per month of the connected load or part thereof)
Domestic supply
Category I: (Total consumption up to 100 units per month)
0 - 50 units per month 2.7 kWh Nil Rs 115 up to 2 kW and Rs. 70 above 2 kW 51 – 100 4.5 kWh Nil
Category II: (Total consumption more than 100 units/month and up to 800 units/month)
0-150 4.5 kWh Nil Rs. 125 up to 2 kW and Rs.75 above 2 kW 151-250 5.25 kWh Nil
251 – 500 6.3 kWh Nil
501-800 7.1 kWh Nil
Category III:
801 units and above 7.1 (flat rate, no telescopic benefits)
kWh Nil Rs 125 up to 2 kW and Rs 75 above 2 kW
Non-domestic
Up to 5 kW (LT) 6.35 kWh Nil Rs. 235/kW
Above 5 kW and up to 20 kW (LT)
7.05 kWh Nil
Above 20 kW up to 50 kW (LT) 6.6 kVAh 160 kW Nil
Existing consumers above 50 kW, up to 70 kW (LT)
6.95 kVAh 160 kW Nil
Consumers above 50 kW (HT) 6.75 kVAh 160 kW
E.1.5.2 Tariff level in Punjab
Average cost of supply for Punjab State Power Corporation Limited has increased from Rs 4.49 /kWh to Rs 5.32
/kWh. However, average revenue realisation has not improved at the same pace and stands at Rs 3.78/kWh. The
state government has been subsidising the gap, to the extent of Re 1.00/kWh. Subsidy component in total realisation
by discoms exceeds 20%, which heightens the risk of realisation.
Table 18: Realisations (Rs /kWh)
Year ACS Average revenue Gap (without subsidy)
Gap (with subsidy booked)
Gap (with subsidy received)
2012-13 4.49 3.35 1.14 -0.06 -0.02
2013-14 4.72 3.74 0.98 -0.05 -0.05
2014-15 4.91 3.72 1.19 -0.03 0.22
2015-16 5.32 3.78 1.54 0.35 0.54

142
Figure 63: Average tariff of Punjab State Power Corporation Limited) (Rs /kWh)
Similar to Haryana, in Punjab, tariff was static till fiscal 2012 and then almost doubled by fiscal 2016. However, it is
important to note that the average tariff is following the same trend and path followed by domestic tariff curve, which
shows that realisation is highly dependent on level of domestic tariff in the state.
Table 19: Latest tariff for domestic and commercial
Consumer category Slabs (Units or load-wise) Energy charge (in Rs) Fixed charge, if any (Rs)
Permanent supply
Domestic
Loads up to 2 kW Up to 100 kWh 4.81 Rs/kWh 20 / kW
Above 100 kWh and up to 300 kWh 6.38 Rs/kWh
Above 300 kWh and up to 500 kWh 6.98 Rs/kWh
Above 500 kWh 7.19 Rs/kWh
Above 2 kW & Up to 7 kW Up to 100 kWh 4.81 Rs/kWh 25 / kW
Above 100 kWh and up to 300 kWh 6.38 Rs/kWh
Above 300 kWh and up to 500 kWh 6.98 Rs/kWh
Above 500 kWh 7.19 Rs/kWh
Above 7 kW & up to 50 kW Up to 100 kWh 4.81 Rs/kWh 30 / kW
Above 100 kWh and up to 300 kWh 6.38 Rs/kWh
Above 300 kWh and up to 500 kWh 6.98 Rs/kWh
Above 500 kWh 7.19 Rs/kWh
Above 50 kW & up to 100 kVA All units 6.11 Rs/kVAh 60 / kVA
Above 100 kVA All units 6..31 Rs/kVAh 61 / kVA
Non-residential supply
Up to 7 kW Up to 100 kWh 6.84 Rs/kWh 50 / kW
Above 100 kWh & Up to 500 kWh 7.09 Rs/kWh
Above 500 kWh 7.21 Rs/kWh
4.544.31
6.95
3.68
7.65
2.39
0
1
2
3
4
5
6
7
8
9
FY08 FY09 FY10 FY11 FY12 FY13 FY14 FY15 FY16
Domestic Non Domestic Agricultural Industrial HT Industrial LT Average Tariff

143
Consumer category Slabs (Units or load-wise) Energy charge (in Rs) Fixed charge, if any (Rs)
Above 7 kW & up to 50 kW Up to 100 kWh 6.84 Rs/kWh 70 / kW
Above 100 kWh & Up to 500 kWh 7.09 Rs/kWh
Above 500 kWh 7.21 Rs/kWh
Above 50 kW & up to 100 kVA All units 6.15 Rs/kVAh 100 / kVA
Above 100 kVA All units 6..35 Rs/kVAh 100 / kVA
Till last year, Punjab like Haryana was also following a single-part tariff. However, from fiscal 2018, Punjab State
Electricity Regulatory Commission (PSERC) has introduced two-part tariff structure.
E.1.5.3 Tariff level in Rajasthan
Jaipur Vidyut Vitran Nigam Ltd.’s (JVVNL) average realisation has increased from Rs 3.18/kWh to Rs 4.21/kWh from
fiscal 2013 to 2016, while average cost of supply has stepped up from Rs 5.51 to Rs 6.08/kWh. The gap after subsidy
support from state government has remained above Rs 1.6/kWh, which is one of the highest among the northern
states, and similar to Uttar Pradesh and Jammu & Kashmir.
Table 20: Realisation of JVVNL (Rs/kWh)
ACS ABR Gap without subsidy
Gap after subsidy booked
Gap after subsidy received
FY 2013 5.51 3.18 2.34 1.90 1.90
FY 2014 6.16 3.51 2.65 2.37 2.37
FY 2015 5.84 3.77 2.07 1.76 1.76
FY 2016 6.08 4.21 1.88 1.60 1.60
As in Haryana and Punjab, tariff increase in Rajasthan has not been aggressive. Tariff for domestic consumers has
gone up from Rs 2.84/kWh to Rs 4.65/kWh, recording 6% increase on-year over eight years.
Figure 64: Tariff trajectory (Rs /kWh)
Table 21: Latest tariff for domestic and commercial
Consumer category Slabs (Units or load-wise) Energy charge (in Rs) Fixed charge (Rs)
Domestic
BPL and small domestic
6.82
4.655.37
0
1
2
3
4
5
6
7
8
FY08 FY09 FY10 FY11 FY12 FY13 FY14 FY15 FY16
Average Tariff (JVVNL) Rs/kWh
Domestic Non Domestic Agricultural Industrial HT Average Tariff

144
Consumer category Slabs (Units or load-wise) Energy charge (in Rs) Fixed charge (Rs)
BPL and Astha card holders* Consumption up to first 50 units per month
Rs. 3.50 /unit Rs 100 per connection per month
Small domestic Consumption up to first 50 units per month
Rs 3.85/ unit Rs 100 per connection per month
General domestic-1 (Consumption up to 150 units/month)
For consumption up to first 50 units per month
Rs 3.85/ unit Rs 200 per connection per month
For consumption above 50 units and up to 150 units per month
Rs 6.10/ unit
General domestic-2 ( Consumption above 150 units and up to 300 units/month )
For consumption up to first 50 units per month
Rs 3.85/ unit Rs 220 per connection per month
51-150 units Rs 6.10/ unit
151-300 units Rs 6.40/ unit
General domestic-3 (Consumption above 300 and up to 500 units/month)
<=50 units Rs 3.85/ unit Rs 265 per connection per month
51-150 units Rs 6.10/ unit
151-300 units Rs 6.40/ unit
301-500 units Rs 6.70/ unit
General domestic-4 (Consumption above 500 units/month)
<=50 units Rs 3.85/ unit Rs 285/ connection / month
51-150 units Rs. 6.10/ unit
151-300 units Rs 6.40/ unit
301-500 units Rs.6.70/ unit
>500 units Rs 7.15/ unit
HT - Domestic (HT-1) For contract demand over 50 kVA
Rs 6.15/ unit Rs 190 per kVA of billing demand per month
Non-domestic category (LT-2 ) NDS up to 5 kW of SCL
NDS- Type1 Type1 (Consumption up to 100 units/month)
Rs. 7.55 /unit Rs 230 / connection /month
NDS- Type2 <=100 units Rs 7.55 /unit Rs 230/ connection /month
101 - 200 units Rs.8.00/unit
NDS- Type 3 (Consumption above 200 units and up to 500 units/month)
<=100 units Rs 7.55 /unit Rs 275/ connection /month
101 - 200 units Rs.8.00 /unit
201 - 500 units Rs 8.35/unit
NDS- Type 4 (Consumption above 500 units/month)
<=100 units Rs.7.55/unit Rs 330/ connection /month
101 - 200 units Rs.8.00/unit
201 - 500 units Rs.8.35/unit
>500 units Rs 8.80/unit
NDS above 5 kW of SCL (LT-2) <=100 units Rs 7.55/unit Rs 95/ KW of SCL / month
101 - 200 units Rs 8.00/unit
201 - 500 units Rs 8.35/unit

145
Consumer category Slabs (Units or load-wise) Energy charge (in Rs) Fixed charge (Rs)
>500 units Rs 8.80/unit Rs 105/ KW of SCL / month or Rs 190 per kVA of billing demand per month (If SCL is more than 18.65 KW)
HT-NDS (HT-2) For contract demand over 50 kVA
All units Rs 8.35/unit Rs190/ kVA of billing demand per month
Rajasthan has slab-wise tariff rates for different consumer categories, based on energy consumption of domestic
and non-domestic consumers. The state has two-part tariff structure unlike Punjab and Haryana. In Rajasthan,
domestic consumers are differentiated based on their energy consumption and not connected load, as in case of
Punjab and Haryana.
E.1.5.4 Tariff level in Gujarat
In comparison to Haryana, Rajasthan and Punjab, Gujarat has been able to control its ACS-ABR gap and keep its
balance sheet under check. Gujarat (Dakshin Gujrat Vij Company Limited (DGVCL)) has booked net surplus for fiscal
2016 based on ACS and ABR.
Table 22: Realisations (Rs /Kwh) DGVCL
ACS Average revenue Gap (without subsidy) Gap with subsidy booked
Gap after subsidy realised
FY 2013 5.01 5.00 0.01 -0.02 -0.02
FY 2014 5.36 5.38 -0.02 -0.05 -0.05
FY 2015 5.20 5.22 -0.01 -0.03 -0.03
FY 2016 5.70 5.72 -0.02 -0.04 -0.04
Higher realisation in Gujarat is also on account of timely tariff hikes and other measures taken to address high share
of agriculture consumers in the state.
Figure 65: Average tariff (Rs /kWh)
2.74
7.07
6.27
0
1
2
3
4
5
6
7
8
FY08 FY09 FY10 FY11 FY12 FY13 FY14 FY15 FY16
Domestic Non Domestic Agricultural Industrial HT Average Tariff

146
Table 23: Tariff structure
S No Consumer category Slab Energy charges
(Rs/kwh)
Fixed charges (Rs/month or Rs/ kW/month or
Rs/kVA/month)
1 RGP
a Urban
Energy charges
Zero
1-50 kWh 3.05 Rs/kWh
51-100 kWh 3.50 Rs/kWh
101-200 kWh 4.15 Rs/kWh
201- 250 Kwh 4.25 Rs/kWh
Above 250 kWh 5.20 Rs/kWh
Fixed charges
Upto & Including 2KW 15.00 Rs/Con/Month
Above 2 to 4 KW 25.00 Rs/Con/Month
Above 4 to 6 KW 45.00 Rs/Con/Month
Above 6 KW 70.00 Rs/Con/Month
b BPL - Urban
Energy charges
Zero 5.00 Rs/Con/Month
1-30 kWh 1.50 Rs/kWh 5.00 Rs/Con/Month
31 - 50 kWh 3.05 Rs/kWh 5.00 Rs/Con/Month
51-100 kWh 3.50 Rs/kWh 5.00 Rs/Con/Month
101-200 kWh 4.15 Rs/kWh 5.00 Rs/Con/Month
201 - 250 kwH 4.25 Rs/kWh 5.00 Rs/Con/Month
Above 250 kWh 5.20 Rs/kWh 5.00 Rs/Con/Month
c Rural
Energy charges
Zero
1-50 kWh 2.65 Rs/kWh
51-100 kWh 3.10 Rs/kWh
101-200 kWh 3.75 Rs/kWh
201-250 kWh 3.85 Rs/kWh
Above 250 kWh 4.90 Rs/kWh
Fixed charges
Up to & including 2KW 15.00 Rs/Con/Month
Above 2 to 4 KW 25.00 Rs/Con/Month
Above 4 to 6 KW 45.00 Rs/Con/Month
Above 6 KW 70.00 Rs/Con/Month

147
S No Consumer category Slab Energy charges
(Rs/kwh)
Fixed charges (Rs/month or Rs/ kW/month or
Rs/kVA/month)
d BPL - Rural
Energy charges
Zero 5.00 Rs/Con/Month
1-30 kWh 1.50 Rs/kWh 5.00 Rs/Con/Month
31 - 50 kWh 2.65 Rs/kWh 5.00 Rs/Con/Month
51-100 kWh 3.10 Rs/kWh 5.00 Rs/Con/Month
101-200 kWh 3.75 Rs/kWh 5.00 Rs/Con/Month
201-250 kWh 3.85 Rs/kWh 5.00 Rs/Con/Month
Above 250 kWh 4.90 Rs/kWh 5.00 Rs/Con/Month
Gujarat bifurcates domestic consumers into rural and urban, for tariff purposes. This helps in identifying paying
capacity of consumers and loading suitable cost. The maximum tariff slab for domestic consumers in urban areas is
Rs 5.2/kWh and in rural areas Rs 4.90/kWh.
E.1.5.5 Tariff level in West Bengal
Average cost of supply in West Bengal has remained constant during last four years (at Rs 4.9/kWh) and so has
average revenue.
Table 24: Realisations (Rs /kWh)
ACS Avg. revenue Gap (without subsidy) Gap (subsidy booked) Gap (subsidy realised)
FY 2012-13 4.92 4.95 -0.03 -0.03 -0.03
FY 2013-14 4.89 4.90 -0.01 -0.01 -0.01
FY 2014-15 4.92 4.93 -0.01 -0.01 -0.01
FY 2015-16 4.84 4.85 -0.01 -0.01 -0.01
Figure 66: Average tariff (Rs/kWh)
Unlike other states, West Bengal saw regular tariff increase during fiscals 2008 to 2011, and thus lower accumulated
losses. Average tariff in fiscal 2016 has effectively reduced in comparison to fiscal 2013.
5.47
4.07
7.5
6.32
0
1
2
3
4
5
6
7
8
9
FY08 FY09 FY10 FY11 FY12 FY13 FY14 FY15 FY16
Domestic Non Domestic Agricultural Industrial HT Average Tariff

148
Table 25: Tariff in West Bengal (WBSEDCL)
Type of consumer Consumer category
Name of the tariff scheme
Quarterly consumption in
KWH
Energy charge Rs/kWh
Fixed charge/Demand charge * in Rs/KVA/month
Domestic
Life line (Domestic) Rate A(DM-LL) Normal 0 to 75 3.56 5
Domestic (Rural) Rate A (DM-R) Normal First 102 5.26 15
Next 78 5.86
Next 120 6.73
Next 300 7.23
Next 300 7.32
Above 900 8.99
Domestic (Urban) Rate A (DM-U) Normal First 102 5.3 15
Next 78 5.97
Next 120 6.97
Next 300 7.31
Next 300 7.58
Above 900 8.99
Commercial
Commercial (Rural) Rate A(CM-R) Normal First 180 6.17 30
Next 120 7.37
Next 150 8.02
Next 450 8.45
Above 900 8.94
Commercial (Urban) Rate A(CM-U) Normal First 180 6.19 30
Next 120 7.39
Next 150 8.02
Next 450 8.45
Above 900 8.94
There are three sets of tariff schedules – lower-voltage (LV) and medium-voltage (MV) consumers under quarterly
billing cycle, LV and MV consumers under monthly billing cycle, and high-voltage (HV) and extra high- voltage (EHV)
consumers under monthly billing cycle. Domestic rural and urban category have been kept under quarterly billing
cycle along with commercial (rural), commercial (urban), public utility (in municipal area), public utility (in non-
municipal area), government school, and many more. West Bengal differentiates commercial consumers into urban
and rural.
E.1.6 Retail tariff structure across select states
We have selected states based on geographic coverage to provide a broad overview of the number of tariff categories
and slabs (as per latest the available tariff orders).

149
Table 26: Number of categories and sub-categories/slabs varies across select states
S. no.
State Categories Sub-categories/slabs
Domestic Commercial Industrial Railways Agriculture Others Total
1 Haryana 15 7 5 10 4 4 15 45
2 Punjab 17 14 10 5 1 3 10 43
3 Rajasthan 8 6 6 5 - 4 4 25
4 Gujarat 18 10 5 4 1 3 11 34
5 Karnataka (BESCOM)
12 14 16 14 1 4 13 62
6 West Bengal 9 12 17 11 - 5 27 72
7 Delhi 9 6 1 1 - 1 5 14
Note: Others includes street lighting, public water works, educational institutes, places of worship, temporary supply, etc.
The number of categories varies from as low as eight (Rajasthan) to as high as 18 (Gujarat) among the sample
states. The number of sub-categories/slabs within these categories varies from as low as 14 (Delhi) to as high as 72
(West Bengal). There is a huge variation among the sub-categories/slabs across the states as well.
Slab levels differ across states
Based on the above tariff-setting mechanism, SERCs across India determine the tariff for each consumer class. Even
though the principle followed by each regulator is the same, the outcome is different. In case of domestic tariff, some
SERCs have determined tariff slabs till 1,000 units, whereas in some states, it has been restricted to 250 units. Tariff
for minimum consumption shows a similar disparity.
S No State Min slab Tariff Max slab Tariff Difference
1 Uttarakhand 30 kWh 1.50 Above 500 units 5.10 3.60
2 Punjab 100 kWh 4.81 Above 500 kWh 7.19 2.38
3 Haryana 50 KWh 2.70 Above 800 kWh 7.10 4.40
4 Rajasthan 50 KWh 3.50 Above 500 kWh 7.15 3.65
5 Gujarat 50 KWh 3.05 Above 250 kWh 5.20 2.15
6 Madhya Pradesh 30 KWh 3.10 Above 300 KWh 6.30 3.20
7 Himachal Pradesh 60 KWh 2.85 Above 300 KWh 5.10 2.25
8 Maharashtra 30 KWh 1.08 Above 1000 kWh 12.65 11.57
9 Karnataka 30 KWh 3.25 Above 500 KWh 7.40 4.15
10 West Bengal 75 KWh 3.56 Above 900 KWh 8.99 5.43
E.1.6.1 Grouping of tariffs
The latest tariff orders were analysed in detail state-wise to understand the salient features of the tariff structure
across the select states. New/additional consumer categories were identified in each state, thus increasing the overall
number of consumer categories and slabs.
Based on the analysis, the select states were categorised as follows:

150
Table 27: Tariff categorisation of select states
Haryana Punjab Rajasthan Gujarat Karnataka West Bengal Delhi
No of categories 15 17 8 18 12 9 9
No of slabs 45 43 25 34 62 72 14
Complexity Moderate Moderate Simple Moderate Complicated Complicated Simple
Karnataka has differential tariffs for rural and urban consumers and separate consumer categories for a) private
educational institutions, private hospitals and nursing homes belonging to urban and rural areas (b) horticulture,
nurseries, coffee, tea and rubber (c) heating and motive power (d) hoardings and advertisements on permanent basis
(e) HT government hospitals, hospitals run by charitable institutions, ESI hospitals, educational institutions belonging
to the government, local bodies, aided institutions and hostels of all educational institutions (f) HT hospitals and
educational institutes other than those covered in the latter specified category (g) HT residential apartments (i)
separate tariffs for domestic and commercial categories under village panchayats, which makes the overall tariff
structure complex.
Likewise, in West Bengal, the 54 sub-categories/slabs are spread across LV/MV and HV and EHV (with quarterly
billing in some of the categories), thereby making the tariff structure quite complex to understand.
On the other hand, Delhi has just nine consumer categories. Moreover, the non-domestic, agriculture, and industrial
categories have a single tariff, which makes the tariff structure quite simple to comprehend and implement. In fact,
Delhi has simplified its tariff structure to a great extent, reducing the number of sub-categories within each broad
category, too. Non-domestic, agriculture, and industrial have just one broad category vis-à-vis other states, which
generally have 3-4 sub-categories/slabs within each of these.
Further, most of the states analysed have introduced two-part tariffs and time-of-day (TOD) tariffs for select
categories. However, TOD tariff implementation for all consumer categories as mandated by the NTP is yet to take
place.
Table 28: TOD implementation status across select states
Haryana Punjab Rajasthan Gujarat Karnataka West Bengal Delhi
TOD implementation
Yes (optional)
Yes Yes Yes Yes Yes Yes
Consumer categories
Optional for HT industry including furnace, LT industry, HT non-domestic, bulk supply consumers (excluding bulk DS), public water works and lift irrigation
Mandatory for large supply industrial, medium supply industrial, NRS/BS consumers with sanctioned contract demand exceeding 100 kVA
HT industry, non-domestic
Mandatory for HT industrial
Mandatory for HT2 consumers with a contract demand of 500 KVA and above.
Optional ToD for HT2 consumers with contract demand less than 500 KVA. Also, optional ToD for LT5 and HT1 consumers
Compulsory TOD for industries (220 kV), industries (400 kV), commercial plantation, irrigation supply, etc.
Optional TOD exists for nearly all consumer categories other than domestic and lifeline consumers
All consumers (other than domestic) whose sanctioned load/MDI (whichever is higher) is 10kW/11kVA and above
Period applicable
October to March
April to October (large
- Throughout the year
Throughout the year
Throughout the year
May to September

151
Haryana Punjab Rajasthan Gujarat Karnataka West Bengal Delhi
supply, medium supply); November to March (for consumers with CD> 100 kVA)
E.2 Under-recovery of fixed costs by state discoms
The retail supply tariff comprises two parts: fixed/demand charge and energy/variable charge. Fixed/demand charge
is designed to recover utility costs that are fixed in nature, such as capacity charges payable to power generators,
transmission charges, operation and maintenance expenses, depreciation, interest on loans, and return on equity.
This is generally recovered on the basis of sanctioned load/connected load / contract demand or maximum demand
of consumers. Energy/variable charge is designed to recover utility costs that are variable in nature, such as the
variable cost component of power purchase. This cost is recovered on the basis of the actual consumption during
the billing period (per kWh or per kVAh basis).
The relevant sections of the Electricity Act, 2003, and NTP 2016 that also emphasise on two-part tariff, are as follows:
Section 45, Electricity Act, 2003 (Power to recover charges)
(1) Subject to the provisions of this section, the prices to be charged by a distribution licensee for the supply of
electricity by him in pursuance of section 43 shall be in accordance with such tariffs fixed from time to time and
conditions of his licence.
(2) The charges for electricity supplied by a distribution licensee shall be -
(a) fixed in accordance with the methods and the principles as may be specified by the concerned state
commission ;
(b) Published in such manner so as to give adequate publicity for such charges and prices.
(3) The charges for electricity supplied by a distribution licensee may include a fixed charge in addition to the
charge for the actual electricity supplied”
NTP 2016 also emphasises on the two-part tariff:
NTP 2016 and NTP 2006 focus on introduction of a two-part tariff. Clause 8.4 (1) of NTP 2016 defines the tariff
components and their applicability as follows:
"Two-part tariff featuring separate fixed and variable charges, and time differentiated tariff shall be introduced on
priority for large rammer consumers (say, consumers with demand exceeding one megawatt within one year)…"
E.2.1 SERC’s approach to determine tariffs (fixed and variable tariff)
However, there is a mismatch between the actual fixed and variable cost liability incurred by a utility to the proportion
of cost recovered through fixed charge and energy charge. The present retail tariff applicable in most states in India
includes only a part of the fixed cost into recovery as fixed charges, whereas a major portion of the fixed cost is
recovered through the energy charge component of the retail tariff. This kind of tariff structure leads to a mismatch
in the cash flow of the discoms as they have a fixed charge obligation to gencos and transcos irrespective of the
quantum of power procured besides their own fixed cost liabilities. As a major part of the fixed cost is recovered
through energy charges and the monthly collection on account of energy charge is dependent on sales, which varies

152
by more than 50% due to seasonal/weather conditions. Working capital management and any abrupt change in
consumption pattern can lead to a cash flow impact on discoms. Even though there would always be a mismatch
between the real fixed cost liabilities and the amount collected thereof through tariff, reliance on the variable
component can impact discoms’ viability to a large extent.
As can be seen from the figure below, the fixed components of cost for all the select states are in the range of 40%
to 74%, whereas revenue recovery through fixed cost is in the range of 13% to 27%. This reflects under-recovery of
fixed cost through tariff of ~43% as in the case of Gujarat and 81% as in the case of Madhya Pradesh.
Figure 67: Percentage of fixed and variable components in total cost
Source: Tariff orders, CRIS analysis
Figure 68: Recovery of fixed cost as a percentage of revenue
Source: Tariff orders, CRIS analysis
Realisation on account of fixed charges in tariff from different consumer categories needs to be looked at in detail.
Most of the subsidised categories pay less fixed charges compared with industrial and commercial consumers
because of high cross-subsidies built into these consumer categories, which leads to a skewed tariff structure.
Rationalisation of fixed and variable cost is also required to reduce overall tariff of industrial consumers.
43%58%
49%36%
46%54%
0%
10%
20%
30%
40%
50%
60%
70%
80%
90%
100%
Guj M.P Chattisgarh Karnataka Maharashtra Uttarakhand
Cost (%) Fixed Cost (%) Variable
27%15%
23%11% 17% 13%
57%
22%
41%
32%36%
25%
0%
10%
20%
30%
40%
50%
60%
70%
0%
10%
20%
30%
40%
50%
60%
70%
80%
90%
100%
Guj M.P Chattisgarh Karnataka Maharashtra Uttarakhand
Revenue (%) Fixed Revenue (%) Variable Fixed cost Recovery

153
As can be seen from the table below, fixed revenue from the industrial category is in the range of 25%-27%, which
provides adequate capital to utilities to meet their fixed liabilities. On the other hand, contribution of revenue from
domestic and agriculture consumers is not significant (cumulatively) compared with the industrial category.
Table 29: Fixed and variable charges for different categories of consumers
States Revenue from domestic consumer category Revenue from industrial consumer category
Fixed Variable Fixed Variable
Gujarat 4% 96% 25% 75%
Madhya Pradesh 21% 79% 27% 73%
Source: Tariff orders, CRIS analysis
Under the present regulatory framework to promote competition through OA, if tariff components (fixed and variable)
are not reflective of the proportion of their liabilities, discoms will always be weighed down by insufficient recovery of
the fixed cost. Therefore, tariff structure also acts as an artificial barrier for OA consumers.
E.2.1.1 Cross-subsidy trajectory determined by SERCs
The cross-subsidy for industrial consumer states like Gujarat, Tamil Nadu and Madhya Pradesh is still higher than
20% of the average cost of supply. Even though NTP 2006 and NTP 2016 prescribed the criteria for cross-subsidy
where gradual reduction on cross-subsidy was envisaged, many states have just been able to reach the 20% mark.
This has also resulted in higher tariff, which is being used in calculating Cross-subsidy Surcharge (CSS) in the formula
determined in NTP 2016. Out of 10 states, four have cross-subsidy higher than 20% of average cost of supply.
Further, in case of HT consumers, if the voltage-wise cost of supply is considered, the same will be even higher.
Figure 69: Cross-subsidy for industrial consumers
Source: SERC Tariff Orders 2018-19
There is also a widening gap between the tariffs of subsidising and subsidised consumers. As a standard practice in
most of the states, the gap is closed with additional subsidies from the state government.
E.2.2 Case study- Rationalisation of tariff structure in Delhi
The Delhi Electricity Regulatory Commission (DERC) has simplified the tariff categories and rationalised the tariff
structure. It has increased fixed charges and reduced energy charges across all consumer categories in order to
make tariff and revenue reflect the actual costs incurred by the distribution licensee.
0%
20%
40%
60%
80%
100%
120%
140%
Rajasthan Maharastra AndhraPradesh
UttarPradesh
Karnataka Gujarat Tamil Nadu HimachalPradesh
Bihar MadhyaPradesh

154
As per the earlier mix of cost and revenue recovery, the total fixed cost in the ARR was ~45% as against revenue
from fixed charges at ~10% only. On the contrary, the variable cost component in ARR was ~55%, as against revenue
from variable charges at ~90%. After rationalisation of tariff, the new mix of cost and corresponding revenue recovery
is as follows:
Table 30: Revenue requirement and revenue proposed to be realised from tariff
Components of tariff Old tariff structure Amended tariff structure
ARR Revenue % recovery ARR Revenue % recovery
Fixed 45% 10% (35%) 30% 26% (4%)
Variable 55% 90% 35% 70% 74% 4%
The tariff now considerably reflects the actual costs incurred by the utility. The fixed cost component in ARR is 30%
and the corresponding recovery of fixed charges through revenue is 26%. Likewise, the variable cost in ARR is 70%
and the corresponding recovery of variable charges through revenue is 74%. With this tariff adjustment, the cost
incurred and revenue recovered by the utility almost match, ensuring adequate recovery for the utility.
Fixed charges have been increased by Rs 100/kW/month (or Rs/kVA/month) on average. Likewise, variable charges
have been reduced by Re 1/kWh. Even though tariff has increased for the industrial and non-domestic categories,
the Commission has tried to ensure that domestic consumers do not experience any kind of tariff shock. The impact
of the same is shown in the matrix below:
Table 31: Impact on total monthly bill of domestic consumers for fiscal 2019
Consumption units 1 kW 2 kW 3 kW 4 kW 5 KW
Previous tariff
100 420
210 880 900
310 1475 1495 1560
410 2083 2103 2168 2203
510 2813 2833 2898 2933 2968
Revised tariff
1 kW 2 kW 3 kW 4 kW 5 KW
100 425
210 770 895
310 1220 1345 1515
410 1690 1815 1985 2125
510 2340 2465 2635 2125 2265
With this tariff rationalisation, the DERC has ensured that domestic consumers will not be impacted by increase in
fixed charges.
In fact, initiatives for simplifying tariff structures have also been taken by the DERC in its latest tariff order for Delhi
for fiscal 2019. It has simplified its tariff structure, with just nine broad consumer categories. While sub-slabs exist for
the domestic category, the rest of the consumer categories have just one tariff. The broad consumer categories for
Delhi are:
Domestic
Non-domestic

155
Industrial
Agriculture and mushroom cultivation
Public utilities
Delhi International Airport Ltd (DIAL)
Advertisement and hoardings
Temporary supply
Charging stations for e-rickshaw/e-vehicle on single point delivery
DERC has merged the following categories and created ‘public utilities’ - a new category that provides public services:
1. Delhi Jal Board (DJB): Available to DJB for pumping load and water treatment plants
2. Railway traction: Available to Indian Railways for traction load
3. Delhi Metro Rail Corporation (DMRC): Available to DMRC for traction load
4. Public lighting: Street lighting, signals and blinkers
Likewise, in the industrial category, the DERC has eliminated many slabs and all consumers under this category will
be charged on kVAh basis. Further, the scope of industrial tariff has been extended to hospitals (other than those
covered in the domestic category) including lighting, heating, and cooling load. Hostels of recognised/aided
educational institutions have also been clubbed into the domestic category.
Similarly, a guiding framework can be prepared for other states to simplify the tariff structure and have uniform
categorisation/sub-categorisation across all states, thereby serving as a key supporting block at the time of
introduction of the content and carriage.
Enabling framework for designing retail tariff structure
The roots of designing any retail tariff structure emanates from Section 62(3) of the Electricity Act, 2003, which states:
‘’The Appropriate Commission shall not, while determining the tariff under this Act, show undue preference to any
consumer of electricity but may differentiate according to the consumer’s load factor, power factor, voltage, total
consumption of electricity during any specified period or the time at which the supply is required or the
geographical position of any area, the nature of supply and the purpose for which the supply is required.’’
(Bold added for emphasis)
Further, as per Clause 8.4 (definition of tariff components and their applicability) of the NTP:
1. Two-part tariffs featuring separate fixed and variable charges and time-differentiated tariffs are to be
introduced for all consumers (> 1 MW within one year and other consumers within five years)
2. The metered tariffs and incentives should be given wide publicity. Smart meters have the advantages of
remote metering and billing, implementation of peak and off-peak tariff, and demand-side management through
demand response.
Need for review of complexity in retail tariff structure
Over a period of time, owing to extensive changes in the consumer mix, consumption pattern, and demand-supply
scenario, there has been a substantial addition in the number of categories, sub-categories, and slabs. While
introduction of these categories served the intended purpose initially, it has now become difficult for regulatory
commissions to do away with any of them, owing to socio-political reasons. In fact, the Economic Survey for fiscal
2016 noted the following key points regarding electricity tariffs:
Complexity of tariff schedules prevents economic actors from responding sufficiently to price signals
Price and non-price barriers are hindrances to having a single, nationwide electricity tariff through OA

156
Existence of multiple tariff categories, sub-categories and slabs create a complexity which prevents consumers
from fully responding to changes in tariffs because of the high cost of processing the price information
E.3 Steps taken by SERCs to simplify tariff structure
Analysis of the select states shows that most states continue to have a moderate-to-complex tariff structure. Barring
Delhi, all the states have multiple sub-categories and multiple slabs within each consumer category.
Karnataka and West Bengal have a high number of consumer categories. Karnataka has differential tariff for rural
and urban consumers. In Karnataka, separate consumer categories exist for a) private educational institutions,
private hospitals and nursing homes belonging to urban and rural areas (b) horticulture, nurseries, coffee, tea and
rubber (c) heating and motive power (d) hoardings and advertisements on permanent basis (e) HT government
hospitals, hospitals run by charitable institutions, ESI hospitals and educational institutions belonging to the
government, local bodies, aided institutions and hostels of all educational institutions (f) HT hospitals and educational
institutes other than those covered in the latter specified category (g) HT residential apartments (i) separate tariff for
domestic and commercial categories under village panchayats, which makes the overall tariff structure complex.
Likewise, in West Bengal, there are 22 consumer categories in each LV/MV and HV and EHV, taking the number of
consumer categories to 44. Further, some consumer categories are billed on a quarterly basis, taking the overall
number of consumer categories to 54. This makes the tariff structure quite complex to understand.
On the other hand, Delhi just has nine consumer categories. Further, there is a single tariff for the non-domestic,
agriculture and industrial categories, which makes the tariff structure quite easy to comprehend and implement. This
also makes technological interventions easy to implement. Management Information Systems (MIS) become easy to
implement and understand. Billing and tracking collection is easy and can lead to enhanced revenue collection for
the utility.
E.4 Interventions for tariff standardisation
Any attempt to simplify the tariff structure must be guided by the following factors governing tariff design:
Single part v/s two-part tariff structure
kWh v/s kVAh based tariff
Flat v/s TOD tariff
Flat v/s seasonal tariff
Flat v/s tariff based on consumption pattern
Revenue neutrality must be ensured while simplifying tariff categories. We may merge/eliminate existing tariff
categories based on the following principles:
End-use
Energy consumption
Socio-economic profile/affordability
Social factors (rural and urban area differentiation, etc.)
Consumption pattern/load factor, etc.
Voltage level
Efficient energy use, etc.

157
Based on the above exercise, standard tariff categories need to be defined across all states. Also, guidelines need
to be laid out for determination of sub-categories and prescribing limit on the number of slabs under the standard
tariff categories.
A case in example is that of Delhi, which has simplified its tariff structure to a great extent. To cite an example, DERC
has merged the following categories and created ‘public utilities’ -- a new category that provides public services:
5. Delhi Jal Board: Available to DJB for pumping load and water treatment plants
6. Railway Traction: Available for Indian Railways for traction load
7. Delhi Metro Rail Corporation: Available to Delhi Metro Rail Corporation (DMRC) for traction load
8. Public lighting: Street lighting, signals and blinkers
Likewise, in the industrial category, the Commission has eliminated many slabs and all the consumers under this
category shall be charged on kVAh basis. Further, the scope of industrial tariff has been extended to hospitals (other
than those covered in the domestic category) including lighting, heating and cooling load. Also, hostels of
recognised/aided educational institutions have been clubbed into the domestic category.
Any tariff standardisation exercise at the national level will require a comprehensive assessment of the impact on
revenue of the utilities. The tariff design should reflect the prudent and efficient cost of supply to the consumers while
maintaining revenue neutrality. The new tariff structure should adequately recover fixed costs of the distribution utility
through demand charges and variable costs through energy charge. Socio-economic development of the utility
should be promoted by providing attractive and affordable tariffs to households, agricultural and industrial consumers.

158
Annexure F - Recommendations and the way forward
F.1 Enabling provisions in policy and regulatory framework
Issues Recommendations
High cross-subsidy and inadequate realisation
Cross-subsidy needs to be followed as per the NTP 2016, and the Electricity Act, 2003,
Cross-subsidy for many of the industrial and commercial consumers is still higher than the prescribed limit of 20% of average cost of supply under NTP 2016. Commissions should follow the guidelines given in NTPC 2016 and the Electricity Act, 2003, to gradually reduce the cross-subsidy at the prescribed limit.
Universal supply obligation & subsidy delivery
Implement USO and DBT for domestic consumers in a phased manner as per National Tariff Policy, 2016
In order to improve the cash deficit and efficiently implement Universal supply obligation (USO), subsidy for targeted consumers could be paid through State budget, directly to the consumers through Direct Benefit Transfer (DBT). This ca help improve accountability, reduce delays, and deliver subsidy to consumers more efficiently.
Rationalisation of fixed and variable cost required to reduce overall tariff of industrial consumers
Review the applicability of fixed charge and its coverage to meet fixed obligations
Under the present regulatory framework to promote competition through OA, if the tariff components (fixed and variable) do not reflect the proportion of their liabilities, there will always be an under-recovery of the fixed cost by the discoms, leading to the fear of losing a high-paying consumer. Therefore, fixed charge recovery for subsidised consumers’ needs to be considered in order to get the right compensation.
Recently, DERC revised its fixed charges for domestic consumers to reflect the actual fixed component in their cost structure:
EXISTING TARIFF
Consumption Units 1 kW 2 kW 3 kW 4 kW 5 KW
100 420
210 880 900
310 1475 1495 1560
410 2083 2103 2168 2203
510 2813 2833 2898 2933 2968
REVISED TARIFF
1 kW 2 kW 3 kW 4 kW 5 KW
100 425
210 770 895
310 1220 1345 1515
410 1690 1815 1985 2125
510 2340 2465 2635 2125 2265
A similar approach may be followed by other states to reflect their fixed cost component for residential and other consumers to improve the discoms overall cash flow.
Simplification of tariff structure and cost-reflective tariff
Simplification of tariff structure
Currently, tariffs framed by SERCs for retail consumers are complex in nature with many sub-categories and conditions, which leads to confusion not just at the consumer level, but even at the discom level. We recommend that tariff structures be reviewed. While simplifying tariff categories, revenue neutrality must be ensured. We may merge/eliminate existing tariff categories based on the following principles:
a. End-use
b. Energy consumption
c. Socio-economic profile/affordability
d. Social factors (rural and urban area differentiation, etc.)

159
Issues Recommendations
e. Consumption pattern/load factor etc.
f. Voltage level
g. Efficient energy use, etc.
High cross-subsidy surcharge and additional surcharge
Uniform methodology to calculate open-access charges
NTP 2016 clearly mandates that OA charges should not be so onerous that it kills competition. It is key to implement prescriptions contained in the Electricity Act, 2003, and NTP in respect of OA and charges related to it.
A competent body at the central level can regularly take stock of the OA situation on the ground. It must ensure that competition thrives and is not threatened, and that the provisions under the Act are implemented and not violated. It is also imperative to prescribe a uniform methodology for determining additional surcharge (AS) and re-evaluating the parameter “C” of the CSS formula as provided in the NTP.
Also, tariffs should be such that only energy charges should be the deciding factor for the consumer, whether he/she has to procure power through OA or the incumbent discom. All other charges should be the same, whether the consumer procures power from a third party or the incumbent discom.
Transparency and process-related issues
On-line registry to improve transparency at the state level
It is appropriate to mention that the necessary infrastructure has already been laid by the distribution utility that is designed to cater to the contracted demand of the OA consumer. However, an OA consumer has to seek NOC from the SLDC on a monthly basis. This is being viewed as a major challenge. If the consumer seeks OA up to their contract demand, there should be an automatic provision (if possible, without involving the utility) to keep the NOC valid up to a minimum period of one year, provided that voltage level connectivity of the consumer remains the same during that period. Further, the system of issuance of NOCs for OA is largely manual in majority of the states and requires a lot of manual intervention and endless paperwork.
The National Energy Registry should be implemented to automate and streamline approvals as well as other processes related to OA and to eliminate physical interaction with the SLDCs for approvals. This system will also be able to track the validity of the OA applications and help the SLDCs in effective system planning. More importantly, the registry shall ensure transparency in maintaining and displaying the status of applications. Transparency at SLDCs can be increased through:
Centralized online platform & monitoring to accept applications of OA consumers
Defined reasons for possible rejection
Limited interaction with discoms during the application process
One-time creation of account for an open-access consumer and ease in applying multiple short-term open access applications
Document reason for denial of OA connection
The platform could be created by MOP. State Discoms & respective agencies could be given separate login IDs for providing NOC
Reasons for rejection have no convincing ground
Clear guidelines on requirement and possible list of reasons for rejection should be circulated
After the application is submitted, many OA consumers face rejection on frivolous grounds without any proper explanation. Under such cases, consumer feel discouraged to apply for OA. Some steps that can help solve this issue are:
Discoms/ SLDCs can provide acceptable justification and reasons for rejected applications
Discoms/SLDCs can provide a Dos/Don’ts list for consumers
applying for OA
Maintain registry and transparent records at the central level as well
Coal resources not available for plants without PPA
The LTSLC (Long Term Standing Linkage Committee) has not awarded Coal linkage to any plant since 201045. Further there is a condition of usage of linkage coal only for long term PPA holders. Thus in the absence of coal linkages, power plants are unable to supply power at commercially viable rates to the Open Access consumers.
This has significantly restricted the growth of long/ medium term power supply market for OA consumers. Thus there is a dire need for coal allotment to all the plants (with or without PPA).
45 Source – Press Information Bureau

Argentina | China | Hong Kong | India | Poland | Singapore | UK | USA | UAE
CRISIL Risk and Infrastructure Solutions Limited (A subsidiary of CRISIL Limited)
CRISIL House, Central Avenue, Hiranandani Business Park, Powai, Mumbai – 400076. India
Phone: + 91 22 3342 3000 | Fax: + 91 22 3342 3001 | www.crisil.com
About CRISIL Limited
CRISIL is a leading, agile and innovative global analytics company driven by its mission of making markets function better.
It is India’s foremost provider of ratings, data, research, analytics and solutions, with a strong track record of growth, culture of innovation and global footprint.
It has delivered independent opinions, actionable insights, and efficient solutions to over 100,000 customers.
It is majority owned by S&P Global Inc, a leading provider of transparent and independent ratings, benchmarks, analytics and data to the capital and commodity markets worldwide.
About CRISIL Infrastructure Advisory
CRISIL Infrastructure Advisory is a leading advisor to regulators and governments, multilateral agencies, investors, and large public and private sector firms. We help shape public policy and enable infrastructure development. Our services span a wide array of infrastructure development activities. Our work in the areas of policy formulation, regulation, design and implementation of public-private partnership (PPP) frameworks and infrastructure financing mechanisms helps create a vibrant ecosystem for infrastructure development. Our services at the project level include bid process management, valuations and due diligence to enable investment decisions. We are known for our core values of independence and analytical rigour combined with deep domain expertise. Our teams have expertise across the complete range of infrastructure sectors - urban development, energy, transport and logistics, natural resources, education, and healthcare. We have a rich understanding of PPP and financing related issues. We operate in India and 22 other emerging economies in Asia, Africa, and the Middle East. CRISIL Infrastructure Advisory is a division of CRISIL Risk and Infrastructure Solutions Limited, a wholly owned subsidiary of CRISIL Limited.
CRISIL Privacy
CRISIL respects your privacy. We may use your contact information, such as your name, address, and email id to fulfil your request and service your account and to provide you with additional information from CRISIL. For further information on CRISIL's privacy policy please visit www.crisil.com.
Disclaimer
This report is prepared by CRISIL Risk and Infrastructure Solutions Limited (CRIS). This report may have been prepared by CRIS at the request of a client of CRIS (client). This report may include or refer to information and materials provided by the client and/or obtained by CRIS from sources that CRIS considers reliable (together, “materials”). In preparing this report, CRIS does not independently validate any such materials and assumes those materials are accurate. CRIS does not guarantee the accuracy, adequacy or completeness of any material contained in or referred to in the report. While CRIS takes reasonable care in preparing the report, CRIS shall not be responsible for any errors or omissions in or for the results obtained from the use of or the decisions made based on, the report. The user takes full responsibility for the use of and the decisions made based on the report. While portions of materials are included in the report, CRIS makes all reasonable attempts to attribute credits to the source of the materials; however, even if a particular source of a material is not so attributed, CRIS stakes no claim to any such material in the form as provided to or made accessible to CRIS. No third party whose material is included or referenced in this report under credit to it, assumes any liability towards the user with respect to such material. Neither CRIS nor its directors, employees and representatives accept any liability with regard to any access, use of or reliance on, the report and that CRIS expressly disclaim all such liability. Any third party brands, names or trademarks contained in the report belong to the relevant third parties. The report contains CRIS’ view as at the date of the report based on available material. CRIS does not assume an obligation to update the report where updated materials are available or to notify anyone that an updated report is available. This report may not be reproduced or redistributed or communicated directly or indirectly in any form or published or copied in whole or in part except as authorized by CRIS. Unless CRIS has expressly agreed in writing, this report is not intended for use outside India. By accessing and/or using any part of the report, the user accepts the foregoing disclaimers and exclusion of liability which operates to the benefit


