Diagnostic Indicators for Shipboard Mechanical Systems...
101
-
Upload
hoangduong -
Category
Documents
-
view
225 -
download
2
Transcript of Diagnostic Indicators for Shipboard Mechanical Systems...
Diagnostic Indicators for Shipboard Mechanical Systems Using Non-Intrusive Load Monitoring
by Thomas Duncan McKay
B.S., Physics Florida State University, 1996
Submitted to the Department of Mechanical Engineering in Partial Fulfillment of the
Requirements for the Degrees of Naval Engineer
and Master of Science in Mechanical Engineering
at the Massachusetts Institute of Technology
June 2006
© 2006 Thomas Duncan McKay. All rights reserved.
The author hereby grants to MIT and the US Government permission to reproduce and to distribute publicly paper and electronic copies of this thesis document in whole or in part in any
medium now known or hereafter created.
Signature of Author______________________________________________________________ Department of Mechanical Engineering
May 12, 2006 Certified by ___________________________________________________________________
Robert W. Cox, Doctoral Candidate Department of Electrical Engineering and Computer Science
Thesis Reader Certified by ___________________________________________________________________
Timothy J. McCoy, Associate Professor of Naval Construction and Engineering Department of Mechanical Engineering
Thesis Reader Certified by ___________________________________________________________________
Steven B. Leeb, Professor of Electrical Engineering and Computer Science Department of Electrical Engineering and Computer Science
Thesis Supervisor Accepted by ___________________________________________________________________
Michael Triantafyllou, Professor of Mechanical Engineering Chairman, Department Committee on Graduate Students
Center for Ocean Engineering Accepted by ___________________________________________________________________
Lallit Anand, Professor of Mechanical Engineering Chairman, Department Committee on Graduate Students
Department of Mechanical Engineering

(This Page Intentionally Left Blank)
2
Diagnostic Indicators for Shipboard Mechanical Systems Using Non-Intrusive Load Monitoring
by Thomas Duncan McKay
Submitted to the Department of Mechanical Engineering in Partial Fulfillment of the
Requirements for the Degrees of
Naval Engineer
and
Master of Science in Mechanical Engineering
ABSTRACT This thesis examines the use of Non-intrusive Load Monitoring (NILM) in auxiliary shipboard systems, such as a low pressure air system, to determine the state of equipment in larger connected systems, such as the main propulsion engines. Using data collected on previously installed NILM’s at the Naval Surface Warfare Center, Philadelphia DDG-51 Land Based Engineering Site (LBES), major event changes were analyzed and diagnosed using power data collected from the in-service low pressure air compressor (LPAC) and the in-service fuel oil pump. Events investigated include main propulsion engine starts and loadings, gas turbine generators starts, major electrical load shifts, and leak insertions into the low pressure air system. An additional NILM was installed on the General Electric LM2500 Universal Engine Controller (UEC) in order to assist in the diagnosis of various state changes. The UEC provides the appropriate interfaces to monitor and control each LM2500 GTM. The UEC controls the application of starter air, ignition power, and fuel to the engine while also receiving feedback of engine parameters from sensors on the engine. Using the combined data received by the LPAC, fuel oil pump, and UEC, a diagnosis system is derived that can detect major events in the engineering plant described above. Thesis Supervisor: Steven B. Leeb Title: Professor of Electrical Engineering and Computer Science Thesis Reader: Timothy J. McCoy Title: Associate Professor of Naval Construction and Engineering
3

Acknowledgements From the MIT Laboratory for Electromagnetic and Electronic Systems I would like to
thank:
• Professor Steven Leeb of the Department of Electrical Engineering and Computer
Sciences for being an enthusiastic advisor and for trusting his students to follow their
own instincts and supporting them while they do it.
• Mr. Robert Cox for his incredible patience, guidance, expertise, direction, and good
humor.
• Mr. Chris Laughman and Mr. Jim Paris for their wonderful patience and assistance.
From the staff of the Navy’s DDG-51 Land Based Engineering Site (LBES) located at the
Navy’s Surface Ship Engineering Complex in Philadelphia, Pennsylvania, I would like to thank:
• Mr. Andy Cairns for opening his doors and patiently allowing me to pester the staff.
• Mr. Charlie Gilligan for his patience, assistance, and effort.
• Mr. Lee Skarbeck for his assistance and expertise.
• Mr. Tom “Buck” Ryan for his effort and assistance.
• Mr. Frank Facciolo for his effort and assistance.
From the MIT Center for Ocean Engineering, Naval Construction and Engineering
Program, I would like to especially thank CDR (Ret.) Tim McCoy, USN for all his hard work
and effort training Naval officers on what it means to be a Naval Engineer. The invaluable
lessons he taught will serve as guidance for many years to come.
I would also like to thank LT Jip Mosman, USN for being such an excellent and
supportive partner during my stay at MIT and in the LEES.
Finally, I would like to thank Ms. Alison Forbes for her patience, support, and assistance
with all things literary.
4
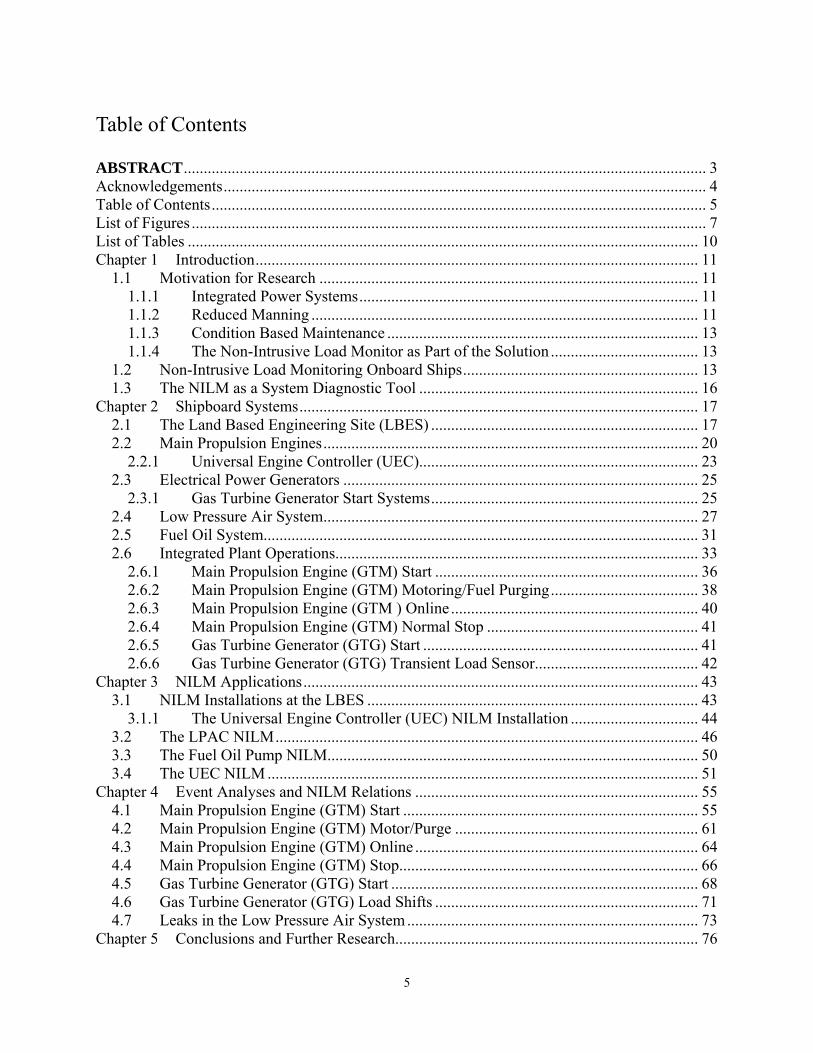
Table of Contents ABSTRACT................................................................................................................................... 3 Acknowledgements......................................................................................................................... 4 Table of Contents............................................................................................................................ 5 List of Figures ................................................................................................................................. 7 List of Tables ................................................................................................................................ 10 Chapter 1 Introduction............................................................................................................... 11
1.1 Motivation for Research ............................................................................................... 11 1.1.1 Integrated Power Systems..................................................................................... 11 1.1.2 Reduced Manning ................................................................................................. 11 1.1.3 Condition Based Maintenance .............................................................................. 13 1.1.4 The Non-Intrusive Load Monitor as Part of the Solution ..................................... 13
1.2 Non-Intrusive Load Monitoring Onboard Ships........................................................... 13 1.3 The NILM as a System Diagnostic Tool ...................................................................... 16
Chapter 2 Shipboard Systems.................................................................................................... 17 2.1 The Land Based Engineering Site (LBES) ................................................................... 17 2.2 Main Propulsion Engines.............................................................................................. 20
2.2.1 Universal Engine Controller (UEC)...................................................................... 23 2.3 Electrical Power Generators ......................................................................................... 25
2.3.1 Gas Turbine Generator Start Systems................................................................... 25 2.4 Low Pressure Air System.............................................................................................. 27 2.5 Fuel Oil System............................................................................................................. 31 2.6 Integrated Plant Operations........................................................................................... 33
2.6.1 Main Propulsion Engine (GTM) Start .................................................................. 36 2.6.2 Main Propulsion Engine (GTM) Motoring/Fuel Purging..................................... 38 2.6.3 Main Propulsion Engine (GTM ) Online .............................................................. 40 2.6.4 Main Propulsion Engine (GTM) Normal Stop ..................................................... 41 2.6.5 Gas Turbine Generator (GTG) Start ..................................................................... 41 2.6.6 Gas Turbine Generator (GTG) Transient Load Sensor......................................... 42
Chapter 3 NILM Applications................................................................................................... 43 3.1 NILM Installations at the LBES ................................................................................... 43
3.1.1 The Universal Engine Controller (UEC) NILM Installation ................................ 44 3.2 The LPAC NILM.......................................................................................................... 46 3.3 The Fuel Oil Pump NILM............................................................................................. 50 3.4 The UEC NILM ............................................................................................................ 51
Chapter 4 Event Analyses and NILM Relations ....................................................................... 55 4.1 Main Propulsion Engine (GTM) Start .......................................................................... 55 4.2 Main Propulsion Engine (GTM) Motor/Purge ............................................................. 61 4.3 Main Propulsion Engine (GTM) Online ....................................................................... 64 4.4 Main Propulsion Engine (GTM) Stop........................................................................... 66 4.5 Gas Turbine Generator (GTG) Start ............................................................................. 68 4.6 Gas Turbine Generator (GTG) Load Shifts .................................................................. 71 4.7 Leaks in the Low Pressure Air System......................................................................... 73
Chapter 5 Conclusions and Further Research............................................................................ 76
5

5.1 Detection ....................................................................................................................... 76 5.2 Diagnostics.................................................................................................................... 77 5.3 Future Research ............................................................................................................ 78
List of Acronyms .......................................................................................................................... 80 List of References ......................................................................................................................... 82 Appendix A. LBES Test Plan for Installment of UEC NILM on February 23, 2006 ........ 84 Appendix B. MATLAB Analysis Scripts............................................................................... 86 Appendix C. Daylong LPAC Load-Unload Interval Plots..................................................... 92 Appendix D. LBES System Schematics................................................................................. 97 Appendix E. LBES Points of Contact .................................................................................. 100
6
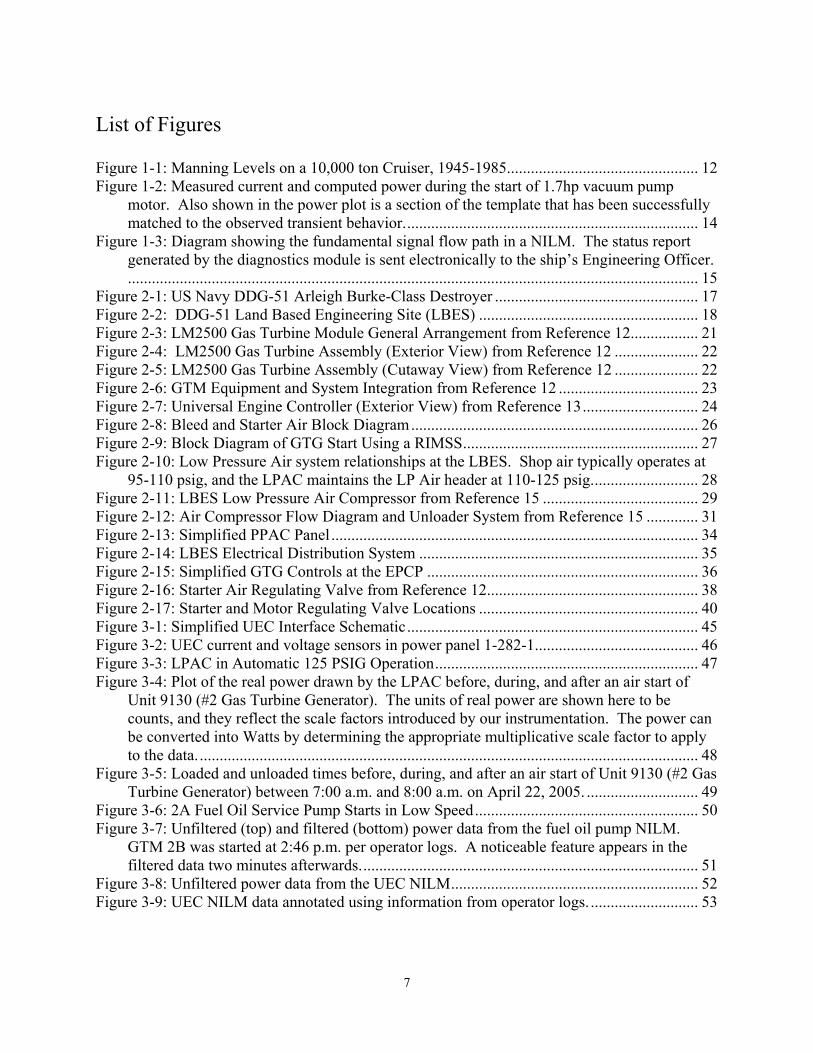
List of Figures Figure 1-1: Manning Levels on a 10,000 ton Cruiser, 1945-1985................................................ 12 Figure 1-2: Measured current and computed power during the start of 1.7hp vacuum pump
motor. Also shown in the power plot is a section of the template that has been successfully matched to the observed transient behavior.......................................................................... 14
Figure 1-3: Diagram showing the fundamental signal flow path in a NILM. The status report generated by the diagnostics module is sent electronically to the ship’s Engineering Officer................................................................................................................................................ 15
Figure 2-1: US Navy DDG-51 Arleigh Burke-Class Destroyer ................................................... 17 Figure 2-2: DDG-51 Land Based Engineering Site (LBES) ....................................................... 18 Figure 2-3: LM2500 Gas Turbine Module General Arrangement from Reference 12................. 21 Figure 2-4: LM2500 Gas Turbine Assembly (Exterior View) from Reference 12 ..................... 22 Figure 2-5: LM2500 Gas Turbine Assembly (Cutaway View) from Reference 12 ..................... 22 Figure 2-6: GTM Equipment and System Integration from Reference 12 ................................... 23 Figure 2-7: Universal Engine Controller (Exterior View) from Reference 13............................. 24 Figure 2-8: Bleed and Starter Air Block Diagram........................................................................ 26 Figure 2-9: Block Diagram of GTG Start Using a RIMSS........................................................... 27 Figure 2-10: Low Pressure Air system relationships at the LBES. Shop air typically operates at
95-110 psig, and the LPAC maintains the LP Air header at 110-125 psig........................... 28 Figure 2-11: LBES Low Pressure Air Compressor from Reference 15 ....................................... 29 Figure 2-12: Air Compressor Flow Diagram and Unloader System from Reference 15 ............. 31 Figure 2-13: Simplified PPAC Panel ............................................................................................ 34 Figure 2-14: LBES Electrical Distribution System ...................................................................... 35 Figure 2-15: Simplified GTG Controls at the EPCP .................................................................... 36 Figure 2-16: Starter Air Regulating Valve from Reference 12..................................................... 38 Figure 2-17: Starter and Motor Regulating Valve Locations ....................................................... 40 Figure 3-1: Simplified UEC Interface Schematic......................................................................... 45 Figure 3-2: UEC current and voltage sensors in power panel 1-282-1......................................... 46 Figure 3-3: LPAC in Automatic 125 PSIG Operation.................................................................. 47 Figure 3-4: Plot of the real power drawn by the LPAC before, during, and after an air start of
Unit 9130 (#2 Gas Turbine Generator). The units of real power are shown here to be counts, and they reflect the scale factors introduced by our instrumentation. The power can be converted into Watts by determining the appropriate multiplicative scale factor to apply to the data.............................................................................................................................. 48
Figure 3-5: Loaded and unloaded times before, during, and after an air start of Unit 9130 (#2 Gas Turbine Generator) between 7:00 a.m. and 8:00 a.m. on April 22, 2005. ............................ 49
Figure 3-6: 2A Fuel Oil Service Pump Starts in Low Speed........................................................ 50 Figure 3-7: Unfiltered (top) and filtered (bottom) power data from the fuel oil pump NILM.
GTM 2B was started at 2:46 p.m. per operator logs. A noticeable feature appears in the filtered data two minutes afterwards..................................................................................... 51
Figure 3-8: Unfiltered power data from the UEC NILM.............................................................. 52 Figure 3-9: UEC NILM data annotated using information from operator logs. ........................... 53
7
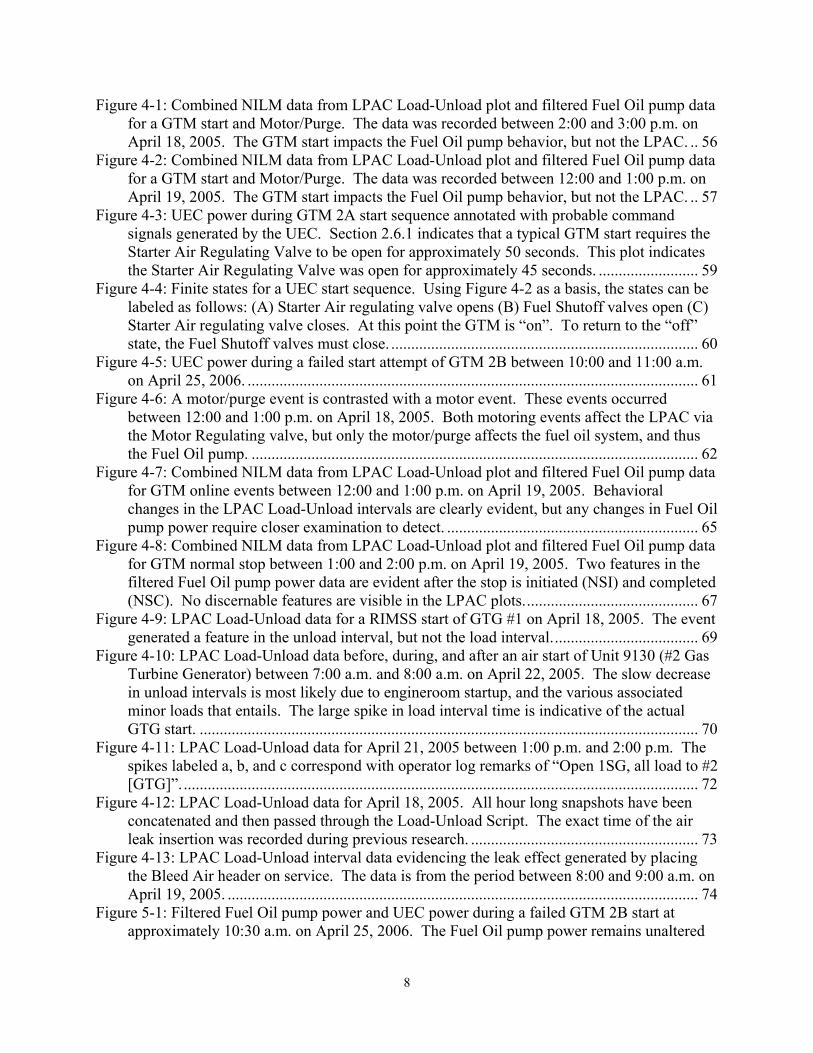
Figure 4-1: Combined NILM data from LPAC Load-Unload plot and filtered Fuel Oil pump data for a GTM start and Motor/Purge. The data was recorded between 2:00 and 3:00 p.m. on April 18, 2005. The GTM start impacts the Fuel Oil pump behavior, but not the LPAC. .. 56
Figure 4-2: Combined NILM data from LPAC Load-Unload plot and filtered Fuel Oil pump data for a GTM start and Motor/Purge. The data was recorded between 12:00 and 1:00 p.m. on April 19, 2005. The GTM start impacts the Fuel Oil pump behavior, but not the LPAC. .. 57
Figure 4-3: UEC power during GTM 2A start sequence annotated with probable command signals generated by the UEC. Section 2.6.1 indicates that a typical GTM start requires the Starter Air Regulating Valve to be open for approximately 50 seconds. This plot indicates the Starter Air Regulating Valve was open for approximately 45 seconds. ......................... 59
Figure 4-4: Finite states for a UEC start sequence. Using Figure 4-2 as a basis, the states can be labeled as follows: (A) Starter Air regulating valve opens (B) Fuel Shutoff valves open (C) Starter Air regulating valve closes. At this point the GTM is “on”. To return to the “off” state, the Fuel Shutoff valves must close. ............................................................................. 60
Figure 4-5: UEC power during a failed start attempt of GTM 2B between 10:00 and 11:00 a.m. on April 25, 2006. ................................................................................................................. 61
Figure 4-6: A motor/purge event is contrasted with a motor event. These events occurred between 12:00 and 1:00 p.m. on April 18, 2005. Both motoring events affect the LPAC via the Motor Regulating valve, but only the motor/purge affects the fuel oil system, and thus the Fuel Oil pump. ................................................................................................................ 62
Figure 4-7: Combined NILM data from LPAC Load-Unload plot and filtered Fuel Oil pump data for GTM online events between 12:00 and 1:00 p.m. on April 19, 2005. Behavioral changes in the LPAC Load-Unload intervals are clearly evident, but any changes in Fuel Oil pump power require closer examination to detect. ............................................................... 65
Figure 4-8: Combined NILM data from LPAC Load-Unload plot and filtered Fuel Oil pump data for GTM normal stop between 1:00 and 2:00 p.m. on April 19, 2005. Two features in the filtered Fuel Oil pump power data are evident after the stop is initiated (NSI) and completed (NSC). No discernable features are visible in the LPAC plots............................................ 67
Figure 4-9: LPAC Load-Unload data for a RIMSS start of GTG #1 on April 18, 2005. The event generated a feature in the unload interval, but not the load interval..................................... 69
Figure 4-10: LPAC Load-Unload data before, during, and after an air start of Unit 9130 (#2 Gas Turbine Generator) between 7:00 a.m. and 8:00 a.m. on April 22, 2005. The slow decrease in unload intervals is most likely due to engineroom startup, and the various associated minor loads that entails. The large spike in load interval time is indicative of the actual GTG start. ............................................................................................................................. 70
Figure 4-11: LPAC Load-Unload data for April 21, 2005 between 1:00 p.m. and 2:00 p.m. The spikes labeled a, b, and c correspond with operator log remarks of “Open 1SG, all load to #2 [GTG]”.................................................................................................................................. 72
Figure 4-12: LPAC Load-Unload data for April 18, 2005. All hour long snapshots have been concatenated and then passed through the Load-Unload Script. The exact time of the air leak insertion was recorded during previous research. ......................................................... 73
Figure 4-13: LPAC Load-Unload interval data evidencing the leak effect generated by placing the Bleed Air header on service. The data is from the period between 8:00 and 9:00 a.m. on April 19, 2005. ...................................................................................................................... 74
Figure 5-1: Filtered Fuel Oil pump power and UEC power during a failed GTM 2B start at approximately 10:30 a.m. on April 25, 2006. The Fuel Oil pump power remains unaltered
8

during the failed start. This may indicate a fault in the Fuel Oil system vice the UEC, SCU, etc.......................................................................................................................................... 78
9

List of Tables Table 2-1: LBES Equipment by Platform..................................................................................... 19 Table 2-2: LBES Main Control Stations....................................................................................... 20 Table 2-3: LM2500 Propulsion Gas Turbine Module .................................................................. 21 Table 2-4: Universal Engine Controller Data ............................................................................... 24 Table 2-5: Gas Turbine Generators at the LBES.......................................................................... 25 Table 2-6: Air Compressor Reference Data.................................................................................. 30 Table 2-7: Air Compressor Motor Reference Data....................................................................... 30 Table 2-8: Fuel Service Pump Reference Data............................................................................. 32 Table 2-9: Fuel Service Pump Motor Reference Data.................................................................. 32 Table 3-1: NILM Targets and Locations at the LBES.................................................................. 43 Table 3-2: NILM Configuration for LPAC .................................................................................. 44 Table 3-3: NILM Configuration for Fuel Oil Service Pump 2A .................................................. 44 Table 3-4: NILM Configuration for Universal Engine Controller ............................................... 46 Table 4-1: LPAC and Fuel Oil Pump Behavior due to GTM Starts............................................. 58 Table 4-2: LPAC and Fuel Oil Pump Behavior due to GTM Motor/Purges ................................ 63 Table 4-3: LPAC and Fuel Oil Pump Behavior due to GTM Motors .......................................... 63 Table 4-4: LPAC and Fuel Oil Pump Behavior due to GTM Online Sequences ......................... 66 Table 4-5: Fuel Oil Pump Behavior due to GTM Stop Sequences............................................... 68 Table 4-6: LPAC Load-Unload Behavior Due to GTG Starts...................................................... 71
10

Chapter 1 Introduction
1.1 Motivation for Research
1.1.1 Integrated Power Systems
In the past several decades, the United States Navy has pushed the designs of its ships
and associated subsystems, from propulsion to weapons, more and more into forms that require
increasingly large amounts of electrical power for usage. These increasingly electrified naval
loads in turn have directed the course of much naval research into better and more efficient ways
to generate and distribute this electrical power. The current solution to this problem for modern
naval vessels is an Integrated Power System (IPS). An Integrated Power System permits the
operator to distribute power between propulsion and other electrical loads as desired. This allows
for increased power available for non-propulsion uses, higher levels of automated control,
greater flexibility in arrangement of internal spaces, increased opportunity for modular design,
and the ability to distribute electrical power between subsystems on command [1].
Traditional ship engineering plant designs generate power for two basic purposes – main
propulsion engines that mechanically drive propeller shafts, and electrical generators. The
generators provide the necessary electrical power to operate the vast majority of equipment
onboard a vessel. As modern ship designs include more and more items with larger and larger
electrical requirements, and larger motor designs become more and more advanced, ships are
being designed with electric drives. This is a major keystone in the overall arch of benefits
provided by an IPS. With all power requirements onboard a vessel met by electrical generators,
naval vessels can now use this “pool of electricity” to conduct all necessary operations, both
combat and general service, via a switching architecture [1].
1.1.2 Reduced Manning
In 1995, the Chief of Naval Operations requested that the National Research Council’s
Naval Studies Board conduct an 18-month examination of the impact of technology on the form
and capability of the naval forces until the year 2035. A Panel on Human Resources was
convened to address specific issues of the overall inquiry. One of the topics of scrutiny for the
Panel on Human Resources was the idea of reducing the manning of ships at sea [2].
11
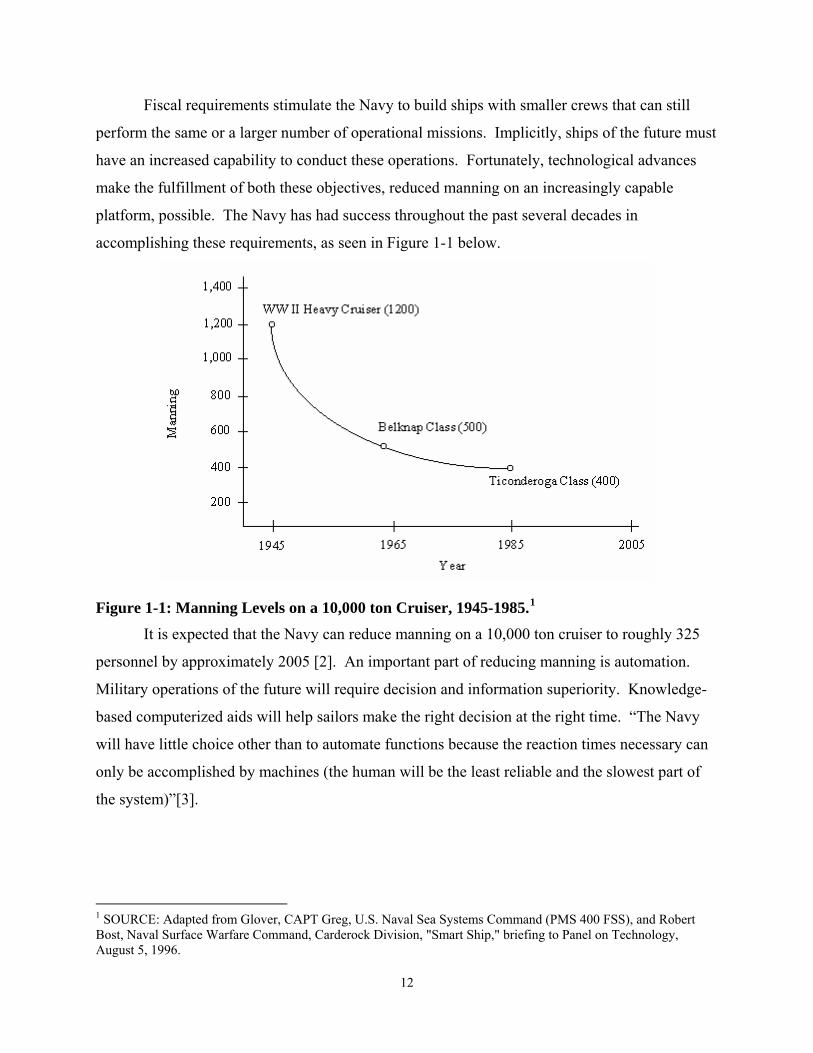
Fiscal requirements stimulate the Navy to build ships with smaller crews that can still
perform the same or a larger number of operational missions. Implicitly, ships of the future must
have an increased capability to conduct these operations. Fortunately, technological advances
make the fulfillment of both these objectives, reduced manning on an increasingly capable
platform, possible. The Navy has had success throughout the past several decades in
accomplishing these requirements, as seen in Figure 1-1 below.
Figure 1-1: Manning Levels on a 10,000 ton Cruiser, 1945-1985.1 It is expected that the Navy can reduce manning on a 10,000 ton cruiser to roughly 325
personnel by approximately 2005 [2]. An important part of reducing manning is automation.
Military operations of the future will require decision and information superiority. Knowledge-
based computerized aids will help sailors make the right decision at the right time. “The Navy
will have little choice other than to automate functions because the reaction times necessary can
only be accomplished by machines (the human will be the least reliable and the slowest part of
the system)”[3].
1 SOURCE: Adapted from Glover, CAPT Greg, U.S. Naval Sea Systems Command (PMS 400 FSS), and Robert Bost, Naval Surface Warfare Command, Carderock Division, "Smart Ship," briefing to Panel on Technology, August 5, 1996.
12

1.1.3 Condition Based Maintenance
The reduction in manpower onboard naval vessels is expected to require maintenance
providers to accelerate their repair processes and to enhance the reliability of the systems for
which they are responsible. To assist in this endeavor, the Navy has begun to shift its
maintenance policy from a Preventative Maintenance System (PMS) to one of Condition Based
Maintenance (CBM). In a preventative system, maintenance is performed at regular intervals to
help ensure that equipment does not fail by conducting repair, service, or component exchange.
In a condition based system, the need for maintenance is not determined strictly by schedule, but
by examining the equipment and making a determination if maintenance is required or not. This
type of system lends itself to the use of automation to assist in the examination of equipment [4].
The first step in this shift is the development and fielding of the Integrated Condition
Assessment System (ICAS) already in use on multiple vessels in the US fleet. ICAS is a
monitoring system that uses the CBM methodology to reduce the amount of preventative
maintenance operations required by the ship crews themselves while simultaneously providing
data to shore-based maintenance providers. The shore-based providers can then individually
tailor their maintenance plans to suit the needs of vessels. The success of this system depends
largely upon the reliable information gathered from individual sensors installed on the vessel’s
equipment.
1.1.4 The Non-Intrusive Load Monitor as Part of the Solution
As a result of the above considerations, a possible solution to part of this combined need
is the Non-Intrusive Load Monitor (NILM), which is a device that can determine the operating
schedule of all of the major loads on an electrical service. The main utility of the NILM is that it
can use its electrical measurements to assess the state of many electromechanical loads.
Additionally, the NILM can perform numerous supervisory control functions [5], [6], [7].
1.2 Non-Intrusive Load Monitoring Onboard Ships
The Non-Intrusive Load Monitor (NILM) was developed at the Massachusetts Institute of
Technology (MIT) Laboratory for Electromagnetic and Electronic Systems (LEES). The NILM
uses the voltage and current supplied to the target item to calculate power envelopes for that
item. These envelopes are time-varying estimates of frequency content and have been used for
13
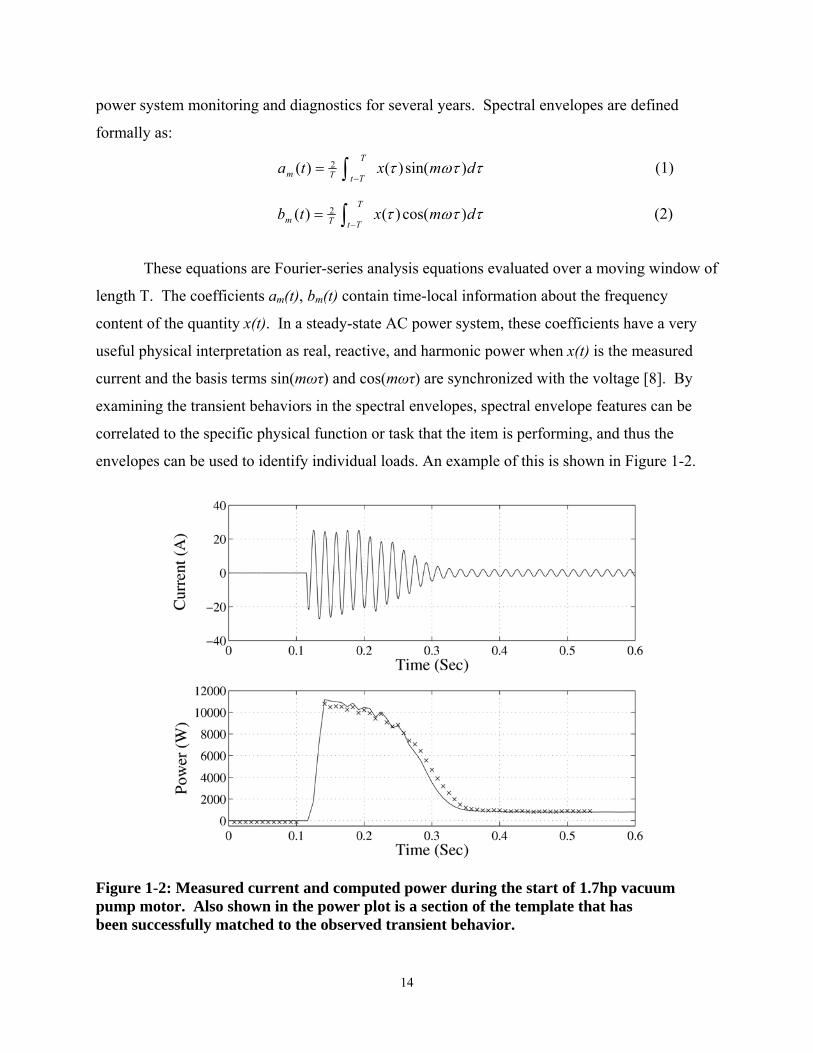
power system monitoring and diagnostics for several years. Spectral envelopes are defined
formally as:
∫ −=
T
TtTm dmxta τωττ )sin()()( 2 (1)
∫ −=
T
TtTm dmxtb τωττ )cos()()( 2 (2)
These equations are Fourier-series analysis equations evaluated over a moving window of
length T. The coefficients am(t), bm(t) contain time-local information about the frequency
content of the quantity x(t). In a steady-state AC power system, these coefficients have a very
useful physical interpretation as real, reactive, and harmonic power when x(t) is the measured
current and the basis terms sin(mωτ) and cos(mωτ) are synchronized with the voltage [8]. By
examining the transient behaviors in the spectral envelopes, spectral envelope features can be
correlated to the specific physical function or task that the item is performing, and thus the
envelopes can be used to identify individual loads. An example of this is shown in Figure 1-2.
Figure 1-2: Measured current and computed power during the start of 1.7hp vacuum pump motor. Also shown in the power plot is a section of the template that has been successfully matched to the observed transient behavior.
14
Placement of a NILM at an aggregate location allows for analysis of multiple transients,
and thus can “fingerprint” multiple loads. The NILM, installed in only a single point at an
upstream feed, can detect and classify multiple loads downstream of the feed, such as lights and
motors [9], [10]. When installed in an automobile, the NILM can identify the use of
electromechanical equipment from measurements made at the alternator alone [11].
The NILM can be easily adapted for shipboard uses. The NILM itself is constructed of a
relatively few, commercially available components, thus making it very inexpensive. Because it
has the potential to differentiate and diagnose multiple loads downstream of the entry point, it
can reduce the number of sensors required in a system. Fuel oil pumps, air compressors, sewage
pumps, reverse osmosis plants and seawater pumps have all been targeted by NILM’s [5-7]. The
diagnosis of these systems via the NILM has yielded encouraging results. The NILM has had
success as a detector for the state or status of various electrical loads (pump on/off, etc.). An
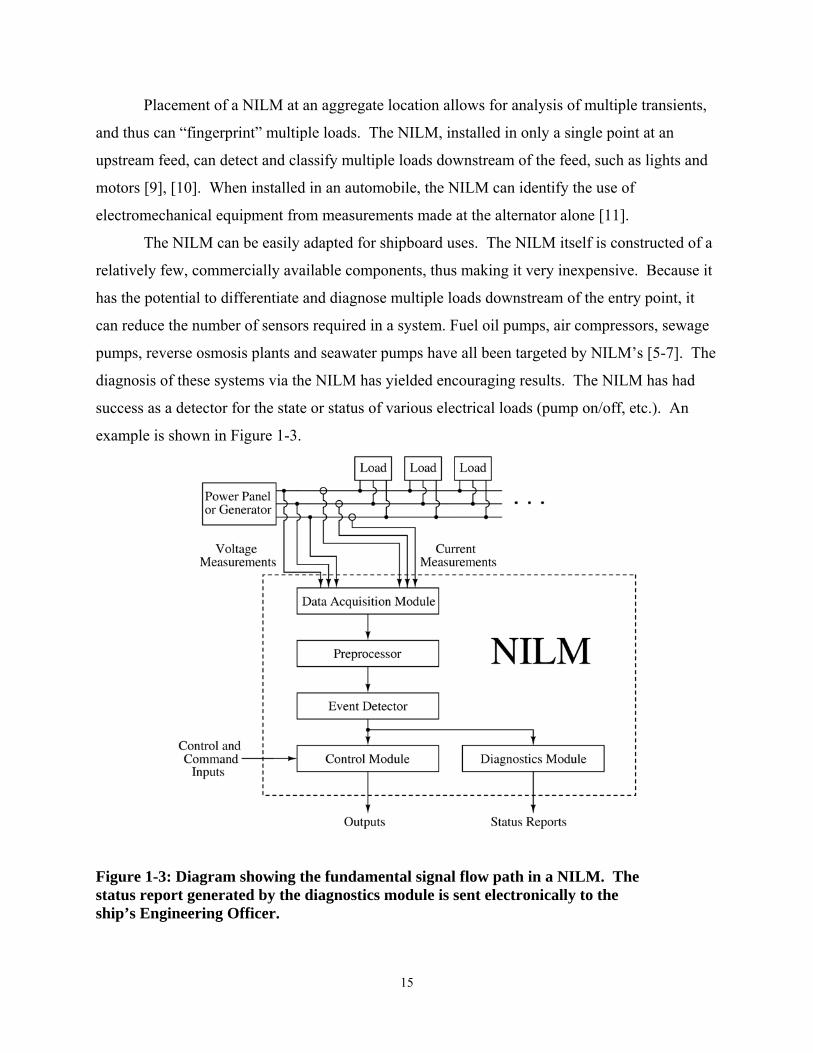
example is shown in Figure 1-3.
Figure 1-3: Diagram showing the fundamental signal flow path in a NILM. The status report generated by the diagnostics module is sent electronically to the ship’s Engineering Officer.
15

1.3 The NILM as a System Diagnostic Tool
The capability of a NILM should not be limited simply to determining the on/off status of
various electrical loads however. Additional diagnosis and analysis of status changes among
targeted electrical loads yields even more information about their combined operation and can be
utilized to detect the status or condition of not just individual components and loads, but an
entire system, such as leaks in a sewage piping and components [6], [16].
This thesis will explore the capability of a NILM to act as a diagnostic tool of integrated
systems in a naval engineering plant. Three NILM’s installed in the US Navy’s DDG-51
engineering test site in Philadelphia, Pennsylvania were used to diagnose and to determine state
changes of various large shipboard components. Through a relative few entry points in
components in the engineering plant, the capability may exist to determine status of systems
mechanically connected to the NILM-targeted equipment, but with no direct electrical
connections.
16
Chapter 2 Shipboard Systems
Currently, several NILM devices are installed at the Navy’s DDG-51 Land Based
Engineering Site (LBES) located at the Navy’s Surface Ship Engineering Complex in
Philadelphia, Pennsylvania. Using these devices, testing and development of a NILM can be
conducted in an environment that very much approximates an actual ship.
2.1 The Land Based Engineering Site (LBES)
The LBES, which is housed in a former naval aircraft assembly building, consists of a
full-scale replica of part of the engineering plant of a DDG-51 class destroyer (Figure 2-1 and
Figure 2-2). This facility is primarily used as a testing and evaluation platform for new
equipment and software, and it is also used to conduct routine crew training certifications [5].
Effectively, the LBES provides both engineering support and overall life cycle management for
in-service US Navy destroyers.
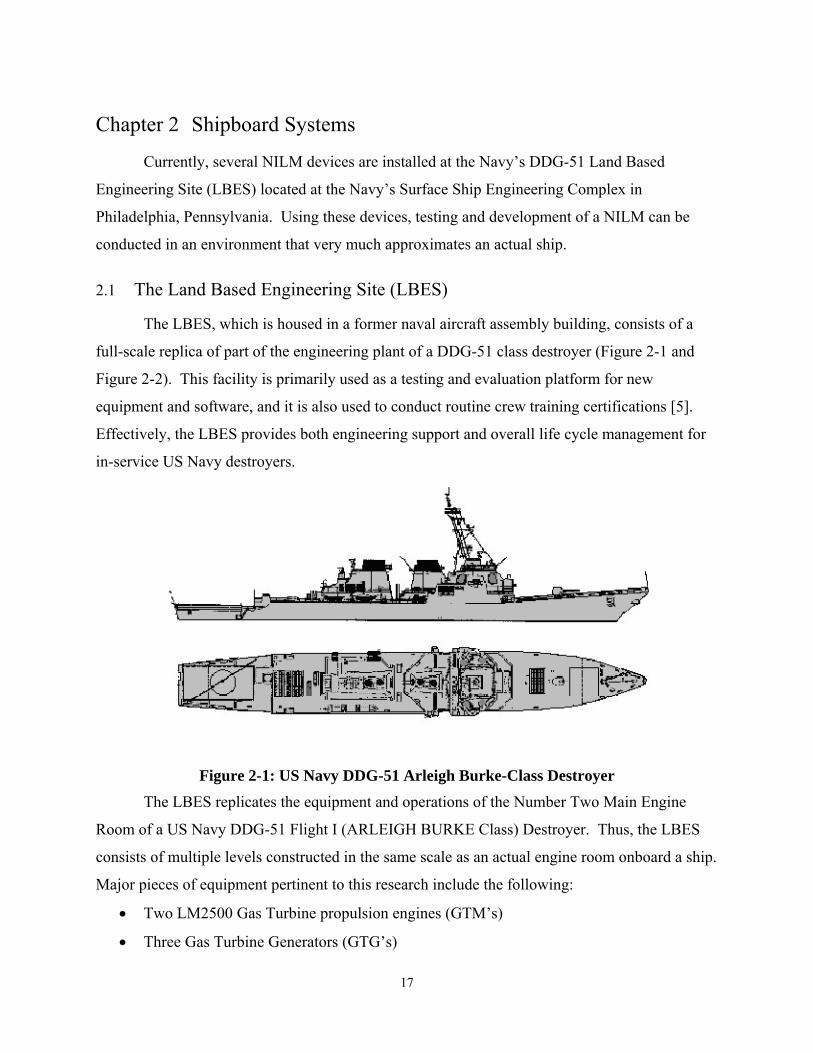
Figure 2-1: US Navy DDG-51 Arleigh Burke-Class Destroyer The LBES replicates the equipment and operations of the Number Two Main Engine
Room of a US Navy DDG-51 Flight I (ARLEIGH BURKE Class) Destroyer. Thus, the LBES
consists of multiple levels constructed in the same scale as an actual engine room onboard a ship.
Major pieces of equipment pertinent to this research include the following:
• Two LM2500 Gas Turbine propulsion engines (GTM’s)
• Three Gas Turbine Generators (GTG’s)
17
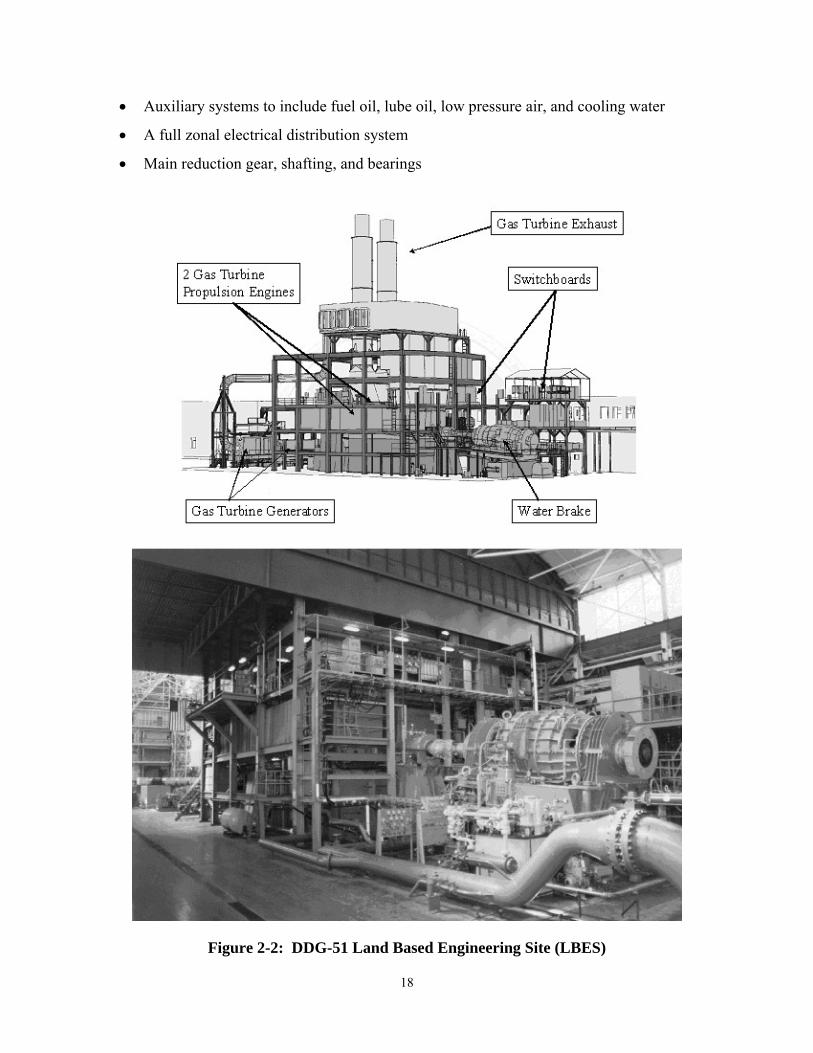
• Auxiliary systems to include fuel oil, lube oil, low pressure air, and cooling water
• A full zonal electrical distribution system
• Main reduction gear, shafting, and bearings
Figure 2-2: DDG-51 Land Based Engineering Site (LBES)
18

There are several notable differences between the LBES and a typical DDG-51
engineering plant. For instance, A DDG-51 class destroyer has four propulsion engines and two
shafts. By contrast, the LBES supports two engines and one shaft. Due to its land-based nature,
the LBES has no propeller mounted on the end of its shaft; instead, a 50,000 horsepower
waterbrake provides the necessary mechanical load. For electrical power, the LBES is supplied
by a regional utility, thus preventing the facility from needing to obtain all of its electricity from
its own GTG’s. Also, any shipboard systems that normally rely on seawater for cooling instead
use shore-based fresh water. Additionally, high pressure air systems are not in place at the
LBES. Various habitability and support systems are likewise non-existent at LBES, such as
refrigeration, sewage, fire main, etc.
The LBES is arranged on five platforms. The platform names and the major features on
these platforms are indicated in Table 2-1. Remaining auxiliary and support features (e.g.
piping, cabling, etc.) are distributed among the platforms.
Table 2-1: LBES Equipment by Platform
Platform Name Major Features and Equipment
Ground Level (or Pad Level) Waste Oil Collection and #1 and #3 GTG’s
7-foot Level Fuel and Lube Oil Pumps
14-foot Level Both GTM’s, #2 GTG, Air Compressors
23-foot Level Shaft and Propulsion Control Station
32-foot Level Major Switchboards and Breakers
Control stations at the LBES are established in various locations. Central Control, which
is located inside the LBES administrative building, contains control stations for the electric
distribution system (e.g. the Electric Plant Control Panel (EPCP)) and the main propulsion
system (e.g. the Propulsion Plant and Auxiliaries Control Panel (PPAC)). The features provided
at these two stations allow operators to control the GTM’s, the GTG’s, the main electrical
distribution breakers, and the waterbrake system. Additionally, the EPCP and PPAC indicate the
status of many other systems throughout the LBES. In the LBES plant itself, a Shaft Control
Unit (SCU) is located on the 23-Foot Level. Although this station allows control of only the
GTM’s and the waterbrake, it still indicates the status of all of the same sensors and systems as
the PPAC. The SCU does not allow an operator to control the GTG’s or any other electrical
19

distribution system equipment. Finally, each GTG has a Full Authority Digital Control
(FADAC) unit, which is a touch-screen panel located on the exterior of the turbine module. This
allows a local operator to perform control functions for the GTG itself, but not any other
electrical distribution system equipment. A summation of this control equipment is indicated in
Table 2-2.
Table 2-2: LBES Main Control Stations
Control Station Function Location
Propulsion Plant and
Auxiliaries Control (PPAC)
Control and indications for both GTM’s Central Control
Electric Plant Control Panel
(EPCP)
Control and indications for the electrical
distribution system, associated breakers, and
all GTG’s
Central Control
Shaft Control Unit Control and Indications for both GTM’s 23-Foot Level
Full Authority Digital Control
Units (FADAC’s)
Control and indication for individual GTG At each GTG
2.2 Main Propulsion Engines
The DDG-51 LBES houses two General Electric LM2500 Propulsion Gas Turbine
Modules (GTM’s). Some basic specifications for the LM2500 Propulsion GTM’s are given in
Table 2-3. The primary purpose of these GTM’s is to generate mechanical power and to transmit
it through a high speed flexible coupling shaft (HSCS) to the LBES’s main reduction gearbox
(MRG) and shaft [12]. As shown in Figure 2-3, the GTM’s at the DDG-51 LBES include four
major components. These components are the following:
• The Base Enclosure Assembly (BEA)
• Gas Turbine Assembly (GTA)
• Lube Oil Storage and Conditioning Assembly etc
• Interim Integrated Electronic Control (replaced by a Universal Engine Controller at the
LBES)
20
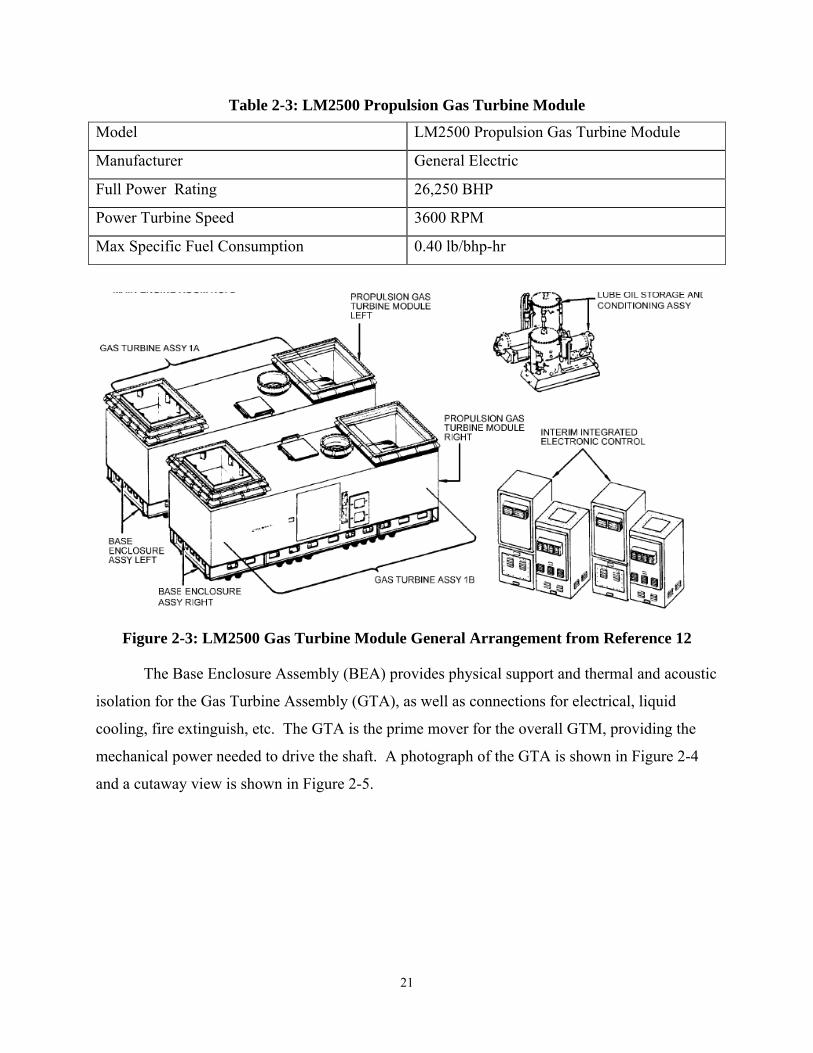
Table 2-3: LM2500 Propulsion Gas Turbine Module
Model LM2500 Propulsion Gas Turbine Module
Manufacturer General Electric
Full Power Rating 26,250 BHP
Power Turbine Speed 3600 RPM
Max Specific Fuel Consumption 0.40 lb/bhp-hr
Figure 2-3: LM2500 Gas Turbine Module General Arrangement from Reference 12
The Base Enclosure Assembly (BEA) provides physical support and thermal and acoustic
isolation for the Gas Turbine Assembly (GTA), as well as connections for electrical, liquid
cooling, fire extinguish, etc. The GTA is the prime mover for the overall GTM, providing the
mechanical power needed to drive the shaft. A photograph of the GTA is shown in Figure 2-4
and a cutaway view is shown in Figure 2-5.
21
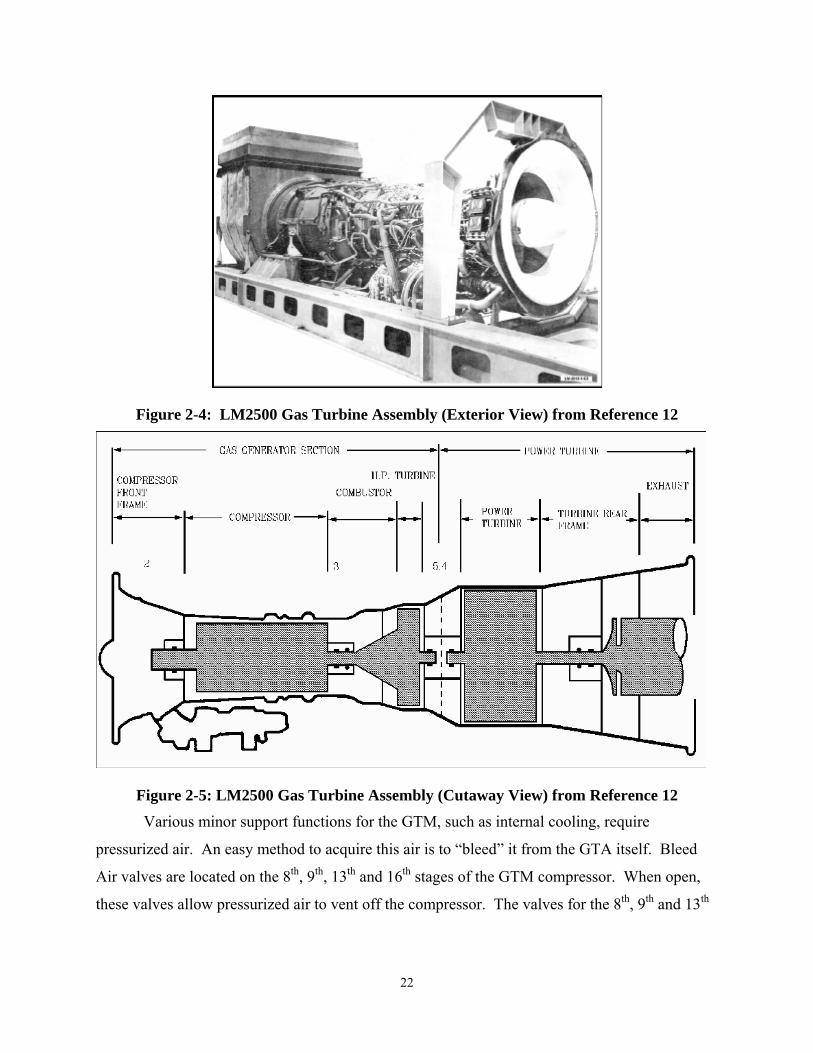
Figure 2-4: LM2500 Gas Turbine Assembly (Exterior View) from Reference 12
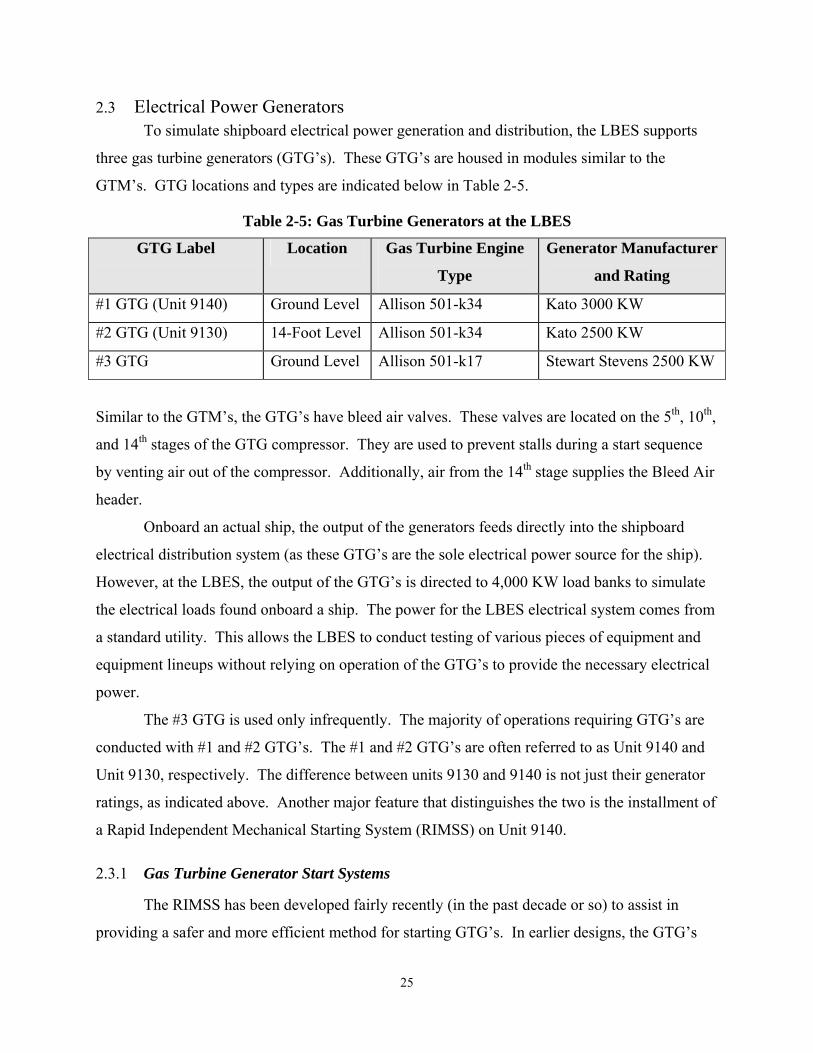
Figure 2-5: LM2500 Gas Turbine Assembly (Cutaway View) from Reference 12 Various minor support functions for the GTM, such as internal cooling, require
pressurized air. An easy method to acquire this air is to “bleed” it from the GTA itself. Bleed
Air valves are located on the 8th, 9th, 13th and 16th stages of the GTM compressor. When open,
these valves allow pressurized air to vent off the compressor. The valves for the 8th, 9th and 13th
22

stages supply air for use inside the GTM. Air from the 16th stage can be directed to the Bleed
Air header.
The Lube Oil Storage and Conditioning Assembly (LOSCA) provides cooled lube oil for
proper operation of the GTA. The Universal Engine Controller (UEC) replaces the Interim
Integrated Electronic Control at the LBES, yet still performs the same functions as the Interim
Integrated Electronic Control. The UEC provides command, control, status, protection, alarm
and test features for the GTM’s. An example of how these items are integrated physically and
functionally is shown below in Figure 2-6.
Figure 2-6: GTM Equipment and System Integration from Reference 12
As indicated above in Figure 2-6, two LM2500 GTM’s provide power for one shaft. The LBES,
because it is designed to replicate Engine Room Number Two on an actual ship, refers to its two
GTM’s as “2A” and “2B”. They are arranged at the LBES on the 14-Foot Level as indicated
above (i.e., side by side).
2.2.1 Universal Engine Controller (UEC)
The UEC is essentially the “nervous system” for the GTM. As noted above, each GTM
has its own UEC. The UEC provides the appropriate interfaces to monitor and control each
23

LM2500 GTM from a single location (see Figure 2-7). Using information provided from the
numerous sensors that monitor the status of the engine, the UEC can automatically control the
application of starter air, ignition power, and fuel. The UEC interfaces with the Shaft Control
Unit (SCU) in order to provide real-time engine status information and to accept operator input
commands [13].
The UEC receives 115VAC power (both single phase and 3-phase) from the LBES power
distribution system. A power module inside the unit converts the 3-phase AC input into various
AC and DC voltages. These output busses provide power to several key actuators associated
with the GTM, including the igniter and many solenoid-controlled valves. For example, a 28V
DC bus generated by the UEC’s power module is used to operate various solenoids in the GTM
system. The key bus voltages in the UEC are given in Table 2-4.
Table 2-4: Universal Engine Controller Data
Manufacturer Lockheed Martin
Primary Input Power Source 115VAC, 60 Hz, 3-phase
Internal Power Supplies +5VDC, ±15VDC, +28VDC
Figure 2-7: Universal Engine Controller (Exterior View) from Reference 13
24
2.3 Electrical Power Generators To simulate shipboard electrical power generation and distribution, the LBES supports
three gas turbine generators (GTG’s). These GTG’s are housed in modules similar to the
GTM’s. GTG locations and types are indicated below in Table 2-5.
Table 2-5: Gas Turbine Generators at the LBES
GTG Label Location Gas Turbine Engine
Type
Generator Manufacturer
and Rating
#1 GTG (Unit 9140) Ground Level Allison 501-k34 Kato 3000 KW
#2 GTG (Unit 9130) 14-Foot Level Allison 501-k34 Kato 2500 KW
#3 GTG Ground Level Allison 501-k17 Stewart Stevens 2500 KW
Similar to the GTM’s, the GTG’s have bleed air valves. These valves are located on the 5th, 10th,
and 14th stages of the GTG compressor. They are used to prevent stalls during a start sequence
by venting air out of the compressor. Additionally, air from the 14th stage supplies the Bleed Air
header.
Onboard an actual ship, the output of the generators feeds directly into the shipboard
electrical distribution system (as these GTG’s are the sole electrical power source for the ship).
However, at the LBES, the output of the GTG’s is directed to 4,000 KW load banks to simulate
the electrical loads found onboard a ship. The power for the LBES electrical system comes from
a standard utility. This allows the LBES to conduct testing of various pieces of equipment and
equipment lineups without relying on operation of the GTG’s to provide the necessary electrical
power.
The #3 GTG is used only infrequently. The majority of operations requiring GTG’s are
conducted with #1 and #2 GTG’s. The #1 and #2 GTG’s are often referred to as Unit 9140 and
Unit 9130, respectively. The difference between units 9130 and 9140 is not just their generator
ratings, as indicated above. Another major feature that distinguishes the two is the installment of
a Rapid Independent Mechanical Starting System (RIMSS) on Unit 9140.
2.3.1 Gas Turbine Generator Start Systems
The RIMSS has been developed fairly recently (in the past decade or so) to assist in
providing a safer and more efficient method for starting GTG’s. In earlier designs, the GTG’s
25

and GTM’s are both started using a “Start Air” system that supplies pressurized air at
approximately 75 psig to motor and start the GTG’s and GTM’s. This start air is supplied from
cooled bleed air, which in turn is supplied via Bleed Air valves on the GTM’s and GTG’s, as
shown in Figure 2-8. As discussed above, the valves that supply the Bleed Air header are
located on the 16th stage for GTM’s and on the 14th stage for GTG’s. If no turbines (either
GTG’s or GTM’s) are in operation to provide this air, then start air is supplied by an Auxiliary
Power Unit (APU) located above each GTG module [14]. The APU is a miniature gas turbine
engine whose pressurized gas output is directed to the bleed air header.
APU
GTG’s
GTM’s
Moisture Separator
Start Air Filter
Bleed Air Header
Start Air Header
Figure 2-8: Bleed and Starter Air Block Diagram
For overall reliability and increased efficiency, it was decided to remove the requirement
for the GTG’s to use air to start. Thus, the RIMSS was designed. The RIMSS consists of a
small gas turbine engine housed within the GTG module. The power to start the RIMSS is
supplied by a DC voltage source, and the mechanical output of this RIMSS engine is linked to
the shaft of the GTG engine, as shown in Figure 2-9. At the LBES, this DC voltage source is a
battery supply located outside the Unit 9140 module. Upon starting a GTG with the RIMSS, the
operating GTG in turn supplies bleed air that can be used to start all other gas turbine engines
(GTG’s and GTM’s). The advantage of the RIMSS lies in its independence from an air system
26
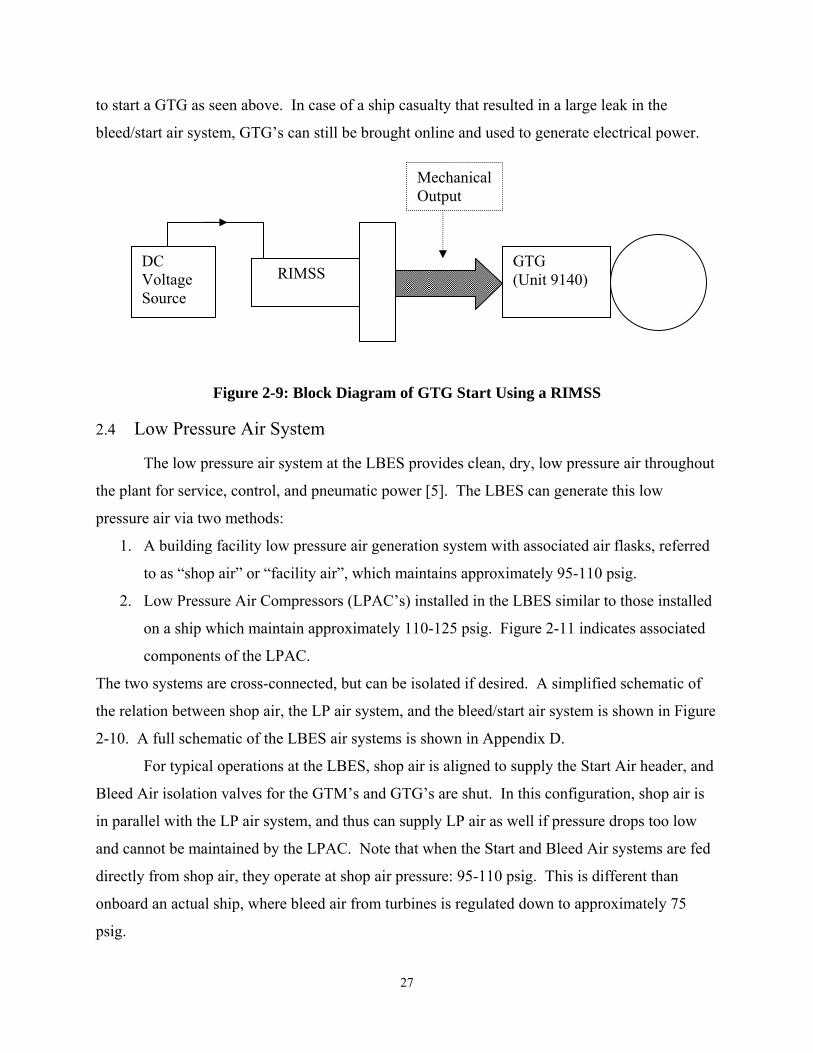
to start a GTG as seen above. In case of a ship casualty that resulted in a large leak in the
bleed/start air system, GTG’s can still be brought online and used to generate electrical power.
DC Voltage Source
RIMSS GTG (Unit 9140)
Mechanical Output
Figure 2-9: Block Diagram of GTG Start Using a RIMSS
2.4 Low Pressure Air System
The low pressure air system at the LBES provides clean, dry, low pressure air throughout
the plant for service, control, and pneumatic power [5]. The LBES can generate this low
pressure air via two methods:
1. A building facility low pressure air generation system with associated air flasks, referred
to as “shop air” or “facility air”, which maintains approximately 95-110 psig.
2. Low Pressure Air Compressors (LPAC’s) installed in the LBES similar to those installed
on a ship which maintain approximately 110-125 psig. Figure 2-11 indicates associated
components of the LPAC.
The two systems are cross-connected, but can be isolated if desired. A simplified schematic of
the relation between shop air, the LP air system, and the bleed/start air system is shown in Figure
2-10. A full schematic of the LBES air systems is shown in Appendix D.
For typical operations at the LBES, shop air is aligned to supply the Start Air header, and
Bleed Air isolation valves for the GTM’s and GTG’s are shut. In this configuration, shop air is
in parallel with the LP air system, and thus can supply LP air as well if pressure drops too low
and cannot be maintained by the LPAC. Note that when the Start and Bleed Air systems are fed
directly from shop air, they operate at shop air pressure: 95-110 psig. This is different than
onboard an actual ship, where bleed air from turbines is regulated down to approximately 75
psig.
27

LP Air Header
LPAC
Shop Air
Bleed Air Header
Start Air Header
GTM
GTG
Check valve
Check valve
Figure 2-10: Low Pressure Air system relationships at the LBES. Shop air typically operates at 95-110 psig, and the LPAC maintains the LP Air header at 110-125 psig.
When shop air is isolated, the Bleed Air isolation valves are opened and Bleed Air
regulating valves maintain Bleed Air header pressure at 75 psig. The Bleed Air header then
provides start air as discussed in Section 2.3.1 above. Note that due to check valves, the LP air
system cannot supply the Bleed/Start Air system, and the Bleed/Start Air system cannot supply
the LP air system.
There exists a subsystem of the LP air system termed “control air”. Control air is used to
provide pneumatic power to operate various valves throughout the LBES. The specific
components of interest in this thesis that use control air are:
• GTM Bleed Air regulating valves
• GTG Bleed Air regulating valves
• GTM Motor regulating valve (to be discussed in Section 2.6.2)
28
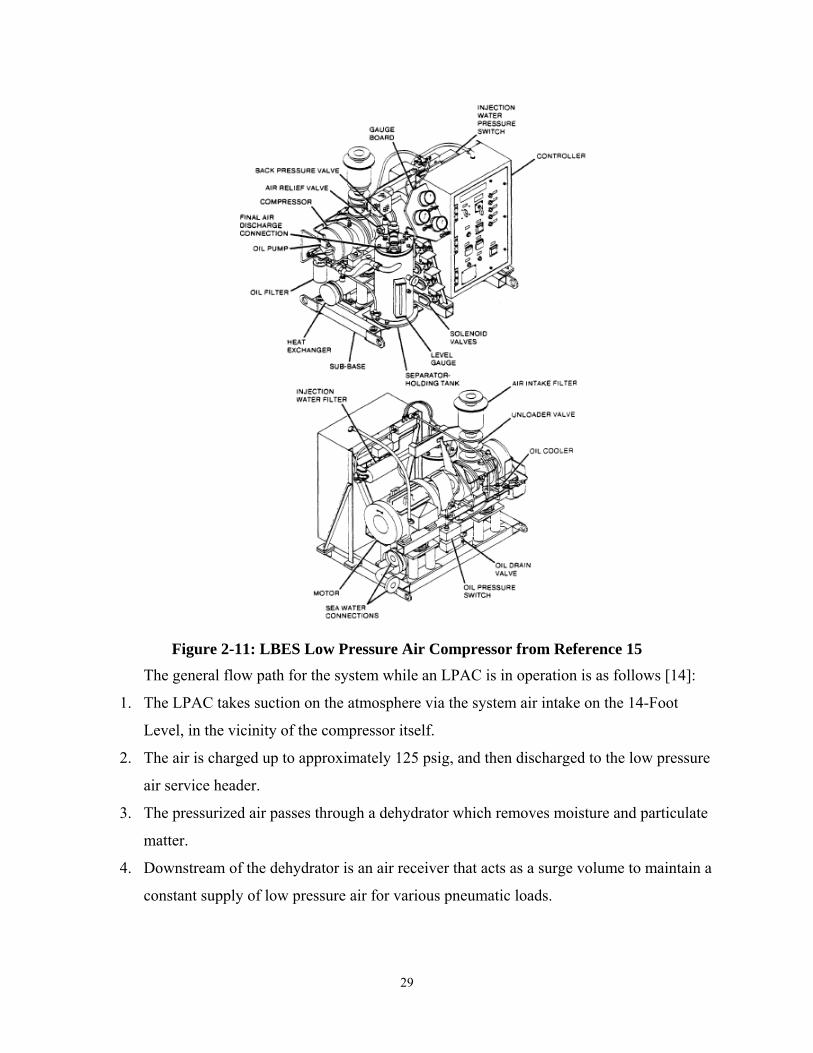
Figure 2-11: LBES Low Pressure Air Compressor from Reference 15 The general flow path for the system while an LPAC is in operation is as follows [14]:
1. The LPAC takes suction on the atmosphere via the system air intake on the 14-Foot
Level, in the vicinity of the compressor itself.
2. The air is charged up to approximately 125 psig, and then discharged to the low pressure
air service header.
3. The pressurized air passes through a dehydrator which removes moisture and particulate
matter.
4. Downstream of the dehydrator is an air receiver that acts as a surge volume to maintain a
constant supply of low pressure air for various pneumatic loads.
29

Reference data for the compressor and its associated motor are listed below in Table 2-6 and
Table 2-7 [15].
Table 2-6: Air Compressor Reference Data
Nomenclature Low Pressure Air Compressor
Model NAXI 100-4A
Manufacturer Ingersoll-Rand
Inlet Capacity 100 CFM
Discharge Pressure Settings 115/120/125
Brake Horsepower 28.8 Maximum
Motor Speed 3600 rpm
Table 2-7: Air Compressor Motor Reference Data
Power Requirements 440V, 3-phase, 60 Hz, 35A Full Load
Horsepower 35
Rotor Squirrel Cage
Speed Class Constant
RPM Synchronous 3600
RPM Full Load 3535
Torque Class Design B
Current Class Design B
Typically, when testing requires the use of an LPAC, only one of the two installed is
actually operated. The LPAC is set to automatically maintain header pressure between 110 and
125 psig in the following manner [15]:
1. With the discharge pressure selector switch set to “AUTOMATIC-125 PSIG”, the
ON/OFF selector is placed in ON.
2. When compressor discharge pressure reaches 125 psig, the compressor will be
automatically unloaded by a combination of throttling the air intake and redirecting
compressed air from the compressor discharge back to the intake as follows (see Figure
2-12 below):
30

a. When the compressor discharge pressure reaches 125 PSIG, the discharge
pressure switch actuates the solenoid-operated unloader valve. The solenoid
valve opens to recycle discharge air through a bypass line back to the compressor
inlet to prevent the continued build-up of pressure in the air receiver.
b. The opening of the solenoid valve also applies discharge air pressure to the air
cylinder operator. The air cylinder piston extends to mechanically shut the
butterfly valve located in the compressor intake pipe. Shutting off the air intake
to the compressor effectively unloads the unit.
3. The compressor will operate for 10 minutes unloaded and then automatically shut down.
4. When discharge pressure drops below 110 psig, the compressor will automatically be
reloaded if the unit is operating unloaded or automatically be restarted and loaded if the
unit is shut down.
Figure 2-12: Air Compressor Flow Diagram and Unloader System from Reference 15
2.5 Fuel Oil System
The DDG-51 Fuel Oil System installed at the LBES is designed to deliver clean and
filtered fuel oil to the GTM’s and GTG’s at the proper pressures and temperatures. A full
schematic of the LBES fuel oil system is shown in Appendix D. The general flow path for the
system is as follows [14]:
1. The Fuel Oil Pumps take suction on the 5000 gallon Fuel Service Tank and discharge to
the fuel supply header.
31
2. A pneumatic pilot operated fuel oil unloader valve located downstream of the pump
discharge maintains a supply header pressure of 35 psig by sending fuel back through a
recirculation line to the Service Tank.
3. Fuel passes through a heater and pre-filters to remove sediment and filter/separators to
remove water from the fuel.
4. Fuel is then supplied to the GTM’s and the Fuel Oil Gravity Feed Tank. This Gravity
Feed Tank supplies the fuel for the GTG’s, and any overflow from the Gravity Feed Tank
is directed to the fuel oil return header and back to the Service Tank.
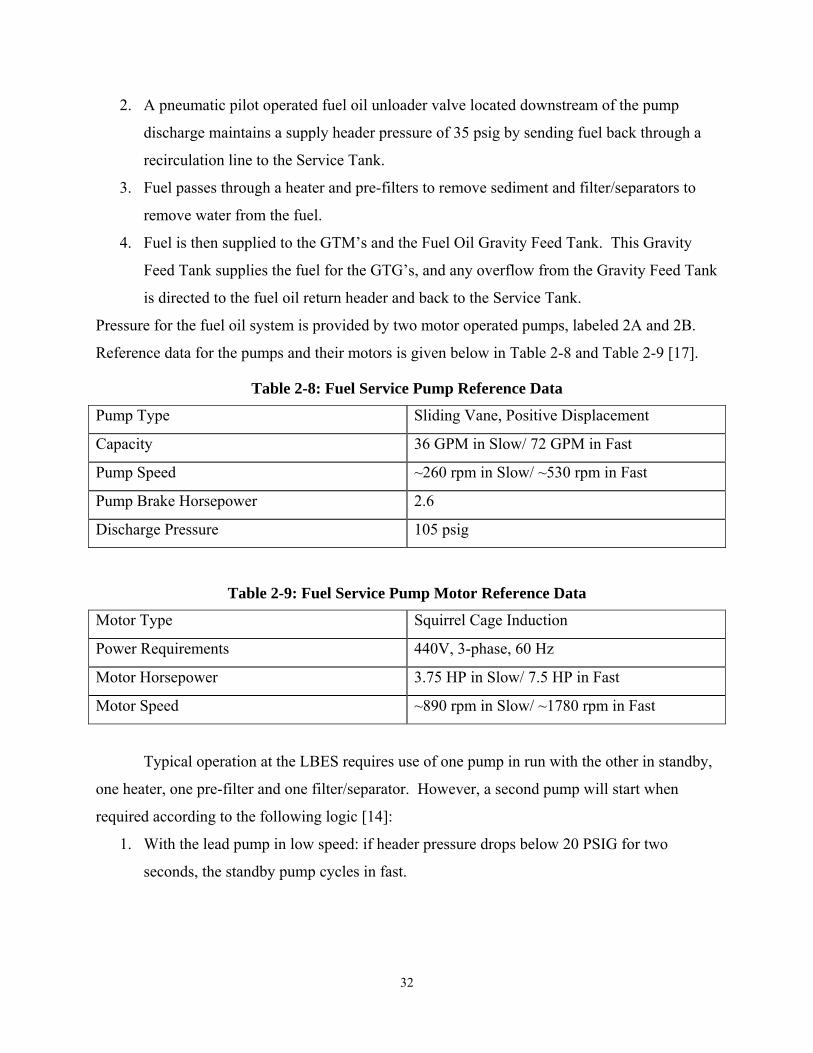
Pressure for the fuel oil system is provided by two motor operated pumps, labeled 2A and 2B.
Reference data for the pumps and their motors is given below in Table 2-8 and Table 2-9 [17].
Table 2-8: Fuel Service Pump Reference Data
Pump Type Sliding Vane, Positive Displacement
Capacity 36 GPM in Slow/ 72 GPM in Fast
Pump Speed ~260 rpm in Slow/ ~530 rpm in Fast
Pump Brake Horsepower 2.6
Discharge Pressure 105 psig
Table 2-9: Fuel Service Pump Motor Reference Data
Motor Type Squirrel Cage Induction
Power Requirements 440V, 3-phase, 60 Hz
Motor Horsepower 3.75 HP in Slow/ 7.5 HP in Fast
Motor Speed ~890 rpm in Slow/ ~1780 rpm in Fast
Typical operation at the LBES requires use of one pump in run with the other in standby,
one heater, one pre-filter and one filter/separator. However, a second pump will start when
required according to the following logic [14]:
1. With the lead pump in low speed: if header pressure drops below 20 PSIG for two
seconds, the standby pump cycles in fast.
32

2. With pump(s) in high: if header pressure does not recover, or stays below 20 PSIG for 5
seconds, both pumps are commanded to off (this is to remove the pressure source in case
of a fuel oil rupture).
3. With pumps in local control, pump logic is disabled.
2.6 Integrated Plant Operations
A naval engineering plant consists of multiple systems, many of which are connected
either mechanically, electrically, or both. The main systems of concern for this thesis are listed
above. To detect various events that occur in the plant, it is useful to get an understanding of the
specific relations and interactions that take place between these systems during certain
operations. The specific operations of interest in this thesis are:
• Main Propulsion Engine (GTM) start (i.e. the engine is started but not used to provide
propulsion power)
• Main Propulsion Engine (GTM) being placed online (i.e. the engine provides propulsion
power to the main reduction gear and shafting)
• Main Propulsion Engine (GTM) motoring (the turbine is spun with air and fuel may be
purged)
• Main Propulsion Engine (GTM) normal stop
• Gas Turbine Generator (GTG) start
As stated above in Section 2.1, there are two main locations to control the GTM’s: in
Central Control with the Propulsion Plant and Auxiliaries Control panel (PPAC) and on the 23-
Foot Level at the Shaft Control Unit (SCU) panel. Both panels are almost identical. Commands
to the GTM’s are performed by pressing illuminated buttons to initiate certain sequences (start,
stop, motor, online, fuel purge, etc.) or by adjusting a throttle lever to answer propulsion
demands (“bell orders”). In addition, various indications and alarm lights are displayed at the
two panels. A simplified diagram of the control buttons is indicated below in Figure 2-13. The
dashed boxes indicate labels, and not actual buttons. The solid boxes indicate actual buttons on
the SCU or PPAC. Detailed explanations of operations will be discussed later, but a simple
example can be given here: to start a GTM, the operator, having ensured all pre-start checks for
the GTM were completed, presses the ON button. The UEC and associated control circuitry
send the necessary signals to conduct a start sequence for the GTM.
33

GTM 2B GTM 2A FUEL
Bleed Air
Valve Open
Valve Shut
Motor
On Line
On
Normal Stop C/D
Bleed Air
Valve Open
Valve Open
Purge On
Purge Off
Motor
On Line
On
Normal Stop C/D
Figure 2-13: Simplified PPAC Panel
Bleed valves were discussed in Section 2.2. The 16th stage bleed valve supplies air to the Bleed
Air header. An isolation valve can be actuated to prevent this bleed air from passing to the Bleed
Air header. The appropriate buttons on the PPAC control this Bleed Air isolation valve by
sending a signal to the UEC. The UEC in turn sends a signal to a 28V DC motor to shut the
Bleed Air isolation valve. The Bleed Air isolation valves for the GTM’s are normally shut, as
discussed in Section 2.4. Recall that Bleed Air isolation valves and Bleed Air regulator valves
are two separate components in the Bleed Air system. The remaining GTM functions – Motor,
On Line, On, Normal Stop, and Fuel Purges – will be discussed later.
Panel layout and operation for the GTG’s are similar. The Electric Plant Control Panel
has a display representing the DDG-51 electrical distribution system (“mimic bus”) and its
34
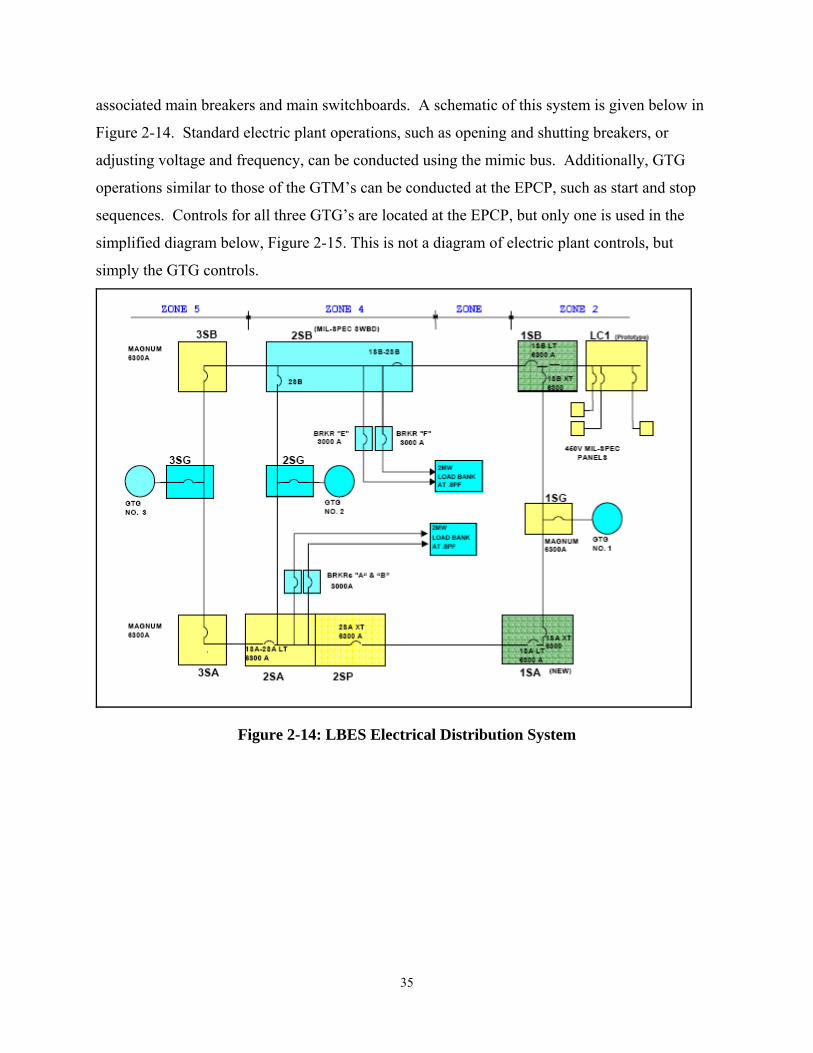
associated main breakers and main switchboards. A schematic of this system is given below in
Figure 2-14. Standard electric plant operations, such as opening and shutting breakers, or
adjusting voltage and frequency, can be conducted using the mimic bus. Additionally, GTG
operations similar to those of the GTM’s can be conducted at the EPCP, such as start and stop
sequences. Controls for all three GTG’s are located at the EPCP, but only one is used in the
simplified diagram below, Figure 2-15. This is not a diagram of electric plant controls, but
simply the GTG controls.
Figure 2-14: LBES Electrical Distribution System
35

Engine Start Bleed Air
On
Off
Valve Open
Valve Shut
Figure 2-15: Simplified GTG Controls at the EPCP The Bleed Air valve buttons function similar to the GTM Bleed Air valve buttons for the
GTM’s. They control the opening and closing of a Bleed Air shutoff valve. Again, the GTG
Bleed Air shutoff valves are normally shut as discussed in Section 2.4.
2.6.1 Main Propulsion Engine (GTM) Start
The following is a general description of the LM2500 GTM start sequence [12], [18]. It is
assumed that the GTM is in proper working condition, all pre-start checks have been completed
satisfactorily, and all required auxiliary systems (cooling fans, etc.) are working properly.
Expected actions and operations in related systems will be described where applicable.
1. The operator at either the SCU or PPAC presses the appropriate (either 2A or 2B) ON
button. The ON pushbutton indicator illuminates momentarily.
2. The UEC receives the ON signal.
3. The UEC energizes the Starter Air Regulating Valve, admitting compressed air into a
pneumatic starter in the following manner (see Figure 2-16):
a. Air from the Start Air header at approximately 95-110 psig continually passes to
the inlet of the Starter Air Regulating Valve, and vents through the solenoid
switcher ambient vent.
b. The UEC passes a 28V DC signal to the solenoid switcher, which repositions to
shut the ambient vent and port air to the proper side of the Starter Air Regulating
Valve diaphragm, opening the valve.
36

c. The diaphragm of the Starter Air Regulating Valve positions the valve to
maintain 35-41 psig to the inlet of the pneumatic starter.
4. The GTM turbine starts rotating.
5. The UEC starts the following timers:
a. 20 seconds to reach 1,200 RPM
b. 45 seconds for engine lube oil pressure to reach 10 psig
c. 90 seconds to reach 4,500 RPM
d. If times are exceeded, the UEC will initiate an automatic shutdown. Note: a
typical time for the turbine to reach 4,500 RPM is about 50 seconds after the start
is initiated.
6. At 1,200 RPM, the UEC commands the following:
a. Igniters on. A contact closes to send 115V AC single phase power from the UEC
(Note this is not the same as the input power to the UEC) to the igniters located
in the combustion chamber of the turbine.
b. Fuel Shutoff valves open. The UEC sends a 28V DC signal to two electrically
actuated Fuel Shutoff valves (positioned in series) which open to pass fuel to the
GTM fuel nozzles.
c. If the UEC receives indications of a fuel ignition failure, it will initiate an
automatic shutdown.
7. At 4,500 RPM, the following occurs:
a. The UEC de-energizes the igniters by opening a contact and thus removing 115V
AC single phase power.
b. The UEC shuts the Starter Air Regulating Valve by stopping the 28V DC signal
powering the Starter Air Regulating Valve solenoid.
c. The pneumatic starter disengages.
8. The GTM turbine will now approach idle speed (approximately 5,000 RPM) but its
control is disconnected from the throttle. Note that a typical time for the turbine to reach
idle speed is 60 seconds after the start is initiated.
37

Figure 2-16: Starter Air Regulating Valve from Reference 12
2.6.2 Main Propulsion Engine (GTM) Motoring/Fuel Purging
Motoring (fuel purging) is an operation typically performed either for maintenance or
when a Gas Turbine Engine has been shut down for more than 14 days [12]. A fuel purge
removes approximately three gallons of low temperature fuel from the fuel lines. It is assumed
that all pre-start checks have been completed satisfactorily.
1. The operator at either the SCU or PPAC presses the appropriate (either 2A or 2B)
MOTOR button. The MOTOR pushbutton indicator illuminates momentarily.
2. The UEC receives the MOTOR signal.
38

3. The SCU sets air pressure at the inlet of the Starter Air Regulating Valve to 20-22 psig as
follows:
a. A 28V DC signal is sent to the Motor Regulating Valve solenoid, actuating it
using control air and directing air from the Starter Air header through a Motor Air
Regulating Valve, which uses Control Air (i.e. LP air) to maintain 20-22 psig at
the inlet of the Starter Air Regulating Valve. The Motor Regulating Valve is a
normally open valve (see Figure 2-17).
4. The operator presses the FUEL PURGE ON button, which illuminates momentarily.
5. The UEC receives the FUEL PURGE ON signal and sends a 28V DC signal to the
solenoid-actuated Fuel Purge valve, which opens and purges approximately 3 gallons of
fuel.
6. The Fuel Purge valve shuts and the FUEL PURGE OFF button illuminates.
7. The UEC opens the Starter Air Regulating Valve per Section 2.6.1 sending 20-22 psig air
to the pneumatic starter. When inlet pressure (~21 psig) to the Starter Air Regulating
Valve is less than desired outlet pressure (~35 psig from Section 2.6.1 above), the Starter
Air Regulating Valve positions to fully open.
8. The GTM turbine starts spinning, and reaches approximately 1,800 RPM.
9. After 3 minutes, the operator presses the NORMAL STOP button, and the following
occurs:
a. The UEC shuts the Starter Air Regulating Valve by removing the 28V DC signal
to the solenoid.
b. The SCU fully opens the Motor Regulating Valve by removing the 28V DC
signal to the solenoid. This operation stops the flow of control air to the Motor
Regulating Valve.
39
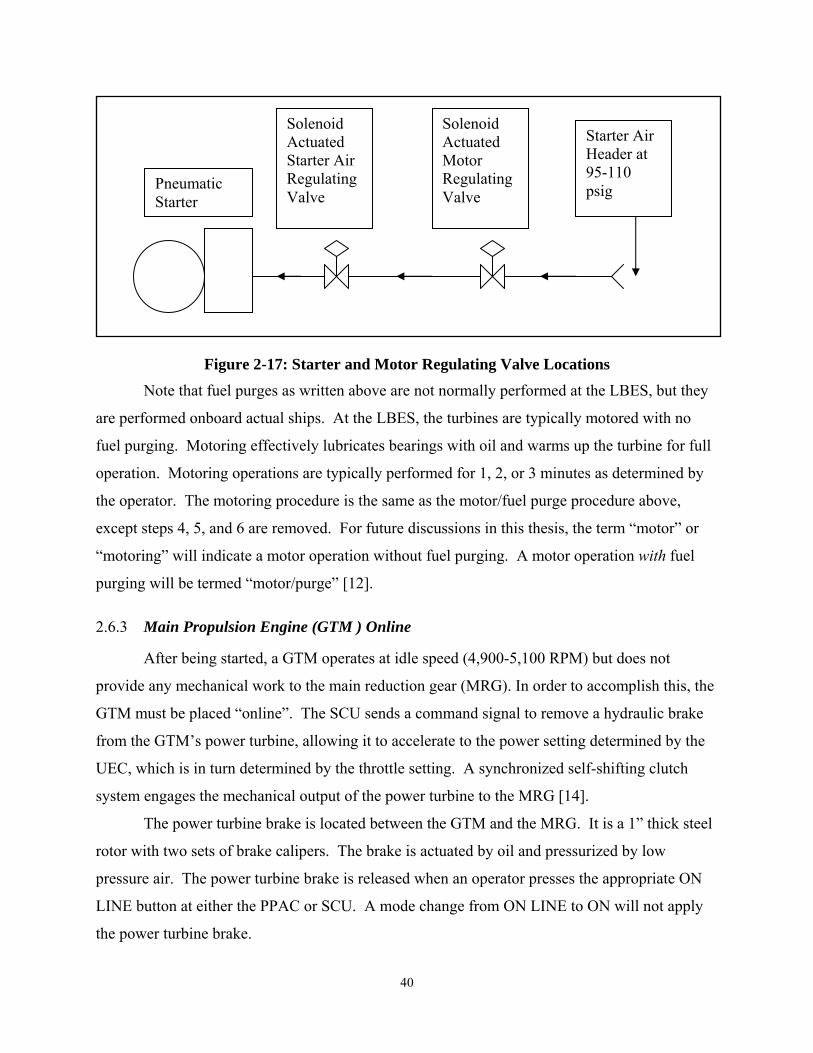
Pneumatic Starter
Solenoid Actuated Starter Air Regulating Valve
Solenoid Actuated Motor Regulating Valve
Starter Air Header at 95-110 psig
Figure 2-17: Starter and Motor Regulating Valve Locations
Note that fuel purges as written above are not normally performed at the LBES, but they
are performed onboard actual ships. At the LBES, the turbines are typically motored with no
fuel purging. Motoring effectively lubricates bearings with oil and warms up the turbine for full
operation. Motoring operations are typically performed for 1, 2, or 3 minutes as determined by
the operator. The motoring procedure is the same as the motor/fuel purge procedure above,
except steps 4, 5, and 6 are removed. For future discussions in this thesis, the term “motor” or
“motoring” will indicate a motor operation without fuel purging. A motor operation with fuel
purging will be termed “motor/purge” [12].
2.6.3 Main Propulsion Engine (GTM ) Online
After being started, a GTM operates at idle speed (4,900-5,100 RPM) but does not
provide any mechanical work to the main reduction gear (MRG). In order to accomplish this, the
GTM must be placed “online”. The SCU sends a command signal to remove a hydraulic brake
from the GTM’s power turbine, allowing it to accelerate to the power setting determined by the
UEC, which is in turn determined by the throttle setting. A synchronized self-shifting clutch
system engages the mechanical output of the power turbine to the MRG [14].
The power turbine brake is located between the GTM and the MRG. It is a 1” thick steel
rotor with two sets of brake calipers. The brake is actuated by oil and pressurized by low
pressure air. The power turbine brake is released when an operator presses the appropriate ON
LINE button at either the PPAC or SCU. A mode change from ON LINE to ON will not apply
the power turbine brake.
40

A combined operation known as an “online start” may also be performed. A GTM can
be placed online directly from a shutdown status by pressing the ON LINE button without first
conducting the start sequence of Section 2.6.1. When conducting this online start, the start
procedure of Section 2.6.1 and the online action listed above are combined, and the UEC and
SCU automatically carry out both sequentially.
2.6.4 Main Propulsion Engine (GTM) Normal Stop
A normal stop occurs any time a GTM is brought to idle speed for a period of 5 minutes
for cooldown, and then secured [14]. It is assumed that the GTM has been taken offline and is
operating at idle speed.
1. The operator at either the SCU or PPAC presses the appropriate (either 2A or 2B)
NORMAL STOP C/D button. The NORMAL STOP C/D pushbutton indicator
illuminates momentarily.
2. The UEC receives the normal stop command. The UEC starts a 300 second timer.
3. After 300 seconds have elapsed, the UEC shuts the Fuel Shutoff valves per Section 2.6.1
above.
4. The GTM decelerates.
5. The power turbine brake will be applied automatically when power turbine speed
decreases below 500 RPM and various fuel pressure parameters are met.
2.6.5 Gas Turbine Generator (GTG) Start
The starting procedure for the GTG’s is similar to that for the GTM’s. GTG #1 (Unit
914) can be started either with the RIMSS (described in Section 2.3.1) or with Start air and a
pneumatic starter similar to the GTM. GTG #2 and GTG #3 can only be started with Start air.
Instead of a UEC, the GTG’s have a 301 sequencer which is a micro-processor control
unit. The sequencer initiates and oversees engine operations such as starts and shutdowns,
monitors system parameters, and initiates alarms and shutdowns when required [14]. The
general start sequence is listed below.
1. The operator presses the ON button.
2. If the turbine is being started by the RIMSS, power is applied to the RIMSS from the DC
voltage source as discussed in Section 2.3.1. If the turbine is being started by Start air, the
Start air valve opens and powers a pneumatic starter.
41

3. The GTG turbine accelerates.
4. At 2,200 RPM
a. Fuel valves open.
b. Igniters energize.
5. At 7,500 RPM, the igniters de-energize.
6. At 9,100 RPM
a. The low pressure start air valve closes.
b. The pneumatic starter disengages.
7. The GTG reaches normal operating speed at 14,340 RPM.
2.6.6 Gas Turbine Generator (GTG) Transient Load Sensor
A specific protection function that prevents a GTG casualty condition caused by
electrical load shifts is the Transient Load Sensor. When the electrical load on a GTG is greater
than 1000 kW, a Transient Load Sensor will close the Bleed Air isolation valve when the
electrical load on the GTG increases by 500 kW or more [18]. The Bleed Air isolation valve will
remain closed for three minutes, and then re-open. This prevents the GTG from experiencing an
over-temperature shutdown. The Transient Load Sensor will also close the Bleed Air isolation
valves on the remaining GTG’s if one of the GTG’s is shutdown with the associated generator
breaker (1SG, 2SG, or 3SG) closed. This prevents an over-temperature shutdown of the
remaining GTG’s [14].
42
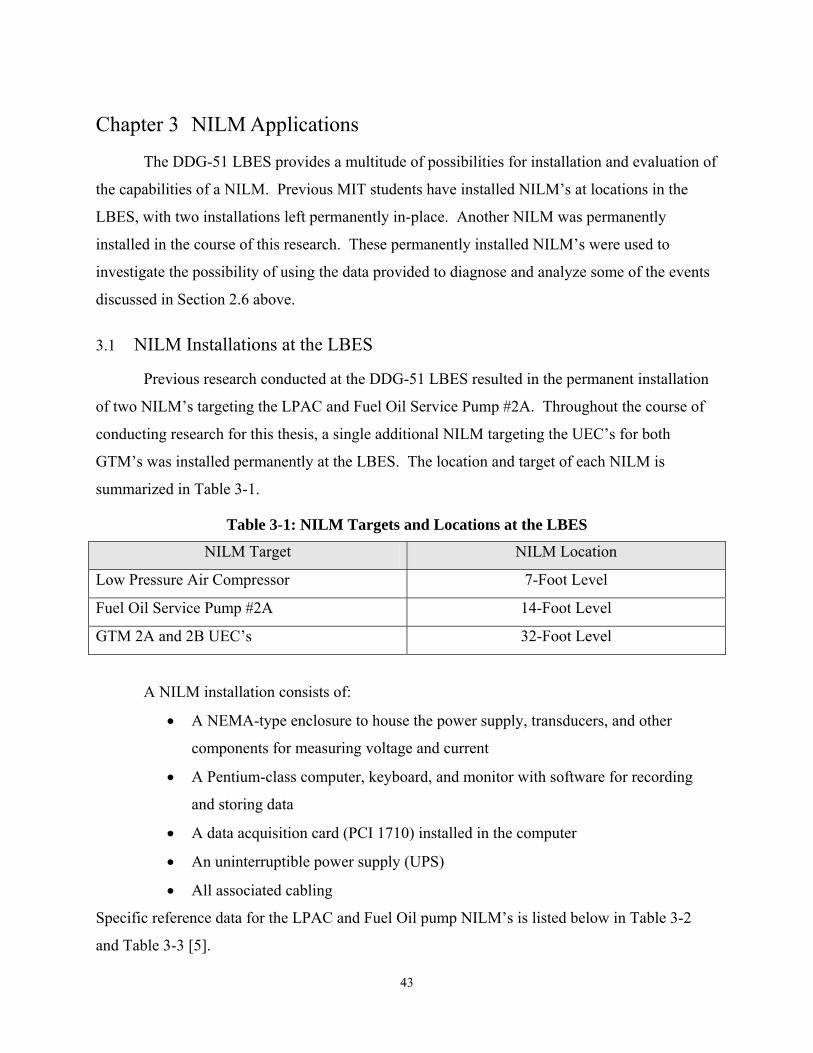
Chapter 3 NILM Applications
The DDG-51 LBES provides a multitude of possibilities for installation and evaluation of
the capabilities of a NILM. Previous MIT students have installed NILM’s at locations in the
LBES, with two installations left permanently in-place. Another NILM was permanently
installed in the course of this research. These permanently installed NILM’s were used to
investigate the possibility of using the data provided to diagnose and analyze some of the events
discussed in Section 2.6 above.
3.1 NILM Installations at the LBES
Previous research conducted at the DDG-51 LBES resulted in the permanent installation
of two NILM’s targeting the LPAC and Fuel Oil Service Pump #2A. Throughout the course of
conducting research for this thesis, a single additional NILM targeting the UEC’s for both
GTM’s was installed permanently at the LBES. The location and target of each NILM is
summarized in Table 3-1.
Table 3-1: NILM Targets and Locations at the LBES
NILM Target NILM Location
Low Pressure Air Compressor 7-Foot Level
Fuel Oil Service Pump #2A 14-Foot Level
GTM 2A and 2B UEC’s 32-Foot Level
A NILM installation consists of:
• A NEMA-type enclosure to house the power supply, transducers, and other
components for measuring voltage and current
• A Pentium-class computer, keyboard, and monitor with software for recording
and storing data
• A data acquisition card (PCI 1710) installed in the computer
• An uninterruptible power supply (UPS)
• All associated cabling
Specific reference data for the LPAC and Fuel Oil pump NILM’s is listed below in Table 3-2
and Table 3-3 [5].
43

Table 3-2: NILM Configuration for LPAC
NILM Channel
Measurement Resistors Reference Resistors Transducers Current Transducer Conversion
1 Voltage 180Ω (pins 34-68) 62Ω (pins 24-26) LEM LV-25P 2500/1000
2 Current 36Ω (pins 33-67) 62Ω (pins 33-26) LEM LA-305S 1/2500
Table 3-3: NILM Configuration for Fuel Oil Service Pump 2A
NILM Channel
Measurement Resistors Reference Resistors
Transducers Current Transducer Conversion
1 Voltage 180Ω (pins 34-68) 62Ω (pins 24-26) LEM LV-25P 2500/1000
2 Current 62Ω (pins 33-67) 62Ω (pins 33-26) LEM LA-55P 1/1000
3.1.1 The Universal Engine Controller (UEC) NILM Installation
Because the UEC is so vital to the operation sequences discussed in Section 2.6, it was
decided to construct and install a NILM to target it. To determine where to attach the NILM
entry points, the UEC power supply was examined. A simplified diagram of electrical and cable
interfaces for a single UEC, SCU and GTM are shown below in Figure 3-1 below.
Cable J9 (from Figure 3-1) carries 115V AC/ single phase power to the UEC. Cable J10
carries the 115V AC/3-phase power. Within the UEC, these two forms of supply power are
converted to various other AC and DC ratings and subsequently used for various operations
(such as those described in Section 2.6). However, because the ultimate power for most of the
operations discussed in Section 2.6 is supplied via J10, the NILM voltage sensing lines and
current transducers were installed on the 115V AC/ 3-phase 60 Hz power feed to the UEC’s.
44

Figure 3-1: Simplified UEC Interface Schematic There are two engine controllers at the LBES, one for each GTM (as previously
discussed in Section 2.2.1). The 115VAC /3-phase power supplying each UEC is distributed
from LBES power panel 1-282-1. Because the voltages supplied to each UEC are effectively
identical, only one voltage sensing connection was made, specifically to phases B and C of the
2A GTM UEC. Current transducers were attached to phase A of both 2B and 2A GTM UEC’s
(see Figure 3-2). The specific installation procedure is indicated in Appendix A and was
performed on February 23, 2006. The UEC NILM was configured as follows:
45

Table 3-4: NILM Configuration for Universal Engine Controller
NILM Channel
Measurement Resistors Reference Resistors Transducers Current Transducer Conversion
1 Voltage 80Ω 51Ω LEM LV-25P 2500/1000
2 Current 160Ω 51Ω LEM LA-55P 1/1000
3 Voltage Jumpered
from CH 1
Jumpered from CH 1 Jumpered from
CH 1
Jumpered
from CH 1
4 Current 160Ω 51Ω LEM LA-55P 1/1000
Figure 3-2: UEC current and voltage sensors in power panel 1-282-1
3.2 The LPAC NILM
The software installed on a NILM computer automatically collects spectral envelope data
(see Section 1.2) in hour-long blocks termed “snapshots”. Recording for a snapshot is stopped
and a new recording is started each hour using Greenwich Mean Time (GMT) as a time
46

reference. For the work in this thesis, the fundamental information of interest is the spectral
envelope a1(t), which is an estimate of the real power delivered to the targeted device. A plot of
this quantity yields valuable information about the operational state of the device. For example,
one can use it to determine when the LPAC is loaded or unloaded (from Section 2.4). Figure 3-3
below shows real power during three cycles of the LPAC operating in Automatic 125 PSIG
mode [5]. While the state of the LPAC (loaded vice unloaded) is valuable information, we can
further analyze this data to determine information about the state of the low pressure air system
itself.
Figure 3-3: LPAC in Automatic 125 PSIG Operation
A MATLAB script (Appendix B.1) is used to calculate several values of interest. First,
the actual “Load” and “Unload” time intervals for each compressor cycle are calculated and
stored. These are the lengths that the compressor is in a loaded state and an unloaded state.
Second, the time that a load or unload cycle is completed relative to the start of the hourly
snapshot is recorded as well. Thus, if the Load-Unload Script is run on an LPAC snapshot, it is
possible to get the following information:
• How many load cycles the compressor underwent in the hour
• How many unload cycles the compressor underwent in the hour
47

• How long each of these load/unload intervals lasted
• When each of these intervals ended relative to the start of the hour (e.g. 32 minutes after
start)
Using these new quantities calculated by the Load-Unload Script, one can view the behavior of
the LPAC by examining the load and unload cycle intervals throughout the course of an hour, or
a day.
A specific example is as follows. The operator logs for April 22, 2005 indicated an air
start of Unit 9130 (#2 GTG) occurred between 7:00 a.m. and 8:00 a.m. As discussed above,
during periods when the compressor is operating under load, the real power it draws increases by
a large amount. The NILM identifies this change, as well as the decrease in real power that
accompanies the unloading of the compressor. Figure 3-4 indicates the change in the load
interval for this specific event. The Load-Unload Script determines these intervals, and
generates a time history of the compressor’s loaded and unloaded times.
Figure 3-4: Plot of the real power drawn by the LPAC before, during, and after an air start of Unit 9130 (#2 Gas Turbine Generator). The units of real power are shown here to be counts, and they reflect the scale factors introduced by our instrumentation. The power can be converted into Watts by determining the appropriate multiplicative scale factor to apply to the data.
48
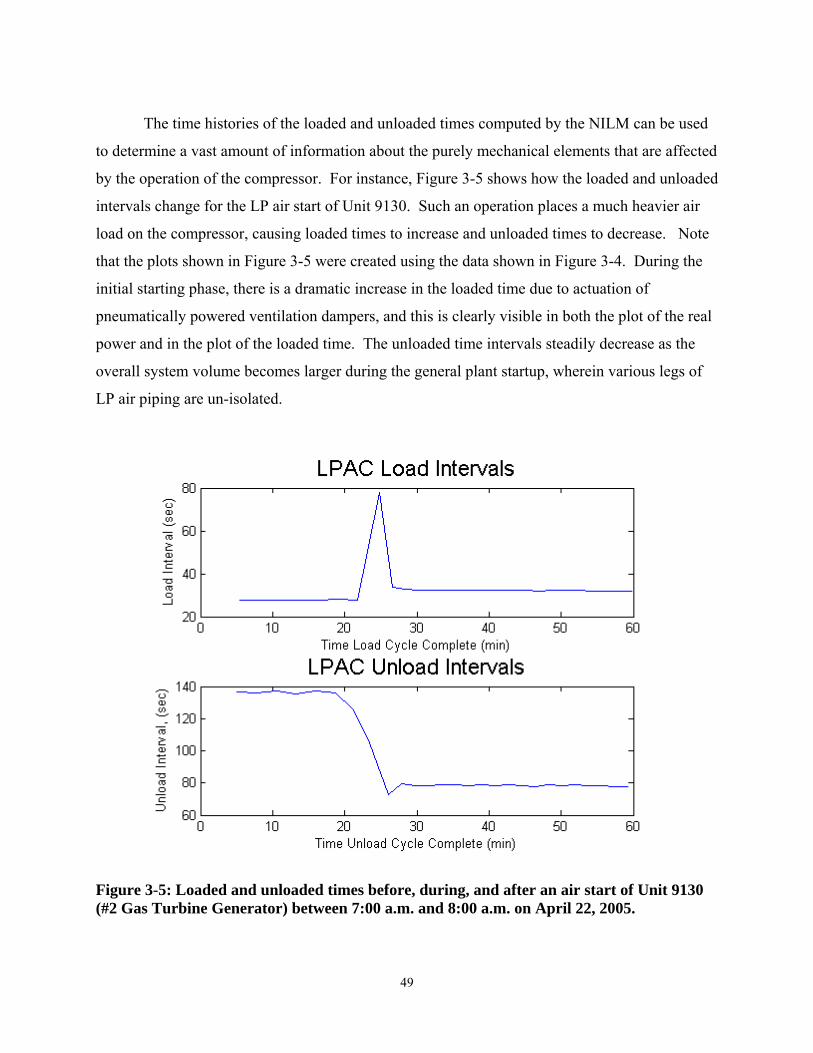
The time histories of the loaded and unloaded times computed by the NILM can be used
to determine a vast amount of information about the purely mechanical elements that are affected
by the operation of the compressor. For instance, Figure 3-5 shows how the loaded and unloaded
intervals change for the LP air start of Unit 9130. Such an operation places a much heavier air
load on the compressor, causing loaded times to increase and unloaded times to decrease. Note
that the plots shown in Figure 3-5 were created using the data shown in Figure 3-4. During the
initial starting phase, there is a dramatic increase in the loaded time due to actuation of
pneumatically powered ventilation dampers, and this is clearly visible in both the plot of the real
power and in the plot of the loaded time. The unloaded time intervals steadily decrease as the
overall system volume becomes larger during the general plant startup, wherein various legs of
LP air piping are un-isolated.
Figure 3-5: Loaded and unloaded times before, during, and after an air start of Unit 9130 (#2 Gas Turbine Generator) between 7:00 a.m. and 8:00 a.m. on April 22, 2005.
49

3.3 The Fuel Oil Pump NILM
The NILM targeting the #2A Fuel Oil Pump records data in the exact same manner as the
LPAC NILM. Again, information concerning the pump power can be obtained, such as off/on
status, as shown in Figure 3-6. However, just as in the case of the LPAC above, once the pump
is actually on, observations can be made about the system by observing the behavior of the pump
alone. Using the operator logs as a guide, we examined the pump’s electrical input power in
order to determine if specific GTM events cause any noticeable changes. Any distinguishable
and repeatable features in the pump power plots that may have indicated a GTM event were
noted. GTG events were excluded from this analysis because the GTG’s rely on a gravity feed
tank to supply their fuel pressure, not a fuel service pump, as discussed in Section 2.5.
Figure 3-6: 2A Fuel Oil Service Pump Starts in Low Speed An example of the effect of GTM operation is indicated in Figure 3-7. To assist in the
identification of features, the data was first processed using the low-pass finite impulse response
(FIR) filter whose coefficients are listed in Appendix B.2. The operator logs state that the 2B
50
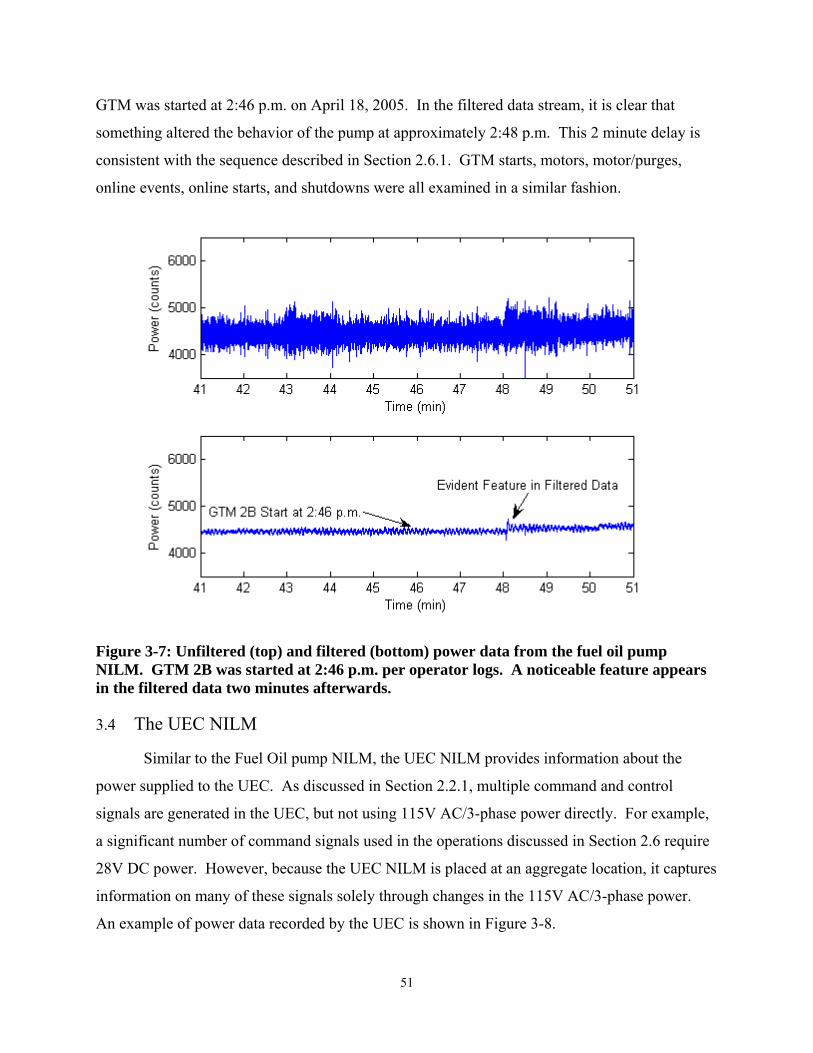
GTM was started at 2:46 p.m. on April 18, 2005. In the filtered data stream, it is clear that
something altered the behavior of the pump at approximately 2:48 p.m. This 2 minute delay is
consistent with the sequence described in Section 2.6.1. GTM starts, motors, motor/purges,
online events, online starts, and shutdowns were all examined in a similar fashion.
Figure 3-7: Unfiltered (top) and filtered (bottom) power data from the fuel oil pump NILM. GTM 2B was started at 2:46 p.m. per operator logs. A noticeable feature appears in the filtered data two minutes afterwards.
3.4 The UEC NILM
Similar to the Fuel Oil pump NILM, the UEC NILM provides information about the
power supplied to the UEC. As discussed in Section 2.2.1, multiple command and control
signals are generated in the UEC, but not using 115V AC/3-phase power directly. For example,
a significant number of command signals used in the operations discussed in Section 2.6 require
28V DC power. However, because the UEC NILM is placed at an aggregate location, it captures
information on many of these signals solely through changes in the 115V AC/3-phase power.
An example of power data recorded by the UEC is shown in Figure 3-8.
51
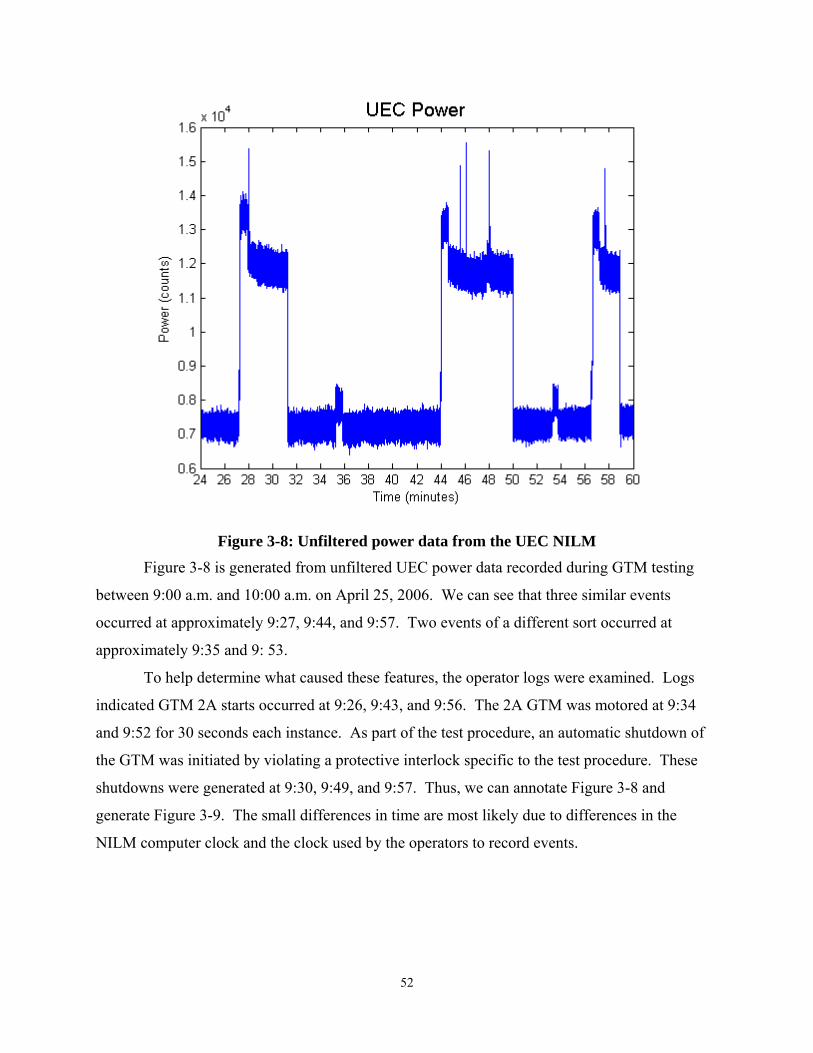
Figure 3-8: Unfiltered power data from the UEC NILM Figure 3-8 is generated from unfiltered UEC power data recorded during GTM testing
between 9:00 a.m. and 10:00 a.m. on April 25, 2006. We can see that three similar events
occurred at approximately 9:27, 9:44, and 9:57. Two events of a different sort occurred at
approximately 9:35 and 9: 53.
To help determine what caused these features, the operator logs were examined. Logs
indicated GTM 2A starts occurred at 9:26, 9:43, and 9:56. The 2A GTM was motored at 9:34
and 9:52 for 30 seconds each instance. As part of the test procedure, an automatic shutdown of
the GTM was initiated by violating a protective interlock specific to the test procedure. These
shutdowns were generated at 9:30, 9:49, and 9:57. Thus, we can annotate Figure 3-8 and
generate Figure 3-9. The small differences in time are most likely due to differences in the
NILM computer clock and the clock used by the operators to record events.
52
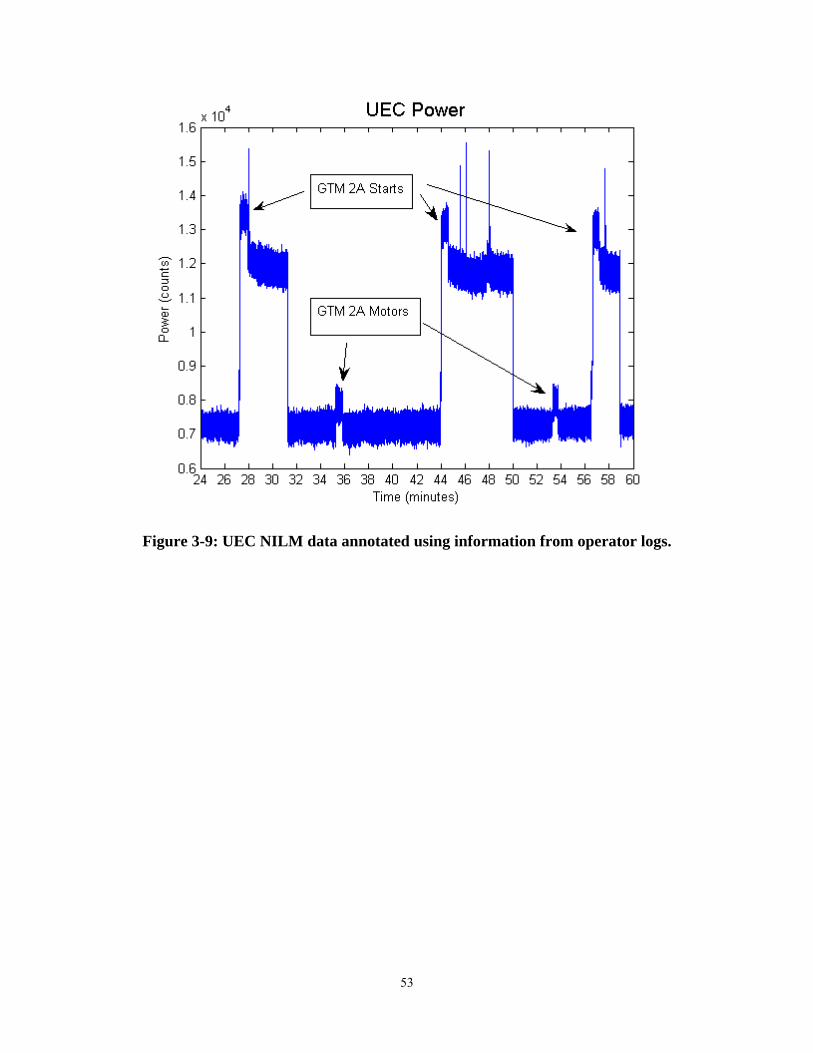
Figure 3-9: UEC NILM data annotated using information from operator logs.
53

(This Page Intentionally Left Blank)
54

Chapter 4 Event Analyses and NILM Relations
As discussed in Chapter 1, the NILM can detect and classify various loads in certain
electromechanical systems. In this chapter, the underlying relations required for this task will be
examined. Using combinations of the three NILM data analysis techniques discussed in Chapter
3, the systems detailed in Chapter 2 will be examined to determine if the NILM’s can provide
data that relates to the specific events described in Section 2.6. For the data recorded during the
period April 18, 2005 through April 22, 2005, shop air was not aligned, and thus the Start Air
header was supplied via bleed air, not shop air.
4.1 Main Propulsion Engine (GTM) Start
Based on the GTM start sequence discussed in Section 2.6.1, several system relations can
be noted that should evidence themselves in the data recorded by the three NILM’s. A GTM
start requires air from the Start Air header. However, as mentioned in Section 2.4, load changes
in the Start Air header should not affect the LP air system based on check valves located between
the two (see Figure 2-10). Thus, while there is a large amount of low pressure air used for a
GTM start, it should not evidence itself in the LPAC Load-Unload plots.
A GTM start causes the Fuel Shutoff valves to open, supplying fuel from the Fuel Service
header into the GTM. This opening of the valves should result in a momentary drop in system
pressure. The fuel unloader valve is pneumatically operated from LP air and may reposition
after the opening of the Fuel Shutoff valves, but this pneumatic adjustment may not be a large
enough load to impact the LPAC behavior. However, the fuel oil service pump itself may be
affected by this overall system change, requiring more work from the pump to maintain system
pressure once the Fuel Shutoff valves are open.
Figure 4-1 and Figure 4-2 show plots of both LPAC Load-Unload data and Fuel Oil
pump data recorded during multiple GTM 2B events that happened within a short time of each
other on April 18 and April 19, 2005. The figures provide examples of separate GTM events,
but the reader’s attention is called to the features generated by the GTM starts at 2:46 p.m. on
April 18 in Figure 4-1 and 12:40 p.m. on April 19 in Figure 4-2. The LPAC Load-Unload
intervals are not affected, but the Fuel Oil pump power is. This specific relation in the behavior
55
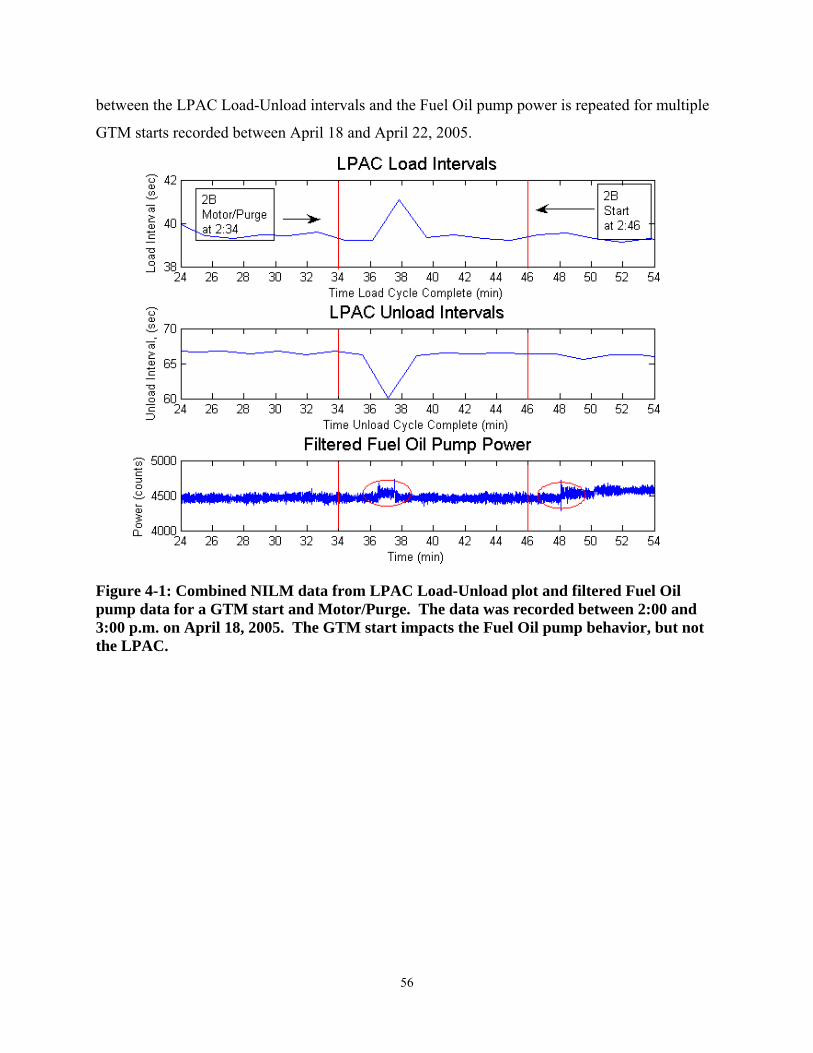
between the LPAC Load-Unload intervals and the Fuel Oil pump power is repeated for multiple
GTM starts recorded between April 18 and April 22, 2005.
Figure 4-1: Combined NILM data from LPAC Load-Unload plot and filtered Fuel Oil pump data for a GTM start and Motor/Purge. The data was recorded between 2:00 and 3:00 p.m. on April 18, 2005. The GTM start impacts the Fuel Oil pump behavior, but not the LPAC.
56
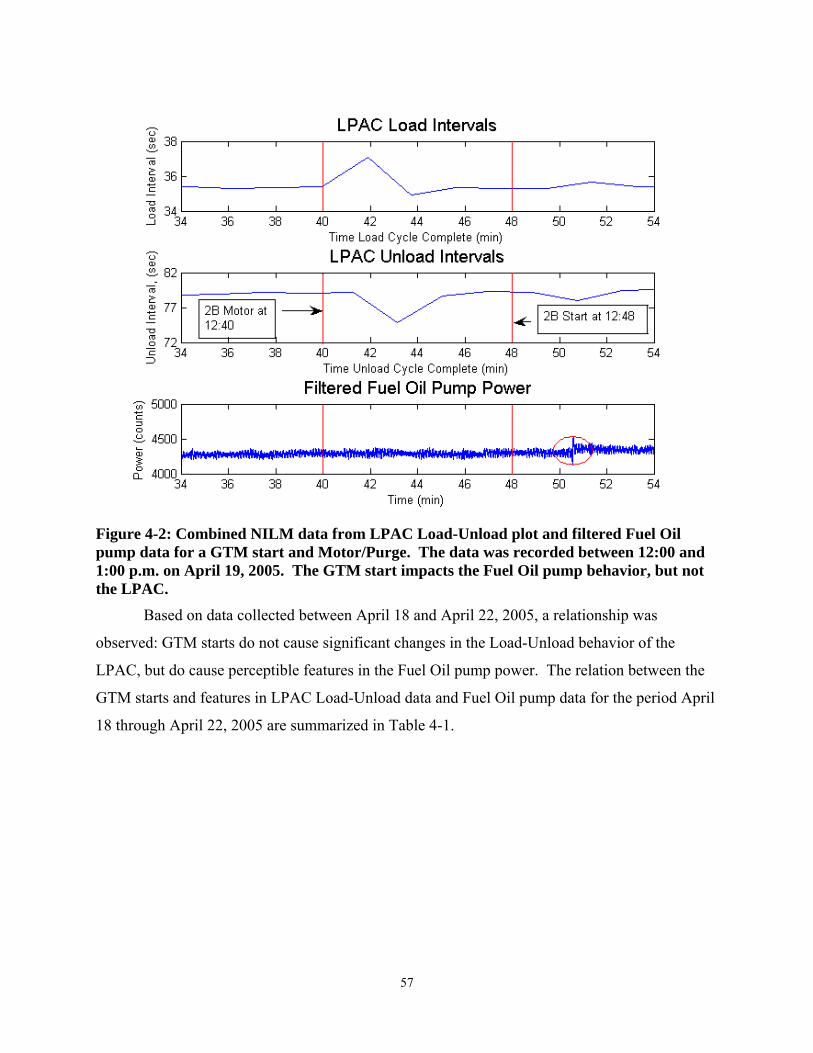
Figure 4-2: Combined NILM data from LPAC Load-Unload plot and filtered Fuel Oil pump data for a GTM start and Motor/Purge. The data was recorded between 12:00 and 1:00 p.m. on April 19, 2005. The GTM start impacts the Fuel Oil pump behavior, but not the LPAC.
Based on data collected between April 18 and April 22, 2005, a relationship was
observed: GTM starts do not cause significant changes in the Load-Unload behavior of the
LPAC, but do cause perceptible features in the Fuel Oil pump power. The relation between the
GTM starts and features in LPAC Load-Unload data and Fuel Oil pump data for the period April
18 through April 22, 2005 are summarized in Table 4-1.
57
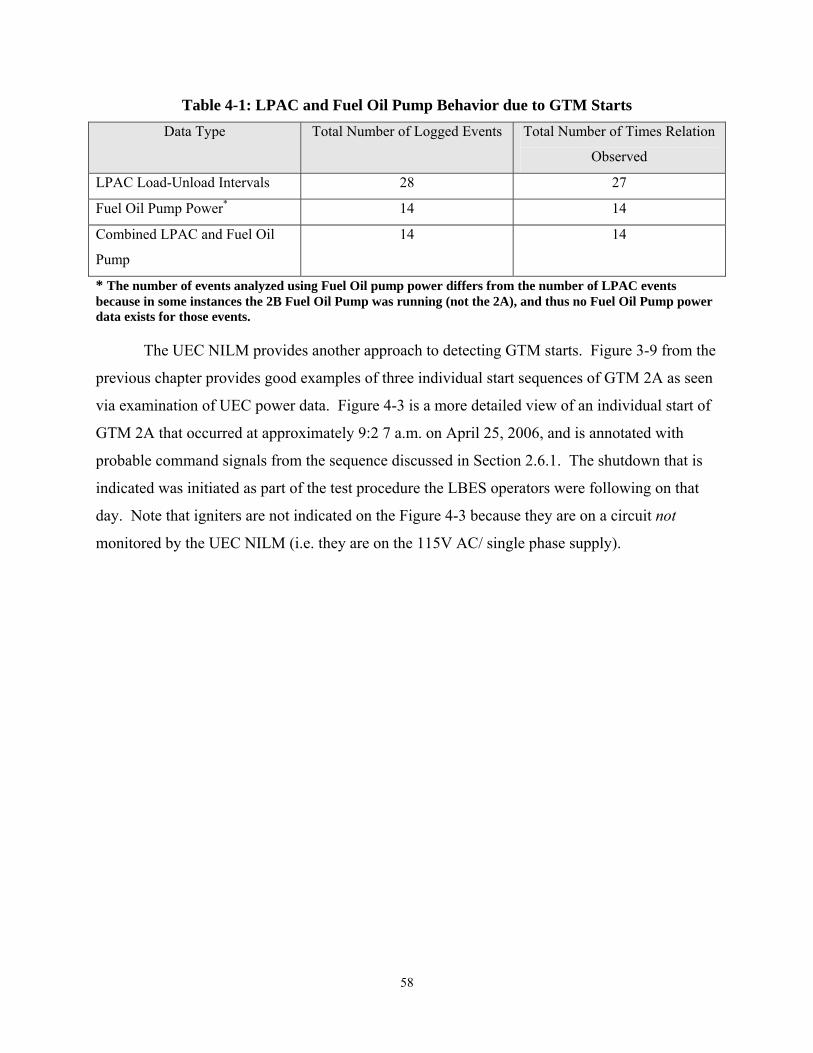
Table 4-1: LPAC and Fuel Oil Pump Behavior due to GTM Starts Data Type Total Number of Logged Events Total Number of Times Relation
Observed
LPAC Load-Unload Intervals 28 27
Fuel Oil Pump Power* 14 14
Combined LPAC and Fuel Oil
Pump
14 14
* The number of events analyzed using Fuel Oil pump power differs from the number of LPAC events because in some instances the 2B Fuel Oil Pump was running (not the 2A), and thus no Fuel Oil Pump power data exists for those events. The UEC NILM provides another approach to detecting GTM starts. Figure 3-9 from the
previous chapter provides good examples of three individual start sequences of GTM 2A as seen
via examination of UEC power data. Figure 4-3 is a more detailed view of an individual start of
GTM 2A that occurred at approximately 9:2 7 a.m. on April 25, 2006, and is annotated with
probable command signals from the sequence discussed in Section 2.6.1. The shutdown that is
indicated was initiated as part of the test procedure the LBES operators were following on that
day. Note that igniters are not indicated on the Figure 4-3 because they are on a circuit not
monitored by the UEC NILM (i.e. they are on the 115V AC/ single phase supply).
58

Figure 4-3: UEC power during GTM 2A start sequence annotated with probable command signals generated by the UEC. Section 2.6.1 indicates that a typical GTM start requires the Starter Air Regulating Valve to be open for approximately 50 seconds. This plot indicates the Starter Air Regulating Valve was open for approximately 45 seconds.
The UEC data for GTM starts is very useful because it provides a more exact
“fingerprint” of a start than the combined LPAC-Fuel Oil pump data. While the combined
LPAC-Fuel Oil pump data is capable of indicating a GTM start occurred (and when it occurred),
the UEC data can provide additional specifics about the start sequence itself, such as when
various commands were triggered by the UEC or if they were triggered. The sequence can be
resolved to a series of finite states that are indicative of starts. Figure 4-4 provides a simplified
example of the finite states for a start sequence. Each state transition requires a certain amount
of power, and the NILM can use that information to recognize events, e.g. from Figure 4-3,
“State A” (the opening of the Starter Air regulating valve) might require 8500 counts (or the
equivalent in Watts) [19].
59

Figure 4-4: Finite states for a UEC start sequence. Using Figure 4-2 as a basis, the states can be labeled as follows: (A) Starter Air regulating valve opens (B) Fuel Shutoff valves open (C) Starter Air regulating valve closes. At this point the GTM is “on”. To return to the “off” state, the Fuel Shutoff valves must close.
The UEC information further allows one to possibly detect problems with a start
sequence. Figure 4-5 is an instance of a failed start attempt on April 25, 2006 at approximately
10:33 a.m. Based on operator logs, the GTM suffered a “flameout shutdown” caused by either
of two things: fuel pressure supplied to the turbine was less than 50 psig, or turbine exhaust
temperature was below 400±10 °F. Because either of the two parameter thresholds was not met,
the UEC initiated an automatic shutdown followed immediately by an automatic, one minute
motoring period [12]. The same finite state analysis can be applied to the failed start as with the
proper start of Figure 4-3, and thus the NILM can recognize the specific state transitions that
indicate a failed start.
60
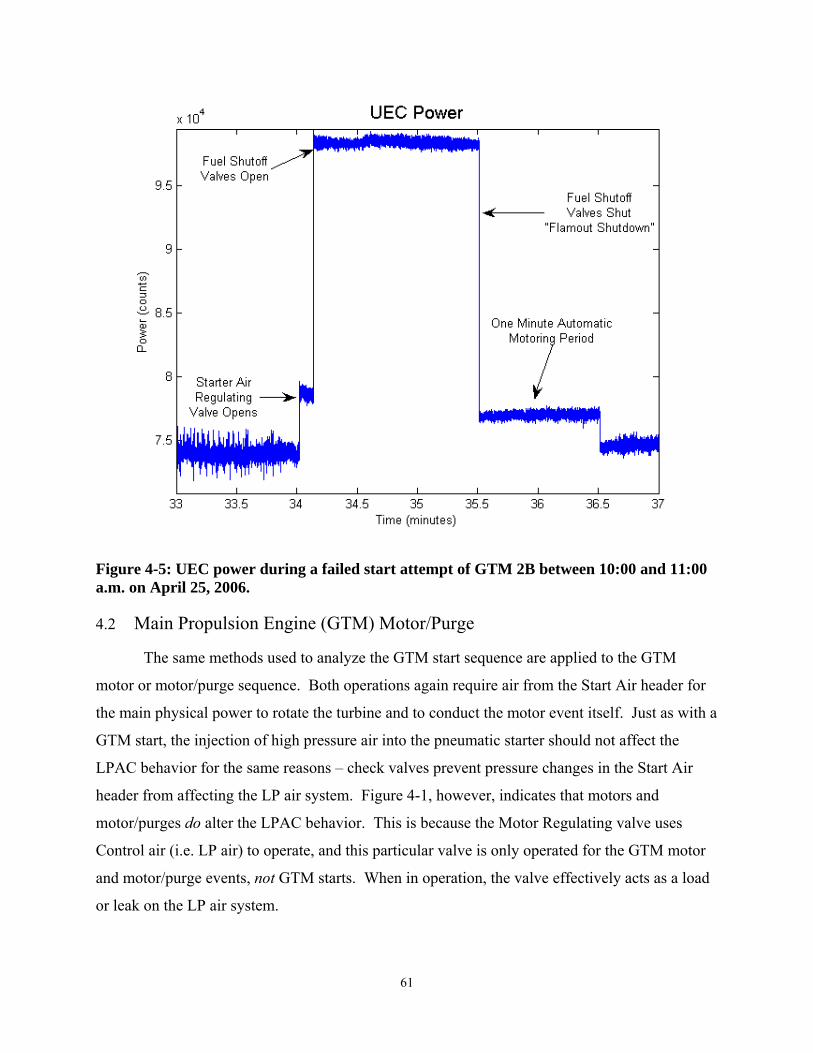
Figure 4-5: UEC power during a failed start attempt of GTM 2B between 10:00 and 11:00 a.m. on April 25, 2006.
4.2 Main Propulsion Engine (GTM) Motor/Purge
The same methods used to analyze the GTM start sequence are applied to the GTM
motor or motor/purge sequence. Both operations again require air from the Start Air header for
the main physical power to rotate the turbine and to conduct the motor event itself. Just as with a
GTM start, the injection of high pressure air into the pneumatic starter should not affect the
LPAC behavior for the same reasons – check valves prevent pressure changes in the Start Air
header from affecting the LP air system. Figure 4-1, however, indicates that motors and
motor/purges do alter the LPAC behavior. This is because the Motor Regulating valve uses
Control air (i.e. LP air) to operate, and this particular valve is only operated for the GTM motor
and motor/purge events, not GTM starts. When in operation, the valve effectively acts as a load
or leak on the LP air system.
61

The fuel oil system is affected depending on which specific type of motoring event
occurs. A motor/purge, based on the sequence described in Section 2.6.2, involves opening the
fuel purge valve, thus causing a drop in pressure in the fuel oil system. This may have a
noticeable effect on the Fuel Oil pump power. For a motor, the Fuel Purge valves are not
actuated, thus the fuel oil system should not be affected, nor should the Fuel Oil pump. Figure
4-6 contrasts the two types of motoring events (motor/purges and motors). Both events generate
effects in the LPAC Load-Unload intervals, and only the motor/purge impacts the Fuel Oil pump
power. This is also evidenced in both plots of Figure 4-1 and Figure 4-2.
Figure 4-6: A motor/purge event is contrasted with a motor event. These events occurred between 12:00 and 1:00 p.m. on April 18, 2005. Both motoring events affect the LPAC via the Motor Regulating valve, but only the motor/purge affects the fuel oil system, and thus the Fuel Oil pump. Based on data collected between April 18 and April 22, 2005, GTM motors or
motor/purges can generate increases in the LPAC load and/or decreases in the LPAC unload
intervals. Based on the same data, motor/purges cause changes in the Fuel Oil pump power,
62
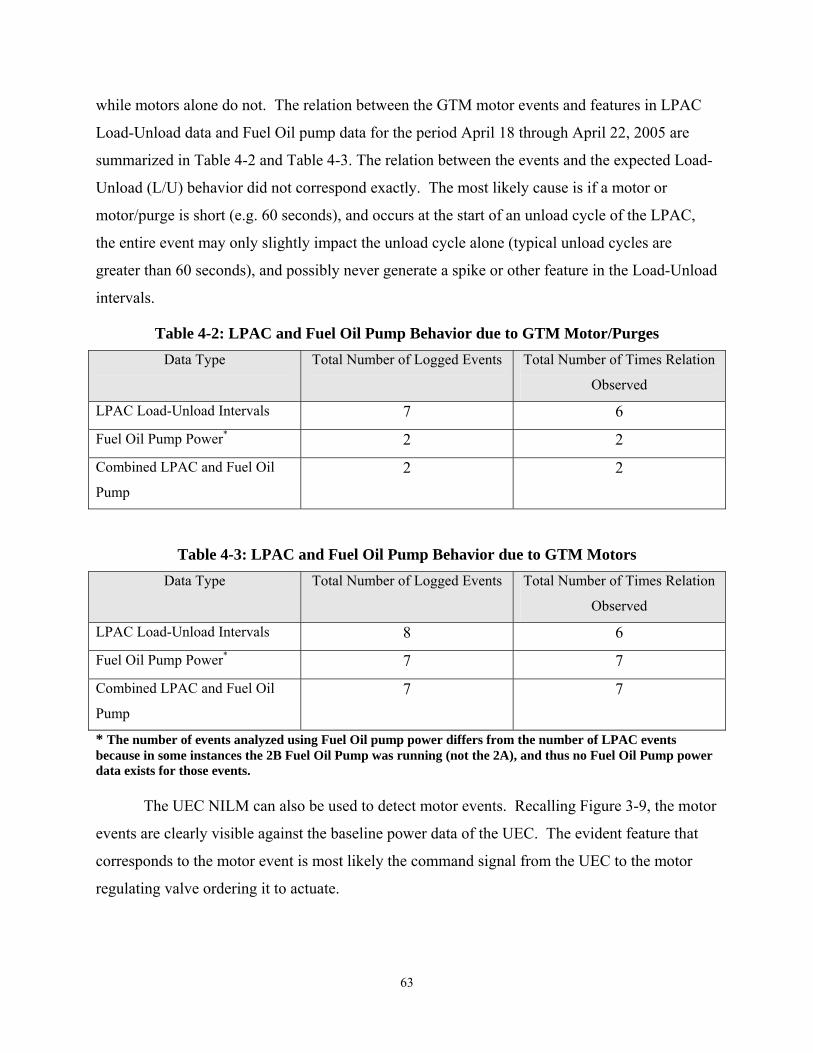
while motors alone do not. The relation between the GTM motor events and features in LPAC
Load-Unload data and Fuel Oil pump data for the period April 18 through April 22, 2005 are
summarized in Table 4-2 and Table 4-3. The relation between the events and the expected Load-
Unload (L/U) behavior did not correspond exactly. The most likely cause is if a motor or
motor/purge is short (e.g. 60 seconds), and occurs at the start of an unload cycle of the LPAC,
the entire event may only slightly impact the unload cycle alone (typical unload cycles are
greater than 60 seconds), and possibly never generate a spike or other feature in the Load-Unload
intervals.
Table 4-2: LPAC and Fuel Oil Pump Behavior due to GTM Motor/Purges Data Type Total Number of Logged Events Total Number of Times Relation
Observed
LPAC Load-Unload Intervals 7 6
Fuel Oil Pump Power* 2 2
Combined LPAC and Fuel Oil
Pump
2 2
Table 4-3: LPAC and Fuel Oil Pump Behavior due to GTM Motors Data Type Total Number of Logged Events Total Number of Times Relation
Observed
LPAC Load-Unload Intervals 8 6
Fuel Oil Pump Power* 7 7
Combined LPAC and Fuel Oil
Pump
7 7
* The number of events analyzed using Fuel Oil pump power differs from the number of LPAC events because in some instances the 2B Fuel Oil Pump was running (not the 2A), and thus no Fuel Oil Pump power data exists for those events. The UEC NILM can also be used to detect motor events. Recalling Figure 3-9, the motor
events are clearly visible against the baseline power data of the UEC. The evident feature that
corresponds to the motor event is most likely the command signal from the UEC to the motor
regulating valve ordering it to actuate.
63

4.3 Main Propulsion Engine (GTM) Online
The GTM online sequence is fairly simple compared to GTM starts or motors. The GTM
is typically already at an idle speed (approximately 4500 RPM), and the only event of interest
within the overall sequence is the release of the power turbine braking mechanism. This requires
the use of LP air, and thus may cause an increase in the LPAC load interval and/or a decrease in
the unload interval. The fuel oil pump behavior may or may not be affected depending on the
power level of the GTM at the time the online button is pushed at either the SCU or PPAC. For
example, if a GTM is started, then placed online while the throttle setting for the GTM’s is set at
a high shaft speed, the GTM may require more fuel to increase its mechanical output fairly
rapidly. However, if the throttle setting is at a low shaft speed, and the GTM does not have to
provide much more power than idling power, the GTM may not require more fuel, and thus the
fuel pump power may not change noticeably. Figure 4-7 shows two online events on April 19,
2005. The LPAC behavior is clearly affected by the online events, but the fuel oil pump power
may or may not be affected.
64

Figure 4-7: Combined NILM data from LPAC Load-Unload plot and filtered Fuel Oil pump data for GTM online events between 12:00 and 1:00 p.m. on April 19, 2005. Behavioral changes in the LPAC Load-Unload intervals are clearly evident, but any changes in Fuel Oil pump power require closer examination to detect.
Based on data collected between April 18 and April 22, 2005, GTM online sequences
may generate increases in the LPAC load and/or decreases in the LPAC unload intervals. Based
on the same data, online sequences may cause changes in the Fuel Oil pump power. The relation
between the GTM online sequences and features in LPAC Load-Unload data and Fuel Oil pump
data for the period April 18 through April 22, 2005 are summarized in Table 4-4. The relation
between the events and the expected Load-Unload (L/U) behavior did not correspond exactly.
The best estimate for this is the same as for the GTM motor events – the brake release sequence
may not be long enough to impact the LP air system in all cases. The relation between the events
and the expected Fuel Oil pump behavior did not correspond exactly. This is possibly due to
power settings being very similar before and after the online sequence was initiated, as discussed
above.
65

Table 4-4: LPAC and Fuel Oil Pump Behavior due to GTM Online Sequences Data Type Total Number of Logged Events Total Number of Times Relation
Observed
LPAC Load-Unload Intervals 32 24
Fuel Oil Pump Power* 14 8
* The number of events analyzed using Fuel Oil pump power differs from the number of LPAC events because in some instances the 2B Fuel Oil Pump was running (not the 2A), and thus no Fuel Oil Pump power data exists for those events. Because of the lack of consistency of observed relations between the online sequences and
individual NILM behavior, it is not beneficial to consider identifying relations using combined
LPAC and Fuel Oil pump data.
4.4 Main Propulsion Engine (GTM) Stop
Recalling Section 2.6.4, a GTM is typically already offline and at idle speed
(approximately 4500 RPM) when a normal stop command is ordered. Operators at the LBES log
two events for a GTM stop:
1. “NSI” – Normal Stop Initiated. The command to stop is given by pressing the stop
button for the appropriate turbine. Per Section 2.6.4, the UEC starts a 300 second (5
minute) timer.
2. “NSC” – Normal Stop Complete. The Fuel Shutoff valves close and the turbine
decelerates rapidly after the 5 minute wait period is complete. Note the turbine is not
completely stopped when this log entry is made.
As with previous events, the associated systems and their relations are examined to determine if
the stop sequence can affect the LP air system or the fuel oil system. The initiation of the stop
command does not require a large change in any LP air loads, thus it is not expected that the
initiation of the stop command will affect LPAC behavior. Upon completion of the stop
sequence, the power turbine brake is applied. Because this brake is powered by LP air, it is
possible that the LPAC behavior may be affected during this part of the stop sequence. The fuel
oil system may be affected by the completion of the stop sequence when the Fuel Shutoff valves
close. This change in fuel oil system pressure may alter the power of the Fuel Oil pump. Figure
4-8 is an example of a stop sequence ordered on April 19, 2005.
66

Figure 4-8: Combined NILM data from LPAC Load-Unload plot and filtered Fuel Oil pump data for GTM normal stop between 1:00 and 2:00 p.m. on April 19, 2005. Two features in the filtered Fuel Oil pump power data are evident after the stop is initiated (NSI) and completed (NSC). No discernable features are visible in the LPAC plots.
Based on data collected between April 18 and April 22, 2005, it is not clear that either the
initiation or completion of GTM starts affect the behavior of the LPAC as determined by the
load-unload intervals. Although the application of the power turbine brake near the completion
of the stop requires the use of LP air, it may not be a large enough or sudden enough change in
pneumatic load to affect the LPAC. Fuel Oil pump behavior is consistently affected by both
initiation and completion of the GTM start sequence. While it is unclear why the initiation of the
stop sequence affects the fuel oil system enough to change the fuel oil pump power, the
completion of the stop sequence most likely affects the Fuel Oil pump power via the closing of
the Fuel Shutoff valves. In both portions of the stop sequence, the Fuel Oil pump consistently
experiences a drop in power, as shown in Figure 4-8. The relation between the GTM stop
67
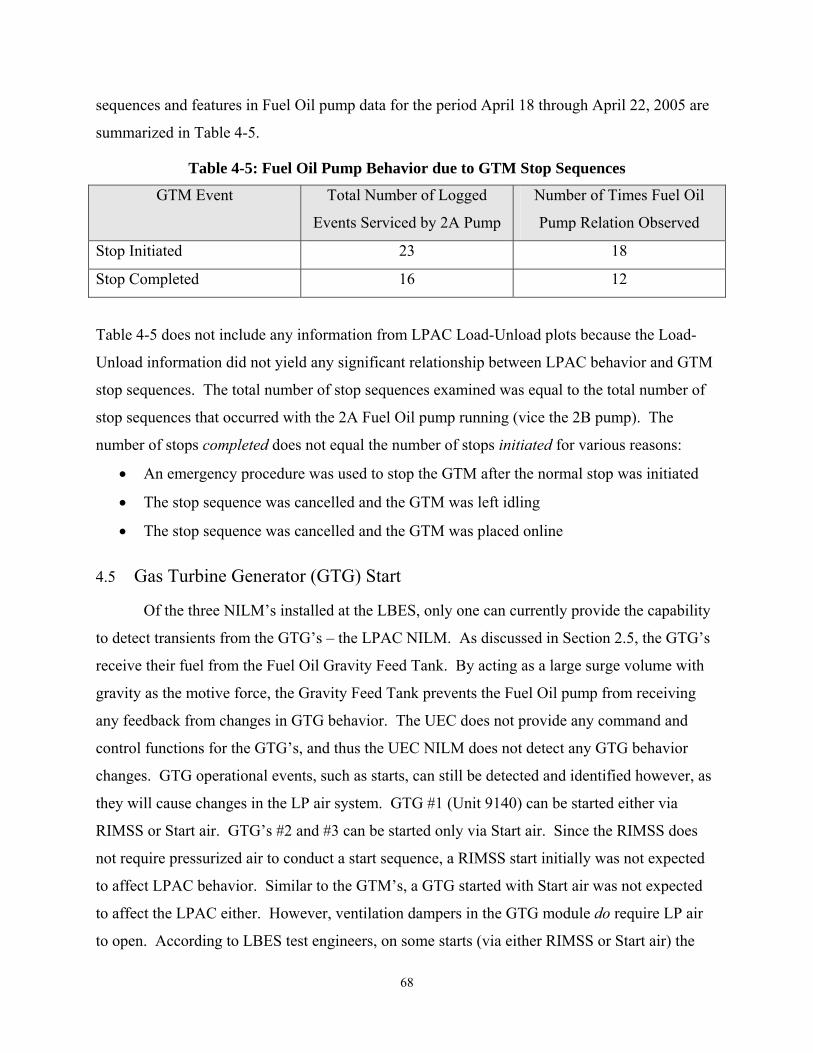
sequences and features in Fuel Oil pump data for the period April 18 through April 22, 2005 are
summarized in Table 4-5.
Table 4-5: Fuel Oil Pump Behavior due to GTM Stop Sequences
GTM Event Total Number of Logged
Events Serviced by 2A Pump
Number of Times Fuel Oil
Pump Relation Observed
Stop Initiated 23 18
Stop Completed 16 12
Table 4-5 does not include any information from LPAC Load-Unload plots because the Load-
Unload information did not yield any significant relationship between LPAC behavior and GTM
stop sequences. The total number of stop sequences examined was equal to the total number of
stop sequences that occurred with the 2A Fuel Oil pump running (vice the 2B pump). The
number of stops completed does not equal the number of stops initiated for various reasons:
• An emergency procedure was used to stop the GTM after the normal stop was initiated
• The stop sequence was cancelled and the GTM was left idling
• The stop sequence was cancelled and the GTM was placed online
4.5 Gas Turbine Generator (GTG) Start
Of the three NILM’s installed at the LBES, only one can currently provide the capability
to detect transients from the GTG’s – the LPAC NILM. As discussed in Section 2.5, the GTG’s
receive their fuel from the Fuel Oil Gravity Feed Tank. By acting as a large surge volume with
gravity as the motive force, the Gravity Feed Tank prevents the Fuel Oil pump from receiving
any feedback from changes in GTG behavior. The UEC does not provide any command and
control functions for the GTG’s, and thus the UEC NILM does not detect any GTG behavior
changes. GTG operational events, such as starts, can still be detected and identified however, as
they will cause changes in the LP air system. GTG #1 (Unit 9140) can be started either via
RIMSS or Start air. GTG’s #2 and #3 can be started only via Start air. Since the RIMSS does
not require pressurized air to conduct a start sequence, a RIMSS start initially was not expected
to affect LPAC behavior. Similar to the GTM’s, a GTG started with Start air was not expected
to affect the LPAC either. However, ventilation dampers in the GTG module do require LP air
to open. According to LBES test engineers, on some starts (via either RIMSS or Start air) the
68

vent dampers will open, causing a sudden increase in load on the LP air system and possibly
affecting LPAC Load-Unload intervals [18]. The opening of the vent damper depends on the
temperature of the module and ambient atmospheric temperature. Examples of a RIMSS start of
GTG #1 and an air start of GTG #2 are shown below in Figure 4-9 and Figure 4-10.
Figure 4-9: LPAC Load-Unload data for a RIMSS start of GTG #1 on April 18, 2005. The event generated a feature in the unload interval, but not the load interval.
69

Figure 4-10: LPAC Load-Unload data before, during, and after an air start of Unit 9130 (#2 Gas Turbine Generator) between 7:00 a.m. and 8:00 a.m. on April 22, 2005. The slow decrease in unload intervals is most likely due to engineroom startup, and the various associated minor loads that entails. The large spike in load interval time is indicative of the actual GTG start.
Based on data collected between April 18 and April 22, 2005, GTG starts via either
RIMSS or Start air can generate increases in the LPAC load and/or decreases in the LPAC
unload intervals. The specific reason for which currently is believed to be due to the vent
damper operation described above. The relation between the GTG starts and features in LPAC
Load-Unload data for the period April 18 through April 22, 2005 are summarized in Table 4-6.
The relation between the starts and the expected Load-Unload (L/U) behavior did not correspond
exactly. As stated above, the exact damper operation is dependent on temperature, and thus it is
possible for some starts not to require operation of the damper (e.g. if the damper was already
open).
70

Table 4-6: LPAC Load-Unload Behavior Due to GTG Starts
GTG Event Total Number of Logged Events Number of Times L/U
Relation Observed
RIMSS Start GTG #1 7 6
Air Start GTG #2 3 3
4.6 Gas Turbine Generator (GTG) Load Shifts
Similar to GTG starts, GTG load shifts are not expected to evidence themselves in any
data other than possibly in LPAC Load-Unload data, and for the same reasons. A Navy ship’s
electric plant allows for the possibility of a multitude of different electric plant shifts, all
depending on the state (open or shut) of various breakers, the number of operating generators,
and the loading of the generators. The LBES is no different. Between April 18 and April 22,
2005, the LBES electric plant was manipulated into a large number of different permutations, but
one particular permutation appeared to affect the LPAC Load-Unload intervals.
Figure 4-11 displays the effects of this particular electric plant operation – the opening of
the 1SG breaker causing GTG #2 to carry the entire electric load. This behavior was observed
once on April 18, 2005, and 8 times on April 21, 2005. In all cases, the electric load was placed
entirely upon GTG #2.
71

Figure 4-11: LPAC Load-Unload data for April 21, 2005 between 1:00 p.m. and 2:00 p.m. The spikes labeled a, b, and c correspond with operator log remarks of “Open 1SG, all load to #2 [GTG]”.
The reason for the change in behavior of the LPAC is likely a change in position of the
Bleed Air regulating valve, which relies on LP air for operation. In turn, the reason the Bleed
Air regulating valve changes position for this particular event is not known either, but a possible
candidate is the Transient Load Sensor of Section 2.6.6. When a GTG is “block loaded” as
described in Section 2.6.6, the Bleed Air isolation valve for the loaded GTG shuts. The isolation
valve is located inside the GTG module, upstream of the regulating valve, and thus the regulating
valve loses its air supply. This may cause the regulating valve to reposition itself to either full
open or full close. If the final position requires little or no pneumatic power to maintain that
position, then the load on the LP air system will have dropped, thus causing the observed
behavior in the LPAC Load-Unload intervals. There are no technical references available at this
time to determine what the final position of the regulating valve is in this situation.
72
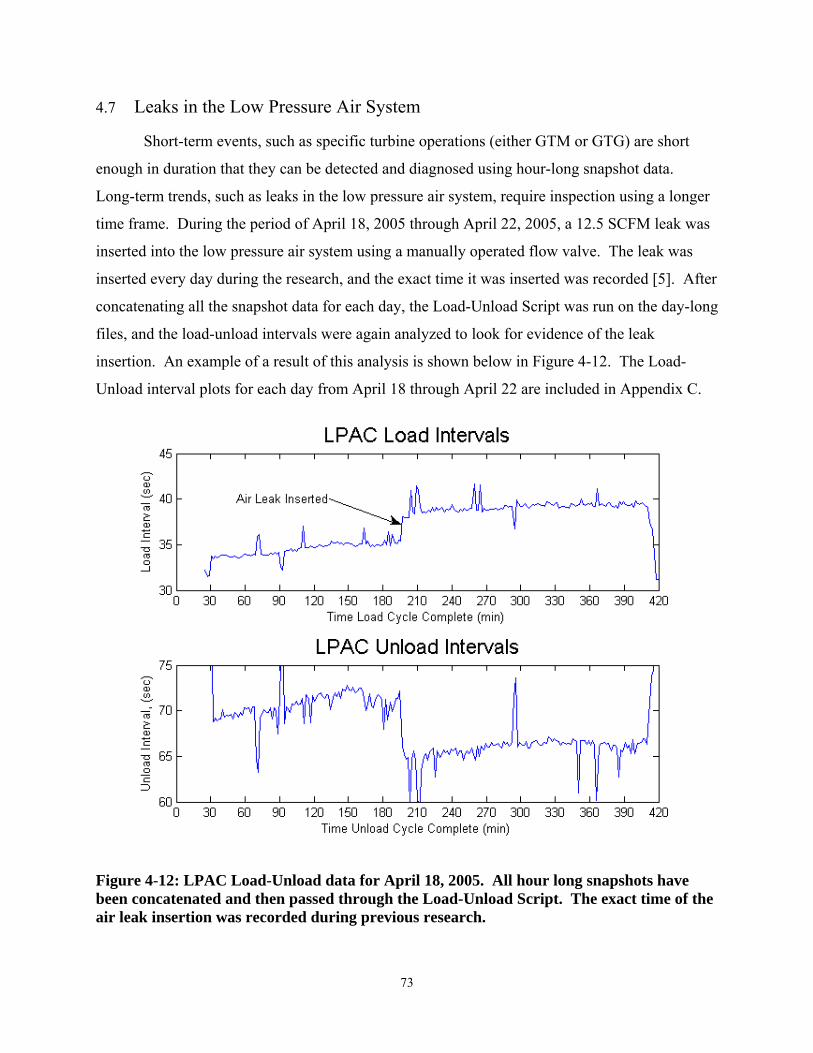
4.7 Leaks in the Low Pressure Air System
Short-term events, such as specific turbine operations (either GTM or GTG) are short
enough in duration that they can be detected and diagnosed using hour-long snapshot data.
Long-term trends, such as leaks in the low pressure air system, require inspection using a longer
time frame. During the period of April 18, 2005 through April 22, 2005, a 12.5 SCFM leak was
inserted into the low pressure air system using a manually operated flow valve. The leak was
inserted every day during the research, and the exact time it was inserted was recorded [5]. After
concatenating all the snapshot data for each day, the Load-Unload Script was run on the day-long
files, and the load-unload intervals were again analyzed to look for evidence of the leak
insertion. An example of a result of this analysis is shown below in Figure 4-12. The Load-
Unload interval plots for each day from April 18 through April 22 are included in Appendix C.
Figure 4-12: LPAC Load-Unload data for April 18, 2005. All hour long snapshots have been concatenated and then passed through the Load-Unload Script. The exact time of the air leak insertion was recorded during previous research.
73

The air leak insertion does not generate a spike behavior, such as those distributed
throughout previous LPAC Load-Unload plots, but it does create a noticeable long-term effect in
both the load and unload intervals. As expected, the leak causes an increase in the average load
time and a decrease in the average unload time. This effect can be detected using an FIR filter-
based change-of-mean detector.
Another instance of a long-term leak appearing in the system is the operation of the Bleed
Air header itself. As stated at the beginning of this chapter, shop air was not used to supply the
Start Air header during the period April 18 through April 22, 2005, and the Bleed Air header was
utilized. The Bleed Air regulating valves require continuous LP air for operation (sometimes
referred to as “control air”). Thus, by opening up the Bleed Air isolation valves and placing the
Bleed Air regulating valves on service throughout the day, a leak effect was generated in the LP
air system. An example of this effect is shown in Figure 4-13 .
Figure 4-13: LPAC Load-Unload interval data evidencing the leak effect generated by placing the Bleed Air header on service. The data is from the period between 8:00 and 9:00 a.m. on April 19, 2005.
74

The leak-detection ability of the NILM can be enhanced and automated. The NILM has
shown the capacity to detect large, instantaneous leaks. Given the ability to generate logs, the
NILM can identify all major step changes in pneumatic load, such as those shown for the leak
insertion and Bleed Air valve operation. These logs generated by the NILM can indicate any
events that do not correspond to previously identified changes. An alert can then be sent to the
operators warning of a possible leak.
75

Chapter 5 Conclusions and Further Research
Using the basic relationships between LBES system events and observed behaviors in
NILM data, a method of detection, identification, and diagnosis can now be attempted. Chapter
4 examined specific LBES events and found corresponding relationships in various NILM data.
Here we examine the NILM data and then develop a method to isolate and identify specific
LBES events that have occurred.
5.1 Detection
The UEC NILM, combined with further data from future NILM installations, can be used
to conduct initial detections for various GTM and GTG events. The UEC NILM provides a very
detailed description of the UEC power during various GTM events. Because of this detail, the
UEC NILM currently can determine what specific operation occurred (e.g. GTM start vice a
GTM motor). Further research can expand upon the basis already developed. The data provided
by the UEC NILM does not yield information that helps detect, identify, or diagnose GTG
events. This can be corrected by a similar NILM installation on the GTG controller - the 301
sequencer. Together, the two NILM’s (installed on the GTM UEC and the GTG sequencer) can
theoretically provide detection, identification, and diagnostics for many of the standard
operations performed by those two large pieces of machinery. The Fuel Oil pump and LPAC
NILM data can then be used to confirm the detection and identity of these events. This
combined UEC/301 sequencer data can generate logs and detect a larger array of events for both
the GTM’s and GTG’s.
To further assist in the detection and identification of events, several additional NILM
installations may prove beneficial. For example, another excellent target for NILM monitoring
is the LBES lube oil system. Behavioral relations between a lube oil pump and GTM/GTG
events most likely follow the same trends as the fuel oil system. Thus, starts and stops of the
GTM’s and GTG’s may cause large enough changes in system pressure to affect pump power,
which in turn can be detected and analyzed by a NILM. Other possible NILM locations and
targets include:
• 115V/3-phase power to the SCU
• 115V/ single phase power to the GTM igniters (via the UEC)
76

• 115V/3-phase power to the 301 sequencer controlling GTG operations
• 115V/3-phase power upstream of both SCU and UEC (power panel 1-282-1)
5.2 Diagnostics
The combined data drawn from the above NILM installations can be used not only to
determine what events happened and when, but also may be used to diagnose problems with the
events. For example, the UEC data can immediately indicate an improper start of a GTM, as
shown in Figure 4-5. However, the exact source of the problem is not readily apparent from just
UEC data.
The UEC data can be augmented with data from the Fuel Oil pump during the failed start.
This is shown in Figure 5-1. The additional data provided by the Fuel Oil pump (or Lube Oil
pump, LPAC, etc.) may provide insight into what caused the fault. For example, the behavior of
the Fuel Oil pump power in Figure 5-1 may indicate that fuel oil pressure did not change as is
typical for GTM starts. This may be important to operators trying to decide between spending
valuable time and assets troubleshooting the fuel oil system or the UEC itself or some other
system (e.g. Lube Oil).
77
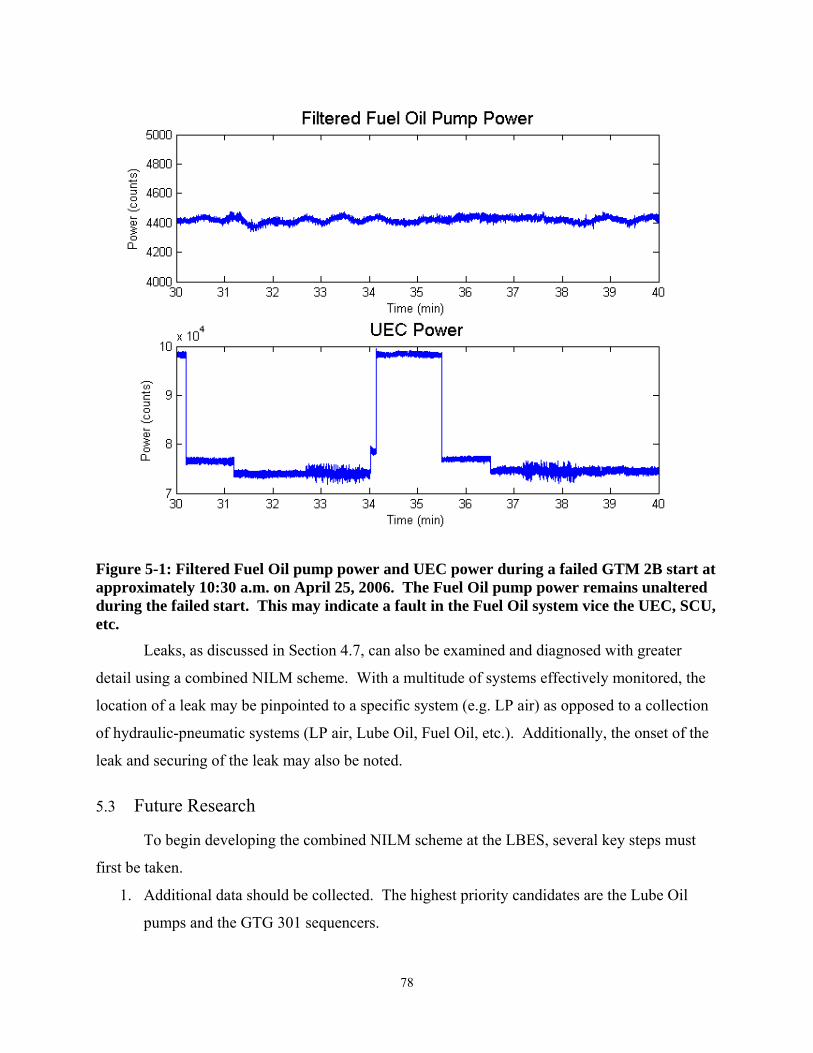
Figure 5-1: Filtered Fuel Oil pump power and UEC power during a failed GTM 2B start at approximately 10:30 a.m. on April 25, 2006. The Fuel Oil pump power remains unaltered during the failed start. This may indicate a fault in the Fuel Oil system vice the UEC, SCU, etc.
Leaks, as discussed in Section 4.7, can also be examined and diagnosed with greater
detail using a combined NILM scheme. With a multitude of systems effectively monitored, the
location of a leak may be pinpointed to a specific system (e.g. LP air) as opposed to a collection
of hydraulic-pneumatic systems (LP air, Lube Oil, Fuel Oil, etc.). Additionally, the onset of the
leak and securing of the leak may also be noted.
5.3 Future Research
To begin developing the combined NILM scheme at the LBES, several key steps must
first be taken.
1. Additional data should be collected. The highest priority candidates are the Lube Oil
pumps and the GTG 301 sequencers.
78

2. NILM automation and management must be enhanced. This involves improving the
software of the NILM’s to correctly identify GTM and GTG events. Furthermore the
proper location and number of NILM’s to be used must be determined. An example
question that addresses this concern is: should the number of NILM’s be increased, or
should their locations be altered instead?
3. Further analysis of the LP air system must be conducted. A detailed analysis of the LP
air system, including accurate pressure data during various GTM and GTG events, will
assist in clarifying many inconsistencies that have developed using the LPAC Load-
Unload interval data.
Ultimately, the NILM has the potential to provide large amounts of useful information
while relying on only a few key penetration points into the complex electro-mechanical systems
onboard US Navy ships. This is of significant value when viewed in light of the Navy’s drive
towards ship designs that use electricity for an increasingly larger number of functions. The
information, data, and analysis discussed in this thesis provide a short example of the power of
the NILM. From simple penetrations into the power feeds of the LBES LPAC, Fuel Oil pump,
and UEC, data was recorded and analyzed that in turn led to the detection of state changes of
systems electrically isolated from the initially targeted equipment. With additional information
from future NILM installations, a vast array of events can be identified and diagnosed.
79

List of Acronyms APU Auxiliary Power Unit BEA Base Enclosure Assembly EPCP Electric Plant Control Panel FIR Finite Impulse Response FSM Finite State Machine GTA Gas Turbine Assembly GTG Gas Turbine Generator GTM Gas Turbine Module LBES Land Based Engineering Site LPAC Low Pressure Air Compressor MRG Main Reduction Gear NILM Non-Intrusive Load Monitor PPAC Propulsion Plant and Auxiliaries Control RIMSS Rapid Independent Mechanical Starting System SCU Shaft Control Unit
80

(This Page Intentionally Left Blank)
81

List of References
[1] Ronald O’Rourke, “Electric Drive Propulsion for U.S. Navy Ships: Background and Issues for Congress”, Congressional Research Service, The Library of Congress, July 2000.
[2] Naval Studies Board Panel on Human Resources. “Technology for the United States
Navy and Marine Corps, 2000-2035 – Becoming a 21st Century Force, Volume 4 Human Resources”. National Academy Press. 1997.
[3] Robert J. Bost, James G. Mellis, Philip A. Dent. “Is the Navy Serious About Reducing
Manning on Its Ships?” Office of Naval Research Science and Technology Manning Affordability Program. 1999.
[4] Marcus Bengtsson. “Condition Based Maintenance Technology – Where is Development
Heading?” Proceedings of the 17th European Maintenance Congress. May 2004. [5] William C. Greene, “Evaluation of Non-Intrusive Monitoring for Condition Based
Maintenance Applications on US Navy Propulsion Plants”, MIT NSEE/S.M. ME thesis, June 2005.
[6] Thomas W. DeNucci, “Diagnostic Indicators for Shipboard Systems using Non-Intrusive
Load Monitoring”, MIT S.M OE/S.M ME thesis, June 2005. [7] J. Steven Ramsey, “Shipboard Applications of Non-Intrusive Load Monitoring”, MIT
NSEE/S.M. EECS thesis, June 2004. [8] Steven R. Shaw, C.R. Laughman, “A Kalman-Filter Spectral Envelope Preprocessor”,
Submitted for publication in IEEE Transactions on Instrumentation and Measurement. February 2004.
[9] L.K Norford and S.B. Leeb. 1996. “Nonintrusive Electrical Load Monitoring.” Energy
and Buildings, Vol. 24, pp. 51-64. [10] K.D. Lee, S.B. Leeb, L.K. Norford, P. Armstrong, J. Holloway and S.R. Shaw,
Estimation of Variable Speed Drive Power Consumption from Harmonic Content, Accpeted for publication , IEEE Transactions on Energy Conversion.
[11] S.R Shaw, D. Evangelista, S.B. Leeb, and C.R. Laughman, Nonintrusive Load
Monitoring and Identification in an Automotive Environment, Proceedings of ELECTRIMACS 1999, Lisbon, Portugal, pp. 199-204, September 1999.
[12] Naval Sea Systems Command, Technical Manual for LM2500 Propulsion Gas
Turbine Module, S9234-AD-MMO-010/LM2500, 26 May 2000.
82
[13] Naval Sea Systems Command, Technical Manual for Universal Engine Controller, S6263-B7-MMA-010, 25 November 2002 with Change A.
[14] United States Government Printing Office, USS ROOSEVELT (DDG-80)
Damage Control and Engineering Handbook, 2000. [15] Naval Sea Systems Command, Technical Manual for Air Compressor, Low
Pressure, Oil Free, S6220-DG-MMA-010/88663, 1 August 1989. [16] James Mosman, “Evaluation of Non-Intrusive Load Monitoring for Shipboard
Cycling System Diagnostics”, MIT NSEE/S.M. ME thesis, June 2006. [17] Naval Sea Systems Command, Technical Manual for Fuel Service Pump, S6226-
DE-MMA-010/07524, 09 May 1989 with Change D. [18] Conversation with Lee Skarbek, LBES Test Engineer, April 2006.
[19] George w. Hart, “Nonintrusive Appliance Load Monitoring”, Proceedings of the IEEE, December 1992, Vol. 80, Issue 12, pp. 1870-1891.
83

Appendix A. LBES Test Plan for Installment of UEC NILM on February 23, 2006
A. OBJECTIVE:
Evaluate the use of the non-intrusive load monitor (NILM) in detecting propulsion turbine 2A/2B control signals. The NILM will be left in place to allow for the collection of long term normal operating data.
B. BACKGROUND:
Following experiments on board the USCG Seneca and at the DDG-51 LBES, the NILM has been shown to be able to diagnose state changes in various mechanical systems. The power feed to the Universal Engine Controller (UEC) may contain information relevant to the diagnosis of specific control signals sent from the UEC to individual main propulsion turbines 2A and 2B, and thus be able to determine state changes in the propulsion turbines. C. PREREQUISTES:
1. Ensure NILM sensing box (NEMA-style enclosure) is constructed to monitor 115VAC / 3-phase power.
D. PRELIMINARY:
1. Read through the procedure in its entirety prior to beginning the test.
E. PROCEDURE:
1. Open breakers for 115 VAC / 3-phase power supplying Propulsion Turbine 2A UEC (labeled ‘IIEC’) at power panel 1-282-1. Danger Tag Open.
2. Open breakers for 115 VAC / 3-phase power supplying Propulsion Turbine 2B UEC (labeled ‘IIEC’) at power panel 1-282-1. Danger Tag Open.
3. Remove cover plate at power panel 1-282-1.
4. Lift the lead for one phase of Propulsion Turbine 2A UEC power. Thread the power cable through current transformer (type LM-55), and replace the lead.
5. Attach NILM voltage leads to remaining two phases of Propulsion Turbine 2A UEC power. This voltage sensing cable is rated for 600V.
6. Lift the lead for one phase of Propulsion Turbine 2B UEC power. Use the same phase (A, B or C) as in step (4) above. Thread the power cable through current transformer (type LM-55), and replace the lead. This is a second and identical, but separate transformer than the one used in step (4) above.
84

7. Route the two current transformer cables (steps 4 and 6) and the voltage sensing cable (step 5) through existing cutouts in the top of power panel 1-282-1 and into the NILM NEMA sensing box.
8. Connect current transformer and voltage cables in the NILM sensing box.
9. Close NILM sensing box.
10. Re-install cover plate for power panel 1-282-1.
11. Remove Danger Tags from breakers for 115 VAC / 3-phase power for Propulsion Turbine 2A and 2B UEC at power panel 1-282-1.
12. Shut breakers for 115 VAC / 3-phase power for Propulsion Turbine 2A and 2B UEC at power panel 1-282-1.
13. Plug in associated NILM PC and NILM sensing box to standard 120 VAC power outlet and start NILM acquisition software.
14. The NILM system is now ready to record data.
85

Appendix B. MATLAB Analysis Scripts B.1 Load-Unload Calculation Script %LOAD/UNLOAD CALCULATOR %DUNCAN MCKAY %APRIL 19, 2006 % %This code utilizes four functions: %on_off_detector.m %nilmconst_lpac.m %event_lpac.m %lu_computer.m % %This code will calculate load and unload times from a snapshot and then it %will plot them. %This is the executable script raw=load('20050418-160001.txt'); [events1,on_times1,off_times1]=on_off_detector(raw); [L1,U1]=lu_computer(events1); subplot(2,1,1) plot(on_times1*(1/120),L1*(1/120)); subplot(2,1,2); plot(off_times1(1:length(off_times1)-1)*(1/120),U1*(1/120));
86
function [events] = on_off_detector(x) y = medfilt1(x,3); x=y; clear y; nilmconst_lpac; b = fir1(FILTER_LENGTH,FILTER_CUTOFF); thresh = 1200; %GETEVENTS_THRESHOLD [ev,z] = event_lpac(x,b,thresh) if (mean(x(1:40))>=thresh) ev = ev(2:length(ev)) end events = zeros(2,length(ev)); ev; for j = 1:1:length(ev) change = mean(x(ev(j)+10:ev(j)+20))-mean(x(ev(j)-20:ev(j)-10)) ; if (change < 0) events(2,j) = -1; events(1,j) = ev(j); else events(2,j) = 1; events(1,j) = ev(j); end end new = []; for j=1:1:length(ev) if j == 1 if events(2,j) == 1 new = [new events(:,j)]; else if (events(1,2)-events(1,1)) > 1000 new = [new events(:,j)]; end end else if events(2,j) == 1 && events(2,j-1) == -1 %j if (events(1,j) - events(1,j-1)) < 1000 new = [new events(:,j)]; end end if events(2,j) == -1 && events(2,j-1) == 1 j;
87

new = [new events(:,j)]; end end end events = new; function [L,U] = lu_computer(events) L = []; U = []; y=diff(events(1,:)); if events(1,2) == 1 for i=1:1:length(y) if (rem(i,2) ~= 1) L = [L y(i)]; else U = [U y(i)]; end end else for i=1:1:length(y) if (rem(i,2) == 1) L = [L y(i)]; else U = [U y(i)]; end end end end
88
% Elementary Event Detector - Uses a simple FIR filter designed using fir1 % % Mark events in the incoming stream y. % function [e,y] = event(y,b,thres) nilmconst_lpac; if columns(y) > rows(y) y = y'; end; fy = filter(b,1,y); dy = y - fy; % find events -> make indicator variables. ify = find(abs(diff(abs(dy)>thres)) == 1); if (isempty(ify) == 1) e = []; y = []; return; end; % cluster e = ify(1); % Initializing e to first event location le = ify(1); % Last event location ee = 0; for i=2:length(ify) %if ify(i) > length(y)-100 % If an event is within the last 100 points, return a vector that % contains all of the points that follow it %y = y(ify(i):length(y)); %ee = 1; %break; %end; if ify(i) > le+GETEVENTS_SKIP % Mark an event only if a change is observed at least 50 points after % the last event. e = [e ify(i)]; le = ify(i); end; end; if ee == 0 y = []; end;
89
% % (C)opyright 1998, Steven R. Shaw % % % This file contains all the constants relative to the NILM. % The purpose is to make Octave and C code have uniform effects. % %%%%%%%%%%%%% global FINDAB_N CLAIM_APERATURE FILTER_LENGTH FILTER_CUTOFF STAGE_LENGTH ... OFFSET_RANGE MAX_SUBSECTIONS MAX_SUBSECTIONS GETEVENTS_SKIP GETEVENTS_LOCKOUT GETEVENTS_THRESHOLD ... N_DD N_EP N_HIT N_RECORD FINDAB_N = 20; CLAIM_APERATURE = 15; FILTER_LENGTH = 32; FILTER_CUTOFF = .1; STAGE_LENGTH = 1000; %%%%%%%%%%%%% OFFSET_RANGE = 5; MAX_SUBSECTIONS = 10; %%%%%%%%%%%%% GETEVENTS_LOCKOUT = FILTER_LENGTH; GETEVENTS_SKIP = 50; GETEVENTS_THRESHOLD = 400; %%%%%%%%%%%%% N_DD = 400; N_EP = 4000; N_HIT = 100; %N_RECORD = 256; N_RECORD = 600; %DC_NAMES = [ 'FINDAB_N'; 'CLAIM_APERATURE'; 'FILTER_LENGTH'; % % 'STAGE_LENGTH'; 'GETEVENTS_LOCKOUT'; 'GETEVENTS_SKIP'; 'N_DD' ; % % 'N_EP'; 'N_HIT'; 'N_RECORD'; 'GETEVENTS_THRESHOLD'; % % 'MAX_SUBSECTIONS'; 'OFFSET_RANGE'];
90

B.2 Fuel Oil Pump Filter Script %SNAPSHOT DATA PLOTTING CODE %DUNCAN MCKAY %AUGUST 22 2005 % %This code will plot pre-processed ("prep") data, %either the snapshots themselves, or load/unload times %extracted from the snapshots. This version contains elements to filter %data. % %This is the executable script clear; format compact; s=120; %Sampling frequency for pre-processed data a=load('fo-20050418-190001.txt'); load b.mat; x=1:length(a); %For ease of plotting, an examination point is used. The examination point %is the time, in minutes, when a specific event (motor, start, etc.) %occurred. ep=46; %Examination point subplot(2,1,1); plot(x/(s*60),a);%unfiltered xlabel('Time (min)'); ylabel('Power (counts)'); axis([ep-5 ep+5 3500 6500]); y=filter(b,1,a) ;subplot(2,1,2); plot(x/(s*60),y);%filtered xlabel('Time (min)'); ylabel('Power (counts)'); axis([ep-5 ep+5 3500 6500]); elements of b.mat 0.0002 0.0002 0.0002 -0.0001 -0.0006 -0.0014 -0.0025 -0.0038 -0.0052 -0.0064 -0.0071 -0.0069 -0.0055 -0.0026 0.0022 0.0089 0.0174 0.0276 0.0389 0.0508 0.0624 0.0730 0.0817 0.0880 0.0913
0.0913 0.0880 0.0817 0.0730 0.0624 0.0508 0.0389 0.0276 0.0174 0.0089 0.0022 -0.0026 -0.0055 -0.0069 -0.0071 -0.0064 -0.0052 -0.0038 -0.0025 -0.0014 -0.0006 -0.0001 0.0002 0.0002 0.0002
91
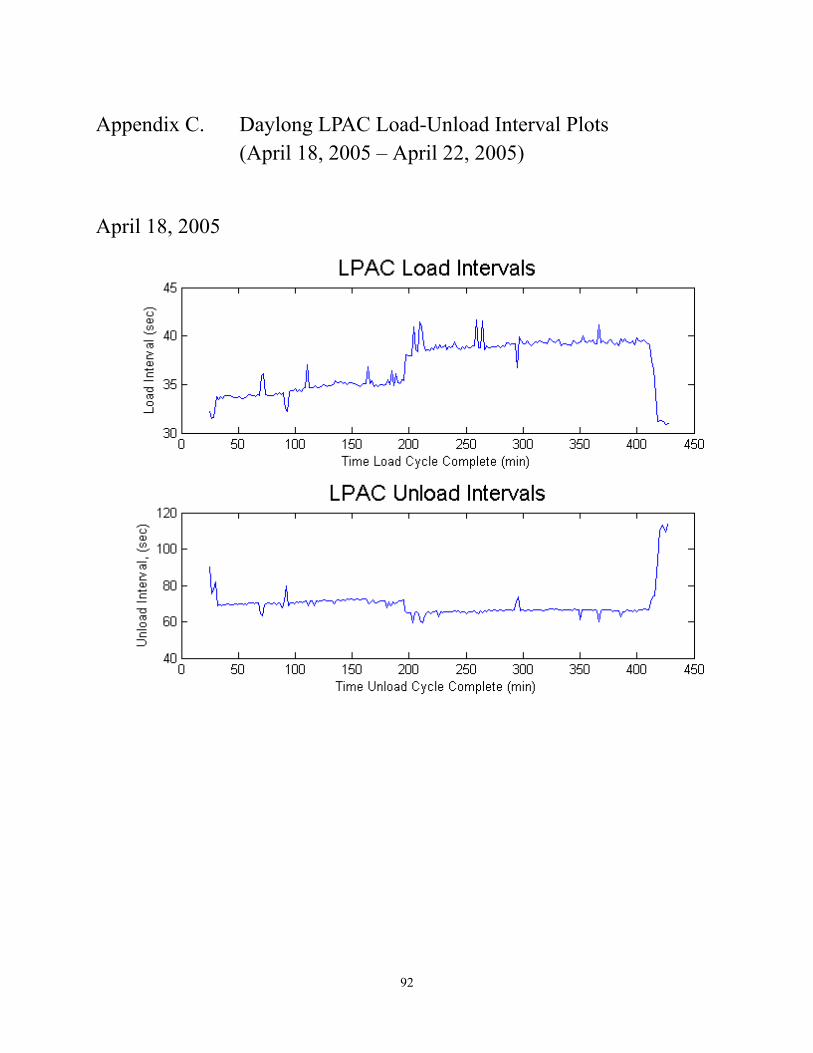
Appendix C. Daylong LPAC Load-Unload Interval Plots (April 18, 2005 – April 22, 2005) April 18, 2005
92

April 19, 2005
93
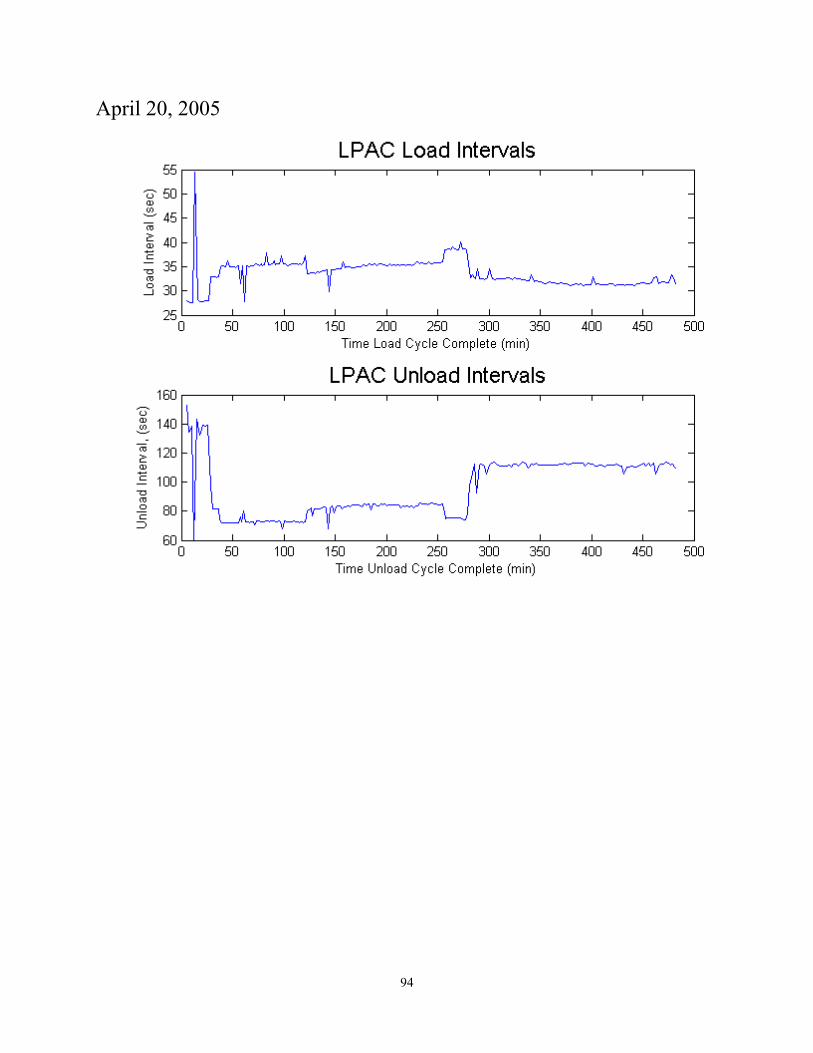
April 20, 2005
94
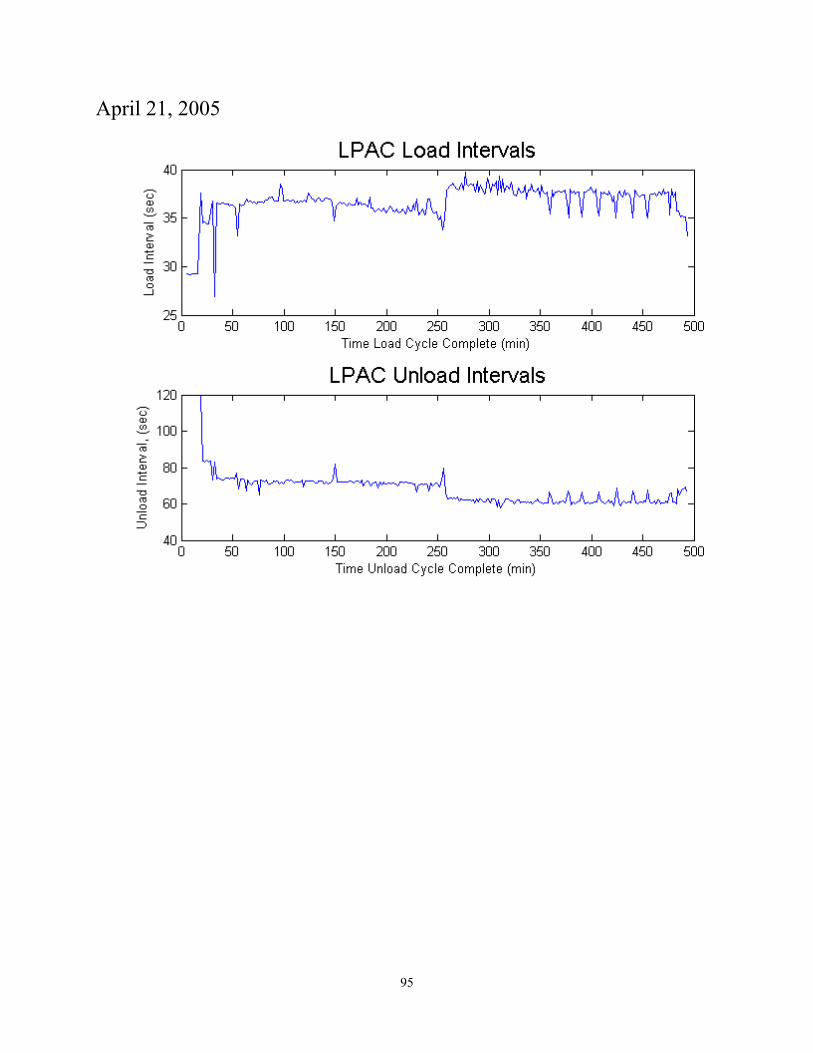
April 21, 2005
95
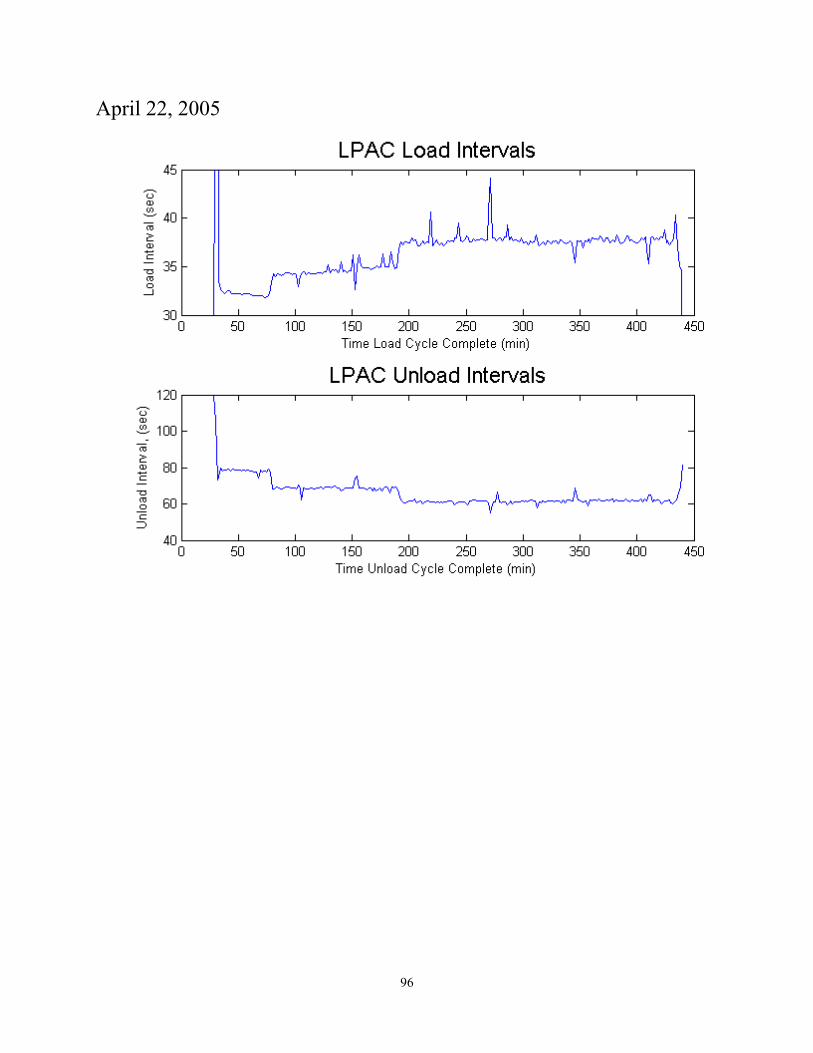
April 22, 2005
96

Appendix D. LBES System Schematics
97

98

99
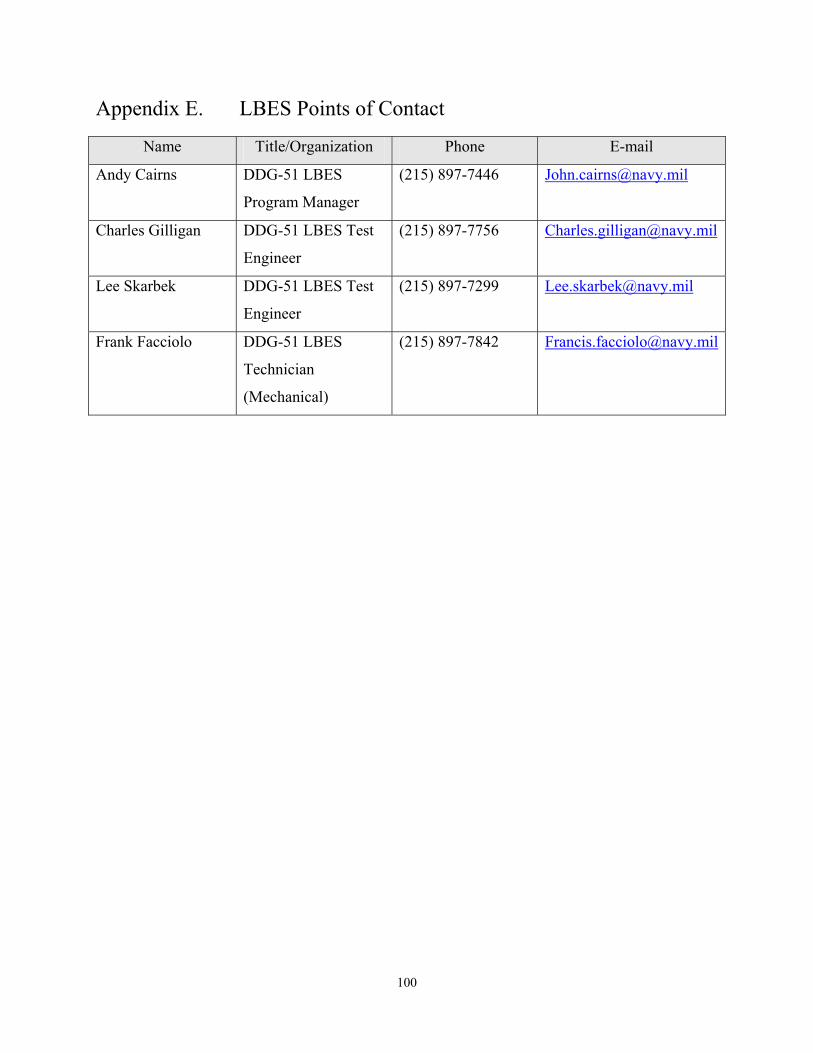
Appendix E. LBES Points of Contact
Name Title/Organization Phone E-mail
Andy Cairns DDG-51 LBES
Program Manager
(215) 897-7446 [email protected]
Charles Gilligan DDG-51 LBES Test
Engineer
(215) 897-7756 [email protected]
Lee Skarbek DDG-51 LBES Test
Engineer
(215) 897-7299 [email protected]
Frank Facciolo DDG-51 LBES
Technician
(Mechanical)
(215) 897-7842 [email protected]
100