Coiling of an intracerebral aneurysm. Radiologist notifies ...
1
Diagnose like a Radiologist: Attention GuidedConvolutional Neural Network for Thorax Disease
ClassificationQingji Guan, Yaping Huang, Zhun Zhong, Zhedong Zheng, Liang Zheng and Yi Yang
Abstract—This paper considers the task of thorax disease clas-sification on chest X-ray images. Existing methods generally usethe global image as input for network learning. Such a strategyis limited in two aspects. 1) A thorax disease usually happensin (small) localized areas which are disease specific. TrainingCNNs using global image may be affected by the (excessive)irrelevant noisy areas. 2) Due to the poor alignment of some CXRimages, the existence of irregular borders hinders the networkperformance. In this paper, we address the above problems byproposing a three-branch attention guided convolution neuralnetwork (AG-CNN). AG-CNN 1) learns from disease-specificregions to avoid noise and improve alignment, 2) also integratesa global branch to compensate the lost discriminative cues bylocal branch. Specifically, we first learn a global CNN branchusing global images. Then, guided by the attention heat mapgenerated from the global branch, we inference a mask to cropa discriminative region from the global image. The local regionis used for training a local CNN branch. Lastly, we concatenatethe last pooling layers of both the global and local branches forfine-tuning the fusion branch. The comprehensive experiment isconducted on the ChestX-ray14 dataset. We first report a strongglobal baseline producing an average AUC of 0.841 with ResNet-50 as backbone. After combining the local cues with the globalinformation, AG-CNN improves the average AUC to 0.868. WhileDenseNet-121 is used, the average AUC achieves 0.871, which isa new state of the art in the community.
Index Terms—chest X-ray, convolutional neural network, tho-rax disease classification, visual attention
I. INTRODUCTION
THE chest X-ray (CXR) has been one of the mostcommon radiological examinations in lung and heart
disease diagnosis. Currently, reading CXRs mainly relies onprofessional knowledge and careful manual observation. Dueto the complex pathologies and subtle texture changes of dif-ferent lung lesion in images, radiologists may make mistakeseven when they have experienced long-term clinical trainingand professional guidance. Therefore, it is of importance todevelop the CXR image classification methods to support
Q. Guan is with the Beijing Key Laboratory of Traffic Data Analysisand Mining, Beijing Jiaotong University, Beijing, 100044, China and Centerfor Artificial Intelligence, University of Technology Sydney, NSW, 2007,Australia (E-mail: [email protected]).
Y. Huang is with the Beijing Key Laboratory of Traffic Data Analysisand Mining, Beijing Jiaotong University, Beijing, 100044, China (E-mail:[email protected]).
Z. Zhong is with Cognitive Science Department, Xiamen University andCenter for Artificial Intelligence, University of Technology Sydney, NSW,2007, Australia (E-mail: [email protected]).
Z. Zheng, L. Zheng, Y. Yang are with Center for Artificial Intelligence,University of Technology Sydney, NSW, 2007, Australia (E-mail: {zdzheng12,liangzheng06, yee.i.yang}@gmail.com).
clinical practitioners. The noticeable progress in deep learninghas benefited many trials in medical image analysis, such aslesion segmentation or detection [1], [2], [3], [4], [5], diseasesclassification [6], [7], [8], [9], noise induction [10], imageannotation [11], [12], registration [13], regression [14] and soon. In this paper, we investigate the CXR classification taskusing deep learning.
Several existing works on CXR classification typi-cally employ the global image for training. For example,Wang et al. [9] evaluate four classic CNN architectures,i.e., AlexNet [15], VGGNet [16], GoogLeNet [17], ResNet[18], to tell the presence of multiple pathologies using aglobal CXR image. In addition, using the same network,the disease lesion areas are located in a weakly supervisedmanner. Viewing CXR classification as a multi-label recogni-tion problem, Yao et al. [19] explore the correlation amongthe 14 pathologic labels with global images in ChestX-ray14[9]. Using a variant of DenseNet [20] as an image encoder,they adopt the Long-short Term Memory Networks (LSTM)[21] to capture the dependencies. Kumar et al. [7] investigatethat which loss function is more suitable for training CNNsfrom scratch and present a boosted cascaded CNN for globalimage classification. The recent effective method consists inCheXNet [8]. It fine-tunes a 121-layer DenseNet on the globalchest X-ray images, which has a modified last fully-connectedlayer.
However, the global learning strategy can be compromisedby two problems. On the one hand, as shown in Fig. 1 (thefirst row), the lesion area can be very small (red bounding box)and position unpredictable (e.g. , “Atelectasis”) compared withthe global image, so using the global image for classificationmay include a considerable level of noise outside the lesionarea. This problem is rather different from generic imageclassification [22], [23] where the object of interest is usuallypositioned in the image center. Considering this fact, it isbeneficial to induce the network to focus on the lesion regionswhen making predictions. On the other hand, due to thevariations of capturing condition, e.g. , the posture of thepatient and the small size of children body, the CXR imagesmay undergo distortion or misalignment. Fig. 1 (the secondrow) presents a misalignment example. The irregular imageborders may exist an non-negligible effect on the classificationaccuracy. Therefore, it is desirable to discover the salient lesionregions and thus alleviate the impact of such misalignment.
To address the problems caused by merely relying onthe global CXR image, this paper introduces a three-branch
arX
iv:1
801.
0992
7v1
[cs
.CV
] 3
0 Ja
n 20
18
2
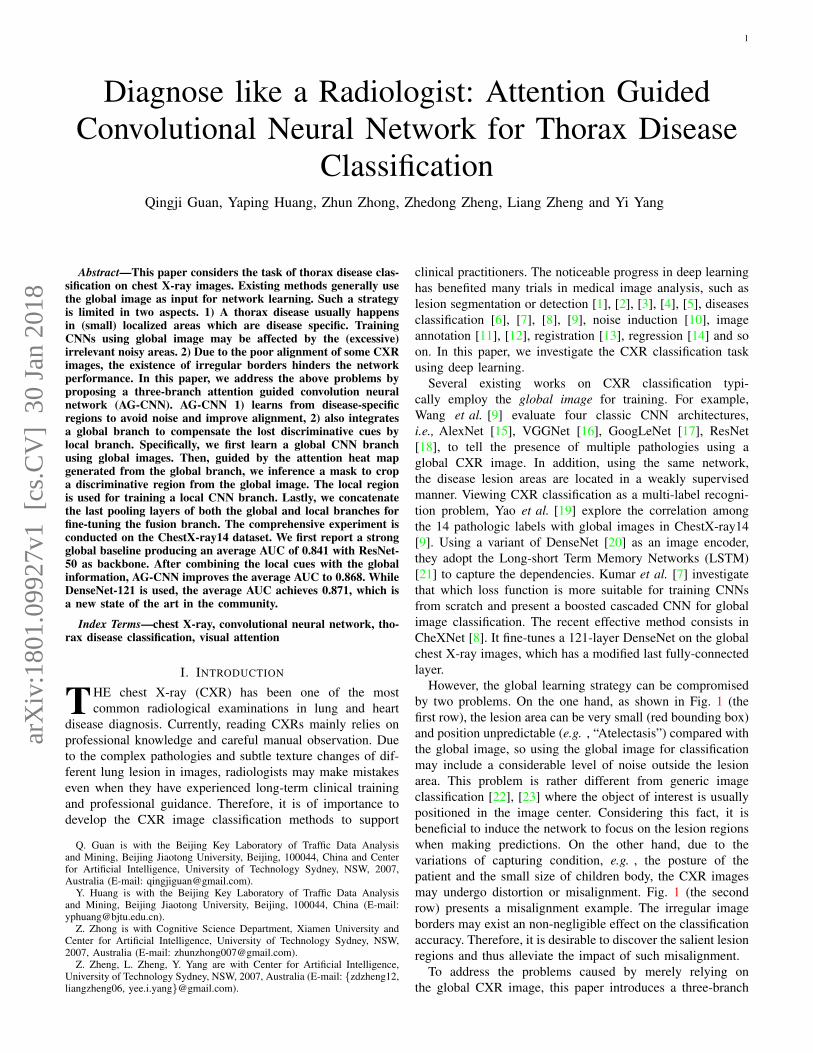
(a) original global image (b) heatmap (c) cropped local image
Fig. 1. Two training images from the ChestX-ray14 dataset. (a) The globalimages. (b) Heat maps extracted from a specific convolutional layer. (c) Thecropped images from (a) guided by (b). In this paper, we consider boththe original global image and the cropped local image for classification, sothat 1) the noise contained in non-lesion area is less influencing, and 2) themisalignment can be reduced. Note that there are some differences betweenthe global images and their heat maps. The reason is that the global imagesare randomly cropped from 256×255 to 224×224 during training.
attention guided convolutional neural network (AG-CNN) toclassify the lung or heart diseases. AG-CNN is featured in twoaspects. First, it has a focus on the local lesion regions whichare disease specific. Generally, such a strategy is particularlyeffective for diseases such as ”Nodule”, which has a smalllesion region. In this manner, the impact of the noise in non-disease regions and misalignment can be alleviated. Second,AG-CNN has three branches, i.e., a global branch, a localbranch and a fusion branch. While the local branch exhibits theattention mechanism, it may lead to information loss in caseswhere the lesion areas are distributed in the whole images,such as Pneumonia. Therefore, a global branch is needed tocompensate for this error. We show that the global and localbranches are complementary to each other and, once fused,yield favorable accuracy to the state of the art.
The working mechanism of AG-CNN is similar to that of aradiologist. We first learn a global branch that takes the globalimage as input: a radiologist may first browse the whole CXRimage. Then, we discover and crop a local lesion region andtrain a local branch: a radiologist will concentrate on the locallesion area after the overall browse. Finally, the global andlocal branches are fused to fine-tune the whole network: aradiologist will comprehensively consider the global and localinformation before making decisions.
Our contributions are summarized as follows.
• We propose an attention guided convolutional neuralnetwork (AG-CNN) which diagnoses thorax diseases bycombining the global and local information. AG-CNNimproves the recognition performance by correcting im-age alignment and reducing the impact of noise.
• We introduce a CNN training baseline, which producescompetitive results to the state-of-the-art methods byitself.
• We present comprehensive experiment on the ChestX-ray14 dataset. The experiment results demonstrate that
our method achieves superior performance over the state-of-the-art approaches.
II. RELATED WORKS
Chest X-ray datasets. The problem of Chest X-ray imageclassification has been extensively explored in the field ofmedical image analysis. Several datasets have been releasedin this context. For example, the JSRT dataset [24], [25]contains 247 chest X-ray images including 154 lung nodules.It also provides masks of the lung area for segmentationperformance evaluation. The Shenzhen chest X-ray set [26]has a total of 662 images belonging to two categories (normaland tuberculosis (TB)). Among them, 326 are normal casesand 336 are cases with TB. The Montgomery County chestX-ray set (MC) [26] collects 138 frontal chest X-ray imagesfrom Montgomery Country’s Tuberculosis screen program, ofwhich 80 are normal and 58 are cases with manifestations ofTB. These three datasets are generally small for deep modeltraining. In comparison, the Indiana University Chest X-rayCollection dataset [27] has of 3,955 radiology reports andthe corresponding 7,470 chest X-ray images. It is publiclyavailable through Open-I [28]. However, this dataset does notprovide explicit disease class labels, so we do not use it in thispaper. Recently, Wang et al. [9] released the ChestX-ray14dataset, which is the largest chest X-ray dataset by far. ChestX-ray14 collects 112,120 frontal-view chest X-ray images of30,805 unique patients. Each radiography is labeled with oneor more types of 14 common thorax diseases. This datasetposes a multi-label classification problem and is large enoughfor deep learning, so we adopt this dataset for performanceevaluation in this paper.
Deep learning for chest X-ray image analysis. Recentsurveys [29], [30], [31], [32] have demonstrated that deeplearning technologies have been extensively applied to thefield of chest X-ray image annotation [33], classification [6],[34], [8], [9], and detection (localization) [35], [36]. Islamet al. [34] explore different CNN architectures and find that asingle CNN does not perform well across all abnormalities.Therefore, they leverage model ensemble to improve theclassification accuracy, at the cost of increased training andtesting time. Yao et al. [19] and Kumar et al. [7] classify thechest X-ray images by investigating the potential dependenciesamong the labels from the aspect of multi-label problems.Rajpurkar et al. [8] train a convolutional neural network toaddress the multi-label classification problem. This paperdeparts from the previous methods in that we make use of theattention mechanism and fuse the local and global informationto improve the classification performance.
Attention models in medical image analysis. The CXRclassification problem needs to tell the relatively subtle differ-ences between different diseases. Usually, a disease is oftencharacterized by a lesion region, which contains critical duesfor classification. Ypsilantis et al. [37] explore where to lookin chest X-rays with recurrent attention model (RAM) [38].The RAM learns to sample the entire X-ray image sequentiallyand focus on informative areas. Only one disease enlargedheart is considered in their work. Recently, Pesce et al. [39]
3
crop
loss
+X
112*112*64
pooling
fc
mask
sigmoidInput/224*224*3
concatBCE
BCE
Global Branch
Local Branch
Mask Inference
heatmap
Fusion Branch
BCE
ResB
lock
ResB
lock
ResB
lock
ResB
lock
conv
ResB
lock
ResB
lock
ResB
lock
ResB
lock
con
v
56*56*256 28*28*512 14*14*1024 7*7*2048
[xmin, ymin, xmax, ymax]
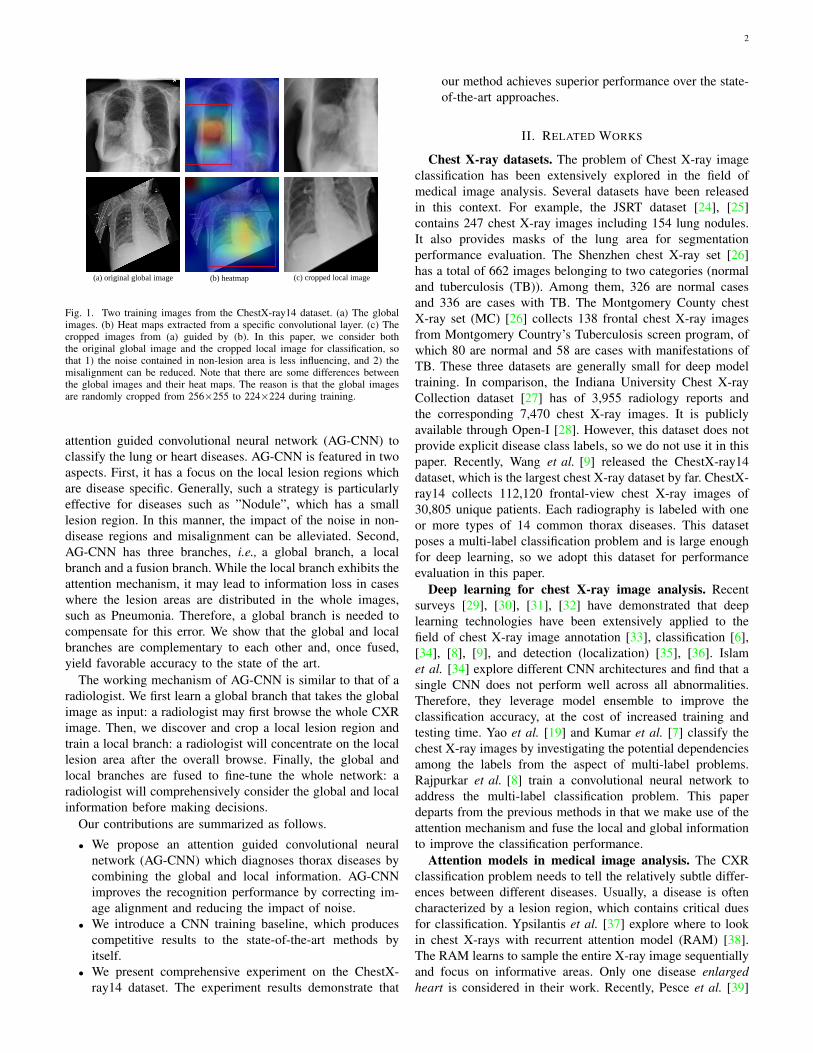
Fig. 2. Overall framework of the attention guided convolutional neural network (AG-CNN). We show an example with ResNet-50 as backbone. AG-CNNconsists of three branches. Global and local branches consist of five convolutional blocks with batch normalization and ReLU. Each of them is then connectedto a max pooling layer (Pool5), a fully connected (FC) layer, and a sigmoid layer. Different from the global branch, the input of the local branch is a locallesion patch which is cropped by the mask generated from global branch. Then, Pool5 layers of the these two branches are concatenated into the fusionbranch. ”BCE” represents binary cross entropy loss. The input image is added to the heat map for visualization.
explore a soft attention mechanism from the saliency map ofCNN features to locate lung nodule position in radiographies.And a localization loss is calculated by comparing the pre-dicted position with the annotated position.
In this paper, AG-CNN locates the salient regions withan attention guided mask inference process, and learns thediscriminative feature for classification. Compared with themethod which relies on bounding box annotations, Our methodonly need image-level labels without any extra information.
III. THE PROPOSED APPROACH
In this section, we describe the proposed attention guidedconvolutional neural network (AG-CNN) for thorax diseaseclassification. We will first illustrate the architecture of AG-CNN in Section III-A. Second, we describe the mask inferenceprocess for lesion region discovery in Section III-B. We thenpresent the training process of AG-CNN in Section III-C.Finally, a brief discussion of the AG-CNN is provided.
A. Structure of AG-CNN
The architecture of AG-CNN is presented in Fig. 2. Ba-sically, it has two major branches, i.e., the global and localbranches, and a fusion branch. Both the global and localbranches are classification networks that predict whether thepathologies are present or not in the image. Given an image,the global branch is first fine-tuned from a classification CNNusing the global image. Then, we crop an attended regionfrom the global image and train it for classification on thelocal branch. Finally, the last pooling layers of both the globaland local branches are concatenated for fine-tuning the fusionbranch.
Multi-label setup. We label each image with a 15-dimvector L = [l1, l2, ..., lC ] in which lc ∈ {0, 1}, C = 15.
lc represents whether the there is any pathology, i.e., 1 forpresence and 0 for absence. The last element of L representsthe label with ”No Finding”.
Global and local branches. The global branch informs theunderlying CXR information derived from the global imageas input. In the global branch, we train a variant of ResNet-50[18] as the backbone model. It consists of five down-samplingblocks, followed by a global max pooling layer and a 15-dimensional fully connected (FC) layer for classification. Atlast, a sigmoid layer is added to normalize the output vectorpg(c|I) of FC layer by
pg(c|I) = 1/(1 + exp(−p(c|I))), (1)
where I is the global image. pg(c|I) represents the probabilityscore of I belonging to the cth class, c ∈ {1, 2, ..., C}. Weoptimize the parameter Wg of global branch by minimizingthe binary cross-entropy (BCE) loss:
L(Wg) = −1
C
C∑c=1
lclog(pg(c|I)) + (1− lc)log(1− pg(c|I)),
(2)where lc is the groundtruth label of the cth class, C is thenumber of pathologies.
On the other hand, the local branch focuses on the lesionarea and is expected to alleviate the drawbacks of only usingthe global image. In more details, the local branch possessesthe same convolutional network structure with the globalbranch. Note that, these two branches do not share weightssince they have distinct purposes. We denote the probabilityscore of local branch as pl(c|Ic), Wl as the parameters oflocal branch. Here, Ic is the input image of local branch. Weperform the same normalization and optimization as the globalbranch.
4
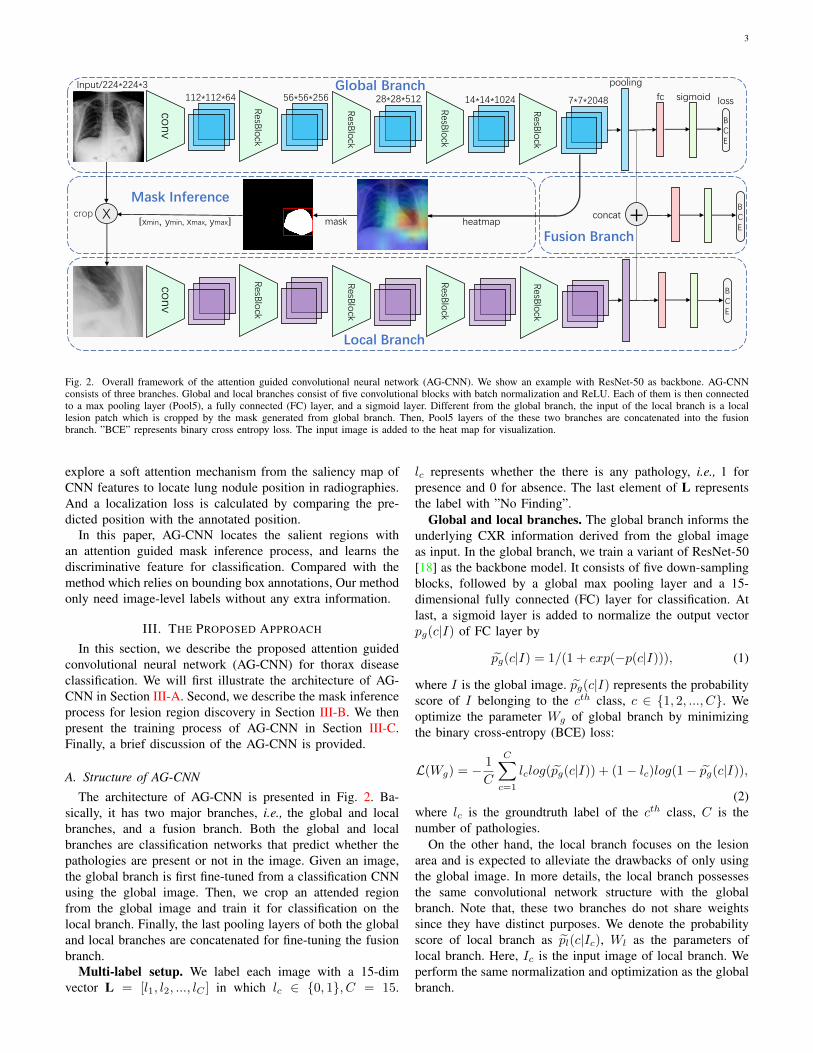
Fig. 3. The process of lesion area generation. (Top:) global CXR images of various thorax diseases for the global branch. The manually annotated legionareas provided by [9] are annotated with red bounding boxes. Note that we do not use the bounding boxes for training or testing. (Middle:) correspondingvisual examples of the output of the mask inference process. The lesion areas are denoted by green bounding boxes. Higher response is denoted with red,and lower blue. Note that the heat maps are resized to the same size as the input images. (Bottom:) cropped and resized images from the green boundingboxes which are fed to the local branch.
Algorithm 1: Attention Guided CNN ProcedureInput: Input image I; Label vector L; Threshold τ .Output: Probability score pf (c|[I, Ic]).Initialization: the global and local branch weights.
1 Learning Wg with I , computing pg(c|I), optimizing byEq. 2 (Stage I);
2 Computing mask M and the bounding box coordinates[xmin, ymin, xmax, ymax], cropping out Ic from I;
3 Learning Wl with Ic, computing pl(c|Ic), optimizing byEq. 2 (Stage II);
4 Concentrating Poolg and Pooll, learning Wf , computingpf (c|[I, Ic]), optimizing by Eq. 2.
Fusion branch. The fusion branch first concatenates thePool5 outputs of the global and local branches. The concate-nated layer is connected to a 15-dimensional FC layer for finalclassification. The probability score is pf (c|[I, Ic]). We denoteWf as the parameters of fusion branch and optimize Wf byEq. 2.
B. Attention Guided Mask Inference
In this paper, we construct a binary mask to locate thediscriminative regions for classification in the global image.It is produced by performing thresholding operations on thefeature maps, which can be regarded as an attention process.This process is described below.
Given a global image, let fkg (x, y) represent the activationof spatial location (x, y) in the kth channel of the output ofthe last convolutional layer, where k ∈ {1, ...,K}, K = 2, 048in ResNet-50. g denotes the global branch. We first take theabsolute value of the activation values fkg (x, y) at position(x, y). Then the attention heat map Hg is generated bycounting the maximum values along channels,
Hg(x, y) = maxk
(|fkg (x, y)|), k ∈ {1, ...,K}. (3)
The values in Hg directly indicate the importance of theactivations for classification. In Fig. 1(b) and Fig. 3 (thesecond row), some examples of the heat maps are shown.We observe that the discriminative regions (lesion areas)of the images are activated. Heat map can be constructedby computing different statistical values across the channeldimensions, such as L1 distance 1
K
∑Kk=1 |fkg (x, y)| or L2
distance 1K
√∑Kk=1(f
kg (x, y))
2. Different statistics result insubtle numerical differences in heat map, but may not effectthe classification significantly. Therefore, we computing heatmap with Eq. 3 in our experiment. The comparison of thesestatistics is presented in Section IV-C.
We design a binary mask M to locate the regions withlarge activation values. If the value of a certain spatial position(x, y) in the heat map is larger than a threshold τ , the valueat corresponding position in the mask is assigned with 1.Specifically,
M(x, y) =
{1, Hg(x, y) > τ
0, otherwise(4)
where τ is the threshold that controls the size of attended re-gion. A larger τ leads to a smaller region, and vice versa. Withthe mask M , we draw a maximum connected region that cov-ers the discriminative points in M . The maximum connectedregion is denoted as the minimum and maximum coordinatesin horizontal and vertical axis [xmin, ymin, xmax, ymax]. Atlast, the local discriminative region Ic is cropped from theinput image I and is resized to the same size as I . We visualizethe bounding boxes and cropped patches with τ = 0.7 inFig. 3. The attention informed mask inference method isable to locate the regions (green bounding boxes) which arereasonably close to the groundtruth (red bounding boxes).
C. Training Strategy of AG-CNNThis paper adopts a three-stage training scheme for AG-
CNN.

5
Atelectasis Cardiomegaly Effusion Infiltrate Mass Nodule Pneumonia Pneumothorax
Fig. 4. Examples of 8 pathologies in ChestX-ray14. The lesion regions are annotated with the red bounding boxes provided by [9]. Note that these groundtruthbounding boxes are only used for demonstration: they are neither used in training nor testing.
TABLE ICOMPARISON RESULTS OF VARIOUS METHODS ON CHESTX-RAY14.
Method CNN Atel Card Effu Infi Mass Nodu Pne1 Pne2 Cons Edem Emph Fibr PT Hern MeanWang et al. [9] R-50 0.716 0.807 0.784 0.609 0.706 0.671 0.633 0.806 0.708 0.835 0.815 0.769 0.708 0.767 0.738Yao et al. [19] D-/ 0.772 0.904 0.859 0.695 0.792 0.717 0.713 0.841 0.788 0.882 0.829 0.767 0.765 0.914 0.803Rajpurkar et al. [8]∗ D-121 0.821 0.905 0.883 0.720 0.862 0.777 0.763 0.893 0.794 0.893 0.926 0.804 0.814 0.939 0.842Kumar et al. [7]∗ D-161 0.762 0.913 0.864 0.692 0.750 0.666 0.715 0.859 0.784 0.888 0.898 0.756 0.774 0.802 0.795Global branch (baseline) R-50 0.818 0.904 0.881 0.728 0.863 0.780 0.783 0.897 0.807 0.892 0.918 0.815 0.800 0.889 0.841Local branch R-50 0.798 0.881 0.862 0.707 0.826 0.736 0.716 0.872 0.805 0.874 0.898 0.808 0.770 0.887 0.817AG-CNN R-50 0.844 0.937 0.904 0.753 0.893 0.827 0.776 0.919 0.842 0.919 0.941 0.857 0.836 0.903 0.868Global branch (baseline) D-121 0.832 0.906 0.887 0.717 0.870 0.791 0.732 0.891 0.808 0.905 0.912 0.823 0.802 0.883 0.840Local branch D-121 0.797 0.865 0.851 0.704 0.829 0.733 0.710 0.850 0.802 0.882 0.874 0.801 0.769 0.872 0.810AG-CNN D-121 0.853 0.939 0.903 0.754 0.902 0.828 0.774 0.921 0.842 0.924 0.932 0.864 0.837 0.921 0.871
* We compute the AUC of each class and the average AUC across the 14 diseases. ∗ denotes that a different train/test split is used: 80% for training and the rest 20% fortesting. All the Other methods split the dataset with 70% for training, 10% for validation and 20% for testing. Each pathology is denoted with its first four characteristics,e.g., Atelectasis with Atel. Pneumonia and Pneumothorax are denoted as Pneu1 and Pneu2, respectively. PT represents Pleural Thickening. We report the performancewith parameter τ = 0.7. ResNet-50 (R-50) and Desnet-121 (D-121) are used as backbones in our approach. For each column, the best and second best results arehighlighted in red and blue, respectively.
Stage I. Using the global images, we fine-tune the globalbranch network pretrained by ImageNet. pg(c|I) is normalizedby Eq. 1.
Stage II. Once the local image Ic is obtained by maskinference with threshold τ , we feed it into the local branchfor fine-tuning. pl(c|Ic) is also normalized by Eq. 1. Whenwe fine-tune the local branch, the weights in the global branchare fixed.
Stage III. Let Poolg and Pooll represent the Pool5 layeroutputs of the global and local branches, respectively. Weconcatenate them for a final stage of fine-tuning and normalizethe probability score pf (c|[I, Ic]) by Eq. 1. Similarly, theweights of previous two branches are fixed when we fine-tunethe weights of fusion branch.
In each stage, we use the model with the highest AUC onthe validation set for testing. The overall AG-CNN trainingprocedure is presented in Algorithm 1. Variants of trainingstrategy may influence the performance of AG-CNN. Wediscussed it in Section IV-C.
IV. EXPERIMENT
This section evaluates the performance of the proposedAG-CNN. The experimental dataset, evaluation protocol andthe experimental settings are introduced first. Section IV-Cdemonstrates the performance of global and local branches
and the effectiveness of fusing them. Furthermore, comparisonof AG-CNN and the state of the art is presented in Table. I.In Section. IV-D, we analyze the parameter impact in maskinference.
A. Dataset and Evaluation Protocol
Dataset. We evaluate the AG-CNN framework using theChestX-ray141 dataset [9]. ChestX-ray14 collects 112,120frontal-view images of 30,805 unique patients. 51,708 imagesof them are labeled with up to 14 pathologies, while the othersare labeled as “No Finding”. Fig. 4 presents some examplesof 8 out of 14 thorax diseases and the ground-truth boundingboxes of the lesion regions provided by [9]. We observe thatthe size of the lesion area varies a lot for different pathologies.
Evaluation protocol. In our experiment, we randomlyshuffle the dataset into three subsets: 70% for training, 10%for validation and 20% for testing. Each image is labeled witha 15-dim vector L = [l1, l2, ..., lC ] in which yc ∈ {0, 1}, C =15. l15 represents the label with ”No Finding”.
B. Experimental Settings
For training (any of the three stages), we perform dataaugmentation by resizing the original images to 256 × 256,
1https://nihcc.app.box.com/v/ChestXray-NIHCC
6
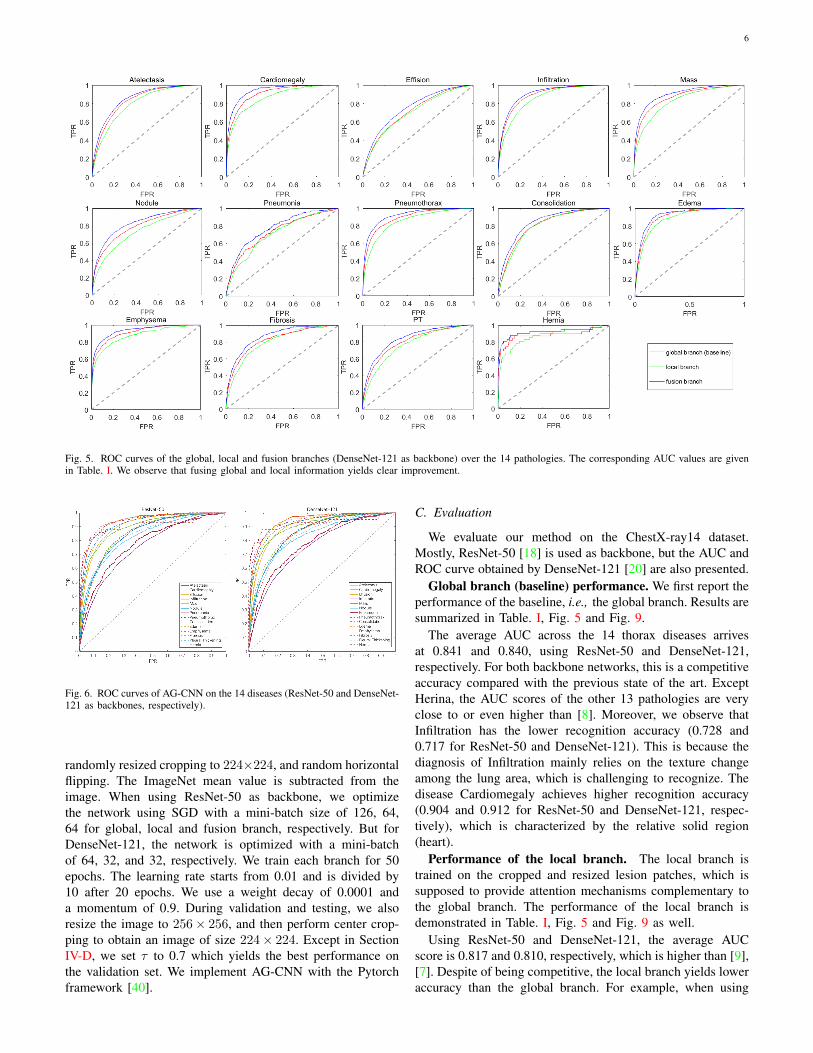
Fig. 5. ROC curves of the global, local and fusion branches (DenseNet-121 as backbone) over the 14 pathologies. The corresponding AUC values are givenin Table. I. We observe that fusing global and local information yields clear improvement.
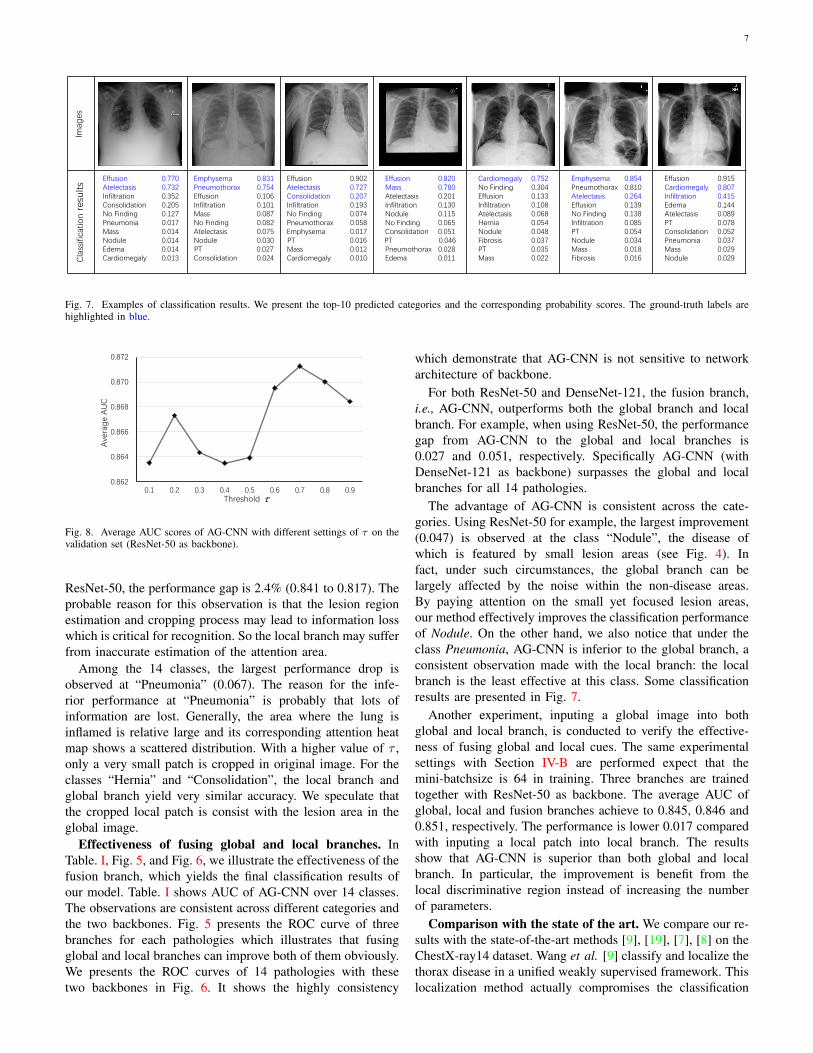
Fig. 6. ROC curves of AG-CNN on the 14 diseases (ResNet-50 and DenseNet-121 as backbones, respectively).
randomly resized cropping to 224×224, and random horizontalflipping. The ImageNet mean value is subtracted from theimage. When using ResNet-50 as backbone, we optimizethe network using SGD with a mini-batch size of 126, 64,64 for global, local and fusion branch, respectively. But forDenseNet-121, the network is optimized with a mini-batchof 64, 32, and 32, respectively. We train each branch for 50epochs. The learning rate starts from 0.01 and is divided by10 after 20 epochs. We use a weight decay of 0.0001 anda momentum of 0.9. During validation and testing, we alsoresize the image to 256× 256, and then perform center crop-ping to obtain an image of size 224× 224. Except in SectionIV-D, we set τ to 0.7 which yields the best performance onthe validation set. We implement AG-CNN with the Pytorchframework [40].
C. Evaluation
We evaluate our method on the ChestX-ray14 dataset.Mostly, ResNet-50 [18] is used as backbone, but the AUC andROC curve obtained by DenseNet-121 [20] are also presented.
Global branch (baseline) performance. We first report theperformance of the baseline, i.e., the global branch. Results aresummarized in Table. I, Fig. 5 and Fig. 9.
The average AUC across the 14 thorax diseases arrivesat 0.841 and 0.840, using ResNet-50 and DenseNet-121,respectively. For both backbone networks, this is a competitiveaccuracy compared with the previous state of the art. ExceptHerina, the AUC scores of the other 13 pathologies are veryclose to or even higher than [8]. Moreover, we observe thatInfiltration has the lower recognition accuracy (0.728 and0.717 for ResNet-50 and DenseNet-121). This is because thediagnosis of Infiltration mainly relies on the texture changeamong the lung area, which is challenging to recognize. Thedisease Cardiomegaly achieves higher recognition accuracy(0.904 and 0.912 for ResNet-50 and DenseNet-121, respec-tively), which is characterized by the relative solid region(heart).
Performance of the local branch. The local branch istrained on the cropped and resized lesion patches, which issupposed to provide attention mechanisms complementary tothe global branch. The performance of the local branch isdemonstrated in Table. I, Fig. 5 and Fig. 9 as well.
Using ResNet-50 and DenseNet-121, the average AUCscore is 0.817 and 0.810, respectively, which is higher than [9],[7]. Despite of being competitive, the local branch yields loweraccuracy than the global branch. For example, when using
7
Imag
esC
lass
ifica
tio
nre
sults
Effusion 0.770Atelectasis 0.732Infiltration 0.352Consolidation 0.205No Finding 0.127Pneumonia 0.017Mass 0.014Nodule 0.014Edema 0.014Cardiomegaly 0.013
Emphysema 0.831Pneumothorax 0.754Effusion 0.106Infiltration 0.101Mass 0.087No Finding 0.082Atelectasis 0.075Nodule 0.030PT 0.027Consolidation 0.024
Effusion 0.902Atelectasis 0.727Consolidation 0.207Infiltration 0.193No Finding 0.074Pneumothorax 0.058Emphysema 0.017PT 0.016Mass 0.012Cardiomegaly 0.010
Effusion 0.820Mass 0.780Atelectasis 0.201Infiltration 0.130Nodule 0.115No Finding 0.065Consolidation 0.051PT 0.046Pneumothorax 0.028Edema 0.011
Cardiomegaly 0.752No Finding 0.304Effusion 0.133Infiltration 0.108Atelectasis 0.068Hernia 0.054Nodule 0.048Fibrosis 0.037PT 0.035Mass 0.022
Emphysema 0.854Pneumothorax 0.810Atelectasis 0.264Effusion 0.139No Finding 0.138Infiltration 0.085PT 0.054Nodule 0.034Mass 0.018Fibrosis 0.016
Effusion 0.915Cardiomegaly 0.807Infiltration 0.415Edema 0.144Atelectasis 0.089PT 0.078Consolidation 0.052Pneumonia 0.037Mass 0.029Nodule 0.029
00029705_006Atelectasis|Consolidation
00028330_008Emphysema|Pneumothorax
00023091_005Effusion|Mass
00022310_008Atelectasis|Infiltration
00020070_001Atelectasis|Emphysema
00000211_005 Cardiomegaly|Infiltration
00000655_003Atelectasis|Effusion
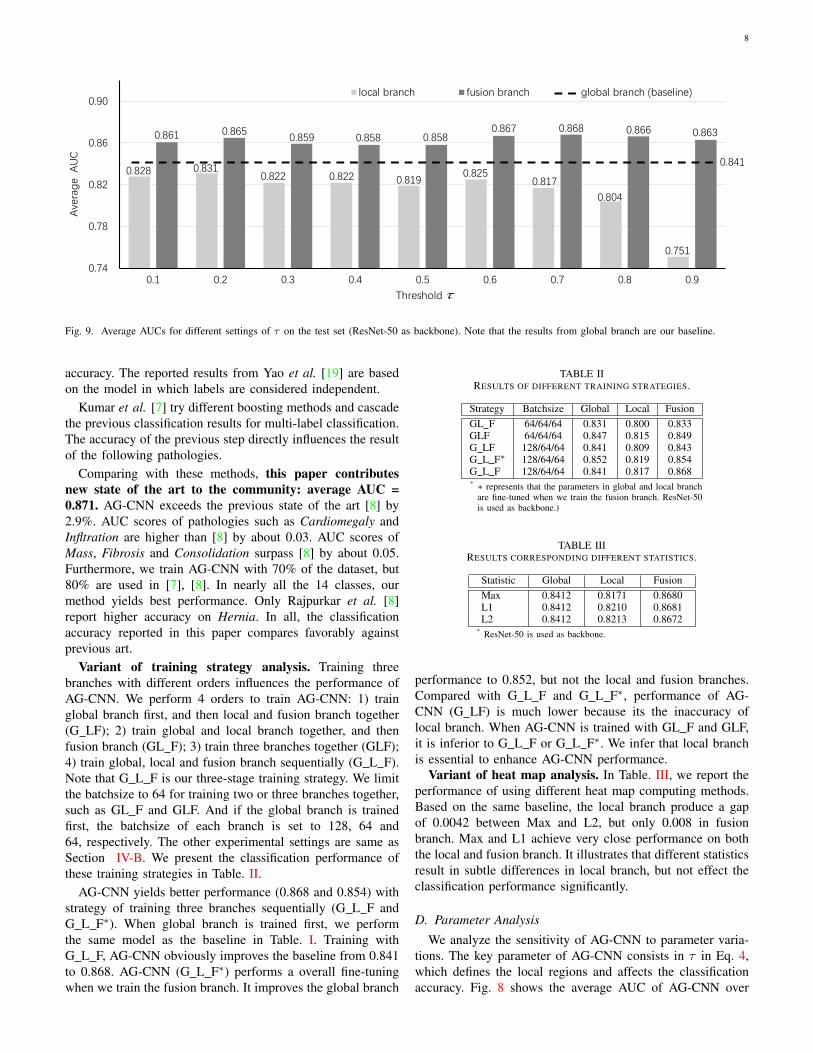
Fig. 7. Examples of classification results. We present the top-10 predicted categories and the corresponding probability scores. The ground-truth labels arehighlighted in blue.
0.862
0.864
0.866
0.868
0.870
0.872
0.1 0.2 0.3 0.4 0.5 0.6 0.7 0.8 0.9
Ave
rag
e A
UC
Threshold
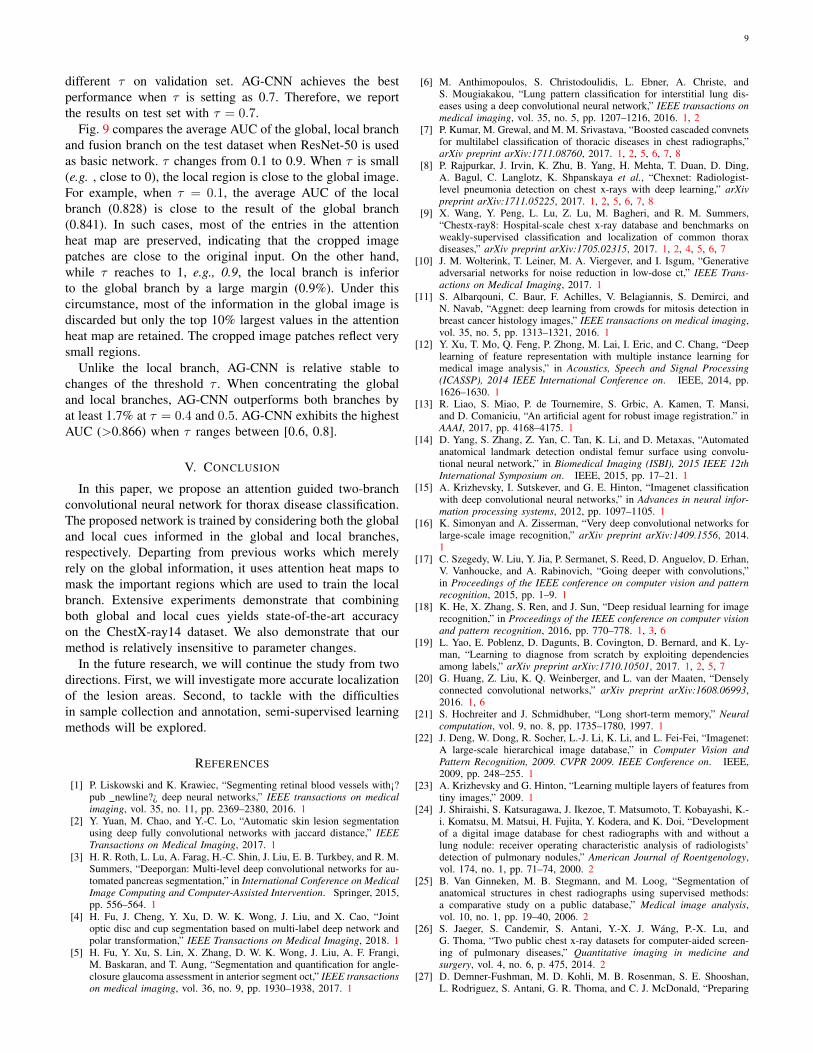
Fig. 8. Average AUC scores of AG-CNN with different settings of τ on thevalidation set (ResNet-50 as backbone).
ResNet-50, the performance gap is 2.4% (0.841 to 0.817). Theprobable reason for this observation is that the lesion regionestimation and cropping process may lead to information losswhich is critical for recognition. So the local branch may sufferfrom inaccurate estimation of the attention area.
Among the 14 classes, the largest performance drop isobserved at “Pneumonia” (0.067). The reason for the infe-rior performance at “Pneumonia” is probably that lots ofinformation are lost. Generally, the area where the lung isinflamed is relative large and its corresponding attention heatmap shows a scattered distribution. With a higher value of τ ,only a very small patch is cropped in original image. For theclasses “Hernia” and “Consolidation”, the local branch andglobal branch yield very similar accuracy. We speculate thatthe cropped local patch is consist with the lesion area in theglobal image.
Effectiveness of fusing global and local branches. InTable. I, Fig. 5, and Fig. 6, we illustrate the effectiveness of thefusion branch, which yields the final classification results ofour model. Table. I shows AUC of AG-CNN over 14 classes.The observations are consistent across different categories andthe two backbones. Fig. 5 presents the ROC curve of threebranches for each pathologies which illustrates that fusingglobal and local branches can improve both of them obviously.We presents the ROC curves of 14 pathologies with thesetwo backbones in Fig. 6. It shows the highly consistency
which demonstrate that AG-CNN is not sensitive to networkarchitecture of backbone.
For both ResNet-50 and DenseNet-121, the fusion branch,i.e., AG-CNN, outperforms both the global branch and localbranch. For example, when using ResNet-50, the performancegap from AG-CNN to the global and local branches is0.027 and 0.051, respectively. Specifically AG-CNN (withDenseNet-121 as backbone) surpasses the global and localbranches for all 14 pathologies.
The advantage of AG-CNN is consistent across the cate-gories. Using ResNet-50 for example, the largest improvement(0.047) is observed at the class “Nodule”, the disease ofwhich is featured by small lesion areas (see Fig. 4). Infact, under such circumstances, the global branch can belargely affected by the noise within the non-disease areas.By paying attention on the small yet focused lesion areas,our method effectively improves the classification performanceof Nodule. On the other hand, we also notice that under theclass Pneumonia, AG-CNN is inferior to the global branch, aconsistent observation made with the local branch: the localbranch is the least effective at this class. Some classificationresults are presented in Fig. 7.
Another experiment, inputing a global image into bothglobal and local branch, is conducted to verify the effective-ness of fusing global and local cues. The same experimentalsettings with Section IV-B are performed expect that themini-batchsize is 64 in training. Three branches are trainedtogether with ResNet-50 as backbone. The average AUC ofglobal, local and fusion branches achieve to 0.845, 0.846 and0.851, respectively. The performance is lower 0.017 comparedwith inputing a local patch into local branch. The resultsshow that AG-CNN is superior than both global and localbranch. In particular, the improvement is benefit from thelocal discriminative region instead of increasing the numberof parameters.
Comparison with the state of the art. We compare our re-sults with the state-of-the-art methods [9], [19], [7], [8] on theChestX-ray14 dataset. Wang et al. [9] classify and localize thethorax disease in a unified weakly supervised framework. Thislocalization method actually compromises the classification
8
0.828 0.8310.822 0.822 0.819
0.8250.817
0.804
0.751
0.861 0.865 0.859 0.858 0.858
0.867 0.868 0.866 0.863
0.841
0.74
0.78
0.82
0.86
0.90
0.1 0.2 0.3 0.4 0.5 0.6 0.7 0.8 0.9
Ave
rag
e A
UC
Threshold
local branch fusion branch global branch (baseline)
Fig. 9. Average AUCs for different settings of τ on the test set (ResNet-50 as backbone). Note that the results from global branch are our baseline.
accuracy. The reported results from Yao et al. [19] are basedon the model in which labels are considered independent.
Kumar et al. [7] try different boosting methods and cascadethe previous classification results for multi-label classification.The accuracy of the previous step directly influences the resultof the following pathologies.
Comparing with these methods, this paper contributesnew state of the art to the community: average AUC =0.871. AG-CNN exceeds the previous state of the art [8] by2.9%. AUC scores of pathologies such as Cardiomegaly andInfltration are higher than [8] by about 0.03. AUC scores ofMass, Fibrosis and Consolidation surpass [8] by about 0.05.Furthermore, we train AG-CNN with 70% of the dataset, but80% are used in [7], [8]. In nearly all the 14 classes, ourmethod yields best performance. Only Rajpurkar et al. [8]report higher accuracy on Hernia. In all, the classificationaccuracy reported in this paper compares favorably againstprevious art.
Variant of training strategy analysis. Training threebranches with different orders influences the performance ofAG-CNN. We perform 4 orders to train AG-CNN: 1) trainglobal branch first, and then local and fusion branch together(G LF); 2) train global and local branch together, and thenfusion branch (GL F); 3) train three branches together (GLF);4) train global, local and fusion branch sequentially (G L F).Note that G L F is our three-stage training strategy. We limitthe batchsize to 64 for training two or three branches together,such as GL F and GLF. And if the global branch is trainedfirst, the batchsize of each branch is set to 128, 64 and64, respectively. The other experimental settings are same asSection IV-B. We present the classification performance ofthese training strategies in Table. II.
AG-CNN yields better performance (0.868 and 0.854) withstrategy of training three branches sequentially (G L F andG L F∗). When global branch is trained first, we performthe same model as the baseline in Table. I. Training withG L F, AG-CNN obviously improves the baseline from 0.841to 0.868. AG-CNN (G L F∗) performs a overall fine-tuningwhen we train the fusion branch. It improves the global branch
TABLE IIRESULTS OF DIFFERENT TRAINING STRATEGIES.
Strategy Batchsize Global Local FusionGL F 64/64/64 0.831 0.800 0.833GLF 64/64/64 0.847 0.815 0.849G LF 128/64/64 0.841 0.809 0.843G L F∗ 128/64/64 0.852 0.819 0.854G L F 128/64/64 0.841 0.817 0.868* ∗ represents that the parameters in global and local branch
are fine-tuned when we train the fusion branch. ResNet-50is used as backbone.)
TABLE IIIRESULTS CORRESPONDING DIFFERENT STATISTICS.
Statistic Global Local FusionMax 0.8412 0.8171 0.8680L1 0.8412 0.8210 0.8681L2 0.8412 0.8213 0.8672
* ResNet-50 is used as backbone.
performance to 0.852, but not the local and fusion branches.Compared with G L F and G L F∗, performance of AG-CNN (G LF) is much lower because its the inaccuracy oflocal branch. When AG-CNN is trained with GL F and GLF,it is inferior to G L F or G L F∗. We infer that local branchis essential to enhance AG-CNN performance.
Variant of heat map analysis. In Table. III, we report theperformance of using different heat map computing methods.Based on the same baseline, the local branch produce a gapof 0.0042 between Max and L2, but only 0.008 in fusionbranch. Max and L1 achieve very close performance on boththe local and fusion branch. It illustrates that different statisticsresult in subtle differences in local branch, but not effect theclassification performance significantly.
D. Parameter Analysis
We analyze the sensitivity of AG-CNN to parameter varia-tions. The key parameter of AG-CNN consists in τ in Eq. 4,which defines the local regions and affects the classificationaccuracy. Fig. 8 shows the average AUC of AG-CNN over
9
different τ on validation set. AG-CNN achieves the bestperformance when τ is setting as 0.7. Therefore, we reportthe results on test set with τ = 0.7.
Fig. 9 compares the average AUC of the global, local branchand fusion branch on the test dataset when ResNet-50 is usedas basic network. τ changes from 0.1 to 0.9. When τ is small(e.g. , close to 0), the local region is close to the global image.For example, when τ = 0.1, the average AUC of the localbranch (0.828) is close to the result of the global branch(0.841). In such cases, most of the entries in the attentionheat map are preserved, indicating that the cropped imagepatches are close to the original input. On the other hand,while τ reaches to 1, e.g., 0.9, the local branch is inferiorto the global branch by a large margin (0.9%). Under thiscircumstance, most of the information in the global image isdiscarded but only the top 10% largest values in the attentionheat map are retained. The cropped image patches reflect verysmall regions.
Unlike the local branch, AG-CNN is relative stable tochanges of the threshold τ . When concentrating the globaland local branches, AG-CNN outperforms both branches byat least 1.7% at τ = 0.4 and 0.5. AG-CNN exhibits the highestAUC (>0.866) when τ ranges between [0.6, 0.8].
V. CONCLUSION
In this paper, we propose an attention guided two-branchconvolutional neural network for thorax disease classification.The proposed network is trained by considering both the globaland local cues informed in the global and local branches,respectively. Departing from previous works which merelyrely on the global information, it uses attention heat maps tomask the important regions which are used to train the localbranch. Extensive experiments demonstrate that combiningboth global and local cues yields state-of-the-art accuracyon the ChestX-ray14 dataset. We also demonstrate that ourmethod is relatively insensitive to parameter changes.
In the future research, we will continue the study from twodirections. First, we will investigate more accurate localizationof the lesion areas. Second, to tackle with the difficultiesin sample collection and annotation, semi-supervised learningmethods will be explored.
REFERENCES
[1] P. Liskowski and K. Krawiec, “Segmenting retinal blood vessels with¡?pub newline?¿ deep neural networks,” IEEE transactions on medicalimaging, vol. 35, no. 11, pp. 2369–2380, 2016. 1
[2] Y. Yuan, M. Chao, and Y.-C. Lo, “Automatic skin lesion segmentationusing deep fully convolutional networks with jaccard distance,” IEEETransactions on Medical Imaging, 2017. 1
[3] H. R. Roth, L. Lu, A. Farag, H.-C. Shin, J. Liu, E. B. Turkbey, and R. M.Summers, “Deeporgan: Multi-level deep convolutional networks for au-tomated pancreas segmentation,” in International Conference on MedicalImage Computing and Computer-Assisted Intervention. Springer, 2015,pp. 556–564. 1
[4] H. Fu, J. Cheng, Y. Xu, D. W. K. Wong, J. Liu, and X. Cao, “Jointoptic disc and cup segmentation based on multi-label deep network andpolar transformation,” IEEE Transactions on Medical Imaging, 2018. 1
[5] H. Fu, Y. Xu, S. Lin, X. Zhang, D. W. K. Wong, J. Liu, A. F. Frangi,M. Baskaran, and T. Aung, “Segmentation and quantification for angle-closure glaucoma assessment in anterior segment oct,” IEEE transactionson medical imaging, vol. 36, no. 9, pp. 1930–1938, 2017. 1
[6] M. Anthimopoulos, S. Christodoulidis, L. Ebner, A. Christe, andS. Mougiakakou, “Lung pattern classification for interstitial lung dis-eases using a deep convolutional neural network,” IEEE transactions onmedical imaging, vol. 35, no. 5, pp. 1207–1216, 2016. 1, 2
[7] P. Kumar, M. Grewal, and M. M. Srivastava, “Boosted cascaded convnetsfor multilabel classification of thoracic diseases in chest radiographs,”arXiv preprint arXiv:1711.08760, 2017. 1, 2, 5, 6, 7, 8
[8] P. Rajpurkar, J. Irvin, K. Zhu, B. Yang, H. Mehta, T. Duan, D. Ding,A. Bagul, C. Langlotz, K. Shpanskaya et al., “Chexnet: Radiologist-level pneumonia detection on chest x-rays with deep learning,” arXivpreprint arXiv:1711.05225, 2017. 1, 2, 5, 6, 7, 8
[9] X. Wang, Y. Peng, L. Lu, Z. Lu, M. Bagheri, and R. M. Summers,“Chestx-ray8: Hospital-scale chest x-ray database and benchmarks onweakly-supervised classification and localization of common thoraxdiseases,” arXiv preprint arXiv:1705.02315, 2017. 1, 2, 4, 5, 6, 7
[10] J. M. Wolterink, T. Leiner, M. A. Viergever, and I. Isgum, “Generativeadversarial networks for noise reduction in low-dose ct,” IEEE Trans-actions on Medical Imaging, 2017. 1
[11] S. Albarqouni, C. Baur, F. Achilles, V. Belagiannis, S. Demirci, andN. Navab, “Aggnet: deep learning from crowds for mitosis detection inbreast cancer histology images,” IEEE transactions on medical imaging,vol. 35, no. 5, pp. 1313–1321, 2016. 1
[12] Y. Xu, T. Mo, Q. Feng, P. Zhong, M. Lai, I. Eric, and C. Chang, “Deeplearning of feature representation with multiple instance learning formedical image analysis,” in Acoustics, Speech and Signal Processing(ICASSP), 2014 IEEE International Conference on. IEEE, 2014, pp.1626–1630. 1
[13] R. Liao, S. Miao, P. de Tournemire, S. Grbic, A. Kamen, T. Mansi,and D. Comaniciu, “An artificial agent for robust image registration.” inAAAI, 2017, pp. 4168–4175. 1
[14] D. Yang, S. Zhang, Z. Yan, C. Tan, K. Li, and D. Metaxas, “Automatedanatomical landmark detection ondistal femur surface using convolu-tional neural network,” in Biomedical Imaging (ISBI), 2015 IEEE 12thInternational Symposium on. IEEE, 2015, pp. 17–21. 1
[15] A. Krizhevsky, I. Sutskever, and G. E. Hinton, “Imagenet classificationwith deep convolutional neural networks,” in Advances in neural infor-mation processing systems, 2012, pp. 1097–1105. 1
[16] K. Simonyan and A. Zisserman, “Very deep convolutional networks forlarge-scale image recognition,” arXiv preprint arXiv:1409.1556, 2014.1
[17] C. Szegedy, W. Liu, Y. Jia, P. Sermanet, S. Reed, D. Anguelov, D. Erhan,V. Vanhoucke, and A. Rabinovich, “Going deeper with convolutions,”in Proceedings of the IEEE conference on computer vision and patternrecognition, 2015, pp. 1–9. 1
[18] K. He, X. Zhang, S. Ren, and J. Sun, “Deep residual learning for imagerecognition,” in Proceedings of the IEEE conference on computer visionand pattern recognition, 2016, pp. 770–778. 1, 3, 6
[19] L. Yao, E. Poblenz, D. Dagunts, B. Covington, D. Bernard, and K. Ly-man, “Learning to diagnose from scratch by exploiting dependenciesamong labels,” arXiv preprint arXiv:1710.10501, 2017. 1, 2, 5, 7
[20] G. Huang, Z. Liu, K. Q. Weinberger, and L. van der Maaten, “Denselyconnected convolutional networks,” arXiv preprint arXiv:1608.06993,2016. 1, 6
[21] S. Hochreiter and J. Schmidhuber, “Long short-term memory,” Neuralcomputation, vol. 9, no. 8, pp. 1735–1780, 1997. 1
[22] J. Deng, W. Dong, R. Socher, L.-J. Li, K. Li, and L. Fei-Fei, “Imagenet:A large-scale hierarchical image database,” in Computer Vision andPattern Recognition, 2009. CVPR 2009. IEEE Conference on. IEEE,2009, pp. 248–255. 1
[23] A. Krizhevsky and G. Hinton, “Learning multiple layers of features fromtiny images,” 2009. 1
[24] J. Shiraishi, S. Katsuragawa, J. Ikezoe, T. Matsumoto, T. Kobayashi, K.-i. Komatsu, M. Matsui, H. Fujita, Y. Kodera, and K. Doi, “Developmentof a digital image database for chest radiographs with and without alung nodule: receiver operating characteristic analysis of radiologists’detection of pulmonary nodules,” American Journal of Roentgenology,vol. 174, no. 1, pp. 71–74, 2000. 2
[25] B. Van Ginneken, M. B. Stegmann, and M. Loog, “Segmentation ofanatomical structures in chest radiographs using supervised methods:a comparative study on a public database,” Medical image analysis,vol. 10, no. 1, pp. 19–40, 2006. 2
[26] S. Jaeger, S. Candemir, S. Antani, Y.-X. J. Wang, P.-X. Lu, andG. Thoma, “Two public chest x-ray datasets for computer-aided screen-ing of pulmonary diseases,” Quantitative imaging in medicine andsurgery, vol. 4, no. 6, p. 475, 2014. 2
[27] D. Demner-Fushman, M. D. Kohli, M. B. Rosenman, S. E. Shooshan,L. Rodriguez, S. Antani, G. R. Thoma, and C. J. McDonald, “Preparing
10
a collection of radiology examinations for distribution and retrieval,”Journal of the American Medical Informatics Association, vol. 23, no. 2,pp. 304–310, 2015. 2
[28] “Open-i: An open access biomedical search engine.” https://openi.nlm.nih.gov. 2
[29] G. Litjens, T. Kooi, B. E. Bejnordi, A. A. A. Setio, F. Ciompi,M. Ghafoorian, J. A. van der Laak, B. van Ginneken, and C. I. Sanchez,“A survey on deep learning in medical image analysis,” arXiv preprintarXiv:1702.05747, 2017. 2
[30] A. Qayyum, S. M. Anwar, M. Majid, M. Awais, and M. Alnowami,“Medical image analysis using convolutional neural networks: A re-view,” arXiv preprint arXiv:1709.02250, 2017. 2
[31] D. Shen, G. Wu, and H.-I. Suk, “Deep learning in medical imageanalysis,” Annual Review of Biomedical Engineering, no. 0, 2017. 2
[32] H.-C. Shin, H. R. Roth, M. Gao, L. Lu, Z. Xu, I. Nogues, J. Yao,D. Mollura, and R. M. Summers, “Deep convolutional neural networksfor computer-aided detection: Cnn architectures, dataset characteristicsand transfer learning,” IEEE transactions on medical imaging, vol. 35,no. 5, pp. 1285–1298, 2016. 2
[33] H.-C. Shin, K. Roberts, L. Lu, D. Demner-Fushman, J. Yao, and R. M.Summers, “Learning to read chest x-rays: recurrent neural cascade modelfor automated image annotation,” in Proceedings of the IEEE Conferenceon Computer Vision and Pattern Recognition, 2016, pp. 2497–2506. 2
[34] M. T. Islam, M. A. Aowal, A. T. Minhaz, and K. Ashraf, “Abnormalitydetection and localization in chest x-rays using deep convolutional neuralnetworks,” arXiv preprint arXiv:1705.09850, 2017. 2
[35] S. Hwang and H.-E. Kim, “Self-transfer learning for weakly supervisedlesion localization,” in International Conference on Medical ImageComputing and Computer-Assisted Intervention. Springer, 2016, pp.239–246. 2
[36] C. Payer, D. Stern, H. Bischof, and M. Urschler, “Regressing heatmapsfor multiple landmark localization using cnns,” in International Confer-ence on Medical Image Computing and Computer-Assisted Intervention.Springer, 2016, pp. 230–238. 2
[37] P.-P. Ypsilantis and G. Montana, “Learning what to look in chestx-rays with a recurrent visual attention model,” arXiv preprintarXiv:1701.06452, 2017. 2
[38] V. Mnih, N. Heess, A. Graves et al., “Recurrent models of visualattention,” in Advances in neural information processing systems, 2014,pp. 2204–2212. 2
[39] E. Pesce, P.-P. Ypsilantis, S. Withey, R. Bakewell, V. Goh, and G. Mon-tana, “Learning to detect chest radiographs containing lung nodules us-ing visual attention networks,” arXiv preprint arXiv:1712.00996, 2017.2
[40] A. Paszke, S. Gross, S. Chintala, and G. Chanan, “Pytorch,” 2017. 6