
Diabete Mellito e Rischio Cardiovascolare UO DIABETOLOGIA Dott. Claudio Lazzeri.

Diabetologia (1993) 36:481-486 Diabetologia © Springer-Vertag 1993
Metformin ameliorates diabetes but does not normalize the decreased GLUT 4 content in skeletal muscle of obese (fa/fa) Zucker rats A. Handberg t , L. Kayser 2, P. E. Hoyer 2 , M. Voldstedlund I , H. P. Hansen I , J. Vinten 1
1 Institute of Medical Physiology B, Panum Institute, University of Copenhagen, Copenhagen, Denmark 2 Institute of Medical Anatomy A, Panum Institute, University of Copenhagen, Copenhagen, Denmark
Summary. We studied the expression of the glucose transpor- ter GLUT 4 in the soleus and red gastrocnemius muscles from obese, diabetic (fa/fa) Zucker rats compared to their lean littermates (Fa/-), with and without treatment with the antidiabetic drug metformin. In the untreated groups of rats, the GLUT 4 content in a crude membrane fraction of both the soleus and the red gastrocnemius muscles were signifi- cantly lower in the obese (fa/fa) rats (3.46+0.28 vs. 6.04 _+ 0.41, p < 0.001 and 6.0 _+ 0.24 vs. 9.1 _+ 0.48, p < 0.0001, respectively). Differences in GLUT 4 expression in soleus muscle from the same rats were confirmed by quantitative immunofluorescence microscopy, and the results were sig- nificantly correlated with the results obtained from quantita- tive immunoblotting (rho = 0.70, p < 0.0005). The decreased
expression of GLUT 4 in fa/fa rats could contribute to the well-established insulin resistance in skeletal muscle of these animals. After 4 weeks of treatment with metformin, weight gain was not affected in either the diabetic (fa/fa) rats or the lean (Fa/-) rats. Improvement of glucose homeostasis by metformin was not associated with normalization of the GLUT 4 expression in the skeletal muscles studied, indicat- ing (1) that the decreased GLUT 4 expression is not directly related to hyperinsulinaemia and diabetes mellitus and (2) that metformin does not normalize the expression of GLUT 4 in skeletal muscle of the diabetic (fa/fa) Zucker rats.
Key words: GLUT 4, glucose transporter, insulin resistance, insulin action, Zucker rat, metformin, skeletal muscle.
Metformin (N,N-dimethylbiguanide) is an antidiabetic drug widely used to treat obese non-insulin-dependent diabetic patients. No stimulatory effect of metformin on insulin secretion has been demonstrated [1-4] and the antihyperglycaemic effect has been attributed to a variety of actions, including diminished intestinal absorption of carbohydrates [2, 5] and reduced hepatic gluconeogenesis [3, 6-8]. In vivo and in vitro studies have also indicated that metformin stimulates the insulin-induced glucose up- take in skeletal muscle and adipose tissue [2, 9-12]. Insulin stimulation of glucose uptake in these tissues involves re- distribution of the insulin responsive glucose transporter G L U T 4 from an intracellular pool to the plasma mem- brane as reviewed by Burant et al. [13]. However, studies on different types of muscles from rats have shown that in- sulin responsiveness is also related to the content of trans- porter protein in crude membranes [14, 15].
The obese Zucker rat (fa/fa) is a well-characterized animal model of insulin resistance in skeletal muscle, and the adult Zucker rats display severe hyperinsulinaemia, glucose intolerance and an elevated plasma insulin re- sponse to a glucose challenge [16-18]. It has been sug- gested that the insulin resistance is partly the result of an
impairment of insulin stimulation of the glucose transport [19-21]. We studied the expression of G L U T 4 in skeletal muscles from obese Zucker rats and their lean littermates, with and without treatment with metformin, to establish whether the impaired insulin action in skeletal muscle is associated with a decreased glucose transporter content, and to investigate the effect of the antidiabetic drug met- formin on the G L U T 4 content in this tissue. In addition to conventional Western blotting of a crude muscle mem- brane fraction, the G L U T 4 content in cryosections of muscle was determined by use of a new, in this context, ap- proach: quantitative immunofluorescence microscopy.
Materials and methods
Housing, care and medication of animals. Obese male Zucker rats (fa/fa) and their lean littermates (F~/-) were purchased from Charles River Laboratories (Cambridge, Mass., USA) at 8 weeks of age. They were housed two-three per cage and were provided with free access to food (crude protein 23 %, crude fat 5 % and carbohydrate 47.5% by weight, the remaining being moisture and fibres) and water. The temperature of the animal room was kept at 21 °C, with an artificial 12:12-h light-dark cycle. Seven obese Zucker rats and seven

482
lean control rats were randomly chosen for medication, and the re- maining seven rats from each group served as controls. The rats as- signed for medical treatment were given metformin dissolved in 0.9 % NaC1 every morning during a period of 24 days while the con- trols were given vehicle. Metformin was administered by use of a gastric tube, in doses starting with 90 rag/day for 6 days increasing to 180 mg/day for 6 days, 225 mg/day for 6 days and finally 270 mgc'day for the remainder of the study period. The last dose of metformin or vehicle was given 24 h before the day of study. The animals were weighed twice weekly.
Tissue and blood sampling. After an overnight fast, the animals were anaesthetized by pentobarbital sodium (50 mg/kg body weight i.p.) and weighed. Blood samples for determination of insulin were col- lected in iced tubes containing 500 kallikrein inhibitor units (KIU) Trasylol (Bayer, Leverkusen, FRG) and 1.5 mg EDTA per ml of blood, while samples for determination of glucose and fructosamine were stabilized with 10 IU heparin per ml of blood. The soleus and red gastrocnemius muscles were excised and immediately frozen by immersion in n-hexane at - 70°C and stored at the same tempera- ture until analysis. Following excision of muscles, the animals were killed by excision of the heart.
Analysis of blood samples'. A commercially available RIA kit was used for determination of insulin as described by the manufacturer (Novo-Nordisk, Bagsvaerd, Denmark) using rat insulin as standard. Glucose was measured by an automated glucose analyser (YSI 23AM; Yellow Springs Instruments, Yellow Springs, Ohio, USA), and glycated fructosamine was analysed using a commer- dally available kit (Precimat; Boehringer Mannheim, Meylan, France), and data were normalized to the concentration of plasma protein.
Immunobtotting. Frozen soleus of red gastrocnemius muscles were homogenized for 7 s using a Polytron (n. Prof. RWitlems, Luzern, Switzerland) (max. setting) in 3 ml of 50 mmol/1 Hepes, pH 7.6, 250 mmol/1 sucrose, 10 mmol/1EDTA, 1.5 mmol/1 phenylmethylsul- phonyl-fluoride (PMSF) and 400 KIU/ml Trasylol. A crude mem- brane fraction, consisting of a mixture of plasma membrane and in- tracellular membrane, was isolated from the homogenate by a centrifugation procedure, essentially as described by Klip et al. [22] with previously published modifications [23, 24]. The homogenates were centrifuged at 1,000 g, for 10 min, at 4 °C, followed by a cen- trifugation of the resulting supernatants for 10 min, 9,000 g, at 4 °C. The supernatants underwent a final spin at 200,000 g, for 2 h, at 4 °C and the resulting pellets were resuspendedin homogenization buffer without protease inhibitors. Protein content was determined by the Coomassie brilliant blue G-250 dye method using the kit from Bio- red (Richmond, Calif., USA). Protease inhibitors were added to the remaining crude membrane preparation (1.5 mmoI/1 PMSF and 400 KIU/ml Trasylol). Samples containing 50 gg of protein from each crude membrane preparation were analysed in duplicate by so- dium-dodecyI-sulphate polyacrylamide gel etectrophoresis (SDS- PAGE) and Western blotting [23, 24]. The antibody used for detec- tion of the glucose transporter GLUT 4 was an affinity-purified polydonal rabbit antibody directed against an artificial peptide, P1, identical to the 13 COOH-terminal amino acids of GLUT 4 [23]. Quantitation of immunoreactivity was performed by densitometric scanning using a preparation of adipocyte plasma membrane as in- ternal standard. No significant differences in protein recovery in the crude membrane fractions between the four groups of rats were found in either soleus or red gastrocnemius muscle (data not shown).
Fluorescence labelling of GLUT 4 in tissue sections. Soleus muscles were divided into three tissue blocks by two transverse cuts at ran- dom positions on the long axis of the muscle. From each tissue block, six cryosections were cut 6 gm thick and all sections from one soleus muscle were adsorbed on the same gelatin-coated slide. Slides were incubated with Tris-buffered saline (TBS; 10 mmolB Tris-HC1, pH 7.4 and 0.9% NaC1) containing 5% bovine serum albumin (BSA) for 30 rain at room temperature to block non-specific bind- ing, essentially as previously described [24]. Quadruplicate sections from each tissue block (in total 12 sections on each slide) were incu-
A. Handberg et al.: GLUT 4 in skeletal muscle of diabetic Zucker rats
bated for 1 h with the above-described polyclonal antibody towards the COOH-terminal part of GLUT 4, diluted 1:100 in TBS with 1% BSA. Duplicate sections from each tissue block (in total six sections on each slide) were incubated with dilution buffer alone and served as background sections. The cryosections were washed three times for 3 min with TBS followed by incubation with a fluorescence con- jugated goat anti-rabbit IgG antibody (BODIPY [B2752]; Molecu- lar Probes, Eugene, Ore., USA) for 1 h. Finally, the sections were rinsed in TBS and mounted in Aquamount (BDH, Poole, Dorset, UK). The sections were kept in the dark at - 20 °C until analysis by fluorescence microscopy.
Quantitation of immunofluorescence labelling in tissue sections Instrumentation. The fluorescence intensity emitted from the sped- fically bound secondary antibody was measured using a Zeiss Axio- vert 10 epifluorescense microscope equipped with a Plan Neofluar water immersion objective (Magnification x 25, numerical aperture 0.80), a XBO 75 W light source, a fast-shutter and a Dage/MTI SIT 66 camera (Michigan City, Ind., USA) connected to a MVP-AT version 10 digitizer (Matrox Electronic Systems Limited, Dorval, Quebec, Canada). The following set of filters was used: excitation 485/20 nm, beamsplitter 510 nm and emission 515-565 nm (Zeiss, Oberkochen, FRG). The system was operated by the software pack- age IMAGE1/AT 4.01b (Universal Imaging Corporation, West Chester, Pa., USA).
Quantitation of fluorescence. The background signal from the video- camera was adjusted to a black level of zerousing back-ground sec- tions (see above). The high voltage (668 keV) and gain (4.86) were adjusted such that the main part of the measurements were within the midrange of the camera sensitivity [25]. From each slide, in 3 x 3 of the specifically-labelled sections on a slide, an area was randomly selected and an image was acquired by averaging and digitizing 16 vi- deoframes (PAL; 25 frames/second). The total iItumination time was 1.5 s. The resulting image (512 x 512 pixels) was stored on a hard disk. After acquisition of the images, a dark and a white reference image was obtained using an uranylglass without and with illumina- tion, respectively, to be used for background and shading corrections [25]. After the image acquisition, the intensity of fluorescence was quantitated using shading and background corrected images. The immunofluorescence intensity was discriminated using a level be- tween 100 and 255 grey values. This signal does not represent the total amount of fluorescent secondary antibody but gives a measure of total GLUT 4, and the level is suitable to detect differences of GLUT 4 between the groups, effectively eliminating background signals. In each image the intensity in two thirds of the image area was measured and integrated. The sum of the integrated intensities from nine images was taken to represent a muscle. Sections from one rat from the untreated Fa/- control group and three rats from the treated control group were excluded a posteriori due to artifacts in the sections. Partial thawing of the sections during mounting on slides could cause intense and diffuse non-specific binding of the sec- ondary fluorescent antibody.
Statistical analysis
Data in text, tables and figures are given as mean + SEM. Statistical significance between groups was tested by use of a Mann-Whitney test for unpaired comparisons, and Spearmans rho for correlation was used. One or two-sided tests were used where appropriate (indi- cated in text). Statistical analysis was performed using MEDSTAT version 2.1, programmed by H. R. Wulff and R Schlichting, Herlev University Hospital (Herle~; Denmark).
Results
The diabet ic (fa/fa) Z u c k e r rats were significantly more obese t han their lean l i t termates at the onset of me t fo rmin t r e a t me n t (body weight (g) 367 + 16 vs 277 + 6.5, Table 1),
A. Handberg et al.: GLUT 4 in skeletal muscle of diabetic Zucker rats
Table 1. Characteristics of animals
Control (Fa/-) rats Obese (fa/fa) rats - + - +
Metformin Metformin
n 7 6 7 5
Weight (g) Start 278 ± 10" 275 ± 10 348 + lg 394 ± 28 End 342 :t: 11 a 329 _+ 12 482 + 10 523 + 22
Fasting plasma 6.4_+ 0.3 b 6.6 +_ 0.3 12.7 + 1.0 ° 8.9_+ 1.0 glucose (mmol/1)
Fasting plasma 2.8-+0.6 a 1.6+_0.5 10.9+2.7 ° 5.9+0.7 insulin (ng/ml)
Fructosamine 155_+ 8.4 163.3 ± 6.1 186.8 + 12.6 ~ 127.6 + 10.2
Data are shown as mean + SEM. See Materials and methods for met- formin dosage and route of administration. ~p < 0.00005 vs untreated fa/fa rats, Up < 0.002 vs untreated fa/fa rats, Cp <0.05 vs fa/fa rats treated with metformin (one-sided Mann-Whitney), dp < 0.01 vs untreated fa/fa rats, ep < 0.005 VS metformin treated fa/fa rats (one-sided Mann-Whitney)
i. e. when the rats were approximately 8 weeks of age. The fa/fa rats gained relatively more weight during the study compared to the lean controls, and by the end of the study the weight of the fa/fa rats was 149 % of control rats (Table 1). Metformin treatment did not influence weight gain during the study in the fa/fa Zucker rats or in the lean controls (Table 1). Weight was positively correlated to fasting insulin at the end of the study (rho=0.72, p <0.00005). Fasting glucose levels were significantly elevated in the untreated fa/fa rats compared with control rats and glycated fructosamine tended to be increased in the diabetic rats (Table 1). Glycated fructosamine was sig- nificantly reduced by 30 % by metformin treatment in the fa/fa rats (Table 1). Fasting blood glucose levels were lowered by metformin in the diabetic fa/fa rats (8.9 + 1.0 vs 12.7 _+ 1.0 mmol/1), whereas no effect was found in the lean, non-diabetic rats. Metformin treatment also lowered fasting plasma insulin in the obese fa/fa rats (10.9 + 2.7 vs 5.9_+0.7 ng/ml), and was without effect in Fa/- rats (Table 1).
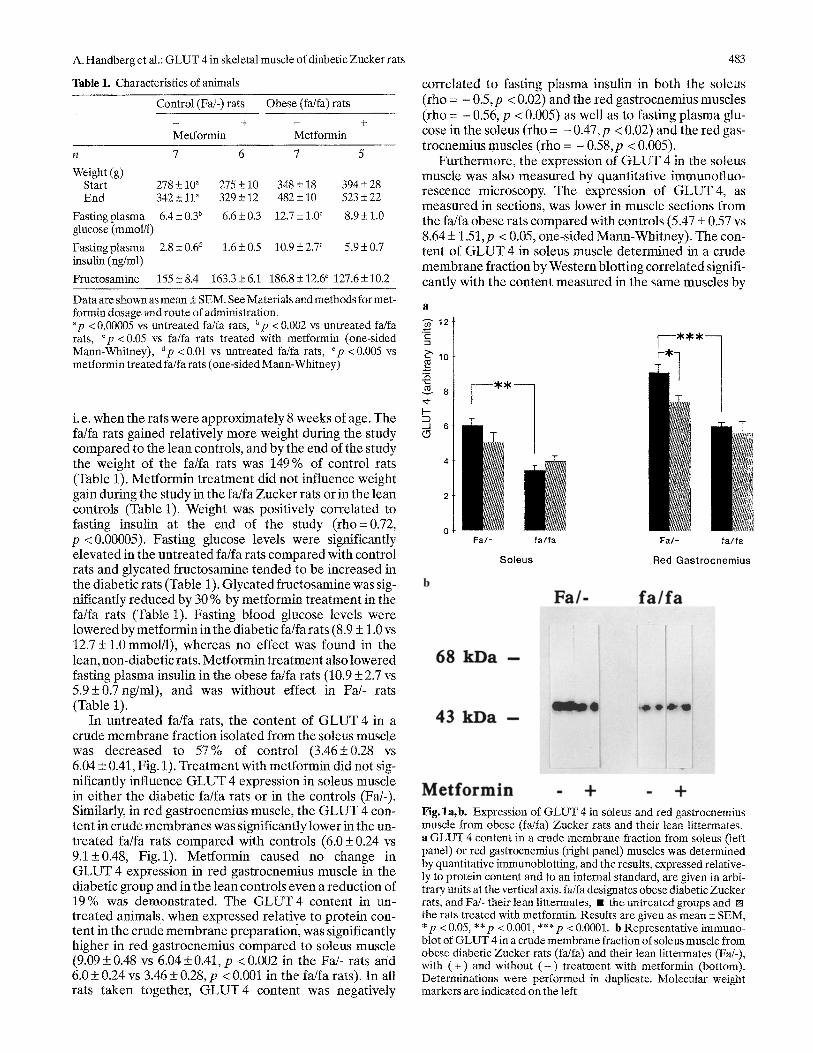
In untreated fa/fa rats, the content of G L U T 4 in a crude membrane fraction isolated from the soleus muscle was decreased to 57% of control (3.46+0.28 vs 6.04 _+ 0.41, Fig. 1). Treatment with metformin did not sig- nificantly influence G L U T 4 expression in soleus muscle in either the diabetic fa/fa rats or in the controls (Fa/-). Similarly, in red gastrocnemius muscle, the G L U T 4 con- tent in crude membranes was significantly lower in the un- treated fa/fa rats compared with controls (6.0 + 0.24 vs 9.1+_0.48, Fig.l). Metformin caused no change in G L U T 4 expression in red gastrocnemius muscle in the diabetic group and in the lean controls even a reduction of 19% was demonstrated. The G L U T 4 content in un- treated animals, when expressed relative to protein con- tent in the crude membrane preparation, was significantly higher in red gastrocnemius compared to soleus muscle (9.09 + 0.48 vs 6.04 + 0.41, p < 0.002 in the Fa/- rats and 6.0 -+ 0.24 vs 3.46 + 0.28, p < 0.001 in the fa/fa rats). In all rats taken together, G L U T 4 content was negatively
483
correlated to fasting plasma insulin in both the soleus (rho = - 0.5,p < 0.02) and the red gastrocnemius muscles (rho = - 0.56, p < 0.005) as well as to fasting plasma glu- cose in the soleus (rho = - 0.47, p < 0.02) and the red gas- trocnemius muscles (rho = - 0.58, p < 0.005).
Furthermore, the expression of G L U T 4 in the soleus muscle was also measured by quantitative immunofluo- rescence microscopy. The expression of G L U T 4, as measured in sections, was lower in muscle sections from the fa/fa obese rats compared with controls (5.47 + 0.57 vs 8.64 _ 1.51,p < 0.05, one-sided Mann-Whitney). The con- tent of G L U T 4 in soleus muscle determined in a crude membrane fraction by Western blotting correlated signifi- cantly with the content measured in the same muscles by
a
c-
~10
a
_.1 6
0
U * *
F a / -
[ - - - , : * * - -
:-*7
fa/fa Fa/- fa/fa
Soleus Red Gastrocnemius
Pig.la, b. Expressio n of GLUT 4 in soleus and red gastrocnemius muscle from obese (fa/fa) Zucker rats and their lean littermates. a GLUT 4 content in a crude membrane fraction from soleus (left panel) or red gastrocnemius (right panel) muscles was determined by quantitative immunoblotting, and the results, expressed relative- ly to protein content and to an internal standard, are given in arbi- trary units at the vertical axis. fa/fa designates obese diabetic Zucker rats, and Fa/- their lean littermates, II the untreated groups and [] the rats treated with metformin. Results are given as mean + SEM, * p < 0.05, ** p < 0.001, *** p < 0.0001. b Representative immuno- blot of GLUT 4 in a crude membrane fraction of soleus muscle from obese diabetic Zucker rats (fa/fa) and their lean littermates (Fa/-), with (+) and wit&out ( - ) treatment with metformin (bottom). Determinations were performed in duplicate. Molecular weight markers are indicated on the left

C} 0 c-
O co
O
O ¢-
E E ,m
F--
,.A (9
484
1 8
1 6 •
1 4
1 0
• m a • q ~ /
T
4 " • •
2
0 2 4 6 8
GLUT4 immunoblot
Fig. 2. Relationship between GLUT 4 content in the soleus muscles determined by quantitative immunoblotting and by quantitative im- munofluorescence microscopy. Upper panel: The content of GLUT 4 in soleus muscles was determined in a crude membrane fraction by quantitative immunoblotting (x-axis) and in sections of the contralateral muscle by quantitative immunofluorescence microscopy (y-axis), and the results from the individual animals, ex- pressed in arbitrary units, were significantly correlated (rho = 0.7, p < 0.0005, dr19), v , Fa/- untreated rats; V Fa/-, metformin- treated rats; O, fa/fa untreated rats; n, fa/fa metformin-treated rats. Lower panel: Representative immunofluorescence labelling of GLUT 4 in a cryosection of soleus muscle from a Fa/- rat. Bar corre- sponds to 50 gm
quantitative immunotluorescence microscopy (rho = 0.7, Fig.2).
D i s c u s s i o n
Insulin resistance is a major metabolic characteristic of non-insulin-dependent diabetes and obesity, and involves decreased sensitivity and/or responsiveness of the glucose transport system to insulin in target tissues [26, 27]. Skele- tal muscle is the primary tissue responsible for insulin- stimulated glucose disposal [28], where the glucose trans- porter G L U T 4 is believed to be responsible for
A. Handberg et al.: GLUT 4 in skeletalmuscle of diabetic Zucker rats
insulin-stimulated glucose uptake [13]. Although translo- cation of GLUT 4 to the plasma membrane is believed to be an important step in the stimulation and regulation of glucose uptake by insulin, most studies of skeletal muscle have measured the level of GLUT 4 in crude membrane fractions rather than in plasma membranes, because the subcellular fractionation of skeletal muscle necessary for the study of translocation is technically difficult [22, 29- 31]. However, studies on different types of muscles from rats have shown that insulin responsiveness is related to the level of transporter protein [14, 15].
Glucose transporter expression in skeletal muscle has been studied in man and in several animal models of in- sulin resistance. In non-insulin-dependent diabetes mdst studies agree that expression of GLUT 4 protein in skele- tal muscle is normal [23, 32]. In skeletal muscle from strep- tozotocin (STZ)-diabetic rats, however, previous reports have established a reduced expression of GLUT 4 protein and mRNA which are restored to normal levels with in- sulin therapy [33, 34].
In the present study, we have used the obese Zucker rat, which in the adult state is characterized by moderate hyperglycaemia and severe hyperinsulinaemia [16-18], as a model of insulin resistance. Using similar methods for quantitation of muscle GLUT 4 as in previous studies of Zucker rats [35, 36], we demonstrated a reduced expres- sion of GLUT 4 in soleus and red gastrocnemius muscles. The validity of the present finding was confirmed by quan- titative immunofluorescence microscopy. The individual measurements of GLUT 4 in soleus muscles obtained by the two methods were significantly correlated, and the de- creased GLUT 4 expression was reproduced. Our result is in contrast to that of Friedman et al. [35], where GLUT 4 content in the gastrocnemius muscle of obese Zucker rats was normal compared to their lean littermates. This dis- crepancy could be due to a transiently decreased GLUT 4 expression as rats of considerably different age were stu- died (36 weeks vs 11-12 weeks in our study). A study of muscle insulin resistance and GLUT 4 expression in muscle from obese Zucker rats of increasing age (21- 70days), however, demonstrated no difference in G L U T 4 content in the extensor digitorum longus muscle nor in the diaphragma at any timepoint [36].
Most studies of other hyperinsulinaemic animal mod- els of insulin resistance have not suggested a decreased ex- pression of G L U T 4 in skeletal muscle. Thus, in the obese (db/db) mouse [37] and in the viable yellow mouse [38], skeletal muscle GLUT 4 content was normal, and in rats made insulin resistant by long-term infusion of glucose [39], or by dexamethasone treatment [40] no effect on transporter expression was demonstrated. However, in in- sulin resistance induced by 4 days infusion of insulin in healthy rats, GLUT 4 protein was decreased in the tibialis muscle [41]. Additionally, in a new rat model of insulin re- sistance, the obese hypoinsulinaemic diabetic Zucker rat (ZDF/Drt-fa), GLUT 4 content was found to be reduced to about the same extent as in the present study [38, 42]. Thus, the relation between insulin resistance and GLUT 4 expression differs between the models studied and may be related to the known variables of glycaemia, insulinaemia, corticosteronaemia etc. In view of the variety of animal

A. Handberg et al.: GLUT 4 in skeletal muscle of diabetic Zucker rats
models of insulin resistance previously studied under dif- ferent conditions, and the conflicting conclusions con- cerning the relationship between G L U T 4 expression and insulin sensitivity drawn from these studies, the fact that the G L U T 4 expression repor ted here was demonstrated by use of two different methods, increases the reliability of the demonstra ted decreased expression of G L U T 4 in skeletal muscle f rom fasting fa/fa Zucker rats.
It has been proposed that hyperinsulinaemia could contribute to the development and sustaining of muscle insulin resistance in genetically obese rats [36]. In sup- port of this we demonstrated a negative correlation between G L U T 4 and fasting insulin and glucose. How- ever, despite amelioration of diabetes and hyperinsulin- aemia after 3 weeks of metformin treatment, normaliza- tion of G L U T 4 content in the faJfa rats could not be demonstrated. This could be due to the fact that insulin levels were not fully normalized. The site of action of metformin has been subject to some discussion. Studies using the hyperinsulinaemic clamp technique have in- dicated that in non-insulin-dependent diabetes metfor- min augments the insulin-stimulated glucose uptake in muscle [9, 10]. This finding is confirmed by incubations of muscle strips from non-diabetic subjects [12]. In rat adipocytes, short- term administration of metformin increases the insulin-stimulated glucose uptake by poten- tiating the insulin-stimulated translocation of transpor- ters to the plasma membrane [11]. Our finding of lack of alteration in G L U T 4 content indicates that the level of action of metformin in skeletal muscle is not the expres- sion of G L U T 4. Howevm; as in adipocytes [11] metfor- min could potentiate insulin-stimulated translocation of G L U T 4.
In conclusion, we have demonstra ted that the insulin resistance in skeletal muscle of the obese diabetic fa/fa Zucker rat, previously demonstra ted by others, is associ- ated with a decreased expression of G L U T 4 when com- pared to lean littermates. Ameliorat ion of the hyperinsu- linaemia and the diabetes by metformin t reatment was not associated with normalization of the G L U T 4 expres- sion in the skeletal muscles studied.
Acknowledgements. We thank J. Harp¢th and K. Clante for excellent technical assistance. The Novo-Nordisk Foundation and the Danish Diabetes Association are gratefully thanked for financial support of this study. The Velux Foundation of 1981 have donated the equip- ment for fluorescence microscopy. Dr. A. Handberg is a recipient of a research fellowship donated by the Novo Foundation.
References
1. Sterne J (1969) Pharmacology and mode of action of the hypo- glycemic guanidine derivates. In: Campbell GD (ed) Oral hypo- glycemic agents. Academic Press, New York, pp 193-245
2. Bailey CJ (1988) Metformin revisited: its actions and indications for use. Diabetic Med 5:315-320
3. Jackson RA, Hawa MI, Jaspan JB et al. (1987) Mechanism of metformin action in non-insulin-dependent diabetes. Diabetes 36:632-640
4. Wu MS, Johnston P, Sheu WH-H et al. (1990) Effect of metfor- min on carbohydrate and lipoprotein metabolism in NIDDM pa- tients. Diabetes Care 13:1~8
485
5. Lorch E (1971) Inhibition of intestinal absorption and improve- ment of oral glucose tolerance by biguanides in the normal and in the streptozotocin-diabetic rat. Diabetologia 7:195-203
6. Meyer E Ipaktchi M, Caluser H (1967) Specific inhibition of glu- coneogenesis by biguanides. Nature (Loud) 213:203-204
7. DeFronzo RA, Barzilai N, Simonson DC (1991) Mechanism of metformin action in obese and lean noninsulin-dependent diabetic subjects. J Clin EndocrinoI Metab 73:1294-1301
8. Klip A, Leiter LA (1990) Cellular mechanism of action of met- formin. Diabetes Care 13:6%-704
9. Hother-Nielsen O, Schmitz O, Andersen PH, Beck-Nielsen H, Pedersen O (1989) Metformin improves peripheral but not he- patic insulin action in obese patients with type II diabetes. Acta Endocrino1120: 257-265
10. Pedersen O, Nielsen OH, Bak J, Richelsen B, Beck-Nielsen H, Schwartz-S0rensen N (1989) The effect of metformin on adipo- cyte insulin action and metabolic control in obese subjects with type II diabetes. Diabetic Med 6:249--256
11. Matthaei S, Hamann A, Klein HH et al. (1991) Association of metformin's effect to increase insulin-stimulated glucose trans- port with potentiation of insulin-induced translocation of glu- cose transporters from intracellular pool to plasma membrane in rat adipocytes. Diabetes 40:850-857
12. Galuska D, Zierath J, Thorne A, Sonnenfield T, Wallberg-Hen- riksson H (1991) Metformin increases insulin-stimulated glucose transport in insulin-resistant human skeletal muscle. Diabet Metab 17:159-163
13. Burant CF, Sivitz WI, Fukumoto H et al. (1991) Mammalian glu- cose transporters: structure and molecular regulation. Rec Prog Horm Res 47:349-387
14. Kern M, Wells JA, Stephens JM et al. (1990) Insulin responsive- ness in skeletal muscle is determined by glucose transporter (GLUT 4) protein level. Biochem J 270:397-400
15. Ploug T, Staltknecht BM, Pedersen O et al. (1990) Effect of en- durance training on glucose transport capacity and glucose trans- porter expression in rat skeletal muscle. Am J Physio1259: E778- E786
16. Zucker LM, Antoniades HN (1972) Insulin and obesity in the Zucker genetically obese rat "fatty". Endocrinology 90: 1320- 1330
17. Becker-Zimmerman K, Berger M, Berchtold R Gries FA, Her- berg L, Schwenen M (1982) Treadmill training improves in- travenous glucose tolerance and insulin sensitivity in fatty Zucker rats. Diabetologia 22:468-474
18. Ionescu E, Sauter JF, Jeanrenaud B (1985) Abnormal oral glu- cose tolerance in genetically obese (fa/fa) rats. Am J Physio1248: E500-E506
19. Crettaz M, Prentki M, Zanietti D, Jeanrenaud B (1980) Insulin resistance in soleus muscles from obese Zucker rats. Involve- ment of several defective sites. Biochem J 186:525-534
20. Penicaud L, Ferre P, Terretaz J e t al. (1987) Development of obesity in Zucker rats: early insulin resistance in muscles but nor- mal sensitivity in white adipose tissue. Diabetes 36: 626-63t
21. Sherman WIvl, Katz AL, Cutler CL, Withers RT, Ivy JL (1988) Glucose transport: locus of muscle insulin resistance in obese Zucker rats. Am J Physio1255:E374-E382
22. Klip A, Ramlal T, Young DA, Holloszy JO (1987) Insulin-in- duced translocation of glucose transporters in rat hindlimb mus- cles. FEBS Lett 224:224-230
23. Handberg A, Vaag A, Damsbo R Beck-Nielsen H, Vinten J (1990) Expression of insulin regulatable glucose transporters in skeletal muscle from type 2 (non-insulin-dependent) diabetic patients. Diabetologia 33:625-627
24. Handberg A, Kayser L, HCyer PE, Vinten J (1992) A substantial part of GLUT-1 in crude membranes from muscle originates from perineurial sheaths. Am J Physio1262:E721-E727
25. Jericevic Z, Wiese B, Bryan J, Smith LC (1989) Validation of an imaging system: steps to evaluate and validate a microscope im- aging system for quantitative studies. In: Taylor DL, Wang Y-L (eds) Methods in cell biology. Academic Press, New York, pp 47- 83

486
26. Kolterman OG, Gray RS, Griffin J e t al. (1981) Receptor and postreceptor defects contribute to the insulin resistance in non- insulin-dependent diabetes mellitus. J Clin Invest 68:957-969
27. Ciaraldi TP, Kolterman OG, Scarlett JA, Kao M, Olefsky JM (1982) Role of the glucose transport system in the postreceptor defect of non-insulin dependent diabetes mellitus. Diabetes 31: 1061-1022
28. DeFronzo RA (1988) The triumvirate: t-cell, muscle, liver: a col- lusion responsible for NIDDM. Diabetes 37:667-687
29. Hirschman MF, Goodyear LJ, Wardzala L J, Horton ED, Horton ES (1990) Identification of an intracellular pool of glucose trans- porters from basal and insulin-stimulated rat skeletal muscle. J Biol Chem 265:987-991
30. Douen AG, Ramlal T, Rastogi 8 et al. (1990) Exercise induces re- cruitment of the "insulin-responsive glucose transporter". J Biol Chem 265:13427-13430
31. Rodnick KJ, Slot JVV, Studelska DR et al. (1992) Immunocyto- chemical and biochemical studies of GLUT 4 in rat skeletal muscle. J Biol Chem 267:6278-6285
32. Pedersen O, Bak JF, Andersen PH et al. (1990) Evidence against altered expression of GLUT 1 or GLUT 4 in skeletal muscle of patients with obesity or NIDDM. Diabetes 39:865-870
33. Kahn BB, Rosetti L, Lodish HF, Charron MJ (1991) Decreased in vivo glucose uptake but normal expression of GLUT 1 and GLUT 4 in skeletal muscle of diabetic rats. J Clin Invest 87: 2197-2206
34. Strout HV, Vicario PR Biswas C et al. (1990) Vanadate treatment of streptozotocin diabetic rats restores expression of the insulin- responsive glucose transporter in skeletal muscle. Endocrino- logy 126:2728-2732
35. Friedman JE, Sherman V~rM, Reed MJ, Elton CW, Dohn GL (1990) Exercise training incTeases glucose transporter protein GLUT 4 in skeletal muscle of obese Zucker (fa/fa) rats. FEBS Lett 268:13-16
36. Zarjevski N, Doyle P, Jeanrenaud B (1992) Muscle insulin resis- tance may not be a primary etiological factor in the genetically obese fa/fa rat. Endocrinology 130:1564--1570
A. Handberg et al.: GLUT 4 in skeletal muscle of diabetic Zucker rats
37. Koranyi L, James D, Mueckler M, Permutt MA (1990) Glucose transporter levels in spontaneously obese (db/db) insulin-resis- tant mice. J Clin Invest 85:962-967
38. Slieker LJ, Sundell KL, Heath WF et al. (1992) Glucose trans- porter levels in tLssues of spontaneously diabetic Zucker fa/fa rat (ZDF/drt) and viable yellow mouse (AVy/a). Diabetes 41: 187- 193
39. Hager SR, Pastorek D, Jochen AL, Meier D (1991) Divergence between GLUT4, RNA and protein abundance in skeletal muscle of insulin resistant rats. Biochem Biophys Res Commun 181:240-245
40. Haber RS, Weinstein SP (1992) Role of glucose transporters in glucocorticoid-induced insulin resistance. GLUT 4 isoform in rat skeletal muscle is not decreased by dexamethasone. Diabetes 41:728-735
41. Cusin I, Terretaz J, Rohner-Jeanrenaud E Zarjevski N, Assima- copoulos-Jeannet F, Jeanrenaud B (1990) Hyperinstflinemia in- creases the amount of GLUT 4 mRNA in white adipose tissue and decreases that of muscles: a clue for increased fat depot and insulin resistance. Endocrinology 127:3246-3248
42. Friedman JE, De Vente JE, Peterson RG, Dohm GL (1991),.'Afl- tered expression of muscle glucose transporter GLUT 4 in diabetic fatty Zucker rats (ZDF/Drt-fa). Am J Physiol 261: E782-E788
Received: 19 November 1992 and in revised form: 11 January 1993
Dr. A. Handberg Institute of Medical Physiology B Panum Institute University of Copenhagen Blegdamsvej 3C DK-2200 Copenhagen Denmark


