Diabetes Volume 64, July 2015diabetes.diabetesjournals.org/content/diabetes/64/7/2609...Ravishankar...
15
Mohd. Parvez Khan, 1 Abhishek Kumar Singh, 2 Amit Arvind Joharapurkar, 3 Manisha Yadav, 2 Sonal Shree, 4 Harish Kumar, 2 Anagha Gurjar, 2 Jay Sharan Mishra, 2 Mahesh Chandra Tiwari, 1 Geet Kumar Nagar, 1 Sudhir Kumar, 5 Ravishankar Ramachandran, 4 Anupam Sharan, 6 Mukul Rameshchandra Jain, 3 Arun Kumar Trivedi, 2 Rakesh Maurya, 5 Madan Madhav Godbole, 7 Jiaur Rahaman Gayen, 8 Sabyasachi Sanyal, 2 and Naibedya Chattopadhyay 1 Pathophysiological Mechanism of Bone Loss in Type 2 Diabetes Involves Inverse Regulation of Osteoblast Function by PGC-1a and Skeletal Muscle Atrogenes: AdipoR1 as a Potential Target for Reversing Diabetes-Induced Osteopenia Diabetes 2015;64:2609–2623 | DOI: 10.2337/db14-1611 Type 2 diabetes is associated with increased fracture risk and delayed facture healing; the underlying mechanism, however, remains poorly understood. We systematically investigated skeletal pathology in leptin receptor– deficient diabetic mice on a C57BLKS background (db). Compared with wild type (wt), db mice displayed reduced peak bone mass and age-related trabecular and cortical bone loss. Poor skeletal outcome in db mice contributed high-glucose– and nonesterified fatty acid–induced oste- oblast apoptosis that was associated with peroxisome proliferator–activated receptor g coactivator 1-a (PGC-1a) downregulation and upregulation of skeletal muscle atro- genes in osteoblasts. Osteoblast depletion of the atrogene muscle ring finger protein-1 (MuRF1) protected against gluco- and lipotoxicity-induced apoptosis. Osteoblast- speci fic PGC-1a upregulation by 6-C-b-d-glucopyranosyl- (2S,3S)-(+)-5,7,39,49-tetrahydroxydihydroflavonol (GTDF), an adiponectin receptor 1 (AdipoR1) agonist, as well as metformin in db mice that lacked AdipoR1 expression in muscle but not bone restored osteopenia to wt levels without improving diabetes. Both GTDF and metformin protected against gluco- and lipotoxicity-induced oste- oblast apoptosis, and depletion of PGC-1a abolished this protection. Although AdipoR1 but not AdipoR2 de- pletion abolished protection by GTDF, metformin action was not blocked by AdipoR depletion. We conclude that PGC-1a upregulation in osteoblasts could reverse type 2 diabetes–associated deterioration in skeletal health. Type 2 diabetes typically is a middle age–onset (.40 years) metabolic disease that affects multiple organ 1 Division of Endocrinology, CSIR-Central Drug Research Institute, Lucknow, Uttar Pradesh, India 2 Division of Biochemistry, CSIR-Central Drug Research Institute, Lucknow, Uttar Pradesh, India 3 Zydus Research Centre, Ahmedabad, Gujarat, India 4 Division of Molecular and Structural Biology, CSIR-Central Drug Research Institute, Lucknow, Uttar Pradesh, India 5 Division of Medicinal and Process Chemistry, CSIR-Central Drug Research Institute, Lucknow, Uttar Pradesh, India 6 Vinayak Cosmetic Surgery & Laser Centre, Lucknow, Uttar Pradesh, India 7 Department of Endocrinology, Sanjay Gandhi Postgraduate Institute of Medical Sciences, Lucknow, Uttar Pradesh, India 8 Division of Pharmacokinetics and Metabolism, CSIR-Central Drug Research Institute, Lucknow, UP, India Corresponding author: Sabyasachi Sanyal, [email protected], or Naibedya Chattopadhyay, [email protected]. Received 20 October 2014 and accepted 26 January 2015. This article contains Supplementary Data online at http://diabetes .diabetesjournals.org/lookup/suppl/doi:10.2337/db14-1611/-/DC1. M.P.K. and A.K.S. contributed equally to this work. © 2015 by the American Diabetes Association. Readers may use this article as long as the work is properly cited, the use is educational and not for profit, and the work is not altered. Diabetes Volume 64, July 2015 2609 PHARMACOLOGY AND THERAPEUTICS
Transcript of Diabetes Volume 64, July 2015diabetes.diabetesjournals.org/content/diabetes/64/7/2609...Ravishankar...
Mohd. Parvez Khan,1 Abhishek Kumar Singh,2 Amit Arvind Joharapurkar,3
Manisha Yadav,2 Sonal Shree,4 Harish Kumar,2 Anagha Gurjar,2 Jay Sharan Mishra,2
Mahesh Chandra Tiwari,1 Geet Kumar Nagar,1 Sudhir Kumar,5
Ravishankar Ramachandran,4 Anupam Sharan,6 Mukul Rameshchandra Jain,3
Arun Kumar Trivedi,2 Rakesh Maurya,5 Madan Madhav Godbole,7
Jiaur Rahaman Gayen,8 Sabyasachi Sanyal,2 and Naibedya Chattopadhyay1
Pathophysiological Mechanism ofBone Loss in Type 2 Diabetes InvolvesInverse Regulation of OsteoblastFunction by PGC-1a and SkeletalMuscle Atrogenes: AdipoR1as a Potential Target forReversing Diabetes-InducedOsteopeniaDiabetes 2015;64:2609–2623 | DOI: 10.2337/db14-1611
Type 2 diabetes is associated with increased fracture riskand delayed facture healing; the underlying mechanism,however, remains poorly understood. We systematicallyinvestigated skeletal pathology in leptin receptor–deficient diabetic mice on a C57BLKS background (db).Compared with wild type (wt), db mice displayed reducedpeak bone mass and age-related trabecular and corticalbone loss. Poor skeletal outcome in db mice contributedhigh-glucose– and nonesterified fatty acid–induced oste-oblast apoptosis that was associated with peroxisomeproliferator–activated receptor g coactivator 1-a (PGC-1a)downregulation and upregulation of skeletal muscle atro-genes in osteoblasts. Osteoblast depletion of the atrogenemuscle ring finger protein-1 (MuRF1) protected againstgluco- and lipotoxicity-induced apoptosis. Osteoblast-specific PGC-1a upregulation by 6-C-b-d-glucopyranosyl-
(2S,3S)-(+)-5,7,39,49-tetrahydroxydihydroflavonol (GTDF), anadiponectin receptor 1 (AdipoR1) agonist, as well asmetformin in db mice that lacked AdipoR1 expressionin muscle but not bone restored osteopenia to wt levelswithout improving diabetes. Both GTDF and metforminprotected against gluco- and lipotoxicity-induced oste-oblast apoptosis, and depletion of PGC-1a abolishedthis protection. Although AdipoR1 but not AdipoR2 de-pletion abolished protection by GTDF, metformin actionwas not blocked by AdipoR depletion. We conclude thatPGC-1a upregulation in osteoblasts could reverse type2 diabetes–associated deterioration in skeletal health.
Type 2 diabetes typically is a middle age–onset (.40years) metabolic disease that affects multiple organ
1Division of Endocrinology, CSIR-Central Drug Research Institute, Lucknow,Uttar Pradesh, India2Division of Biochemistry, CSIR-Central Drug Research Institute, Lucknow,Uttar Pradesh, India3Zydus Research Centre, Ahmedabad, Gujarat, India4Division of Molecular and Structural Biology, CSIR-Central Drug ResearchInstitute, Lucknow, Uttar Pradesh, India5Division of Medicinal and Process Chemistry, CSIR-Central Drug ResearchInstitute, Lucknow, Uttar Pradesh, India6Vinayak Cosmetic Surgery & Laser Centre, Lucknow, Uttar Pradesh, India7Department of Endocrinology, Sanjay Gandhi Postgraduate Institute of MedicalSciences, Lucknow, Uttar Pradesh, India
8Division of Pharmacokinetics and Metabolism, CSIR-Central Drug ResearchInstitute, Lucknow, UP, India
Corresponding author: Sabyasachi Sanyal, [email protected], or NaibedyaChattopadhyay, [email protected].
Received 20 October 2014 and accepted 26 January 2015.
This article contains Supplementary Data online at http://diabetes.diabetesjournals.org/lookup/suppl/doi:10.2337/db14-1611/-/DC1.
M.P.K. and A.K.S. contributed equally to this work.
© 2015 by the American Diabetes Association. Readers may use this article aslong as the work is properly cited, the use is educational and not for profit, andthe work is not altered.
Diabetes Volume 64, July 2015 2609
PHARMACOLOGYAND
THERAPEUTIC
S
systems. Increasing evidence indicates that type 2 diabe-tes is associated with increased fracture risk, especiallyvertebral and hip fractures in older patients (1–4). Be-cause chronic inflammation participates in diabetes path-ogenesis and is a prerequisite for osteoclast activation,increased bone resorption is considered the likely causeof increased fracture risk in this disease. However, somestudies intriguingly suggest that patients with type 2 di-abetes have an increased risk of hip fractures at a higherbone mineral density (BMD) value than patients withoutdiabetes (5) as well as an increased incidence of vertebralfractures at BMD values comparable to that of patientswithout diabetes (6). Thus, the reasons for increased skel-etal fragility in patients with type 2 diabetes remainlargely unexplained.
Patients with type 2 diabetes also have delayed fracturehealing, resulting in poorer outcomes after hip fracture (7).Reduced fracture healing in type 2 diabetes is attributableto decreased collagen content, defective cross-linking, alter-ations in collagen subtype ratios, and collagen defects dueto accumulation of advanced glycation end products(8–10), which could impair osteoblast function. These couldalso lead to compromised bone material strength and in-creased cortical porosity, affecting bone quality as shown inpostmenopausal women with type 2 diabetes (11,12).
Several mouse models of type 2 diabetes are available;however, they poorly represent the human skeletalfragility observed in patients with typical type 2 diabetes(13). Unlike typical middle-aged type 2 diabetes onset inhumans, when skeletal maturity has already beenattained in genetically engineered diabetic mice, the on-set of diabetes occurs at 4–8 weeks, an age comparable toadolescence in humans at which skeletal maturity hasnot been attained (14). However, the average onset ageis falling in humans and is becoming increasingly com-mon among those aged ,30 years, including childrenand adolescents in various ethnic groups (15–18). Thisearly-onset diabetes is characterized by increased diseaseseverity and pancreatic b-cell failure than is typical oftype 2 diabetes (19–21). Data on the impact of early-onset type 2 diabetes on human skeletal health are lim-ited, although one report indicated that children withprediabetes with impaired glucose tolerance have lowmineral content and low bone mass (22). We thus believethat the distinction in skeletal phenotype between early-and middle age–onset type 2 diabetes might be impor-tant for the following reason: Although skeletons ofchildren/adolescents predominantly undergo modeling-directed growth (resulting in a net increase in bone massdue to enhanced osteoblastic activity), adult skeletonspredominantly experience remodeling (no net bone gain),and thus, type 2 diabetes in these two cases may affectskeletal health differently.
Although monogenic obese and diabetic mouse models,such as leptin receptor–deficient diabetic mice, essentiallydiffer from the polygenic disease origin in human type2 diabetes, these may serve as a suitable model for
deciphering the skeletal outcomes in this disease. Weinvestigated the skeletal phenotype in leptin receptor–deficient genetically obese diabetic mice (in C57BLKSbackground) (db) that manifest severe diabetes, includ-ing pancreatic b-cell failure. The study also involved theidentification of factors crucial for type 2 diabetes–induced skeletal effects. Furthermore, modulation of suchfactors by therapeutic intervention on diabetic skeletonwas assessed.
RESEARCH DESIGN AND METHODS
Reagents and KitsCell culture reagents were from Life Technologies. Finereagents were from Sigma-Aldrich unless indicated other-wise. Globular adiponectin (gAd) was from ATGen Global.125I (20 MBq) was from Bhabha Atomic Research Center(Mumbai, India). Kits for plasma biochemical parameterswere glucose (Pointe Scientific), lipids and creatinine(Randox Laboratories Ltd., Mumbai, India), insulin (Milli-pore), adiponectin (B-Bridge International Inc.), andosteocalcin (OCN) (Uscn Life Science Inc.). ELISA kitswere plasminogen activator inhibitor 1, MCP-1, leptin,and resistin (Millipore). The TUNEL assay kit was fromRoche Applied Science. 6-C-b-d-glucopyranosyl-(2S,3S)-(+)-5,7,39,49-tetrahydroxydihydroflavonol (GTDF) (purity.98%) was purified as previously reported (23), and met-formin (Met) (purity 97%) and pioglitazone (Pio) (purity$98%) were from Sigma-Aldrich.
Animal ExperimentsWild type (wt) (C57BLKS/J) or db (BKS.Cg-Dock7m +/+Leprdb/J and B6.db; B6.BKS(D)-Leprdb/J) mice werehoused at 22 6 3°C on a 12-h light/dark cycle. All animalshad access to a standard chow diet and water ad libitum.Time course studies were conducted at the American As-sociation for Laboratory Animal Care–accredited facilityof Zydus Research Centre (ZRC) (Ahmedabad, India) fol-lowing approval from the Institutional Animal EthicsCommittee of ZRC. The db or wt mice used were originallyfrom The Jackson Laboratory, and the colonies were main-tained at ZRC. Drug treatment studies using 10-week-olddb mice from Harlan Laboratories (the Netherlands)(BKS.Cg- + Leprdb/+Leprdb/OlaHsd) were conducted atSyngene International Ltd. (Bangalore, India) in its Amer-ican Association for Laboratory Animal Care–accreditedfacility following ethical approval from the InstitutionalAnimal Ethics Committee. In both studies, all the animalswere randomized into groups based on blood glucose lev-els and body weight. Vehicle groups received 0.5% car-boxymethylcellulose, and treatment groups receivedGTDF (10 mg/kg), Met (350 mg/kg), and Pio (10 mg/kg)once a day by oral gavage for 30 days. Doses of Met inadult humans range from 850 to 2,550 mg/day, whichcomes to 14.6–42.5 mg/kg (considering the average hu-man weight to be 60 kg). The adult human dose of Pio is15–45 mg/day, which corresponds to 0.25–0.75 mg/kg.The equation for dose translation from human to mouse
2610 AdipoR1/PGC-1a Protect Against Osteopenia Diabetes Volume 64, July 2015
was based on body surface area: human equivalent dose(mg/kg) = animal dose (mg/kg) 3 (animal Km/human Km)(24). Feed intake and body weight were measured everyday, and on day 31, the animals were killed. Plasma andtissues were collected and stored at 280°C until furtheranalysis.
Microcomputed TomographyMicrocomputed tomography (mCT) of excised bones wascarried out using a SkyScan 1076 CT scanner (Aartselaar,Belgium) as described earlier for mouse bone (25,26) andfollowing the general guidelines for the assessment ofbone microarchitecture in rodents using mCT (27). Forscanning, source voltage was set to 50 kV and currentto 200 mA. The X-ray source rotation step size was0.84° over a trajectory of 180°. Reconstructions weremade using NRecon version 1.6.9.4 software (SkyScan)to create two-dimensional (2D) 2,000 3 2,000–pixelimages with a beam hardening correction set to 10%with dynamic range of 21,000 to 11,000 Hounsfieldunits. By drawing ellipsoid contours, trabecular bonewas extracted using the CT analyzer software. In the fe-mur epiphysis region, 200 slices were selected, leaving 50slices from the start of the growth plate as a referencepoint. Cortical parameters were determined at femur mid-diaphysis by 2D analysis. From the start of the growthplate as a reference point, 200 slices were selected in thecortical region, leaving 500 slices as offset (to exclude thetrabecular region). For BMD calibration, 2-mm-diameterhydroxyapatite phantom rods with known BMD (0.25 and0.75 g/cm3) were used. For each analysis, the estimatedBMD was determined based on linear correlation betweenthe mCT attenuation coefficient and BMD (28).
Bone Biomechanical StrengthThree-point bending test on femur was performed usinga bone strength tester (TK-252C; Muromachi) as pre-viously reported (29).
Determination of the Bone Lining CellsDeparaffinized and hydrated femoral epiphysis sections(5 mm) of various groups were stained with hematoxylin-eosin (H-E), and bone lining cells were visualized by lightmicroscopy. Ten sections per mouse (n = 6) were used forcounting by two independent researchers blinded to theexperimental design.
Cell Culture and Induction of DifferentiationMouse calvarial osteoblasts (MCOs) were obtained from1–2-day-old mouse pups as described earlier (26,30). Bonemarrow cells from 10–12-week-old male wt and db micewere isolated, cultured, and differentiated into osteo-blasts as described earlier (31).
Radioiodination of gAd and Radioligand-BindingExperimentTen micrograms gAd was radioiodinated by iodogenmethod using precoated iodination tubes (Pierce) accord-ing to the manufacturer’s instructions. Excess 125I wasremoved by a PD-10 desalting column (GE Healthcare).
For binding assays, osteoblasts and myocytes in 24-wellplates were incubated with increasing concentrations of125I-gAd in PBS supplemented with 0.1% BSA for 2 h (atwhich time binding equilibrium was achieved), after whichthe cells were washed and lysed. Nonspecific binding foreach concentration was determined using a 200-fold ex-cess of cold gAd. Specific binding was calculated by sub-tracting nonspecific binding from total binding.
RNA Interference ExperimentsSmall interfering (si) RNAs were from Dharmacon.MCOs were transfected with 0.1 mmol/L of each siRNAper well using DharmaFECT 1 transfection reagent(Dharmacon) in six-well plates. Seventy-two hours aftertransfection, cells were treated as indicated and analyzedas required.
Quantitative PCR, Immunoblotting, andImmunohistochemistryThese studies were performed using standard proceduresas previously described (32,33). Primer sequences forquantitative PCR (qPCR) are listed in Supplementary Ta-ble 3. Antibodies and dilutions for immunoblotting wereas follows: anti-peroxisome proliferator–activated recep-tor g (PPARg) coactivator 1-a (PGC-1a) (ST1202; Calbio-chem; 1:2,000); anti-AMPK, phospho-AMPK (pAMPK)(Thr 172), and cleaved caspase-3 (Cell Signaling Technol-ogy; 1:1,000); and adiponectin receptor (AdipoR) 1,AdipoR2, muscle ring finger protein-1 (MuRF1), and b-actinantibodies (Santa Cruz Biotechnology; 1:1,000 except forb-actin, which was 1:3,000). TUNEL assay was performedas described earlier (33). For immunohistochemistry, fe-mur epiphysis transverse sections (5 mm) were deparaffi-nized, hydrated, and after antigen retrieval, incubatedwith mouse anti-Runx2 (Abcam; 1:1,600) along withanti-PGC-1a (1:2,000), pAMPK (1:500), or MuRF1(1:500) at 4°C overnight. The sections were then washedand incubated with fluorescent Alexa Fluor goat anti-mouse and goat anti-rabbit IgG (H + L) (1:1,500) (LifeTechnologies) for 1 h at room temperature. Sectionswere also stained with DAPI and visualized by fluorescentmicroscopy. Image-Pro Plus 6.1 software (Media Cyber-netics) was used for quantification of microscopic datawhere five randomly selected fields from six bone sectionsper group were analyzed.
Osteoblast Differentiation AssayMCOs at 70–80% confluence were trypsinized, and 2 3103 cells/well were seeded in 96-well plates. After 24 h,cells were given various treatments for 48 h in osteoblastdifferentiation medium. Alkaline phosphatase (ALP) ac-tivity was measured using a fluorometric kit (BioVision)according to the manufacturer’s protocol.
Cell Viability AssayMCOs in 96-well plates (2 3 103 cells/well) were treatedwith increasing concentrations of glucose, palmitic acid,and dexamethasone (Dex) with or without GTDF andMet for 48 h. Osteoblast viability was assessed by
diabetes.diabetesjournals.org Khan and Associates 2611
3-(4,5-dimethylthiazol-2-yl)-2,5-diphenyltetrazolium bro-mide (MTT) assay as previously reported (33).
Flow Cytometry–Based Determination of ApoptosisAnnexin V-FITC Apoptosis Detection kit (Sigma) was usedto determine apoptosis. Briefly, the treated cells weretrypsinized and washed with PBS, and 1 3 106 cells/mLwere resuspended in binding buffer and labeled with 5 mLannexin V-FITC and 10 mL propidium iodide (PI) for10 min in the dark. Cell fluorescence was measured ona FACSCalibur flow cytometer (Becton Dickinson) andanalyzed using CellQuest Pro software.
Data Analysis and StatisticsResults are expressed as mean 6 SE. All data wereanalyzed using GraphPad Prism 5.0 software. Statisti-cal analyses were performed using one- or two-wayANOVA as appropriate followed by Bonferroni posttestanalysis.
RESULTS
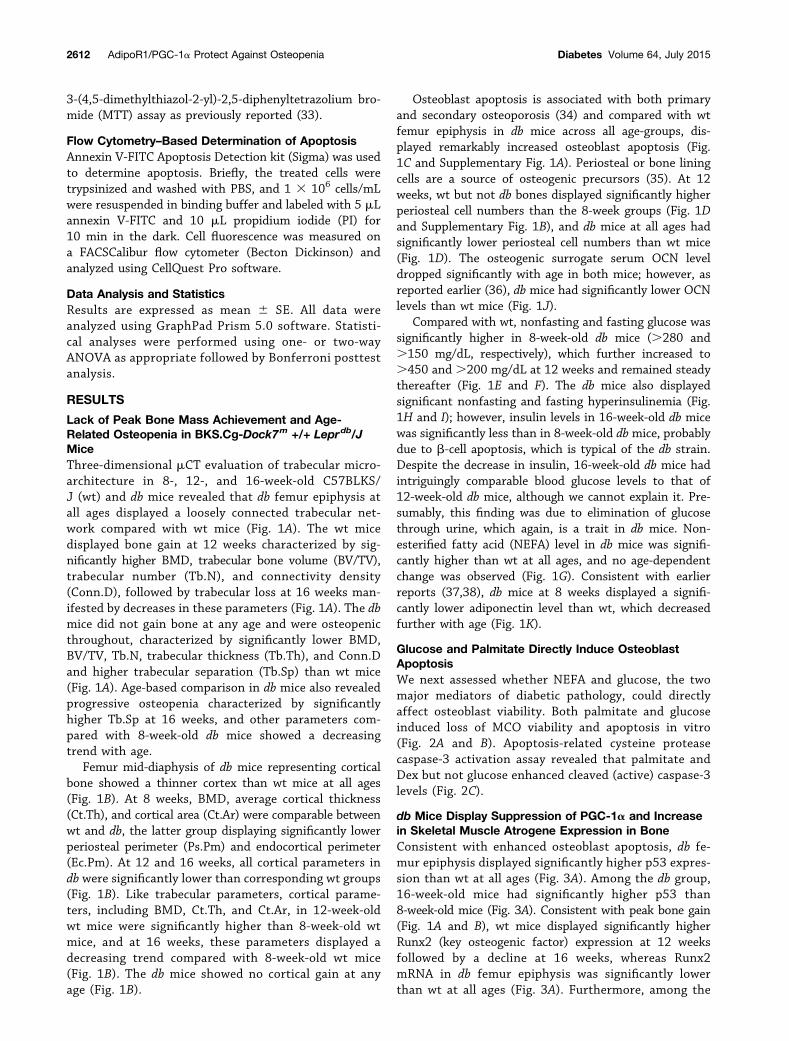
Lack of Peak Bone Mass Achievement and Age-Related Osteopenia in BKS.Cg-Dock7m +/+ Leprdb/JMiceThree-dimensional mCT evaluation of trabecular micro-architecture in 8-, 12-, and 16-week-old C57BLKS/J (wt) and db mice revealed that db femur epiphysis atall ages displayed a loosely connected trabecular net-work compared with wt mice (Fig. 1A). The wt micedisplayed bone gain at 12 weeks characterized by sig-nificantly higher BMD, trabecular bone volume (BV/TV),trabecular number (Tb.N), and connectivity density(Conn.D), followed by trabecular loss at 16 weeks man-ifested by decreases in these parameters (Fig. 1A). The dbmice did not gain bone at any age and were osteopenicthroughout, characterized by significantly lower BMD,BV/TV, Tb.N, trabecular thickness (Tb.Th), and Conn.Dand higher trabecular separation (Tb.Sp) than wt mice(Fig. 1A). Age-based comparison in db mice also revealedprogressive osteopenia characterized by significantlyhigher Tb.Sp at 16 weeks, and other parameters com-pared with 8-week-old db mice showed a decreasingtrend with age.
Femur mid-diaphysis of db mice representing corticalbone showed a thinner cortex than wt mice at all ages(Fig. 1B). At 8 weeks, BMD, average cortical thickness(Ct.Th), and cortical area (Ct.Ar) were comparable betweenwt and db, the latter group displaying significantly lowerperiosteal perimeter (Ps.Pm) and endocortical perimeter(Ec.Pm). At 12 and 16 weeks, all cortical parameters indb were significantly lower than corresponding wt groups(Fig. 1B). Like trabecular parameters, cortical parame-ters, including BMD, Ct.Th, and Ct.Ar, in 12-week-oldwt mice were significantly higher than 8-week-old wtmice, and at 16 weeks, these parameters displayed adecreasing trend compared with 8-week-old wt mice(Fig. 1B). The db mice showed no cortical gain at anyage (Fig. 1B).
Osteoblast apoptosis is associated with both primaryand secondary osteoporosis (34) and compared with wtfemur epiphysis in db mice across all age-groups, dis-played remarkably increased osteoblast apoptosis (Fig.1C and Supplementary Fig. 1A). Periosteal or bone liningcells are a source of osteogenic precursors (35). At 12weeks, wt but not db bones displayed significantly higherperiosteal cell numbers than the 8-week groups (Fig. 1Dand Supplementary Fig. 1B), and db mice at all ages hadsignificantly lower periosteal cell numbers than wt mice(Fig. 1D). The osteogenic surrogate serum OCN leveldropped significantly with age in both mice; however, asreported earlier (36), db mice had significantly lower OCNlevels than wt mice (Fig. 1J).
Compared with wt, nonfasting and fasting glucose wassignificantly higher in 8-week-old db mice (.280 and.150 mg/dL, respectively), which further increased to.450 and .200 mg/dL at 12 weeks and remained steadythereafter (Fig. 1E and F). The db mice also displayedsignificant nonfasting and fasting hyperinsulinemia (Fig.1H and I); however, insulin levels in 16-week-old db micewas significantly less than in 8-week-old db mice, probablydue to b-cell apoptosis, which is typical of the db strain.Despite the decrease in insulin, 16-week-old db mice hadintriguingly comparable blood glucose levels to that of12-week-old db mice, although we cannot explain it. Pre-sumably, this finding was due to elimination of glucosethrough urine, which again, is a trait in db mice. Non-esterified fatty acid (NEFA) level in db mice was signifi-cantly higher than wt at all ages, and no age-dependentchange was observed (Fig. 1G). Consistent with earlierreports (37,38), db mice at 8 weeks displayed a signifi-cantly lower adiponectin level than wt, which decreasedfurther with age (Fig. 1K).
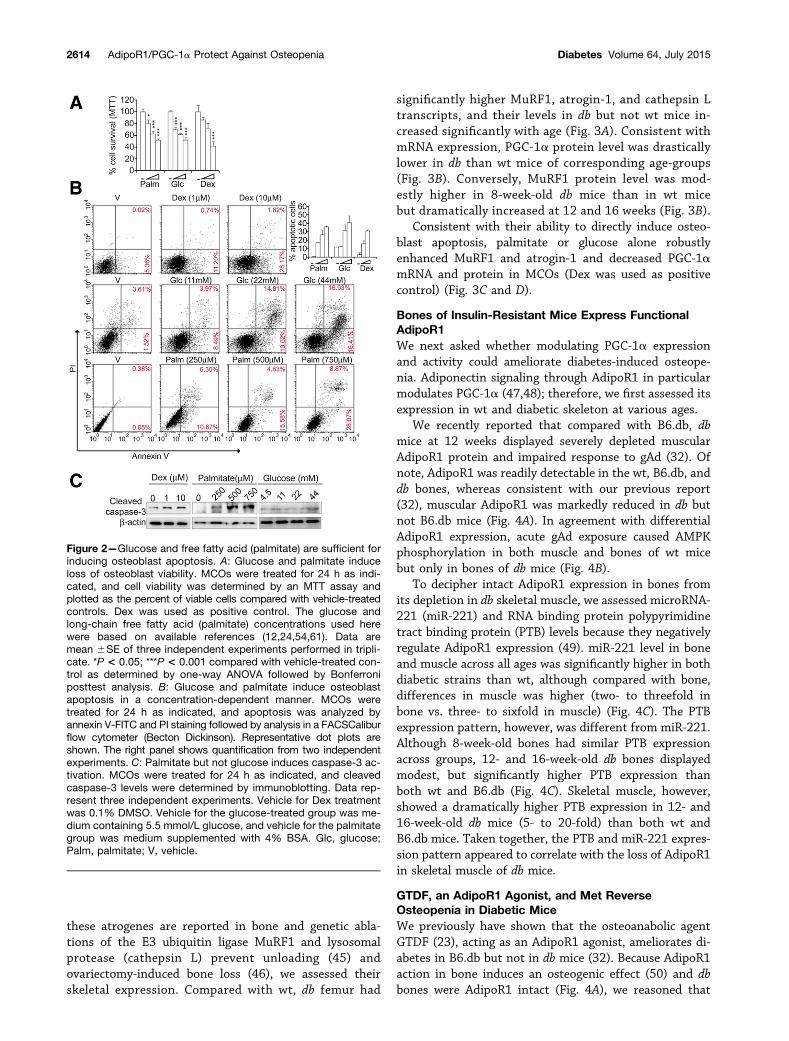
Glucose and Palmitate Directly Induce OsteoblastApoptosisWe next assessed whether NEFA and glucose, the twomajor mediators of diabetic pathology, could directlyaffect osteoblast viability. Both palmitate and glucoseinduced loss of MCO viability and apoptosis in vitro(Fig. 2A and B). Apoptosis-related cysteine proteasecaspase-3 activation assay revealed that palmitate andDex but not glucose enhanced cleaved (active) caspase-3levels (Fig. 2C).
db Mice Display Suppression of PGC-1a and Increasein Skeletal Muscle Atrogene Expression in BoneConsistent with enhanced osteoblast apoptosis, db fe-mur epiphysis displayed significantly higher p53 expres-sion than wt at all ages (Fig. 3A). Among the db group,16-week-old mice had significantly higher p53 than8-week-old mice (Fig. 3A). Consistent with peak bone gain(Fig. 1A and B), wt mice displayed significantly higherRunx2 (key osteogenic factor) expression at 12 weeksfollowed by a decline at 16 weeks, whereas Runx2mRNA in db femur epiphysis was significantly lowerthan wt at all ages (Fig. 3A). Furthermore, among the
2612 AdipoR1/PGC-1a Protect Against Osteopenia Diabetes Volume 64, July 2015
db group, Runx2 expression significantly declined withage (Fig. 3A).
Muscular PGC-1a expression is suppressed in diabetes(39,40). Because PGC-1a is parathyroid hormone respon-sive (41) in osteoblasts and its expression increases dur-ing osteoblast differentiation (42), we assessed its skeletalexpression. Like Runx2, PGC-1a expression in wt but notdb mice peaked at 12 weeks and then declined, and
compared with wt, PGC-1a expression in db bones wassignificantly lower and showed significant decline with age(Fig. 3A).
Diabetes and obesity negatively influence muscularhealth by increasing atrogenes (43) that are involved inprotein catabolism. Increasing PGC-1a expression and ac-tivity downregulates these atrogenes and prevents muscleatrophy under diverse stresses (44). Because some of
Figure 1—Evaluation of bone phenotypes in 8-, 12-, and 16-week-old wt and db mice. A: Age- and genotype-dependent changes intrabecular microarchitecture. A mCT analysis was carried out using a SkyScan 1076 CT scanner (Aartselaar, Belgium). The left panel showsrepresentative images from three-dimensional mCT analysis of femur epiphyses (trabecular bone) from 8-, 12-, and 16-week-old wt and dbmice. The bar graphs on the right show quantification. B: Age- and genotype-dependent changes in cortical parameters. Femur mid-diaphysis representing cortical bone was analyzed by mCT. The left panel shows 2D mCT representative images; the right panels showquantification. A and B: n = 6 bones/group. C: The db mice displayed enhanced osteoblast apoptosis. Quantification of apoptoticosteoblasts was performed by dual TUNEL (DNA fragmentation marker) and Runx2 (osteoblast marker) staining of femur epiphysis sections(6 bones/group, 5 fields/bone) followed by confocal microscopy (Carl Zeiss LSM 510 Meta, Jena, Germany). Runx2-positive and TUNEL-positive cells were plotted as a percent of total Runx2-positive cells (representative images shown in Supplementary Fig. 1A). D: The dbmice displayed reduced bone lining cells. H-E–stained femur epiphysis sections (6 bones/group, 5 fields/bone) were used for counting bylight microscopy by two independent researchers blinded to the experimental design (representative microscopic images shown inSupplementary Fig. 1B). E–K: Serum biochemical parameters in wt and db mice (n = 6/group). Data are mean 6 SE. *Eight-week vs.12- or 16-week age-groups. #wt vs. db (corresponding age-groups). *,#P < 0.05; **,##P < 0.01; ***,###P < 0.001 as determined by two-way ANOVA followed by Bonferroni posttest analysis. +ve, positive; Conn.D, trabecular connectivity normalized by tissue volume.
diabetes.diabetesjournals.org Khan and Associates 2613
these atrogenes are reported in bone and genetic abla-tions of the E3 ubiquitin ligase MuRF1 and lysosomalprotease (cathepsin L) prevent unloading (45) andovariectomy-induced bone loss (46), we assessed theirskeletal expression. Compared with wt, db femur had
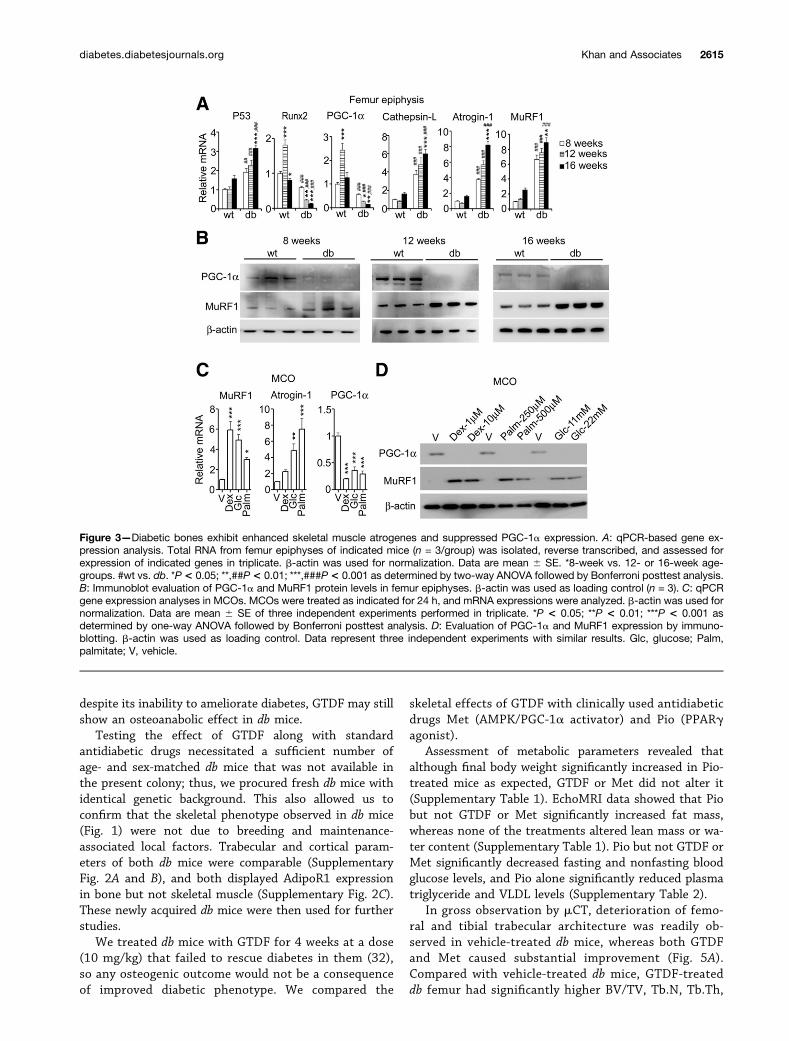
significantly higher MuRF1, atrogin-1, and cathepsin Ltranscripts, and their levels in db but not wt mice in-creased significantly with age (Fig. 3A). Consistent withmRNA expression, PGC-1a protein level was drasticallylower in db than wt mice of corresponding age-groups(Fig. 3B). Conversely, MuRF1 protein level was mod-estly higher in 8-week-old db mice than in wt micebut dramatically increased at 12 and 16 weeks (Fig. 3B).
Consistent with their ability to directly induce osteo-blast apoptosis, palmitate or glucose alone robustlyenhanced MuRF1 and atrogin-1 and decreased PGC-1amRNA and protein in MCOs (Dex was used as positivecontrol) (Fig. 3C and D).
Bones of Insulin-Resistant Mice Express FunctionalAdipoR1We next asked whether modulating PGC-1a expressionand activity could ameliorate diabetes-induced osteope-nia. Adiponectin signaling through AdipoR1 in particularmodulates PGC-1a (47,48); therefore, we first assessed itsexpression in wt and diabetic skeleton at various ages.
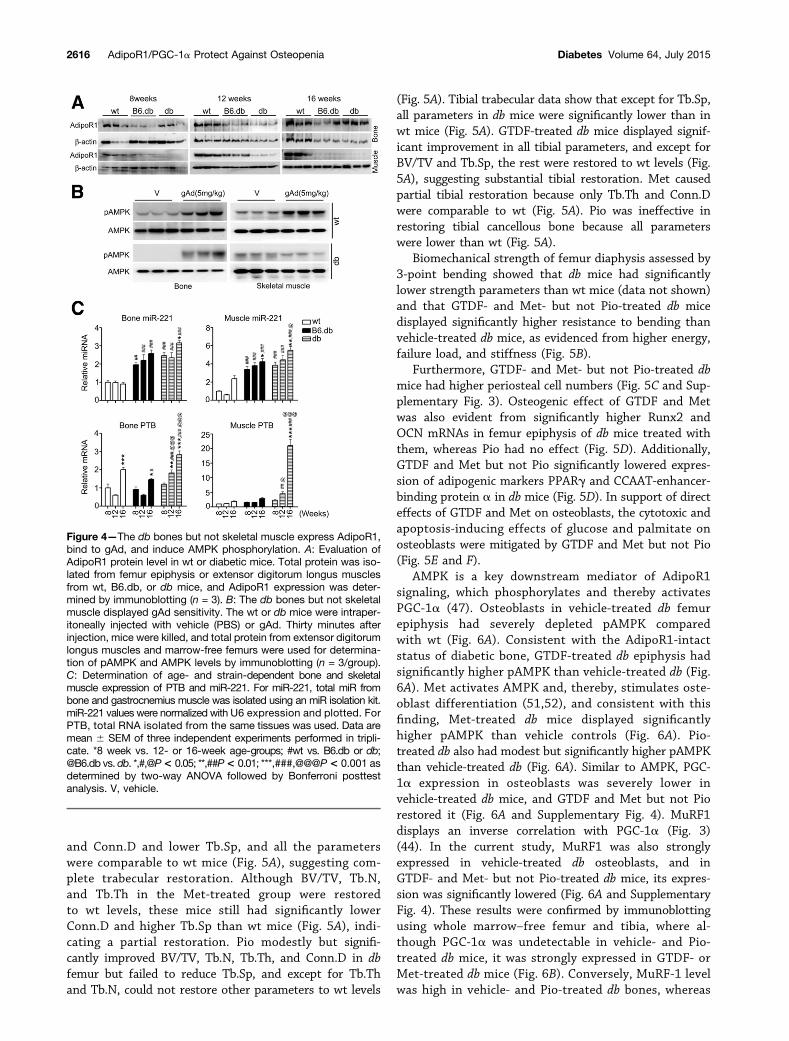
We recently reported that compared with B6.db, dbmice at 12 weeks displayed severely depleted muscularAdipoR1 protein and impaired response to gAd (32). Ofnote, AdipoR1 was readily detectable in the wt, B6.db, anddb bones, whereas consistent with our previous report(32), muscular AdipoR1 was markedly reduced in db butnot B6.db mice (Fig. 4A). In agreement with differentialAdipoR1 expression, acute gAd exposure caused AMPKphosphorylation in both muscle and bones of wt micebut only in bones of db mice (Fig. 4B).
To decipher intact AdipoR1 expression in bones fromits depletion in db skeletal muscle, we assessed microRNA-221 (miR-221) and RNA binding protein polypyrimidinetract binding protein (PTB) levels because they negativelyregulate AdipoR1 expression (49). miR-221 level in boneand muscle across all ages was significantly higher in bothdiabetic strains than wt, although compared with bone,differences in muscle was higher (two- to threefold inbone vs. three- to sixfold in muscle) (Fig. 4C). The PTBexpression pattern, however, was different from miR-221.Although 8-week-old bones had similar PTB expressionacross groups, 12- and 16-week-old db bones displayedmodest, but significantly higher PTB expression thanboth wt and B6.db (Fig. 4C). Skeletal muscle, however,showed a dramatically higher PTB expression in 12- and16-week-old db mice (5- to 20-fold) than both wt andB6.db mice. Taken together, the PTB and miR-221 expres-sion pattern appeared to correlate with the loss of AdipoR1in skeletal muscle of db mice.
GTDF, an AdipoR1 Agonist, and Met ReverseOsteopenia in Diabetic MiceWe previously have shown that the osteoanabolic agentGTDF (23), acting as an AdipoR1 agonist, ameliorates di-abetes in B6.db but not in db mice (32). Because AdipoR1action in bone induces an osteogenic effect (50) and dbbones were AdipoR1 intact (Fig. 4A), we reasoned that
Figure 2—Glucose and free fatty acid (palmitate) are sufficient forinducing osteoblast apoptosis. A: Glucose and palmitate induceloss of osteoblast viability. MCOs were treated for 24 h as indi-cated, and cell viability was determined by an MTT assay andplotted as the percent of viable cells compared with vehicle-treatedcontrols. Dex was used as positive control. The glucose andlong-chain free fatty acid (palmitate) concentrations used herewere based on available references (12,24,54,61). Data aremean 6SE of three independent experiments performed in tripli-cate. *P < 0.05; ***P < 0.001 compared with vehicle-treated con-trol as determined by one-way ANOVA followed by Bonferroniposttest analysis. B: Glucose and palmitate induce osteoblastapoptosis in a concentration-dependent manner. MCOs weretreated for 24 h as indicated, and apoptosis was analyzed byannexin V-FITC and PI staining followed by analysis in a FACSCaliburflow cytometer (Becton Dickinson). Representative dot plots areshown. The right panel shows quantification from two independentexperiments. C: Palmitate but not glucose induces caspase-3 ac-tivation. MCOs were treated for 24 h as indicated, and cleavedcaspase-3 levels were determined by immunoblotting. Data rep-resent three independent experiments. Vehicle for Dex treatmentwas 0.1% DMSO. Vehicle for the glucose-treated group was me-dium containing 5.5 mmol/L glucose, and vehicle for the palmitategroup was medium supplemented with 4% BSA. Glc, glucose;Palm, palmitate; V, vehicle.
2614 AdipoR1/PGC-1a Protect Against Osteopenia Diabetes Volume 64, July 2015
despite its inability to ameliorate diabetes, GTDF may stillshow an osteoanabolic effect in db mice.
Testing the effect of GTDF along with standardantidiabetic drugs necessitated a sufficient number ofage- and sex-matched db mice that was not available inthe present colony; thus, we procured fresh db mice withidentical genetic background. This also allowed us toconfirm that the skeletal phenotype observed in db mice(Fig. 1) were not due to breeding and maintenance-associated local factors. Trabecular and cortical param-eters of both db mice were comparable (SupplementaryFig. 2A and B), and both displayed AdipoR1 expressionin bone but not skeletal muscle (Supplementary Fig. 2C).These newly acquired db mice were then used for furtherstudies.
We treated db mice with GTDF for 4 weeks at a dose(10 mg/kg) that failed to rescue diabetes in them (32),so any osteogenic outcome would not be a consequenceof improved diabetic phenotype. We compared the
skeletal effects of GTDF with clinically used antidiabeticdrugs Met (AMPK/PGC-1a activator) and Pio (PPARgagonist).
Assessment of metabolic parameters revealed thatalthough final body weight significantly increased in Pio-treated mice as expected, GTDF or Met did not alter it(Supplementary Table 1). EchoMRI data showed that Piobut not GTDF or Met significantly increased fat mass,whereas none of the treatments altered lean mass or wa-ter content (Supplementary Table 1). Pio but not GTDF orMet significantly decreased fasting and nonfasting bloodglucose levels, and Pio alone significantly reduced plasmatriglyceride and VLDL levels (Supplementary Table 2).
In gross observation by mCT, deterioration of femo-ral and tibial trabecular architecture was readily ob-served in vehicle-treated db mice, whereas both GTDFand Met caused substantial improvement (Fig. 5A).Compared with vehicle-treated db mice, GTDF-treateddb femur had significantly higher BV/TV, Tb.N, Tb.Th,
Figure 3—Diabetic bones exhibit enhanced skeletal muscle atrogenes and suppressed PGC-1a expression. A: qPCR-based gene ex-pression analysis. Total RNA from femur epiphyses of indicated mice (n = 3/group) was isolated, reverse transcribed, and assessed forexpression of indicated genes in triplicate. b-actin was used for normalization. Data are mean 6 SE. *8-week vs. 12- or 16-week age-groups. #wt vs. db. *P< 0.05; **,##P< 0.01; ***,###P< 0.001 as determined by two-way ANOVA followed by Bonferroni posttest analysis.B: Immunoblot evaluation of PGC-1a and MuRF1 protein levels in femur epiphyses. b-actin was used as loading control (n = 3). C: qPCRgene expression analyses in MCOs. MCOs were treated as indicated for 24 h, and mRNA expressions were analyzed. b-actin was used fornormalization. Data are mean 6 SE of three independent experiments performed in triplicate. *P < 0.05; **P < 0.01; ***P < 0.001 asdetermined by one-way ANOVA followed by Bonferroni posttest analysis. D: Evaluation of PGC-1a and MuRF1 expression by immuno-blotting. b-actin was used as loading control. Data represent three independent experiments with similar results. Glc, glucose; Palm,palmitate; V, vehicle.
diabetes.diabetesjournals.org Khan and Associates 2615
and Conn.D and lower Tb.Sp, and all the parameterswere comparable to wt mice (Fig. 5A), suggesting com-plete trabecular restoration. Although BV/TV, Tb.N,and Tb.Th in the Met-treated group were restoredto wt levels, these mice still had significantly lowerConn.D and higher Tb.Sp than wt mice (Fig. 5A), indi-cating a partial restoration. Pio modestly but signifi-cantly improved BV/TV, Tb.N, Tb.Th, and Conn.D in dbfemur but failed to reduce Tb.Sp, and except for Tb.Thand Tb.N, could not restore other parameters to wt levels
(Fig. 5A). Tibial trabecular data show that except for Tb.Sp,all parameters in db mice were significantly lower than inwt mice (Fig. 5A). GTDF-treated db mice displayed signif-icant improvement in all tibial parameters, and except forBV/TV and Tb.Sp, the rest were restored to wt levels (Fig.5A), suggesting substantial tibial restoration. Met causedpartial tibial restoration because only Tb.Th and Conn.Dwere comparable to wt (Fig. 5A). Pio was ineffective inrestoring tibial cancellous bone because all parameterswere lower than wt (Fig. 5A).
Biomechanical strength of femur diaphysis assessed by3-point bending showed that db mice had significantlylower strength parameters than wt mice (data not shown)and that GTDF- and Met- but not Pio-treated db micedisplayed significantly higher resistance to bending thanvehicle-treated db mice, as evidenced from higher energy,failure load, and stiffness (Fig. 5B).
Furthermore, GTDF- and Met- but not Pio-treated dbmice had higher periosteal cell numbers (Fig. 5C and Sup-plementary Fig. 3). Osteogenic effect of GTDF and Metwas also evident from significantly higher Runx2 andOCN mRNAs in femur epiphysis of db mice treated withthem, whereas Pio had no effect (Fig. 5D). Additionally,GTDF and Met but not Pio significantly lowered expres-sion of adipogenic markers PPARg and CCAAT-enhancer-binding protein a in db mice (Fig. 5D). In support of directeffects of GTDF and Met on osteoblasts, the cytotoxic andapoptosis-inducing effects of glucose and palmitate onosteoblasts were mitigated by GTDF and Met but not Pio(Fig. 5E and F).
AMPK is a key downstream mediator of AdipoR1signaling, which phosphorylates and thereby activatesPGC-1a (47). Osteoblasts in vehicle-treated db femurepiphysis had severely depleted pAMPK comparedwith wt (Fig. 6A). Consistent with the AdipoR1-intactstatus of diabetic bone, GTDF-treated db epiphysis hadsignificantly higher pAMPK than vehicle-treated db (Fig.6A). Met activates AMPK and, thereby, stimulates oste-oblast differentiation (51,52), and consistent with thisfinding, Met-treated db mice displayed significantlyhigher pAMPK than vehicle controls (Fig. 6A). Pio-treated db also had modest but significantly higher pAMPKthan vehicle-treated db (Fig. 6A). Similar to AMPK, PGC-1a expression in osteoblasts was severely lower invehicle-treated db mice, and GTDF and Met but not Piorestored it (Fig. 6A and Supplementary Fig. 4). MuRF1displays an inverse correlation with PGC-1a (Fig. 3)(44). In the current study, MuRF1 was also stronglyexpressed in vehicle-treated db osteoblasts, and inGTDF- and Met- but not Pio-treated db mice, its expres-sion was significantly lowered (Fig. 6A and SupplementaryFig. 4). These results were confirmed by immunoblottingusing whole marrow–free femur and tibia, where al-though PGC-1a was undetectable in vehicle- and Pio-treated db mice, it was strongly expressed in GTDF- orMet-treated db mice (Fig. 6B). Conversely, MuRF-1 levelwas high in vehicle- and Pio-treated db bones, whereas
Figure 4—The db bones but not skeletal muscle express AdipoR1,bind to gAd, and induce AMPK phosphorylation. A: Evaluation ofAdipoR1 protein level in wt or diabetic mice. Total protein was iso-lated from femur epiphysis or extensor digitorum longus musclesfrom wt, B6.db, or db mice, and AdipoR1 expression was deter-mined by immunoblotting (n = 3). B: The db bones but not skeletalmuscle displayed gAd sensitivity. The wt or db mice were intraper-itoneally injected with vehicle (PBS) or gAd. Thirty minutes afterinjection, mice were killed, and total protein from extensor digitorumlongus muscles and marrow-free femurs were used for determina-tion of pAMPK and AMPK levels by immunoblotting (n = 3/group).C: Determination of age- and strain-dependent bone and skeletalmuscle expression of PTB and miR-221. For miR-221, total miR frombone and gastrocnemius muscle was isolated using an miR isolation kit.miR-221 values were normalized with U6 expression and plotted. ForPTB, total RNA isolated from the same tissues was used. Data aremean 6 SEM of three independent experiments performed in tripli-cate. *8 week vs. 12- or 16-week age-groups; #wt vs. B6.db or db;@B6.db vs. db. *,#,@P< 0.05; **,##P< 0.01; ***,###,@@@P< 0.001 asdetermined by two-way ANOVA followed by Bonferroni posttestanalysis. V, vehicle.
2616 AdipoR1/PGC-1a Protect Against Osteopenia Diabetes Volume 64, July 2015
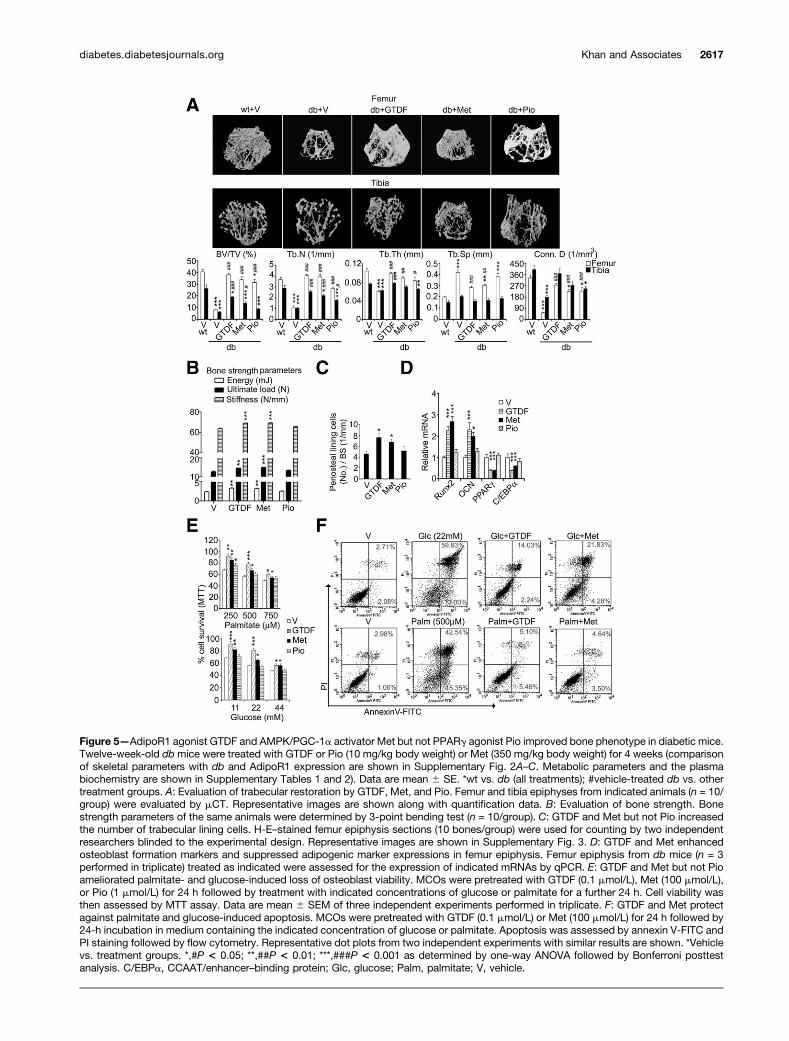
Figure 5—AdipoR1 agonist GTDF and AMPK/PGC-1a activator Met but not PPARg agonist Pio improved bone phenotype in diabetic mice.Twelve-week-old dbmice were treated with GTDF or Pio (10 mg/kg body weight) or Met (350 mg/kg body weight) for 4 weeks (comparisonof skeletal parameters with db and AdipoR1 expression are shown in Supplementary Fig. 2A–C. Metabolic parameters and the plasmabiochemistry are shown in Supplementary Tables 1 and 2). Data are mean 6 SE. *wt vs. db (all treatments); #vehicle-treated db vs. othertreatment groups. A: Evaluation of trabecular restoration by GTDF, Met, and Pio. Femur and tibia epiphyses from indicated animals (n = 10/group) were evaluated by mCT. Representative images are shown along with quantification data. B: Evaluation of bone strength. Bonestrength parameters of the same animals were determined by 3-point bending test (n = 10/group). C: GTDF and Met but not Pio increasedthe number of trabecular lining cells. H-E–stained femur epiphysis sections (10 bones/group) were used for counting by two independentresearchers blinded to the experimental design. Representative images are shown in Supplementary Fig. 3. D: GTDF and Met enhancedosteoblast formation markers and suppressed adipogenic marker expressions in femur epiphysis. Femur epiphysis from db mice (n = 3performed in triplicate) treated as indicated were assessed for the expression of indicated mRNAs by qPCR. E: GTDF and Met but not Pioameliorated palmitate- and glucose-induced loss of osteoblast viability. MCOs were pretreated with GTDF (0.1 mmol/L), Met (100 mmol/L),or Pio (1 mmol/L) for 24 h followed by treatment with indicated concentrations of glucose or palmitate for a further 24 h. Cell viability wasthen assessed by MTT assay. Data are mean 6 SEM of three independent experiments performed in triplicate. F: GTDF and Met protectagainst palmitate and glucose-induced apoptosis. MCOs were pretreated with GTDF (0.1 mmol/L) or Met (100 mmol/L) for 24 h followed by24-h incubation in medium containing the indicated concentration of glucose or palmitate. Apoptosis was assessed by annexin V-FITC andPI staining followed by flow cytometry. Representative dot plots from two independent experiments with similar results are shown. *Vehiclevs. treatment groups. *,#P < 0.05; **,##P < 0.01; ***,###P < 0.001 as determined by one-way ANOVA followed by Bonferroni posttestanalysis. C/EBPa, CCAAT/enhancer–binding protein; Glc, glucose; Palm, palmitate; V, vehicle.
diabetes.diabetesjournals.org Khan and Associates 2617
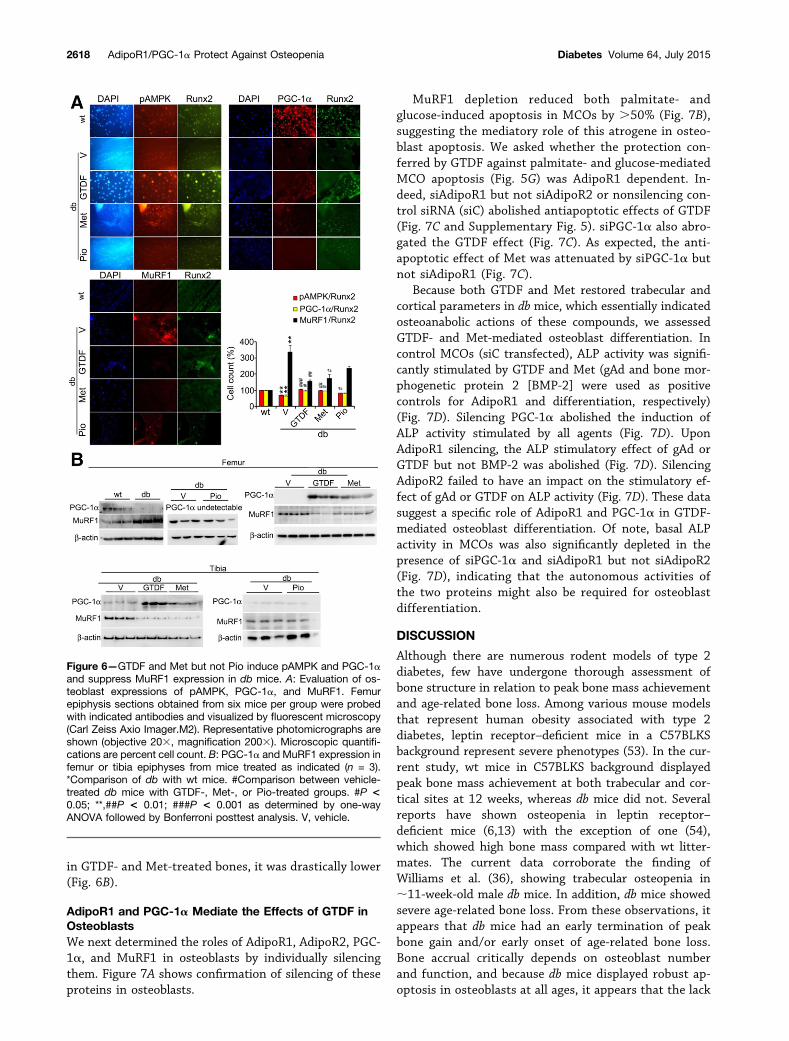
in GTDF- and Met-treated bones, it was drastically lower(Fig. 6B).
AdipoR1 and PGC-1a Mediate the Effects of GTDF inOsteoblastsWe next determined the roles of AdipoR1, AdipoR2, PGC-1a, and MuRF1 in osteoblasts by individually silencingthem. Figure 7A shows confirmation of silencing of theseproteins in osteoblasts.
MuRF1 depletion reduced both palmitate- andglucose-induced apoptosis in MCOs by .50% (Fig. 7B),suggesting the mediatory role of this atrogene in osteo-blast apoptosis. We asked whether the protection con-ferred by GTDF against palmitate- and glucose-mediatedMCO apoptosis (Fig. 5G) was AdipoR1 dependent. In-deed, siAdipoR1 but not siAdipoR2 or nonsilencing con-trol siRNA (siC) abolished antiapoptotic effects of GTDF(Fig. 7C and Supplementary Fig. 5). siPGC-1a also abro-gated the GTDF effect (Fig. 7C). As expected, the anti-apoptotic effect of Met was attenuated by siPGC-1a butnot siAdipoR1 (Fig. 7C).
Because both GTDF and Met restored trabecular andcortical parameters in db mice, which essentially indicatedosteoanabolic actions of these compounds, we assessedGTDF- and Met-mediated osteoblast differentiation. Incontrol MCOs (siC transfected), ALP activity was signifi-cantly stimulated by GTDF and Met (gAd and bone mor-phogenetic protein 2 [BMP-2] were used as positivecontrols for AdipoR1 and differentiation, respectively)(Fig. 7D). Silencing PGC-1a abolished the induction ofALP activity stimulated by all agents (Fig. 7D). UponAdipoR1 silencing, the ALP stimulatory effect of gAd orGTDF but not BMP-2 was abolished (Fig. 7D). SilencingAdipoR2 failed to have an impact on the stimulatory ef-fect of gAd or GTDF on ALP activity (Fig. 7D). These datasuggest a specific role of AdipoR1 and PGC-1a in GTDF-mediated osteoblast differentiation. Of note, basal ALPactivity in MCOs was also significantly depleted in thepresence of siPGC-1a and siAdipoR1 but not siAdipoR2(Fig. 7D), indicating that the autonomous activities ofthe two proteins might also be required for osteoblastdifferentiation.
DISCUSSION
Although there are numerous rodent models of type 2diabetes, few have undergone thorough assessment ofbone structure in relation to peak bone mass achievementand age-related bone loss. Among various mouse modelsthat represent human obesity associated with type 2diabetes, leptin receptor–deficient mice in a C57BLKSbackground represent severe phenotypes (53). In the cur-rent study, wt mice in C57BLKS background displayedpeak bone mass achievement at both trabecular and cor-tical sites at 12 weeks, whereas db mice did not. Severalreports have shown osteopenia in leptin receptor–deficient mice (6,13) with the exception of one (54),which showed high bone mass compared with wt litter-mates. The current data corroborate the finding ofWilliams et al. (36), showing trabecular osteopenia in;11-week-old male db mice. In addition, db mice showedsevere age-related bone loss. From these observations, itappears that db mice had an early termination of peakbone gain and/or early onset of age-related bone loss.Bone accrual critically depends on osteoblast numberand function, and because db mice displayed robust ap-optosis in osteoblasts at all ages, it appears that the lack
Figure 6—GTDF and Met but not Pio induce pAMPK and PGC-1aand suppress MuRF1 expression in db mice. A: Evaluation of os-teoblast expressions of pAMPK, PGC-1a, and MuRF1. Femurepiphysis sections obtained from six mice per group were probedwith indicated antibodies and visualized by fluorescent microscopy(Carl Zeiss Axio Imager.M2). Representative photomicrographs areshown (objective 203, magnification 2003). Microscopic quantifi-cations are percent cell count. B: PGC-1a and MuRF1 expression infemur or tibia epiphyses from mice treated as indicated (n = 3).*Comparison of db with wt mice. #Comparison between vehicle-treated db mice with GTDF-, Met-, or Pio-treated groups. #P <0.05; **,##P < 0.01; ###P < 0.001 as determined by one-wayANOVA followed by Bonferroni posttest analysis. V, vehicle.
2618 AdipoR1/PGC-1a Protect Against Osteopenia Diabetes Volume 64, July 2015
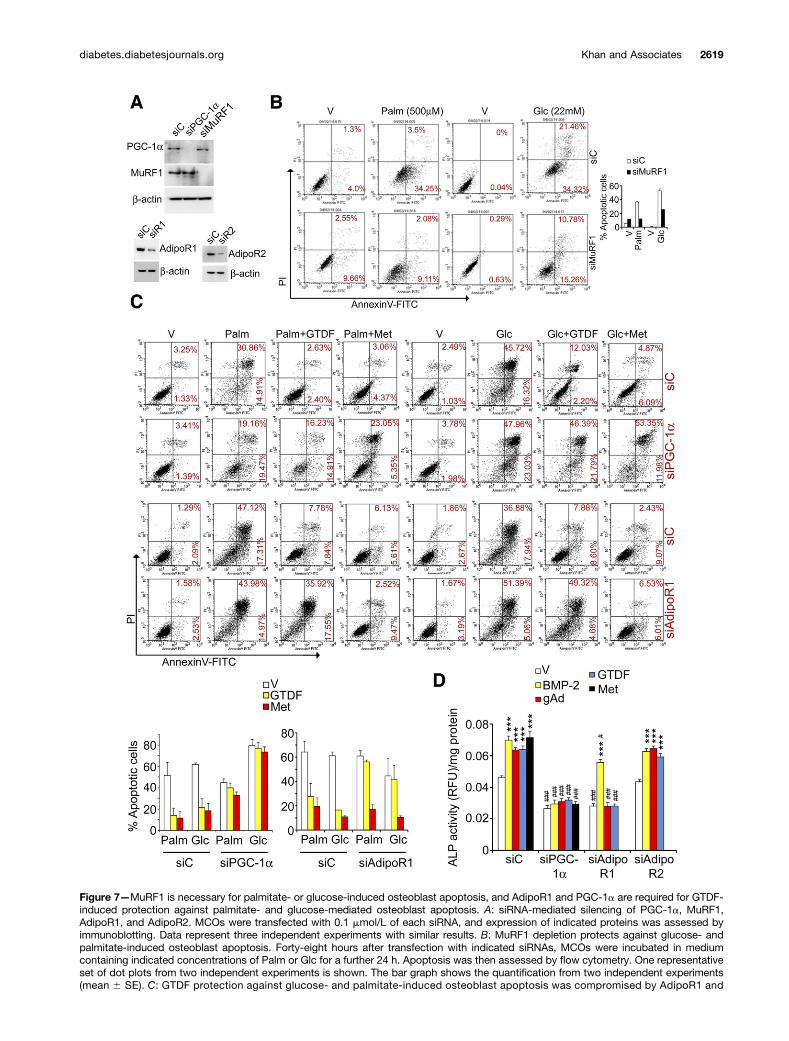
Figure 7—MuRF1 is necessary for palmitate- or glucose-induced osteoblast apoptosis, and AdipoR1 and PGC-1a are required for GTDF-induced protection against palmitate- and glucose-mediated osteoblast apoptosis. A: siRNA-mediated silencing of PGC-1a, MuRF1,AdipoR1, and AdipoR2. MCOs were transfected with 0.1 mmol/L of each siRNA, and expression of indicated proteins was assessed byimmunoblotting. Data represent three independent experiments with similar results. B: MuRF1 depletion protects against glucose- andpalmitate-induced osteoblast apoptosis. Forty-eight hours after transfection with indicated siRNAs, MCOs were incubated in mediumcontaining indicated concentrations of Palm or Glc for a further 24 h. Apoptosis was then assessed by flow cytometry. One representativeset of dot plots from two independent experiments is shown. The bar graph shows the quantification from two independent experiments(mean 6 SE). C: GTDF protection against glucose- and palmitate-induced osteoblast apoptosis was compromised by AdipoR1 and
diabetes.diabetesjournals.org Khan and Associates 2619

of viable osteoblasts and resultant deficiency in osteo-blast function in the db bones was responsible for thefailure in peak bone mass achievement and acceleratedthe development of age-related osteopenia. Bone forma-tion is consistently lower in patients with type 2 diabetescompared with those without diabetes as evidenced bylower serum OCN (55), and as reported before (36), weobserved that db mice also have markedly lower OCNlevels at all ages than wt mice.
Glucose and palmitate induced mouse primary oste-oblast apoptosis at pathologically relevant concentra-tions. The extent of cytotoxicity induced by palmitateand glucose was comparable to Dex, a potent inducer ofosteopenia (33). It thus appears that the combined effectof glucotoxicity and lipotoxicity causes osteopenia equiv-alent in severity to that caused by Dex, and diabeticbones indeed shared common features of Dex-inducedosteoporosis because bone was lost at both trabecularand cortical sites.
Tumor suppressor p53 is a negative regulator ofosteoblast differentiation because it suppresses Runx2expression, and hypermorphic p53 mutation in micecauses osteopenia (56). In db bones, p53 was increasedand Runx2 suppressed, suggesting reduced osteoblastnumber and differentiation. Skeletal muscle atrogeneswere also elevated in the db bones and showed an age-related increase, which could also negatively affect osteo-blast survival and differentiation. In fact, silencingMuRF1 conferred robust protection against palmitate-and glucose-mediated MCO apoptosis. It is possible thatother atrogenes (atrogin-1 and cathepsin L) also play keyroles in osteopenia induced by various stresses becausethese factors were also induced in db bones and glucose-and palmitate-treated MCOs. Other reports support sucha notion, as mice lacking these atrogenes are protectedfrom osteopenia under diverse stresses (45,46). In con-trast, the muscle anabolic factor PGC-1a exhibited an age-related decline in db mice. Therefore, it appears that likeskeletal muscle, a reciprocal relationship between MuRF1and PGC-1a exists in osteoblasts. Thus, loss of osteoblastpopulation and function in db bones may occur due tosuppression of PGC-1a and induction of atrogenes. Theregulation and possible interaction of p53 and Runx2with MuRF1 and PGC-1a would be an interesting futuretopic of investigation.
AdipoR1 increases insulin sensitivity and promotescellular energy expenditure by activating AMPK andPGC-1a, and AdipoR1 activation represents an attractivetherapeutic approach for the treatment of obesity andtype 2 diabetes (48). Previously, we showed that db skel-etal muscle is deficient in AdipoR1 expression (32). Incontrast, we show here that diabetic bones are AdipoR1intact. The explanation behind this appears to involvetwo negative AdipoR1 regulators, PTB and miR-221 (49),because both, especially PTB, were expressed at muchhigher levels in skeletal muscle than in bones of diabeticmice.
Adiponectin and its receptors are expressed in bonemarrow stromal cells, which suggests their potentialrole in bone metabolism (57). C57BL6/J mice treatedwith adenoviral-derived adiponectin had increased tra-becular bone mass and enhanced mineralization activityof osteoblasts (58). Mice harboring porcine AdipoR1transgene had higher bone volume and trabecular num-bers than age- and sex-matched controls (50). Culturesof bone marrow stromal cells from adiponectin knock-out mice showed significantly less osteogenesis thancultures from adiponectin-intact mice (57). Together,these reports suggest that adiponectin may regulatebone formation in an autocrine/paracrine manner inaddition to endocrine mode. Although AdipoR1 expres-sion in db bones was comparable to wt, osteopenia in dbmice could be attributed to their observed hypoadipo-nectinemia.
To investigate whether AdipoR1 in bone, and morespecifically osteoblasts, of diabetic mice could be pharma-cologically targeted to mitigate osteopenia through anosteoanabolic mechanism, we used GTDF. We have shownthat GTDF improves diabetic phenotypes in B6.db micewith intact AdipoR1 in skeletal muscle and liver but not indb mice that lacked functional AdipoR1 in these tissues(32). Thus, db mice with skeletal (but not muscular) ex-pression of functional AdipoR1 allowed us to selectivelyactivate AdipoR1 in bone without correcting the diabeticphenotype. The most common clinically used drugs, Metand Pio, were used at their pharmacologically relevantdoses for comparison of skeletal effects between thedrugs.
Neither GTDF nor Met improved diabetic pheno-types in db, but Pio was modestly effective, although it
PGC-1a silencing. Forty-eight hours after transfection with indicated siRNAs, MCOs were incubated in medium containing glucose (22mmol/L) or palmitate (500 mmol/L) supplemented with vehicle, GTDF (0.1 mmol/L), or Met (100 mmol/L) for a further 24 h. Apoptosis wasthen assessed by flow cytometry. One representative set of dot plots from two independent experiments is shown. The bar graph showsthe quantification from two independent experiments. AdipoR2 silencing failed to influence GTDF or Met effects (Supplementary Fig. 5). D:GTDF- and gAd-mediated osteoblast differentiation depends on PGC-1a and AdipoR1 but not on AdipoR2. Forty-eight hours aftertransfection with indicated siRNAs, MCOs were incubated in differentiation medium supplemented with vehicle, GTDF (0.1 mmol/L), gAd(1 mg/mL), BMP-2 (0.1 mg/mL), or Met (100 mmol/L). Twenty-four hours after treatment, osteoblast differentiation was determined byfluorometric quantification of the differentiation marker ALP. Data are mean6 SE of three independent experiments performed in duplicate.*Vehicle vs. treatment groups, #siC vs. other siRNA-transfected groups. ***P < 0.001; #P < 0.05; ###P < 0.001 as determined by two-wayANOVA followed by Bonferroni posttest analysis. Glc, glucose; Palm, palmitate; RFU, relative fluorescence unit; siR1, siRNA againstAdipoR1; siR2, siRNA against AdipoR2; V, vehicle.
2620 AdipoR1/PGC-1a Protect Against Osteopenia Diabetes Volume 64, July 2015
failed to reduce NEFA levels but did reduce fasting andnonfasting serum glucose levels, which were still signif-icantly higher than in wt. GTDF and Met improvedtrabecular microarchitecture and increased bonestrength and bone lining cells. Pio was mostly ineffec-tive because some improvement in femur epiphysis wasseen, but tibia metaphysis, where bone is actually ac-crued less than in femur, showed no improvement. Ad-ditionally, strength parameters were not improved byPio, and Pio did not increase periosteal cell number.The modest skeletal improvement by Pio could be dueto modest mitigation of diabetic phenotypes becausePio failed to confer protection against gluco- and lipo-toxicity on isolated osteoblasts. The skeletal improve-ment by GTDF and Met without altering diabeticphenotype as well as the protection imparted by themon isolated osteoblasts against glucose and palmitateassault clearly indicate that GTDF and Met had directosteoblastic effects. The current data are also supportedby previous reports where Met was shown to directlyinduce osteoblast differentiation (51,59) and protectagainst high-glucose–mediated inhibition of osteoblastgrowth (60).
Although both GTDF and Met restored bones of dbmice by likely preserving osteoblasts against gluco- andlipotoxicity, the molecular mechanism of action of the twowere different. Silencing AdipoR1 but not AdipoR2 abro-gated the prosurvival and differentiation-promotingeffects of GTDF, thus suggesting its AdipoR1-specific ef-fect in osteoblasts as observed earlier in myocytes (32).Skeletal effects of Met, however, were blocked by silencingPGC-1a but not AdipoR1, suggesting that the osteoana-bolic effect of the drug was mediated by PGC-1a and notAdipoR1, which was supported by Met failing to replace125I-gAd in a radioligand competition assay (data notshown). Salient findings of the current study are summa-rized in Fig. 8.
In conclusion, this study showed that diabetic mice ina BLKS background have poor achievement of peak bonemass and age-related development of severe osteopenia.Inducing and activating PGC-1a in osteoblasts by GTDFor Met completely reverse osteopenia in these mice with-out correcting diabetic phenotypes.
Acknowledgments. The authors acknowledge the sophisticated an-alytical instrument facility of the Central Drug Research Institute for helpwith confocal microscopy and flow cytometry. The authors also acknowl-edge technical support provided by Kavita Singh of the Sophisticated Analyti-cal Instrument Facility, CSIR-Central Drug Research Institute for confocalmicroscopy.Funding. M.P.K. and M.Y. were supported by the Indian Council of MedicalResearch. A.K.S. and A.G. were supported by fellowships from CSIR. S.Sh., H.K.,J.S.M., and S.K. were supported by the University Grants Commission. S.Sa. andN.C. acknowledge funding from the CSIR Network project ASTHI (Anabolic Skel-etal Targets in Health and Illness).Duality of Interest. A.A.J. and M.R.J. are employees of Zydus ResearchCentre, the research and development arm of Cadila Healthcare Ltd. No otherpotential conflicts of interest relevant to this article were reported.Author Contributions. M.P.K. contributed to the experimental designand performance, data analysis, and discussion. A.K.S. contributed to the exper-imental design, performance, and supervision; data analysis; and discussion.A.A.J., M.Y., S.Sh., H.K., A.G., J.S.M., M.C.T., G.K.N., and S.K. contributed toperforming the experiments and to the data analysis and discussion. R.R., M.R.J.,A.K.T., and R.M. contributed to supervising the experiments and to the dataanalysis and discussion. A.S. contributed to the data analysis and discussion.M.M.G. contributed to the experimental performance and supervision, dataanalysis, and discussion. J.R.G. contributed to the experimental design andsupervision, data analysis, and discussion. S.Sa. contributed to the studyconcept, experimental design and supervision, data analysis, discussion, andwriting of the manuscript. N.C. contributed to the experimental design andsupervision, data analysis, discussion, and writing of the manuscript. N.C. isthe guarantor of this work and, as such, had full access to all the data in thestudy and takes responsibility for the integrity of the data and the accuracy ofthe data analysis.
References1. Janghorbani M, Van Dam RM, Willett WC, Hu FB. Systematic review of type 1and type 2 diabetes mellitus and risk of fracture. Am J Epidemiol 2007;166:495–5052. Bonds DE, Larson JC, Schwartz AV, et al. Risk of fracture in women withtype 2 diabetes: the Women’s Health Initiative Observational Study. J Clin En-docrinol Metab 2006;91:3404–3410
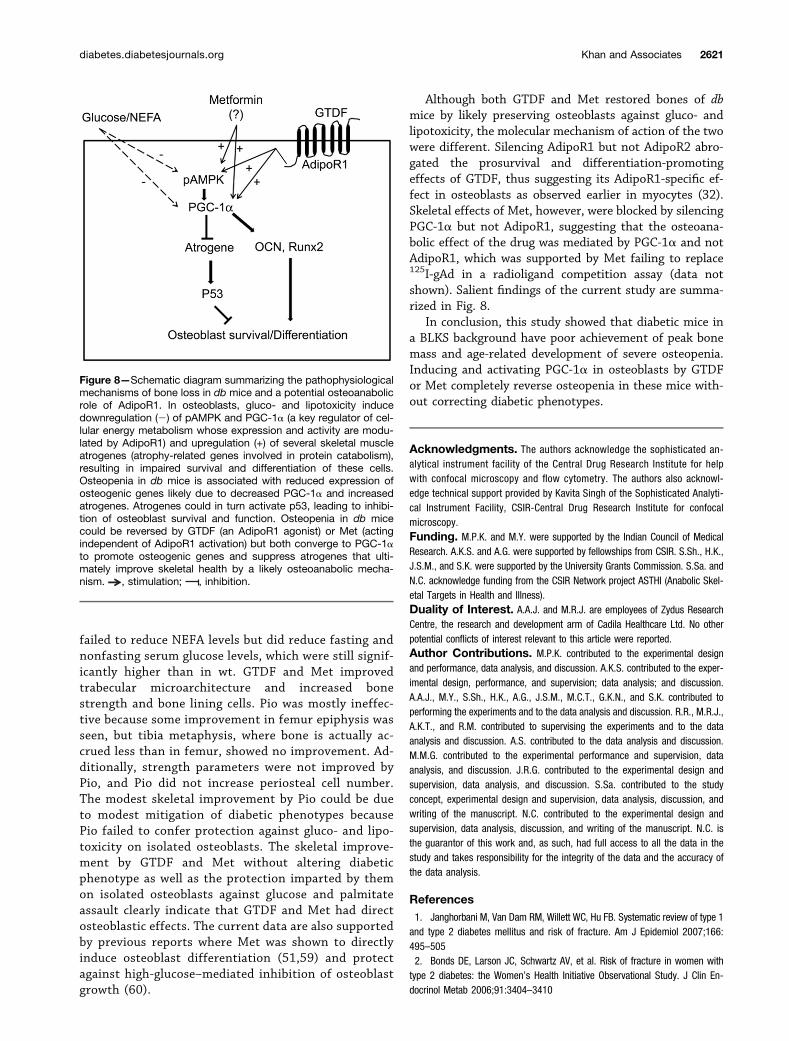
Figure 8—Schematic diagram summarizing the pathophysiologicalmechanisms of bone loss in db mice and a potential osteoanabolicrole of AdipoR1. In osteoblasts, gluco- and lipotoxicity inducedownregulation (2) of pAMPK and PGC-1a (a key regulator of cel-lular energy metabolism whose expression and activity are modu-lated by AdipoR1) and upregulation (+) of several skeletal muscleatrogenes (atrophy-related genes involved in protein catabolism),resulting in impaired survival and differentiation of these cells.Osteopenia in db mice is associated with reduced expression ofosteogenic genes likely due to decreased PGC-1a and increasedatrogenes. Atrogenes could in turn activate p53, leading to inhibi-tion of osteoblast survival and function. Osteopenia in db micecould be reversed by GTDF (an AdipoR1 agonist) or Met (actingindependent of AdipoR1 activation) but both converge to PGC-1ato promote osteogenic genes and suppress atrogenes that ulti-mately improve skeletal health by a likely osteoanabolic mecha-nism. , stimulation; , inhibition.
diabetes.diabetesjournals.org Khan and Associates 2621
3. Kilpadi KL, Eldabaje R, Schmitz JE, et al. Type 2 diabetes is associated withvertebral fractures in a sample of clinic- and hospital-based Latinos. J ImmigrMinor Health 2014;16:440–4494. Viégas M, Costa C, Lopes A, Griz L, Medeiro MA, Bandeira F. Prevalence ofosteoporosis and vertebral fractures in postmenopausal women with type 2 di-abetes mellitus and their relationship with duration of the disease and chroniccomplications. J Diabetes Complications 2011;25:216–2215. Schwartz AV, Vittinghoff E, Bauer DC, et al.; Study of Osteoporotic Fractures(SOF) Research Group; Osteoporotic Fractures in Men (MrOS) Research Group;Health, Aging, and Body Composition (Health ABC) Research Group. Associationof BMD and FRAX score with risk of fracture in older adults with type 2 diabetes.JAMA 2011;305:2184–21926. Yamamoto M, Yamaguchi T, Yamauchi M, Kaji H, Sugimoto T. Diabeticpatients have an increased risk of vertebral fractures independent of BMD ordiabetic complications. J Bone Miner Res 2009;24:702–7097. Hernandez RK, Do TP, Critchlow CW, Dent RE, Jick SS. Patient-related riskfactors for fracture-healing complications in the United Kingdom General PracticeResearch Database. Acta Orthop 2012;83:653–6608. Gooch HL, Hale JE, Fujioka H, Balian G, Hurwitz SR. Alterations of cartilageand collagen expression during fracture healing in experimental diabetes. Con-nect Tissue Res 2000;41:81–919. Topping RE, Bolander ME, Balian G. Type X collagen in fracture callus andthe effects of experimental diabetes. Clin Orthop Relat Res 1994;308:220–22810. Schwartz AV, Garnero P, Hillier TA, et al.; Health, Aging, and Body Com-position Study. Pentosidine and increased fracture risk in older adults with type 2diabetes. J Clin Endocrinol Metab 2009;94:2380–238611. Farr JN, Drake MT, Amin S, Melton LJ 3rd, McCready LK, Khosla S. In vivoassessment of bone quality in postmenopausal women with type 2 diabetes.J Bone Miner Res 2014;29:787–79512. Patsch JM, Burghardt AJ, Yap SP, et al. Increased cortical porosity in type 2diabetic postmenopausal women with fragility fractures. J Bone Miner Res 2013;28:313–32413. Fajardo RJ, Karim L, Calley VI, Bouxsein ML. A review of rodent models oftype 2 diabetic skeletal fragility. J Bone Miner Res 2014;29:1025–104014. Orland MJ, Permutt MA. Quantitative analysis of pancreatic proinsulin mRNAin genetically diabetic (db/db) mice. Diabetes 1987;36:341–34715. Alberti G, Zimmet P, Shaw J, Bloomgarden Z, Kaufman F, Silink M; Con-sensus Workshop Group. Type 2 diabetes in the young: the evolving epidemic:the international diabetes federation consensus workshop. Diabetes Care 2004;27:1798–181116. Song SH, Hardisty CA. Early-onset Type 2 diabetes mellitus: an increasingphenomenon of elevated cardiovascular risk. Expert Rev Cardiovasc Ther 2008;6:315–32217. Zeitler P, Hirst K, Pyle L, et al.; TODAY Study Group. A clinical trial to maintainglycemic control in youth with type 2 diabetes. N Engl J Med 2012;366:2247–225618. Pinhas-Hamiel O, Zeitler P. The global spread of type 2 diabetes mellitus inchildren and adolescents. J Pediatr 2005;146:693–70019. Polonsky KS. Lilly Lecture 1994. The beta-cell in diabetes: from moleculargenetics to clinical research. Diabetes 1995;44:705–71720. Fajans SS, Bell GI, Polonsky KS. Molecular mechanisms and clinicalpathophysiology of maturity-onset diabetes of the young. N Engl J Med 2001;345:971–98021. Giuffrida FM, Reis AF. Genetic and clinical characteristics of maturity-onsetdiabetes of the young. Diabetes Obes Metab 2005;7:318–32622. Pollock NK, Bernard PJ, Wenger K, et al. Lower bone mass in pre-pubertal overweight children with prediabetes. J Bone Miner Res 2010;25:2760–276923. Sharan K, Mishra JS, Swarnkar G, et al. A novel quercetin analogue froma medicinal plant promotes peak bone mass achievement and bone healing afterinjury and exerts an anabolic effect on osteoporotic bone: the role of aryl hy-drocarbon receptor as a mediator of osteogenic action. J Bone Miner Res 2011;26:2096–2111
24. Reagan-Shaw S, Nihal M, Ahmad N. Dose translation from animal to humanstudies revisited. FASEB J 2008;22:659–66125. Khan K, Singh A, Mittal M, et al. [6]-Gingerol induces bone loss in ovaryintact adult mice and augments osteoclast function via the transient receptorpotential vanilloid 1 channel. Mol Nutr Food Res 2012;56:1860–187326. Swarnkar G, Sharan K, Siddiqui JA, et al. A naturally occurring naringeninderivative exerts potent bone anabolic effects by mimicking oestrogen action onosteoblasts. Br J Pharmacol 2012;165:1526–154227. Bouxsein ML, Boyd SK, Christiansen BA, Guldberg RE, Jepsen KJ, Müller R.Guidelines for assessment of bone microstructure in rodents using micro-computed tomography. J Bone Miner Res 2010;25:1468–148628. Srivastava K, Khan K, Tyagi AM, et al. Greater skeletal gains in ovary intactrats at maturity are achieved by supplementing a standardized extract of Buteamonosperma stem bark that confers better bone conserving effect followingovariectomy and concurrent treatment withdrawal. Evid Based ComplementAlternat Med 2013;2013:51938729. Gautam AK, Bhargavan B, Tyagi AM, et al. Differential effects of for-mononetin and cladrin on osteoblast function, peak bone mass achievement andbioavailability in rats. J Nutr Biochem 2011;22:318–32730. Wong GL. Basal activities and hormone responsiveness of osteoclast-likeand osteoblast-like bone cells are regulated by glucocorticoids. J Biol Chem1979;254:6337–634031. Maniatopoulos C, Sodek J, Melcher AH. Bone formation in vitro by stromalcells obtained from bone marrow of young adult rats. Cell Tissue Res 1988;254:317–33032. Singh AK, Joharapurkar AA, Khan MP, et al. Orally active osteoanabolicagent 6GTDF binds to adiponectin receptors, with a preference for AdipoR1,induces adiponectin-associated signaling and improves metabolic health ina rodent model of diabetes. Diabetes 2014;63:3530–354433. Khan MP, Mishra JS, Sharan K, et al. A novel flavonoid C-glucoside fromUlmus wallichiana preserves bone mineral density, microarchitecture and bio-mechanical properties in the presence of glucocorticoid by promoting osteoblastsurvival: a comparative study with human parathyroid hormone. Phytomedicine2013;20:1256–126634. Weinstein RS, Manolagas SC. Apoptosis and osteoporosis. Am J Med 2000;108:153–16435. Miller SC, de Saint-Georges L, Bowman BM, Jee WS. Bone lining cells:structure and function. Scanning Microsc 1989;3:953–960; discussion 960–96136. Williams GA, Callon KE, Watson M, et al. Skeletal phenotype of the leptinreceptor-deficient db/db mouse. J Bone Miner Res 2011;26:1698–170937. Harrity T, Farrelly D, Tieman A, et al. Muraglitazar, a novel dual (alpha/gamma) peroxisome proliferator-activated receptor activator, improves diabetesand other metabolic abnormalities and preserves beta-cell function in db/dbmice. Diabetes 2006;55:240–24838. Yamauchi T, Kamon J, Waki H, et al. The fat-derived hormone adiponectinreverses insulin resistance associated with both lipoatrophy and obesity. Nat Med2001;7:941–94639. Liang H, Ward WF. PGC-1alpha: a key regulator of energy metabolism. AdvPhysiol Educ 2006;30:145–15140. Coll T, Jové M, Rodríguez-Calvo R, et al. Palmitate-mediated down-regulation of peroxisome proliferator-activated receptor-g coactivator 1a inskeletal muscle cells involves MEK1/2 and nuclear factor-kB activation. Diabetes2006;55:2779–278741. Nervina JM, Magyar CE, Pirih FQ, Tetradis S. PGC-1alpha is induced byparathyroid hormone and coactivates Nurr1-mediated promoter activity in os-teoblasts. Bone 2006;39:1018–102542. Chen CT, Shih YR, Kuo TK, Lee OK, Wei YH. Coordinated changesof mitochondrial biogenesis and antioxidant enzymes during osteogenicdifferentiation of human mesenchymal stem cells. Stem Cells 2008;26:960–96843. Akhmedov D, Berdeaux R. The effects of obesity on skeletal muscle re-generation. Front Physiol 2013;4:371
2622 AdipoR1/PGC-1a Protect Against Osteopenia Diabetes Volume 64, July 2015
44. Sandri M, Lin J, Handschin C, et al. PGC-1alpha protects skeletal musclefrom atrophy by suppressing FoxO3 action and atrophy-specific gene tran-scription. Proc Natl Acad Sci U S A 2006;103:16260–1626545. Kondo H, Ezura Y, Nakamoto T, et al. MURF1 deficiency suppressesunloading-induced effects on osteoblasts and osteoclasts to lead to bone loss.J Cell Biochem 2011;112:3525–353046. Potts W, Bowyer J, Jones H, et al. Cathepsin L-deficient mice exhibit ab-normal skin and bone development and show increased resistance to osteopo-rosis following ovariectomy. Int J Exp Pathol 2004;85:85–9647. Iwabu M, Yamauchi T, Okada-Iwabu M, et al. Adiponectin and AdipoR1regulate PGC-1alpha and mitochondria by Ca(2+) and AMPK/SIRT1. Nature 2010;464:1313–131948. Yamauchi T, Kadowaki T. Physiological and pathophysiological roles ofadiponectin and adiponectin receptors in the integrated regulation of metabolicand cardiovascular diseases. Int J Obes (Lond) 2008;32(Suppl. 7):S13–S1849. Lustig Y, Barhod E, Ashwal-Fluss R, et al. RNA-binding protein PTB andmicroRNA-221 coregulate AdipoR1 translation and adiponectin signaling. Di-abetes 2014;63:433–44550. Lin YY, Chen CY, Chuang TY, et al. Adiponectin receptor 1 regulates boneformation and osteoblast differentiation by GSK-3b/b-catenin signaling in mice.Bone 2014;64:147–15451. Molinuevo MS, Schurman L, McCarthy AD, et al. Effect of metformin onbone marrow progenitor cell differentiation: in vivo and in vitro studies. J BoneMiner Res 2010;25:211–22152. Kanazawa I, Yamaguchi T, Yano S, Yamauchi M, Sugimoto T. Metforminenhances the differentiation and mineralization of osteoblastic MC3T3-E1 cellsvia AMP kinase activation as well as eNOS and BMP-2 expression. BiochemBiophys Res Commun 2008;375:414–419
53. Davis RC, Castellani LW, Hosseini M, et al. Early hepatic insulin resistanceprecedes the onset of diabetes in obese C57BLKS-db/db mice. Diabetes 2010;59:1616–162554. Ducy P, Amling M, Takeda S, et al. Leptin inhibits bone formationthrough a hypothalamic relay: a central control of bone mass. Cell 2000;100:197–20755. Díaz-López A, Bulló M, Juanola-Falgarona M, et al. Reduced serum con-centrations of carboxylated and undercarboxylated osteocalcin are associatedwith risk of developing type 2 diabetes mellitus in a high cardiovascular riskpopulation: a nested case-control study. J Clin Endocrinol Metab 2013;98:4524–453156. Wang X, Kua HY, Hu Y, et al. p53 functions as a negative regulator ofosteoblastogenesis, osteoblast-dependent osteoclastogenesis, and bone re-modeling. J Cell Biol 2006;172:115–12557. Shinoda Y, Yamaguchi M, Ogata N, et al. Regulation of bone formation byadiponectin through autocrine/paracrine and endocrine pathways. J Cell Biochem2006;99:196–20858. Oshima K, Nampei A, Matsuda M, et al. Adiponectin increases bone massby suppressing osteoclast and activating osteoblast. Biochem Biophys ResCommun 2005;331:520–52659. Jang WG, Kim EJ, Bae IH, et al. Metformin induces osteoblast differentiationvia orphan nuclear receptor SHP-mediated transactivation of Runx2. Bone 2011;48:885–89360. Shao X, Cao X, Song G, Zhao Y, Shi B. Metformin rescues the MG63 os-teoblasts against the effect of high glucose on proliferation. J Diabetes Res 2014;2014:45394061. Kim JE, Ahn MW, Baek SH, et al. AMPK activator, AICAR, inhibits palmitate-induced apoptosis in osteoblast. Bone 2008;43:394–404
diabetes.diabetesjournals.org Khan and Associates 2623


![[XLS] · Web viewPATEL RUCHIT RAMESHCHANDRA 11V-100303 DESAI RACHIT KEYUR 11V-100275 PITRODA NIDHI NILESH 11V-100221 SHAH DEEP MAHIPALBHAI](https://static.fdocuments.net/doc/165x107/5aa38cd17f8b9ada698e5fe9/xls-viewpatel-ruchit-rameshchandra-11v-100303-desai-rachit-keyur-11v-100275-pitroda.jpg)