DIABETES MELLITUS AND HEALTH OUTCOMES: THE …eprints.brighton.ac.uk/12140/1/PhD Thesis Final...
233
DIABETES MELLITUS AND HEALTH OUTCOMES: THE ROLE OF POSITIVE AFFECT MEENAL RAJ PATEL A thesis submitted in partial fulfilment of the requirements of the University of Brighton for the degree of Doctor of Philosophy June 2013 University of Brighton
Transcript of DIABETES MELLITUS AND HEALTH OUTCOMES: THE …eprints.brighton.ac.uk/12140/1/PhD Thesis Final...

DIABETES MELLITUS AND
HEALTH OUTCOMES:
THE ROLE OF POSITIVE AFFECT
MEENAL RAJ PATEL
A thesis submitted in partial fulfilment
of the requirements of the University of
Brighton for the degree of Doctor of
Philosophy
June 2013
University of Brighton

ii
In loving memory of
My Fuva, Dinker Patel (1946 – 2009)
My Nephew, Ryan Patel (2008 – 2009)
My Mama, Anil Patel (1957 – 2010)
My Kaka, Umesh Patel (1962 – 2011)
My Brother-in-law, Prajesh (Sid) Patel (1970 – 2012)

iii
ABSTRACT
Accumulating evidence suggests that Positive Affect (PA) is beneficial in determining
health-outcomes. Defined as ‘feelings that reflect a level of pleasurable engagement with
the environment, such as happiness, joy and excitement’, PA has been associated with
social and physiological factors as well as health practices. The work undertaken in this
thesis aimed to investigate the relationship between PA and health-outcomes in people
living with and without diabetes mellitus, independent of negative affect (NA).
Study one investigated the relationship between PA and cardiovascular (CV) reactivity and
recovery in response to acute mental stress. It was unknown whether interventions to
increase PA could improve reactivity to and recovery from acute mental stress and
therefore this study sought to investigate if an intervention designed to increase PA could
have a beneficial impact. This was a single blind randomised control study in design and
recruited healthy individuals (N = 48) who attended two psycho-physiological sessions one
week apart (before and after the intervention or control written exercise). The intervention
maintained PA levels whereas in the control group, PA significantly decreased. There was
no overall interaction between stress tasks, PA intervention and visit on blood pressure or
heart rate reactivity or recovery.
Study two investigated the link between PA and HbA1c, self-care practices and diabetes
quality of life independently of NA and other covariates. This was a questionnaire-based,
cross-sectional study. It was completed by people living in the South East of England who
were diagnosed with diabetes (N = 147). Measures included demographics, mood, coping
style as well as diabetes-specific variables. Individuals with higher PA scores were twice
as likely to follow a healthy eating plan independent of other known correlates. This was
not independent of NA. Individuals who followed a healthy diet or avoided high fat foods
had lower HbA1c levels. No direct link was found between PA and HbA1c, however
following a healthy diet acted as a moderator in this relationship. PA predicted diabetes
quality of life satisfaction independent of other known correlates.
Study three investigated the impact of a PA intervention in people with diabetes (N=40).
Although, PA interventions have been investigated in chronic conditions, it was unknown
whether a PA intervention could improve the management of diabetes. For these reasons,
the aim of this study was to investigate a PA intervention and its effects on HbA1c, self-
care practices and diabetes quality of life. This was a randomised control study which
recruited individuals with diabetes, who were followed over a six month period (baseline,
1week, 1, 3 and 6 months). Measures included demographic, mood and diabetes-specific
variables. The PA intervention did not increase PA and therefore the sample was analysed
as one sample (N=40). Bivariate analysis showed relationships between PA and quality of
life at baseline, 3 months and 6 months, however, PA only predicted diabetes quality of life
satisfaction at 6 months after controlling for NA and baseline diabetes quality of life
satisfaction.
In conclusion, this thesis demonstrates that PA may have a beneficial impact on some
health-outcomes, however interventions designed to increase PA had minimal efficacy.
The randomised control studies that were implemented above were amongst the first to use
an intervention designed to increase PA and investigate the impact on health outcomes
such as HbA1c, self-care practices, quality of life and CV reactivity and recovery.
Although no effects of the PA intervention on health outcomes were found, the relatively
high levels of PA seen in volunteers participating in these studies may have influenced the
results.

iv
Table of Contents
ABSTRACT .................................................................................................................... iii
Table of Contents ........................................................................................................... iv
List of Tables .................................................................................................................. ix
List of Figures ................................................................................................................. xi
List of the Main Abbreviations ................................................................................... xiv
Acknowledgments ......................................................................................................... xv
Declaration .................................................................................................................... xvi
Chapter One: Introduction ............................................................................................ 1
1.1 Positive Affect ......................................................................................................... 1
1.1.1 Positive Affect and Health Outcomes .............................................................. 2
1.2 Models of Positive Affect ..................................................................................... 13
1.3 Positive Affect Interventions................................................................................. 15
1.4 Diabetes Mellitus .................................................................................................. 19
1.4.1 Epidemiology, Incidence and Prevalence of Diabetes Mellitus..................... 19
1.4.2 Self-management and Diabetes Mellitus ....................................................... 21
1.4.3 Complications of Diabetes Mellitus ............................................................... 26
1.5 Diabetes Mellitus Positive Affect and Psychosocial Factors ................................ 29
1.6 Positive Affect in People with Diabetes Mellitus ................................................. 31
1.7 Aims of the Project................................................................................................ 35
Chapter Two: General Methods .................................................................................. 36
2.1 Mood Related Measures ........................................................................................ 36

v
2.1.1 Positive and Negative Affect Scale ................................................................ 36
2.1.2 Perceived Stress Scale .................................................................................... 39
2.1.3 Profile of Mood State ..................................................................................... 39
2.2 Diabetes Related Measures ................................................................................... 40
2.2.1 Diabetes Quality of Life ................................................................................. 40
2.2.2 Summary of Diabetes Self Care Activities .................................................... 41
2.3 Personality Related Measures ............................................................................... 41
2.3.1 Connor–Davidson Resilience Scale - 10 ........................................................ 41
2.3.2 Coping Styles ................................................................................................. 42
2.4 Physiological Measures ......................................................................................... 43
2.4.1 Blood Pressure ............................................................................................... 43
2.4.2 Body Mass Index ........................................................................................... 43
2.4.3 HbA1c Determination .................................................................................... 43
2.5 Positive Affect Intervention and Control Exercise ............................................... 45
2.5.1 PA Intervention Exercise ............................................................................... 46
2.5.2 Control Exercises ........................................................................................... 47
Chapter Three: A single blind, randomised control study to investigate the impact of
a positive affect intervention on cardiovascular reactivity and recovery ................ 50
3.1 Introduction ........................................................................................................... 50
3.2 Ethical Approval ................................................................................................... 52
3.3 Methods ................................................................................................................. 53
3.3.1 Study Design .................................................................................................. 53
3.3.2 Participants ..................................................................................................... 54
3.3.3 Measures ........................................................................................................ 55
3.3.4 Procedure........................................................................................................ 56
3.4 Data Analysis ........................................................................................................ 58
3.5 Results ................................................................................................................... 59
3.5.1 Sample Characteristics ................................................................................... 59

vi
3.5.2 Positive Affect Intervention ........................................................................... 60
3.5.3 Cardiovascular and Perceived Stress Responses............................................ 63
3.6 Discussion ............................................................................................................. 77
3.6.1 Limitations ..................................................................................................... 81
3.7 Conclusion ............................................................................................................ 81
Chapter Four: A cross-sectional study to investigate the relationship between positive
affect and health outcomes in people with diabetes mellitus .................................... 83
4.1 Introduction ........................................................................................................... 83
4.2 Ethical Approval ................................................................................................... 86
4.3 Methods ................................................................................................................. 86
4.3.1 Study Design .................................................................................................. 86
4.3.2 Procedure........................................................................................................ 86
4.3.3 Participants ..................................................................................................... 87
4.3.4 Measures ........................................................................................................ 87
4.4 Data Analysis ........................................................................................................ 89
4.5 Results ................................................................................................................... 90
4.5.1 Sample Characteristics ................................................................................... 90
4.5.2 HbA1c ............................................................................................................ 94
4.5.3 Diabetes Quality of Life ................................................................................. 96
4.5.4 Self-care Behaviours ...................................................................................... 98
4.5.5 Associations between Diabetes Related Outcomes........................................ 99
4.5.6 Positive Affect and Diabetes Related Outcomes ......................................... 100
4.5.7 Positive Affect and Coping Interactions on Diabetes Related Outcomes .... 106
4.5.8 Positive Affect and Perceived Stress on Diabetes Related Outcomes ......... 109
4.6 Discussion ........................................................................................................... 112
4.6.1 Limitations ................................................................................................... 118
4.7 Conclusion .......................................................................................................... 119

vii
Chapter Five: A six month, randomised control study to investigate the impact of a
positive affect intervention on health outcomes in people with diabetes ............... 121
5.1 Introduction ......................................................................................................... 121
5.2 Ethical Approval ................................................................................................. 124
5.3 Methods ............................................................................................................... 124
5.3.1 Study Design ................................................................................................ 124
5.3.2 Procedure...................................................................................................... 125
5.3.3 Participants ................................................................................................... 127
5.3.4 Measures ...................................................................................................... 127
5.4 Data Analysis ...................................................................................................... 128
5.5 Results ................................................................................................................. 130
5.5.1 Sample Characteristics ................................................................................. 130
5.5.2 Positive Affect Intervention ......................................................................... 133
5.5.3 HbA1c .......................................................................................................... 137
5.5.4 Self-care practices ........................................................................................ 138
5.5.5 Diabetes Quality of Life ............................................................................... 141
5.5.6 Positive Affect .............................................................................................. 145
5.5.7 Positive Affect, Healthy Diet and HbA1c .................................................... 145
5.5.8 Positive Affect and Diabetes Quality of Life Satisfaction ........................... 146
5.6 Discussion ........................................................................................................... 147
5.6.1 Limitations ................................................................................................... 150
5.7 Conclusion .......................................................................................................... 152
Chapter Six: General Discussion ............................................................................... 153
6.1 Summary of Main Findings ................................................................................ 154
6.1.1 Impact of the TGT intervention on reactions to stress (Chapter 3).............. 154
6.1.2 The relationship between PA and diabetes health outcomes (Chapter 4) .... 154
6.1.3 Impact of a PA intervention in people with Diabetes (Chapter 5) ............... 155
6.2 Methodological Limitations ................................................................................ 155

viii
6.3 Efficacy of Positive Affect Interventions ............................................................ 157
6.4 The stress-buffering model ................................................................................. 158
6.5 Positive Affect and Diabetes Mellitus................................................................. 160
6.6 Implications and Future Research ....................................................................... 161
6.7 Conclusion .......................................................................................................... 164
References .................................................................................................................... 166
Appendices ................................................................................................................... 190
Appendix A: Ethical Approval Letter and Supporting Documents for Chapter 3 .... 190
Appendix B: Ethical Approval Letter and Supporting Documents for Chapter 4 .... 192
Appendix C: Ethical Approval Letter and Supporting Documents for Chapter 5 .... 207
Appendix D: Presentation of Research ..................................................................... 215

ix
List of Tables
Table 3.1 Comparison of four randomised groups (i) no stress: neutral group (ii) no
stress: three good things (TGT) group (iii) stress: neutral and (iv) stress: TGT.
Mean scores (standard deviation). ...................................................................... 59
Table 4.1 Descriptive statistics for demographic, psychosocial and diabetes variables91
Table 4.2 Descriptive statistics for categorical demographics, diabetes related variables
and depression status .......................................................................................... 92
Table 4.3 Percentage of sample engaging in specific self-care behaviours ............... 93
Table 4.4 Correlation matrix of demographic, psychosocial and diabetes related factors
on diabetes related outcomes ............................................................................. 95
Table 4.5 Hierarchical multiple regression analysis for factors predicting DQOL
satisfaction ........................................................................................................ 102
Table 4.6 Hierarchical multiple regression analysis for factors predicting DQOL
diabetes related worries .................................................................................... 103
Table 4.7 Logistic regression predicting the likelihood of following a healthy diet for
more than five days .......................................................................................... 105
Table 5.1 Descriptive statistics for demographic and diabetes related variables at
baseline ............................................................................................................. 130
Table 5.2 Descriptive statistics for demographic, psychosocial and diabetes related
variables at baseline. ........................................................................................ 131

x
Table 5.3 Percentage of sample engaging in specific self-care behaviours at baseline.
.......................................................................................................................... 132
Table 5.4 Comparison of POMS subscales before and after the randomised exercise
was given to participants .................................................................................. 133
Table 5.5 The effects of time point, PA intervention and time point*PA Intervention
interaction between the Positive Affect baseline score and the specified time point
score ................................................................................................................. 135
Table 5.6 The effects of time point, PA intervention and time point*PA Intervention
interactions on Negative Affect baseline score and the specified time point score
.......................................................................................................................... 136
Table 5.7 The effects of time point, PA intervention and time point*PA Intervention
interactions on HbA1c and the specified time point score ............................... 138
Table 5.8 The effects of time point, PA intervention and time point*PA Intervention
interactions on Diabetes Quality of Life (satisfaction, impact and diabetes related
worries) baseline score and the specified time point score .............................. 143
Table 5.9 Correlation matrix between DQOL satisfaction and affect at baseline, 3
months and 6 months ....................................................................................... 146
Table 6.1 Correlational matrix of main results ........................................................ 193

xi
List of Figures
Figure 1.1 Direct effect model adapted from Pressman, S. D., & Cohen, S. (2005). 14
Figure 1.2 Stress buffering model adapted from Pressman, S. D., & Cohen, S. (2005).
............................................................................................................................ 15
Figure 2.1 Affect categorised by valence and activation (PA = positive affect; NA =
negative affect) [14]
............................................................................................. 38
Figure 2.2 Diabetes Quality of Life transformation calculation. .............................. 41
Figure 3.1 Flow diagram illustrating order of events for visit one and visit two. TGT =
Three Good Things ............................................................................................ 57
Figure 3.2 Mean positive affect scores at visit one and visit two in participants
randomised to either (i) no stress: neutral group (ii) no stress: three good things
(TGT) group (iii) stress: neutral and (iv) stress: TGT. ....................................... 61
Figure 3.3 Mean negative affect scores at visit one and visit two in participants
randomised to either of the following groups (i) no stress: neutral (ii) no stress:
three good things (TGT) (iii) stress: neutral or (iv) stress: TGT. ....................... 62
Figure 3.4 Systolic Blood Pressure (SBP) reactivity to tasks for participants at visit one
and visit two across the four groups (i) no stress: neutral group (ii) no stress: three
good things (TGT) group (iii) stress: neutral and (iv) stress: TGT. ................... 64
Figure 3.5 Systolic Blood Pressure (SBP) recovery from tasks for participants at visit
one and visit two across the four groups (i) no stress: neutral group (ii) no stress:
three good things (TGT) group (iii) stress: neutral and (iv) stress: TGT. .......... 65

xii
Figure 3.6 Diastolic Blood Pressure (DBP) reactivity to tasks for participants at visit
one and visit two across the four groups (i) no stress: neutral group (ii) no stress:
three good things (TGT) group (iii) stress: neutral and (iv) stress: TGT. .......... 67
Figure 3.7 Diastolic Blood Pressure (DBP) recovery from tasks for participants at visit
one and visit two across the four groups (i) no stress: neutral group (ii) no stress:
three good things (TGT) group (iii) stress: neutral and (iv) stress: TGT. .......... 69
Figure 3.8 Heart Rate (HR) reactivity to tasks for participants at visit one and visit two
across the four groups (i) no stress: neutral group (ii) no stress: three good things
(TGT) group (iii) stress: neutral and (iv) stress: TGT. ....................................... 71
Figure 3.9 Heart Rate (HR) recovery from tasks for participants at visit one and visit
two across the four groups (i) no stress: neutral group (ii) no stress: three good
things (TGT) group (iii) stress: neutral and (iv) stress: TGT. ............................ 72
Figure 3.10 Perceived stress (PS) scores (reactivity) from tasks for participants at visit
one and visit two across the four groups (i) no stress: neutral group (ii) no stress:
three good things (TGT) group (iii) stress: neutral and (iv) stress: TGT. .......... 74
Figure 3.11 Perceived stress (PS) scores (recovery) from tasks for participants at visit
one and visit two across the four groups (i) no stress: neutral group (ii) no stress:
three good things (TGT) group (iii) stress: neutral and (iv) stress: TGT. .......... 76
Figure 4.1 Interaction plot between Positive Affect (PA), HbA1c and following a
healthy diet ....................................................................................................... 101
Figure 4.2 Interaction plot of perceived stress and Positive Affect on DQOL impact110
Figure 5.1. Flow diagram of study procedure. ......................................................... 126
xiii
Figure 5.2 Mean Positive Affect scores at each time point in participants from the PA
intervention or the control group. ..................................................................... 134
Figure 5.3 Mean Negative Affect scores between the PA intervention group and the
control group at each point in time. ................................................................. 136
Figure 5.4 Mean HbA1c scores between the PA intervention group and the control
group at each point in time. .............................................................................. 137
Figure 5.5a Percentage of individuals following a healthy diet for more than 5 days in
the PA intervention group and the control group at each point in time ........... 139
Figure 5.6b Percentage of individuals who avoided high fat foods for more than 5 days
in the PA intervention group and the control group at each point in time ....... 139
Figure 5.7c Percentage of individuals who monitored their glucose levels for more than
5 days in the PA intervention group and the control group at each point in time140
Figure 5.8d Percentage of individuals following exercise for more than 5 days in the
PA intervention group and the control group at each point in time ................. 140
Figure 5.9e Percentage of individuals following feet checks for more than 5 days in the
PA intervention group and the control group at each point in time. ................ 141
Figure 5.10 Mean Diabetes Quality of Life Scores (satisfaction, impact and diabetes
related worries) between the PA intervention group and the control group at each
point in time. .................................................................................................... 142
Figure 5.11 Mean Positive Affect scores at each time point for participants taking part
in the study ....................................................................................................... 145

xiv
List of the Main Abbreviations
BMI Body Mass Index
BP Blood Pressure
CD-RISC 10 Connor–Davidson Resilience Scale - 10
CES-D Centre for Epidemiologic Studies Depression Scale
CV (D) Cardiovascular (Disease)
DBP Diastolic Blood Pressure
DM Diabetes Mellitus
DQOL Diabetes Quality of Life
EM Early Memories
EMA Ecological Momentary Assessment
HR Heart Rate
NA Negative Affect
OR Odds Ratio
PA Positive Affect
PS Perceived Stress
PANAS Positive and Negative Affect Scale
POMS Profile of Mood State
PSS Perceived Stress Scale
SBP Systolic Blood Pressure
SDSCA Summary of Diabetes Self Care Activities
SES Socioeconomic Status
TGT Three Good Things

xv
Acknowledgments
I wish to thank, first and foremost, my supervisors Dr Sian Williams, Dr Moira Harrison
and Dr Anne Jackson. This thesis would not have been possible without your help,
supervision and patience. The excellent advice and support has been truly invaluable on
both an academic and a personal level, for which I am extremely grateful. A special extra
thank you to you Sian, I don’t think I will ever forget this last month prior to submitting. It
has been crazy, lots of hard work as well as being filled with all kinds of emotions but you
kept me sane and gave me the motivation to pass this final hurdle! Thank you.
I cannot find the words to express my gratitude to my immediate family, thank you mum
and dad for your continuous encouragement over the years, your support has been truly
exceptional and I cannot thank you enough for everything. I also want to say a huge thank
you to my sisters Heena and Deena and brother-in-law Jay for your unconditional support
and always believing that I could achieve my dreams. Also, a thank you to my nephew
and niece, Shivam and Avani, your laughter and innocence always made a tough day feel
like anything is possible.
I would like to acknowledge the University of Brighton, School of Pharmacy and
Biomolecular Science for their financial, academic and technical support. In particular, I
would like to say thanks to Matt Homer in the School Office, Alex and Paul in
reprographics, Liz Cheek for her statistical support and Steve Jones for all his IT support. I
would also like to acknowledge the Diabetes Research Group for their support over the last
few years.
I would also like to thank Dr Leigh Gibson at Roehamptom University for his
collaboration, generous support and valuable contribution towards Chapter 3, my
cardiovascular study.
I could not have completed my thesis without the help from Ringmer Surgery, River Lodge
Surgery, Newick Surgery, Diabetes UK support groups and Brighton and City Hove
Council. I would also like to acknowledge all of the volunteers who agreed to participate in
my studies.
A massive thanks to all my friends in H402, the endless cups of coffee’s, lunches at 12 and
most of all, the constant support and motivation throughout this entire journey has been
priceless. To my nearest and dearest, Michelle, Nina, Mark, Chet, Tomader, James,
Antiopi, Kevin and Ben, you guys have been incredible to me whether it has been good,
bad, ugly, PhD or not PhD related and for that, I will always be forever thankful.
Finally, I would like to express my heart-felt gratitude to the rest of my family and friends
who have aided and encouraged me throughout this endeavour. A personal thank you to
Kapi foi and Vaishali for not only putting a roof over my head during the last few weeks of
submitting my thesis but more importantly taking care of me and always keeping me well
fed with delicious home cooked food.

xvi
Declaration
I declare that the research contained in this thesis, unless otherwise formally indicated
within the text, is the original work of the author. The thesis has not been previously
submitted to this or any other university for a degree, and does not incorporate any material
already submitted for a degree.
Meenal Raj Patel

1
Chapter One: Introduction
There is growing evidence linking positive psychological experiences, like subjective
well-being to health outcomes [1]
. Subjective well-being can be viewed as a collective
term for factors such as optimism, PA, life satisfaction and happiness [2, 3]
and goes
beyond the scope of this review to cover all of the components of subjective well-being
in relation to health. For this reason, the intention is to concentrate on PA as a predictor
of health outcomes. The introduction also focuses on diabetes mellitus (DM), a chronic
condition that affects millions of people worldwide [4]
. Much of the psychosocial
literature in relation to DM has investigated negative affective styles such as depression
[5, 6] and stress
[7]. In comparison, however, little attention has been placed on positive
affective styles despite their emergence as important predictors of morbidity and
survival in other chronic conditions [2, 8-10]
. The main objective of this introduction is to
explain the rationale for investigating the role of PA as a predictor of health-outcomes
in people living with DM.
1.1 Positive Affect
Positive affect (PA) can be defined as “feelings that reflect a level of pleasurable
engagement with the environment, such as happiness, joy, excitement, enthusiasm and
contentment” [11]
. The affect can either be long term, stable and disposition—like (trait
PA), or represent more short-term bouts of positive emotion (state PA) [2]
.
There is already a large evidence base for the link between negative affect (NA) and ill
health [12]
, and debate exists over the extent to which PA is independent from negative
affect [13]
. If they are bipolar opposites of the same scale, then the benefits of PA may
simply reflect absence of NA. It seems that the literature of measurement is key in
determining whether or not the affect has been measured on one or two scales [14]
.
Additionally, there is a growing body of research to show that PA can predict health
outcomes even when NA is controlled for [2]
.

2
Trait affect (both PA and NA) is usually measured using self-report where a respondent
states how they generally feel or by aggregating multiple measures of state affect [14, 15]
.
PA is typically measured through questionnaires where individuals are required to
respond positively or negatively to a range of statements. Such measures include the
Positive and Negative Affect Scale [11]
, the Global Mood Scale [16]
and the PA subscale
of the Center for Epidemiologic Studies Depression Scale [17]
. Other techniques include
Ecological Momentary Assessment [18]
where individuals are required to state how they
feel at times specified by the researcher i.e. via devices such as personal digital
assistants [19]
, and Positive Emotional Style (PES) where participants are only asked
how they feel once a day over a period of time as opposed to several times a day [20]
.
It is thought that trait PA and more long-term state PA i.e longer than one week, is more
associated with health-outcomes such as the progression of chronic diseases or mortality
due to the fact that emotions need to last long enough in order to influence behaviours
or physiological responses [2, 21]
. The emerging literature linking PA with health is still
relatively small compared to the vast literature on negative affect (NA) [15]
. Although
NA is an important predictor of health, it is becoming more apparent that PA has an
independent role in determining health outcomes. It goes beyond the scope of this
thesis to provide a review of the influence of NA and health; for a review, please see
Mayne (1993) [12]
.
1.1.1 Positive Affect and Health Outcomes
PA has been associated with longevity [22]
, reduced risk for cardiovascular diseases [23]
,
lower blood pressure [24]
, lower cortisol levels [25]
and reduced mortality [26]
. In addition
it has been linked to better self-reported health as well as improved functional status [2]
.
This section will focus on studies that have investigated PA in relation to mortality,
survival and mobility in people with and without chronic conditions.

3
PA and Mortality
There is growing evidence to suggest that people who are psychologically more positive
live longer. For instance, a longitudinal study of 180 Catholic nuns found that the
emotional content of individuals’ diaries predicted longevity to the extent that those
who had written more positive emotional content in their twenties were more likely to
have lived on average 10 years longer than the nuns who expressed the least positive
emotions [22]
. This type of correlational study cannot prove cause and effect and failed
to assess the impact of other important correlates of longevity. However, other more
comprehensive studies have replicated this finding while taking into account predictors
such as age, negative affect and baseline health.
In a similarly designed longitudinal study, Xu and Roberts investigated the link between
subjective well-being (including PA, NA and life satisfaction) and longevity in a sample
of 6856 healthy individuals over a period of 28 years [27]
. The findings showed that
overall subjective well-being was related to a reduction in all cause mortality
independent of age, gender, education and baseline physical measures. However, the
effect of PA was not significant after NA had been accounted for, suggesting that NA
plays a more important role in predicting mortality than PA. An alternative explanation
is that PA and NA were not measured independently in this study and that they were
measuring the same construct but just in reverse. For instance, the items used to
measure affect were bipolar (i.e. ‘bored’ versus ‘interested’ to reflect NA versus PA) as
opposed to independent items for each scale (i.e. ‘not excited’ to ‘extremely excited’ for
PA and ‘not nervous’ to ‘extremely nervous’ for NA such as the PANAS). This
highlights the importance of measuring PA and NA using a questionnaire that reflects
the dimensions independently.
Addressing this issue, Steptoe and Wardle investigated PA and NA in relation to
longevity in 3853 men and women aged between 52 and 79 years [28]
using more
independent measures. Data on mortality was obtained from a data registry and
individuals were followed over an average of five years. The study found that people
higher in PA were 35% at lower risk of mortality after controlling for demographic
factors, NA, health behaviours and health indicators, thus suggesting that PA can
independently predict mortality when other risk factors are taken into account.

4
It appears, however that the link between PA and mortality is less clear when current
health status is controlled for. For instance, Kritji et al investigated the link between
positive affect and survival in 4411 senior individuals aged 61 or older [29]
. Mortality
was assessed using electronic records and the average number of years that individuals
were followed was 7.19 years. Using the CES-D scale to measure PA and NA, it found
that individuals higher in PA were 7% at lower risk of mortality independent of gender,
age, NA, socioeconomic status and lifestyle factors. However, this association did not
remain after the addition of health status which included factors such as disability and
prevalent diseases such as heart failure, stroke and cancer. It seems that PA may offer
some increase in longevity in healthy populations but that the link with mortality is less
clear in patient populations.
The majority of studies showing an independent link between PA and mortality have
recruited healthy patients at baseline [22, 27, 30]
, however research conducted with patient
populations has been more mixed. For instance, Van den Broek et al were interested in
whether PA and NA predicted mortality in patients that have an implantable
cardioverter defibrillator (ICD) [10]
. Among the 591 individuals that were followed over
a median period of 3.2 years, it was negative but not positive mood, as measured by the
Global Mood Scale (GMS), that was statistically related to mortality rate, after
controlling for demographic and clinical variables.
In contrast, Moskitwitz et al found that PA predicted mortality in patients with diabetes
[26]. Among the 715 patients who were followed over 10 years, individuals that were
higher in PA were 13% times less likely to be at lower risk of mortality. This result was
not independent of NA, however, when analysing individual items of the CES-D PA,
enjoyed life was a significant predictor of mortality independent of NA. In another
study, Moskowitz et al found that PA also predicted mortality in patients with AIDS [26]
.
Four hundred and seven men who were HIV positive were followed over 3 years. The
study reported that men higher in PA as measured by the CES-Depression Scale were
12% at lower risk of AIDS mortality at 12 months independent of illness progression
markers and subscales of the CES-Depression (NA, somatic and interpersonal).
Thereafter, at 24 months the effects were marginally significant (p< .1) and at 36 no
effect was found in PA and AID mortality.

5
The finding that PA is linked to longevity has been replicated in both healthy and
patient populations; however the association seems to be strongest in healthy
populations. Chida and Steptoe conducted a systematic review to investigate the
associations between positive psychological well-being and mortality on studies
published between 1969 and 2007 in both healthy (35 studies) and diseased populations
(35 studies) [30]
. Higher positive psychological well-being (including PA, life
satisfaction and optimism) was associated with lower mortality in 51.4% of the studies,
independent of negative affective states in the healthy population studies. In contrast,
only 31.4% of the studies with diseased populations demonstrated such a link. In
addition they found that the link was stronger in older populations and where the
follow-up was shorter. The authors consider the role of behavioural correlates such as
smoking, diet and medication taking that might mediate the link but also demonstrate
that positive well-being has an independent effect whilst controlling for such factors.
This suggests that PA may influence health through the uptake of health protective
behaviours as well as through other direct physiological pathways such as reduced
cardiovascular response to stress.
Age has been shown to be a moderator of the PA-mortality relationship. For instance,
Kritji et al report a significant interaction between age and PA which indicated that
people who were less than 70 years old were 8% at lower risk of mortality and this was
independent of gender, age, NA, socioeconomic status and lifestyle factors and health
status. No such benefit was found for people over 70. In contrast, Chida and Steptoe
found a stronger association between well-being and lower mortality in healthy people
over 60 than in the general healthy population [30]
. They point out that this finding may
be due to there being higher mortality rates in the older group and thus a statistically
stronger association. If age does moderate the PA-mortality relationship, it might
suggest that there is a threshold in relation to survival where, in older individual’s health
status might impede on psychological well-being and the protective effects of PA are no
longer significant.
Generally PA has predicted lower mortality and greater survival, and the effects have
shown to be stronger in the healthy population. This highlights the importance to
investigate interventions that are designed to increase PA [30]
. In addition, individuals

6
diagnosed with or at increased risk of developing serious diseases often have lower PA
compared to individuals who are healthy [2]
. Future studies should investigate the role
of PA in people with existing chronic conditions.
PA and Morbidity
Studies have reported associations between PA and more favourable health outcomes in
people with existing medical conditions. These studies have entailed either self
reported outcomes [8, 31]
or objective outcomes [32-35]
which will now be discussed.
There is evidence to suggest that individuals who are higher in PA and have
experienced a pain related illness report fewer pain symptoms. For instance, Fisher et al
recruited 1084 Mexican Americans with arthritis who were over 65 years of age [36]
.
Individuals with higher PA were 54% less likely to self-report a disability 2 years later,
independent of baseline socio-demographic variables, medical conditions and negative
affect.
Similarly, Berges et al investigated PA in relation to self-reported pain ratings in 917
adults aged over 50 years who have had a stroke [8]
. Pain ratings were categorised into
high, medium and low and the study found that individuals higher in PA were 14% less
likely to be categorised into high pain rating group after three months independent of
baseline discharge pain ratings, NA, demographic and clinical factors. Negative affect
was not associated with pain ratings at 3 months follow-up. This study again was based
on self-report data and therefore the relationship between PA and self-reported health
might be expected as more positive people may be more inclined to report that they feel
better. The self-reported data is problematic as it is possible that people who are more
positive simply report fewer symptoms [37, 38]
.
PA has also been shown to predict incidence of stroke while controlling for age,
education, marital status, BMI, smoking status, history of heart attack and DM and NA
[31]. Ostir et al investigated the incidence of stroke in 2478 individuals that were over 65
years of age [31]
. The incidence of stroke was captured through follow-up interviews
over six years. Individuals higher in PA at baseline had a lower incidence of stroke. The
association was stronger in men than women, such that for every unit increase in PA

7
there was a decreased incidence of stroke of 44% for men and only 18% for women.
NA as measured by the CES-D-NA subscale was not linked to incidence of stroke. The
results of this study are based on a relatively large sample followed up over 6 years and
are thus relatively reliable however; the incidence of stroke was still based on a self-
report. Whilst it is unlikely that someone would lie about having had a stroke,
alternative methods that use objective outcome measures might be more convincing.
Using objective outcome measures, Fredman et al found that among 432 elderly patients
over the age 65, higher PA was related to better recovery after hip fracture over two
years [32]
. In particular improvements were found in speed of walking and performing
one chair-stand as measured by the number of seconds taken to rise from and sit back
down into a chair compared to people who exhibited depressive symptoms. The results
of this study are based on performance and importantly measured objectively as
opposed to subjective reporting.
Additionally, Bhattacharyya et al have shown that PA can predict heart rate variability
in patients who are suspected of coronary heart disease [33]
. The Day Reconstruction
Method (DRM) was used to measure PA such that participants are instructed to recall
their experiences during the monitoring period and then in addition to self-report how
they felt during each episode. This study found that among the 88 patients recruited for
this study, higher PA was found to be associated with more controlled heart rate
variability independent of age, gender, medication and coronary artery disease status.
When depression scores were added in as a covariate (as measured by the Beck
Depression Inventory) the effect of PA remained significant. This study showed the
effects of PA were independent of depression and not NA and therefore the findings
cannot confirm if PA was independent of NA in predicting heart rate variability.
There is evidence to suggest that people who are high in PA are less likely to contract
the common cold [34, 35]
. For instance, Cohen et al recruited volunteers (n = 334) aged
between 18 and 54, measured their emotional style and exposed them to a virus. They
were quarantined for five days where the signs and symptoms of the illness were
monitored. During post exposure (over five days), individuals were asked if they had a
cold to rate how they felt on a scale of 1 – 4. Furthermore, daily mucus production as

8
well as nasal mucociliary clearance was aggregated over five days by collecting tissues
in a sealed bag and weighing them and through dye administered through the anterior
nose [35]
. Positive emotional style was linked to lower incidence of illness ratings
independent of antibody level, demographics, body mass index, season and virus type.
In an additional study, Cohen et al [34]
found that individuals high in positive emotional
style were 2.34 times more like to not to develop the common cold [34]
.
Many studies suggest that PA is linked to longevity, mortality and morbidity. However,
as no studies have shown causal links, the relationship between PA and outcome
measures might be influenced by other factors. It is possible that PA may be associated
with healthier lifestyles and behaviours such that people higher in PA are more likely to
exercise and have better social support, additionally PA might influence health through
more direct physiological pathways. For these reasons, it is important like the studies
above, to control for baseline measures as well as measure risk factors that may
influence the relationship.
PA and Biological Factors
Many studies investigating the relationship between PA and biological factors such as
cortisol, inflammatory markers and cardiovascular reactivity/recovery have recruited
individuals through the Whitehall II Study [24, 25, 39]
. The Whitehall II longitudinal study
was set-up in 1985 [40]
. The sample cohort consisted of 10, 308 London-based civil
servants aged between 35 and 55 years of age [40]
. The initial aim of this study was to
investigate the socioeconomic gradient in health and disease and was further broadened
to investigate demographic, psychosocial and biological risk factors of health and
disease over several years [24, 25, 39-45]
. At present the Whitehall II study is in its 11th
phase of data collection.
Psycho-physiological stress testing is a technique that has been used to investigate the
association between PA and biological under controlled conditions [9]
. Individuals are
subjected to behavioural tasks that elicit a stress response which is then used to
investigate reactivity and recovery. Studies that have recruited individuals from the
Whitehall II cohort will now be discussed in relation to PA.

9
Steptoe et al investigated the relationship between PA and (i) cortisol, (ii) blood
pressure (BP) and (iii) heart rate [25]
in 227 men and women over one working day and
evening. This relationship was also tested among 228 men and women in another study
by Steptoe and colleagues in response to acute mental stress [24]
. Both of these studies
found that PA, as measured by EMA, was inversely associated with cortisol over the
working and non working day after adjusting for age, grade of employment, smoking
status, BMI and general health measures [24, 25]
. PA was not linked to cortisol awakening
response (CAR) or BP, however, higher PA was associated with lower heart rate in men
but not in women [24]
.
Steptoe and Wardle re-examined the data between PA and the biological factors at 3
years [25]
and the association between positive affect and (i) cortisol and (ii) heart rate
remained, suggesting that trait positive affect is relatively stable and is associated with
more favourable health-outcomes. The results showed that higher levels of positive
affect were associated with lower systolic blood pressure.
Cortisol levels can be affected by mood state and for this reason Steptoe et al
investigated if the relationship between PA and cortisol was independent of depressed
mood [39]
. In addition chronic inflammation markers were also investigated (C-reactive
protein and interleukin-6). As found in the previous study [24]
, PA was not associated
with CAR, however among the 4609 men and women aged between 35 and 55 lower
cortisol levels over the working day were linked to higher PA and still remained
significant after the addition of depression scores (as measured by the CES-D) as a
covariate.
Studies recruiting from different populations have also found associations between PA
and health related neuroendocrine and cardiovascular outcomes. For instance, Bostock
et al measured PA using PES in relation to cortisol levels and cardiovascular
reactivity/recovery in response to mental stress and found that PES was associated with
better diastolic blood pressure, post-stress recovery and lower cortisol post task
independent of age, BMI and NA. [20]
. Measurements were taken at various time-points;
BP and heart rate were taken continuously throughout the experimental procedure from

10
which averages were obtained. Cortisol samples were obtained at baseline, post-task
and recovery. No associations were found between heart rate and PES.
Steptoe et al also investigated PA by measuring it using EMA and the PANAS
questionnaire [46]
in relation to (i) cortisol (ii) blood pressure and (iii) heart rate in
response to acute mental stress and found that EMA scores were more strongly
associated with biological factors compared to PANAS scores. This study differed from
the others as data was collected over two time-points and the scores were averaged.
Although, this is better than collecting data at one single time-point it still does not
determine causality. A method in which this could have been addressed was to have
investigated a PA intervention whereby, during the intervening period, participants
could have been instructed to complete a PA intervention. This would have enabled the
study to investigate the effect of PA on physiological responses using an experimental
design. No studies have investigated PA interventions in relation to PA and biological
measures in response to stress and therefore this is an area that needs further attention.
Although previous studies do suggest that there is a link between PA and biological
stress factors, these studies failed to incorporate a no-stress control group so although
CV reactivity was significantly different from baseline readings, it is not possible to say
with certainty that it was the stress manipulation that elicited a stress response and not
some other confounding factor that resulted in higher reactivity.
Dowd et al have used a no-stress control group and compared a speech task (stressful
condition) to silent reading (control). Here, the stress manipulation did elicit a stress
response [47]
. The sample population consisted of 56 women who were between 17 and
35 years of age. To measure PA and NA, participants were asked to complete the
PANAS using the time frame “right now” before and after the experimental tasks.
Participants were either asked to complete a speech task (stress group) or read a
magazine silently (no stress group). During these tasks, blood pressure was measured at
1, 2.5 and 4 minutes and post stress recovery was measured 5 minutes after the
experimental task at 1, 2.5 and 4 minutes. Results showed a reduction in PA and an
increase in NA after the completion of the experimental task. There was a significant
interaction between affect and stress group, such that there was a reduction in PA scores

11
and an increase in NA for individuals in the stress group but not for individuals in the
no stress group. Importantly the interaction between stress and time showed that the
effects of stress on NA was much stronger accounting for 32.2 % compared to the effect
on PA where the accounted variance was only 7.2%. Despite the reduction in PA
scores, the study showed that higher levels of PA at baseline predicted greater systolic
BP reactivity to stress but also greater systolic recovery from stress. The mean baseline
PA score for this study was 2.79 which is higher than the study conducted by Steptoe
and colleagues (PA score = 2.55) [46]
. Individuals with higher PA scores might have
seen the stress task as a challenge as opposed to a threat which might explain the
heightened reactivity. In relation to NA, the interaction between NA and stress group
on systolic blood pressure reactivity showed that higher baseline NA scores predicted
less diastolic BP reactivity for the control group but not the stress group. In terms of
diastolic blood pressure, there was an interaction between PA and stress group such that
individuals showed a reduction in diastolic blood pressure reactivity and recovery in the
no stress group but not for the stress group. This study provides evidence that stress
affects PA and NA differently and that it is important to investigate these dimensions
independently.
All of the studies that suggest there is link between PA and CV measures [20, 24, 48-50]
are
all limited in that they are all cross-sectional in design and therefore cannot provide
evidence of causality. At present there are no studies that have experimentally
investigated the link between PA and CV measures in response to interventions to
improve reactivity and recovery to stress.
PA and Health Practices
Health practices are important behaviours that can prevent, treat and manage chronic
illnesses. They include behaviours such as attention to diet, exercise, taking medication,
sleep patterns, alcohol intake and smoking status. PA has been associated with better
health practices such as improved sleep [51]
, diet [52]
and physical exercise [53]
. Health
practices are important factors in managing chronic conditions and this is especially true
for people living with Diabetes Mellitus (DM) which will be discussed in section 1.2.2.

12
While very little research has specifically investigated the association between PA and
self-care practices in people with DM, the following section will review the research
which has investigated PA in relation to health practices more generally.
There is evidence to suggest that people who are high in PA are more likely to self-
report that they engage in physical activity [51, 53]
, for instance, Kelsey et al investigated
the impact of a health promotion programme for blue-collar women (n = 1093) who
worked in one of five rural areas in the south-eastern United States of America and
found that higher PA (as measured by the PANAS) predicted physical exercise
independent of body mass index (BMI), age and education [53]
. However the results
were based on self-reported data and therefore might be subjected to response biases.
[53].
Similarly, Garcia et al investigated PA in relation to exercise but focused more on the
effect of high compared to low activation of PA on exercise frequency. The
relationship was investigated in four different study populations; study 1 recruited 635
adults, study 2 recruited 311 adolescents, study 3 recruited 135 adolescents and study 4
recruited 150 adults. Studies 1 -3 found that PA (as measured by the PANAS) was
linked to increased frequency in physical activity independent of age and gender. BMI
was included as an additional covariate in study 2; however the association between PA
and physical activity still remained. Study 4 did not find an association between
exercise frequency and PA; however this might be because the study used an instrument
that reflected low activation levels on opposed to high activation levels. This might
suggest that high activated emotions (as found in the PANAS) are more strongly linked
to exercise than low activation. The results from all 4 studies were based on self-
reported data and therefore it is possible that individuals might have reported lower
weight and height. Furthermore, as this study was cross-sectional in design, it cannot be
concluded whether PA is directly linked to physical exercise, or whether people who
exercise more frequently report that they are happier.
There is evidence to suggest that PA is associated with better sleep [51]
. This was
supported in the four studies conducted by Garcia et al where they found PA was
negatively associated with sleep problems.

13
In a similar study, Steptoe et al [51]
also found that among 736 individuals who were
aged between 58 and 72 years, PA (as measured by EMA) was associated with good
sleep, independent of age, gender, household income, work status and self-rated health.
Sleep as well all other measures used were based on self-reported data. .
In Cohen et al’s studies linking PES to the common cold [35]
, participants high in PES
were found to report better sleep quality and efficiency, report higher dietary zinc levels
and report to do more exercise.
Interestingly all of these studies used different methods to measure PA and all found
favourable associations in relation to exercise and sleep. However, these studies were
limited to (i) the outcomes being based on self reported data and (ii) the studies being all
cross-sectional in design therefore it might be possible that people who have better sleep
are more likely to report that they feel better. To address the issue of self-reporting
data, studies could incorporate a mixture of self-reporting questionnaires as well as
objective measures. For instance, instead of people reporting the frequency of exercise,
individuals could be given a pedometer that captures the amount of steps a person
actually carries out. The second issue regarding causality could be addressed by
investigating the link between PA and health practices in response to interventions to
improve adherence.
In summary, there is supporting evidence that suggests there is a link between PA and
health outcomes. This has been conceptualised into two models that have been
proposed by Pressman and Cohen [2]
. In using a theoretical framework, it might help to
design experimental studies and also address the issue of causality which has not been
addressed in many studies.
1.2 Models of Positive Affect
There is accumulating research suggesting that PA does have a beneficial impact on
health outcomes. Pressman and Cohen have proposed two theoretical models linking
PA to the onset and progression of disease [2]
. The “direct effect model” (see Figure
1.1), suggests that PA influences the onset and progression of disease through health

14
practices, social factors as well as biological factors such as the autonomic nervous
system (ANS) and hypothalamic–pituitary–adrenal (HPA) axis activation [2]
.
Figure 1.1 Direct effect model adapted from Pressman, S. D., & Cohen, S. (2005).
Does Positive Affect Influence Health? [2]
, Direct affect model illustrating how positive
affect can influence the onset and progression of diseases through behavioural,
biological and social factors.
The second model (Figure 1.2) referred to as the “stress buffering model” suggests that
PA influences the onset of diseases through the same mechanism as the direct effect
model; however it additionally acknowledges the effects of stress, social, psychological
and physical resources [2]
. Stress stimulates the HPA axis and continuous elevated
levels of stress can have a major impact on health.
Positive resources may buffer the adversity of stress and this is what the stress buffering
model describes [2]
. It builds upon Frederickson’s [54]
broaden-and-build theory which
suggests that positive emotions can be broadened based on personal resources which
include social resources such as friendship, psychological resources such as resilience
and physical resources such as health [55]
. The model suggests that people who
experience more positive emotions have the ability to deal with stress as they are able to
use their personal resources and as a result are able to regulate their negative emotional
experience [55]
. Fredrickson’s theory suggests that by broadening a person’s mindset, it

15
can over time build psychological resources and inevitably promote physical and
emotional well-being.
Figure 1.2 Stress buffering model adapted from Pressman, S. D., & Cohen, S.
(2005).
Does Positive Affect Influence Health? [2]
. Stress buffering model illustrating how
positive affect could potentially buffer the impact of adverse stress on the onset and
progression of diseases
In summary, PA has been linked to better health through various mechanisms as
proposed by Pressman and Cohen [2]
. The implications of these models can form the
basis of designing future studies that address the issue of causality which many studies
have lacked in. For example based on these models, future studies could investigate the
links between PA and health in response to interventions.
1.3 Positive Affect Interventions
Interventions that promote positive experiences have the ability to encourage
individuals to learn how to increase their positive emotions, cognition and behaviour

16
[56]. Interventions designed to increase PA are based on the philosophy of Positive
Psychology (PP). PP has been defined as “the conditions and processes that contribute
to the flourishing or optimal functioning of people, groups and institutes” [62]
. In
addition, interventions from positive psychology are self administered, cost effective
and can be delivered with ease. This is advantageous as it helps individuals to treat
themselves by actively improving their mood without the need of psychological or
professional assistance [56]
.
There is evidence to suggest that positive psychology interventions are beneficial in
increasing well-being and alleviating depression in both depressed and non-depressed
populations [3, 57, 58]
.
For instance, Seligman et al investigated interventions designed to increase happiness
[57] and found two in particular to have significant long-term effects on happiness (see
methods section 2.5). This online study recruited 577 individuals who were
predominantly white, two thirds of whom were aged between 35 and 54. Seventy-one
percent (411) of the study population completed the study over a 6 month period and
were randomised to one of five intervention tasks or to a control task. Both the Three
Good Things (TGT) and the Signature Strengths (SS) exercises’ showed significant
improvements in happiness and decreases in depression for up to six months by the end
of the study. The TGT intervention asked individuals to write three good things that
happened in their day and to provide a brief explanation about the good thing.
Individuals were instructed to complete the exercise every night for 7 days. The SS
intervention asked individuals to complete an online questionnaire which then provided
feedback on their personal signature strengths. Individuals were then instructed to use
their top three strengths in a new way. This study showed that the intervention had
relatively long term effects of increased happiness; however the population was slightly
biased in that the individuals who participated were mildly depressed at the start of the
study. In addition the study did not measure any other health related factors.
The few PA interventions studies that have investigated health outcomes have led to
favourable outcomes. For instance, Charlson et al have investigated the effect of PA
interventions in chronic conditions over a series of studies [59-63]
. The researchers
investigated behavioural interventions and their impact on people with coronary artery

17
disease (n =246), asthma (n =246), and hypertension (n =262) [59]
. The study
investigated the effects of a PA intervention, which was a combination of PA and self
affirmation. Self affirmation can be defined as “the active use of positive statements or
memories about ones accomplishments or successes to build self confidence. Self-
affirmation enhances the ability to overcome any negative expectations of one’s ability
by drawing on previous experiences of success such as overcoming obstacles” [59]
.
The methodologies of the three studies were similar [59-63]
. Patients provided consent
and had baseline data collected and thereafter were randomised to either the control or
intervention group. Patients in both groups received educational work books. In
addition, individuals in the PA intervention were taught how to induce positive affect
and self affirmation. There were three components to the PA intervention; a work book
which focused on the construct of PA and self affirmation, bimonthly telephone calls
and small gifts which were sent to participants every 2 months. Over the 12 months,
generic and more disease-specific questionnaires were completed.
The first study investigated medication adherence in African Americans with
hypertension [61]
. Disease-specific measures included adherence and this was measured
using the Morisky Medication Adherence Questionnaires and pill monitors. In addition
to measuring adherence, the study recorded blood pressure which was obtained from
patient medical records over 12 months. The study found that individuals in the PA
intervention group had better medication adherence compared to patient education
alone. Despite this however, the effect was not the same for blood pressure, such that
the change in both systolic and diastolic blood pressure after 12 months was the same
for both groups. This is interesting as we would have expected a change in BP as there
was an increase in adherence to medication. Although it is appreciated that there are
other factors that might affect blood pressure, it must be noted that medication was self-
reported and it might be that people who reported that they were taking medication
might not have been. It is also possible that people who received gifts felt obliged to
report that they have taken their medication. This highlights that in addition to self-
reporting measures, objective measures must also be included.

18
The second and third study investigated physical activity in patients who had either
undergone percutaneous coronary intervention (PCI) [63]
or had asthma over 12 months.
These studies measured physical activity using the Paffenbarger Index, and the scores
obtained were converted into energy expenditure in kilo-calories per week. The PCI
patients were asked to complete the “Living with Heart Disease: Taking control After
Angioplasty” workbook. Patients in both studies received a pedometer where they were
asked to report the number of steps completed in a day. After 12 months, the PCI study
found that patients in the PA intervention group were almost twice as likely to increase
their energy expenditure compared to the control group. In contrast however, the study
in relation to asthma found that although there was an increase in energy expenditure for
both groups, no differences were found between the groups. Importantly, there was also
no decline in the severity of the asthma. Interestingly, the PCI patients in the PA
intervention group were 2.58 times more likely to recover from elevated baseline
depressive symptoms, thus supporting that PA intervention do not only alleviate
depressive symptoms but can also have an impact on health outcomes.
These studies provide valuable insight to the efficacy of PA interventions on health
outcomes; however they were limited to the data being self reported. Although the set-
up of these studies does advance the current literature, in addition to self-report
measures, biological measures might also want to be incorporated or alternatively
participants are asked to visit a surgery where they perform certain tasks where they can
be objectively measured.
PA interventions have shown to be beneficial in predicting health outcomes [59-61, 63]
,
whether it has been improvements in or in maintaining positive behaviours. However, it
must be appreciated that these interventions are time and resource intensive, such as
giving gifts and telephone calls. Therefore, other methods need to also be explored. A
method that could address this issue is to use positive psychology exercises. These
exercises are cost effective and convenient to deliver, and most importantly have shown
to affect mood [56]
. Furthermore, these interventions might increase PA in populations
that have chronic illnesses and consequently have a beneficial effect on health-
outcomes.

19
Conclusion
The first half of this introduction has demonstrated that there is evidence to suggest that
PA is linked to health. However one chronic condition that has received little attention
is diabetes mellitus (DM). The next part of this introduction aims to give an overview of
DM, the importance of self-management as well as demonstrate the reasons why the
relationship between PA and DM is an important avenue for further research.
1.4 Diabetes Mellitus
1.4.1 Epidemiology, Incidence and Prevalence of Diabetes Mellitus
Diabetes Mellitus (DM) (thereafter referral to as ‘diabetes’) is a chronic disease
affecting millions of individuals worldwide and is a condition that is characterised by
chronic hyperglycaemia if untreated [64]
. Hyperglycaemia can be the result of either
insulin deficiency, impaired effectiveness of insulin action or a combination of both [65]
.
Insulin is a hormone that is secreted from pancreatic beta cells in response to elevations
in blood glucose concentrations [66]
. Its main function is to facilitate the uptake of
glucose from the blood into cells [67]
. The prevalence of diabetes is increasing at
alarming rates worldwide [68]
. In 2011, it was estimated that worldwide 336 million
were diagnosed with diabetes and this figure is estimated to rise to 552 million by 2030
[4].
There are three main types of diabetes which include type 1 diabetes, type 2 diabetes
and gestational diabetes. Type 1 diabetes is an autoimmune disorder that results in
complete beta cell destruction [69]
. It is characterised by insulin deficiency or complete
lack of insulin production which can result in severe hyperglycaemia, coma or death if
left untreated [69]
. Treatment for people with type 1 diabetes is insulin. Type 2 diabetes
affects approximately 90-95% of people with diabetes [69, 70]
and is predominately due to
genetic disposition, excess body weight and physical inactivity [69]
. Unlike type 1
diabetes, people with type 2 diabetes are not always reliant on insulin therapy. The first

20
line of treatment for people who are diagnosed with type 2 diabetes is diet and exercise.
However, lifestyle modifications may not work alone in people who are diagnosed with
type 2 diabetes and therefore drug therapy is usually introduced. Although some people
with type 2 diabetes may require insulin eventually, in most cases oral anti-diabetic
agents are used.
There are different types of oral drug treatments available which are classified into
groups by their pharmacological response. The most frequently used glucose lowering
agents are the biguanides (such as Metformin), which decrease the amount of glucose
produced by the liver and as a result the body will need less insulin to control the blood
glucose levels. Other treatments work by either stimulating the beta cells to secrete
more insulin or by increasing the muscle, fat and liver’s sensitivity to insulin [71]
. These
include the sulfonylureas, thiazolidinediones and DPP-4 inhibitors. Gestational diabetes
is a condition that is associated with glucose intolerance that occurs during pregnancy.
Treatment for gestational diabetes is either insulin or lifestyle modifications [69, 72]
.
The main indicator of diabetes is an elevation in blood glucose levels, which can lead to
serious complications if left uncontrolled [69]
. Furthermore it can lead to coma and
death for people with type 1 diabetes. Common symptoms include increased thirst,
polyuria, fatigue, weight loss and persistent or recurrent infections [73]
. Individuals
presenting with such symptoms would be tested in line with the World Health
Organisation (WHO) recommendations. The criterion for diagnosing people with
diabetes should be confirmed via a glucose measurement performed in an accredited
laboratory on a venous plasma sample. The diagnosis of diabetes can be confirmed
when an individual has either (i) a fasting plasma glucose concentration (FPG) of ≥ 7.0
mmol/l (≥ 126 mg/dl), (ii) a two hour post plasma glucose concentration of ≥ 11.1
mmol/l (≥ 200 mg/dl) after 75g anhydrous glucose in a oral glucose tolerance test
(OGTT) or (iii) a random plasma glucose concentration of ≥ 11.1 mmol/l (≥ 200 mg/dl)
[72].
Individuals diagnosed with diabetes must manage the condition by adhering to various
health practices such as diet and exercise to maintain blood glucose levels, blood
pressure and lipid levels within healthy bounds [69]
. The next part of this introduction

21
focuses on the importance of diabetes self-management and the detrimental
consequences of poorly controlled diabetes.
1.4.2 Self-management and Diabetes Mellitus
The management of diabetes is complex and it has been reported that 95% of diabetes
management is down to the individual [74, 75]
. It involves adherence to diet, exercise,
clinic appointments and medication regimes [70, 76]
. Adherence is defined as “the extent
to which a patient’s behaviour matches agreed recommendations from the prescriber”
[77]. Adherence to medication in chronic conditions generally is estimated to be low at
around 50% [78]
, and adherence to the self-care practices, often recommended in
diabetes, is reported to be even lower [77]
. Adhering to treatment regimes is a process
that requires the combination of several behaviours as opposed to just one [79]
.
Delamater reports adherence rates of 65% for diet compared to only 19% for exercise
[80]. This highlights that the reasons for adherence to physical activity may differ from
reasons for adherence to following a healthy diet [79]
. In addition, Harris et al suggest
that the majority of people with diabetes do not measure their blood glucose levels more
than once a month [81]
. Among the 1480 patients with type 2 diabetes, 58.9% either had
only measured their blood glucose levels less than once a month or reported that they
have never measured it [81]
.
Khattab et al investigated which factors were associated with poor glycaemic control in
917 patients with type 2 diabetes [82]
. This study found that although the majority of
patients (91.9%) reported that they adhered to their medication, in comparison,
adherence to other self-care behaviours was very low. For example 81.4% of patients
did not follow a meal plan and 67.9% of patients did not participate in physical exercise.
Furthermore the study also reported that people who did not follow self-care behaviours
such as diet, 30 minutes of exercise, blood glucose monitoring and medication
adherence were more likely to have worsened glycemic control. Causality could not be
determined and the measures used were all based on self-report. This study focused on
the risk factors of diabetes such as duration, negative attitudes to diabetes and barriers
of adherence.

22
The complexity and demands of treatment regimes for people with diabetes are potential
causes of non-adherence [77, 79]
. The consequences of non-adherence can result in waste
of medication, reduced quality of life, the development of co-morbid diseases [76, 77, 79]
as well as increased costs towards medical resources such as patient hospitalisation [70,
77, 79, 83, 84].
There are a number of factors that can influence adherence such as age, social factors
and the relationship between the patient and physician, all of which may potentially lead
to a decrease in patient satisfaction [79]
. Beliefs about medication and the underlying
condition have shown to be strong predictors of adherence [85, 86]
where a lack of
perceived necessity for the medication and raised concerns about the side-effects is
linked to higher non-adherence rates. [87]
. This may be especially true for people with
type 2 diabetes where the complications of diabetes are not present at the start and
hyperglycaemia may not cause severe symptoms. Additionally, a lack of understanding
of the importance of good control and what role medication plays has been shown to
lead to non-adherence [87]
.
In addition to the associations shown between beliefs and adherence, affect has also
been shown to relate to adherence. For instance, there is evidence to suggest that
depression can have a negative impact on the management of diabetes [88]
. The
prevalence of depression in people with diabetes is high and increasing [89, 90]
. It is
estimated that depression occurs in 27% of people with type 2 diabetes and the
prevalence is higher in women (28%) than in men (18%) [91]
.
Gonzales et al found that a higher baseline level of depressive symptoms was a
significant predictor of non-adherence to medication in 879 people with type 2 diabetes
[88]. This study used a self-reporting depression questionnaire (Harvard Department of
Psychiatry/National Depression Screening Day Scale (HANDS)) to assess the
symptoms of depression and found that one point increase in the HANDS was
associated with a 1.12 increase in individuals missing at least one dose of medication
over the previous 7 days [88]
. Similarly, it has also been reported that those who are
depressed are three times more likely to be non adherent with medical treatment
recommendations [5]
.

23
People with diabetes who are severely depressed have been shown to have a poorer diet,
be more non-adherent to medication, have higher health costs and greater functional
impairment compared to diabetics who were less depressed [92, 93]
. The impact of non-
adherence can lead to the development of diabetes complications, lower quality of life
and increased healthcare cost [93]
. To alleviate depressive symptoms, an approach that
combines both medication and referral of psychotherapy such as cognitive behavioural
therapy (CBT) might be required. CBT has shown to ease symptoms for various health
problems including depression [94]
.
Whilst it has not been investigated in people with diabetes, PA has been shown to
independently predict adherence in people with hypertension. For instance, Cuffe et al
investigated happiness and adherence to antihypertensive medication in 573 African
Americans [58]
Logistic regression analysis showed that compared to people with low
happiness scores (as measured by Subjective Happiness Scale) people who had higher
happiness scores were twice as likely to report better adherence to medication. The
correlational nature of this study means that causality could not be determined and the
use of self-report limits the validity of the study.
Utilising an experimental design however, Ogedegbe et al investigated a PA
intervention in African-Americans who also were diagnosed with hypertension [61]
.
Participants who were randomly assigned to the PA intervention did see an increase in
medication adherence; however there were no differences in blood pressure over 12
months (see section 1.3).
In summary, successful management of diabetes often requires adherence to dietary,
exercise and medication regimes. Rates of adherence in other conditions have been
shown to be linked to positive as well as negative affect but little work has been
conducted in a diabetes population. If adherence is improved it can have a positive
impact on patient health which can ultimately improve the management of diabetes and
reduce the cost burden on the health care system [70, 76, 77, 79]
. In addition it can also
reduce the physical and traumatic burden to the patient who develops a serious
complication. The following sections review important biochemical factors that need to
be controlled as well as factors that help aid the management of diabetes.

24
Glycaemic Control
The management of blood glucose control is crucial for people with diabetes as
continuously elevated levels of blood glucose can lead to the onset of complications [95]
.
At present, the most accurate way of monitoring a person’s blood glucose control over a
period of time is to measure their glycated haemoglobin (HbA1c) levels which is
represented in either mmol/mol or as a percentage [96]
. HbA1c is an indication of blood
glucose control over the past two to three months. It represents the amount of red blood
cells that are glycated and so it is indicative of blood glucose levels over three months,
the lifetime of red blood cells. A greater HbA1c level is an indication of poor diabetes
control over the past two to three months. Despite this however, glycation is a
reversible process and so improving blood glucose control can result in improved
HbA1c.
NICE guidelines [97]
on glycaemic control recommend an HbA1c target ≤ 6.5% for
people with diabetes; however this is dependent on the person’s circumstances and
therefore healthcare professionals are required to adapt to individual needs. HbA1c
levels are normally monitored every three to six months. However once a person with
type 2 diabetes has reached a stable target with or without pharmacological assistance, it
is normally measured annually [98]
.
Blood Pressure
The control of blood pressure (BP) is important for people with or without diabetes as
continuous levels of elevated BP can lead to hypertension which, in the USA alone,
affects approximately 64 million individuals [99-102]
. Hypertension affects approximately
70% of people with diabetes, however this is dependent on age, ethnicity and obesity
[103, 104] and they are at greater risk of stroke, heart failure and kidney failure compared
to people with hypertension alone [100]
. Furthermore it is estimated that over 65% of all
people with diabetes will die from cardiovascular diseases [99]
. For this reason the
management of BP is paramount for people diagnosed with diabetes.

25
NICE guidelines for people living with type 2 diabetes [97]
suggests that individuals
should aim to maintain a systolic pressure of <140 mm Hg and a diastolic pressure <80
mmHg . Individuals who have kidney, eye or cerebrovascular damage, targets for BP
have been lowered to <130 mmHg for systolic pressure and < 80 mmHg for diastolic
pressure. BP is very difficult to control in diabetes and often requires multiple agents to
achieve normal BP. These include diuretics, angiotensin-converting enzyme inhibitors
(ACEI), angiotensin 2 receptor blockers (A2RB), α blockers, β blockers and calcium
channel blockers (CCB). The prevalence of diabetes and co-morbid hypertension still
remains high even though well established treatments are available. Possible reasons
for this are lack of education, non-adherence to treatment regimes and side effects of
prescribed medication [105]
.
Blood Lipids
Lipids consist of cholesterol and triglycerides that circulate in the blood. Total
cholesterol levels should be <4 mmol/l, however, they are sub divided further into high
density lipoproteins (HDL) and low density lipoproteins (LDL). Elevated blood levels
of LDL (>2 mmol/l) and triglycerides (>1.7mmol/l) can lead to increased risk of
cardiovascular disease (CVD) [106]
which is a risk factor of diabetes. Despite this, some
fats such as HDL can protect against heart disease and levels should be ≥1.0mmol/l in
men and ≥1.2mmol/l in women [107]
. If targets are not reached, statins are common
agents that are prescribed [106]
. Other pharmacological agents that are also available
include the fibrates, resins and ezetimibes [107]
.
Self-care Behaviours
As previously mentioned adherence to treatment regimes might help to reduce the
development and progression of complications [84]
. Diet and exercise are common self-
care practices that can promote better health, however among people with diabetes,
more specific self-care practices are required such as blood glucose monitoring and
regular checking of feet. Glucose monitoring is important for people with diabetes as it
can inform individuals how well they are controlling their blood glucose levels and also
whether they are at risk of hypoglycaemia. Neuropathy is a common diabetes
complication which can result in loss of sensation in the feet. This is the reason why it

26
is important that shoes and feet are checked regularly, as a person that has neuropathy or
at risk of developing it, might not realise that they have injured their foot which can
potentially lead to infections or amputation.
1.4.3 Complications of Diabetes Mellitus
People living with diabetes may develop complications due to extended periods of
hyperglycaemia. Hyperglycaemia can cause damage to blood vessels, major organs and
the nerves [69]
. Complications from diabetes can be divided into one of two groups;
macrovascular and microvascular. Macrovascular complications include coronary heart
disease, peripheral arterial disease and stroke [108]
. Cardiovascular diseases (CVD) are
the major cause of mortality in people living with diabetes [109]
and individuals with
diabetes are two to four times more likely to develop CVD than those without diabetes
and this risk increases if the management of glucose control worsens [110]
.
Microvascular complications of diabetes include diabetic retinopathy which can cause
blindness [64, 69, 111]
, neuropathy which can lead to loss of sensation in the toes, feet,
legs, hands and arms [112, 113]
and nephropathy which can lead to end stage renal disease
which results in dialysis, kidney transplant or death [64]
.
There is evidence to suggest that depression might be linked to complications, for
instance, a Meta-analysis of 27 studies conducted by de Groot et al reported a
significant link between diabetes complications and depressive symptoms [114]
.
Furthermore, statistical significance was found between depression and more specific
diabetes complications such as retinopathy, neuropathy, nephropathy and sexual
dysfunction. Many of the studies reviewed in this meta analysis were cross-sectional in
design and therefore no conclusions can been drawn in terms of the causal link between
depression and diabetes complications.
In contrast, improvements in glycaemic control and blood pressure have shown to be the
most effective way of preventing diabetes complications [104, 108, 115-117]
and this has been
shown through landmark studies for both type 1 and type 2 diabetes. These studies
include the Diabetes Control and Complications Trial (DCCT) [117]
, the Epidemiology of

27
Diabetes Interventions and Complications (EDIC) study and the UK Prospective
Diabetes Study (UKPDS) [104]
.
In summary, diabetes complications have been linked with risks that are modifiable and
therefore health care professionals should emphasise the importance of diabetes
management and the impact it can have in preventing diabetes complications.
However, although HbA1c levels, BP and lipid levels might seem to be the main
objective for health care providers, glycaemic control will not improve if health
practices are not adhered to. For this reason, shifts towards patient empowerment as
well as the set up of educational programmes that assist patients to successfully manage
their DM have been introduced.
Patient Education and Empowerment
The NHS Diabetes Framework strongly advises that educational courses are made
available to people with diabetes by their GPs. Educational programmes such as the
Dose Adjustment For Normal Eating (DAFNE) and the Diabetes Education and Self
Management for Ongoing and Newly Diagnosed (DESMOND) [118]
assist patients to
make informed decisions about their diabetes using problem solving techniques [119, 120]
.
DESMOND is aimed at people who are newly diagnosed with type 2 diabetes,
preferably within twelve weeks of diagnosis. The programme was developed to ensure
that it could be integrated into routine care and have the ability to target a wide range of
people with diabetes. Health-care professionals are given formal training to ensure that
the programme is delivered to the same standard nationally [121]
. The six hour pre-
written curriculum focuses on issues such as lifestyle factors, food choices, exercise and
risk factors. Davis et al evaluated the DESMOND programme in a twelve month
randomised control trial (RCT). They found that individuals newly diagnosed with type
2 diabetes who attended the DESMOND programme in addition to the routine care
showed a significant reduction in body weight and triglyceride levels compared to a
control group. In addition, the intervention group were less likely to be smoking at
twelve months as well as showing significant improvements in the (i) understanding, (ii)
taking responsibility and (iii) seriousness of their diabetes. Furthermore there was also
a significant reduction in depression scores for the intervention group [119]
.

28
DAFNE is an educational programme aimed at people with type 1 diabetes [120]
. The
objective of this five day training course is to teach and provide individuals with the
skills that are required to understand factors such as carbohydrate counting, monitoring
of blood glucose, insulin regimens, hypoglycaemia and exercise. Like the DESMOND
programme, the initiative is to discuss experiences and share ideas that are facilitated by
trained health care professionals but to also acquire specific skill sets that teach people
with type 1 diabetes to inject the right amount of insulin to match the carbohydrates that
they are consuming.
The management of diabetes relies heavily on patients having the ability to set goals as
well as make informed daily decisions. The set-up of these education programs moves
away from the notion that healthcare professionals are the only experts. Instead, they
provide a safe environment consisting of small groups where the day to day
management of diabetes can be discussed. It is an opportunity for patients to raise
questions and gives patients the confidence to make informed decisions. This notion
has led to a shift towards patient empowerment.
A movement towards patient empowerment, which can be seen as “a process to
facilitate self-directed behaviour change” [122]
, can help encourage patients to make
informed decisions about the management of their diabetes [123]
. Interventions designed
to increase empowerment can increase an individual’s ability to make self-directed
decisions [122]
. It is vital that health care providers motivate individuals so that self
efficacy becomes an integral part in changing behaviour which can ultimately lead to
better diabetes management [123, 124]
.
Anderson et al designed a six week programme with one week intervals to investigate
the impact of a patient empowerment programme on self-efficacy, attitudes towards
diabetes and glycaemic control [125]
. This randomised control study recruited 64
predominantly middle aged women (mean age 50) who were overweight, well educated
and already felt that that their diabetes was managed well. The intervention group were
assigned to the empowerment program and the control group were put on a waiting list.
Blood samples were drawn to measure HbA1c. After the six week session, individuals
were asked to complete a questionnaire. The study found a significant reduction in

29
HbA1c and improvements in self efficacy, however there were limitations to this study
such that the sample population was already motivated to take part in the study.
Furthermore, the follow-up sessions between the two groups were not a direct
comparison due to the fact that measurements were taken from the intervention group at
12 weeks and compared to the control group where measurements were taken at 6
weeks.
In summary, the objective of empowerment does not involve persuading an individual
to change, but instead to focus on forming a partnership that encourages and supports
individuals to reflect on their experience of living with diabetes [122]
. The patient is an
integral part of their diabetes management team and should be empowered [126]
, through
appropriate training to prevent or treat their diabetes. Consequences of a poor patient-
healthcare provider relationship could lead to poor management and subsequently the
development of complications.
The link between people with diabetes and the ability to successfully self manage may
be mediated by various psychosocial factors [123]
. The implications of depression on the
adverse effects of self management were discussed previously (see section 1.4.1 and
1.4.2). However, there are other psychosocial factors that might also affect diabetes
management such as stress and quality of life.
1.5 Diabetes Mellitus Positive Affect and Psychosocial Factors
Stress and Coping
The onset and progression of living with a chronic disease such as diabetes can be seen
as stressful [127]
. Stress has been hypothesised to affect diabetes through physiological
mechanisms as well through uptake of health behaviours [127]
.
Stress is a pattern of physiological, behavioural, emotional and cognitive responses to
stimuli that are perceived as threats or challenges. Stress can lead to either confronting
a situation or escaping it otherwise known as the “fight or flee response” [128]
. These
stimuli are normally aversive and are referred to as stressors. Stressors can range from

30
being very serious such as being in an earthquake to not so serious such as waiting for a
delayed train. In response to a stressor the hypothalamus sends signals to both the
autonomic nervous system and the pituitary glands which results in the body’s organs
becoming stimulated. As a result of this, blood pressure as well as heart rate increases.
In addition blood glucose levels rise and blood vessels become dilated. The negative
consequences of stress can have detrimental effects on health and therefore it is
paramount that individuals learn to control it [129]
.
Stress can have serious repercussions for people with diabetes as cortisol, a stress-
related hormone, triggers glucose production [130]
. Long–term exposure to high levels of
cortisol [130]
can be very dangerous for people with diabetes as it becomes more difficult
to control blood glucose levels [26]
and as a consequence it can lead to poor control of
the disease [130]
. Stress may also affect glycaemic control by affecting behaviours
around medication-taking, diet and exercise. These changes in self-care behaviours can
consequently lead to poor management of the condition [127]
. In addition, stress can lead
to increased smoking and alcohol use which can impact cardiovascular parameters and
blood glucose [75]
. Stress can also impact other factors such as quality of life so
therefore reducing the adverse effects of stress might also improve other diabetes related
outcomes.
Coping strategies may mediate the link between stress and diabetes-related outcomes
[131]. Engaging in more problem-focused coping strategies, for instance, has been shown
to lead to lower HbA1c in non-diabetic women [132]
, and training in stress-management
has been shown to be linked to reduced HbA1c in people with type 2 diabetes [133]
.
Quality of Life
Quality of life (QOL) is a measure of physical, social and emotional wellbeing [134]
. It is
a collection of subjective as well as objective experiences in relation to health. People
diagnosed with chronic illnesses have been shown to manage their condition better if
they have a better quality of life in terms of satisfaction, social networks and overall
well-being [135]
. These elements have the potential to motivate individuals to manage
their illness successfully. There are two broad approaches in measuring QOL, generic

31
and disease specific [136]
. Generic quality of life and well being instruments illustrate an
overall picture of health and illness where as disease specific QOL instruments focus on
the specific problems associated with that disease [134]
.
The daily challenges of diabetes can substantially impact an individual’s QOL [137, 138]
.
This can lead to unfavourable outcomes such as poor management of self-care practices
which can impact physiological variables like glycaemic control which can result in the
onset of complications [134, 139]
. The onset of complication has shown to reduce QOL; in
particular, the presence of two or more diabetes-related complications has been
associated with poorer QOL [134]
. For these reasons, QOL is often reported to be lower
in people with diabetes than those without [139]
.
Paddison et al investigated the relationship between psychosocial factors, HbA1c and
quality of life in 615 people with type 2 diabetes [139]
and showed that lower HbA1c was
associated with better perceived quality of life as measured by a single item from the
Audit of Diabetes-Dependent Quality of Life (ADDQOL) questionnaire.
1.6 Positive Affect in People with Diabetes Mellitus
In a recent review [140]
, Robertson et al investigated the associations between positive
emotional health and outcomes in adults with diabetes. The review focused on three
specific areas of positive emotional health that were published between 1970 and 2011;
they were well-being, PA and resilience. In comparison to the studies investigating
well-being (n = 13), there were far fewer in relation to PA (n= 5) and resilience (n = 4).
The next part of this introduction will briefly summarise the main findings for well-
being and resilience and then focus on the PA studies.
Among the thirteen studies reviewed in relation to positive well-being, the findings
indicated that it was linked to better diet, exercise and lower HbA1c. In addition, higher
positive well-being was associated with higher education and not being on insulin.
Well-being was generally measured as an outcome and either measured using the Well-
Being Questionnaire (long and short form) or the WHO Five Well-being Index. The
study designs varied within these studies from cross-sectional to randomised control

32
studies. Out of all the studies reviewed only one study found a negative link between
positive well-being and HbA1c.
In relation to resilience, studies either used several instruments to measure various
constructs such as self efficacy, purpose in life and locus of control or alternatively only
used one instrument which was the Connor-Davidson Resilience Scale. The findings
suggest that resilience predicted HbA1c after 1 year and that high resilience dampened
the effect of worsened HbA1c and self-care behaviours in response to increased distress.
Furthermore it was linked to improvements in empowerment.
The handful of studies that have investigated the relationship between PA and diabetes
related factors [26, 140-143]
have used various methods to measure PA, these include the
Positive and Negative Affect Scale (PANAS) [141]
, the Affect Balance Scale (ABS) [143]
,
the Mood Adjective Checklist (MACL) [142]
and the PA subscale of the Centre for
Epidemiological Studies Depression Scale (CES-D) [26]
. Outcomes ranged from self-
care practices such as exercise and glucose monitoring to physiological parameters such
as HbA1c and have found mixed results.
For instance, Moskitwitz et al investigated whether PA could predict mortality in people
with diabetes [26]
. This was a longitudinal study that followed a sample population that
consisted of people with diabetes (n = 715) or without a chronic condition (n = 2,673).
Among the 715 patients who were followed over 10 years, individuals that were higher
in PA were 13% times less likely to be at lower risk of mortality. This result was not
independent of NA, however, when analysing individual items of the CES-D PA,
‘enjoyed life’ was a significant predictor of mortality independent of NA.
In addition to investigating the relationship between PA and mortality over a ten year
period (1982 – 1992), Moskitwitz et al also investigated the stress buffering theory such
that it was hypothesised that PA would be strongly associated with mortality among
people with diabetes compared to people with no chronic conditions. The authors
proposed that having a chronic condition adds an extra burden of stress that people
without a chronic condition do not have. Interaction analysis between PA and perceived
stress in people with diabetes and in people without chronic condition who were over 65
years old showed no associations in people with diabetes but did show an association in

33
people without chronic conditions such that the protective effects of PA on mortality
were much stronger in those who reported greater levels of stress. The study found no
link when directly comparing people with diabetes and people without chronic
conditions. A possible reason that might explain why there was no interaction between
PA and stress on mortality in people with diabetes is that the 4 items used to measure
stress were taken from the General Well-being Schedule and therefore might have not
been as sensitive compared to a questionnaire such as such as the Perceived Stress Scale
(PSS) which is specifically aimed to measure perceived stress.
Skaff et al investigated the relationship between affect (PA and NA) and blood glucose
levels in people with type 2 diabetes [141]
. This study instructed participants to measure
their glucose for 21 days every morning as soon as they woke. To measure PA and NA,
participants were instructed to complete the PANAS every evening (time frame used -
last 24 hours). Individuals who had higher NA levels across the 21 days had higher
morning blood glucose levels. However this relationship was no longer significant after
it was adjusted for covariates (HbA1c, treatment and time since diagnosis). No links
were found between PA and blood glucose. Within-person analysis showed that when
men but not women had higher NA levels compared to their average state, blood
glucose levels would be higher the following morning. A possible reason to why this
study found no relationship between PA and fasting blood glucose is that individuals
had to continue to take measurements on a daily basis for 21 days and this might have
been burdensome to the participant. HbA1c might be a better measure as it is an
indication of long term glucose control over the past two to three months. It only
involves taking one sample and can be correlated with PA and NA by adjusting the time
frame.
In summary, there are only a handful of studies that have investigated PA in relation to
diabetes outcomes. These studies used a range a methods in measuring PA and it can be
argued that not all of these instruments actually measured PA as a construct independent
from NA. Importantly, however, this review highlights that PA is related to some
favourable outcomes. Therefore, PA should also be targeted in intervention studies in
order to fully explore if increases in PA can further improve the management of
diabetes.

34
An understanding of the role of PA and how it can be enhanced will help to identify
what types of resources are needed to enhance PA. This is key to the development of
new interventions. At present, there are no studies that have investigated PA
interventions on the relationship between PA and diabetes outcomes (as measured by
HbA1c, quality of life and self-care practices).

35
1.7 Aims of the Project
The stress-buffering model suggests the effects of stress can be buffered by PA. Studies
have shown that people higher in PA react less to and recover faster from stress
compared to people with low PA; however, these studies have yet to investigate the
effect of this relationship using a PA intervention.
PA has been associated with chronic conditions [2, 9]
, however, there are relatively few
studies that have investigated the relationship between PA and diabetes related
measures. Diabetes mellitus is a long-term, complex condition that involves intensive
management to avoid or delay the onset and progression of complications. The impact
of a PA intervention is yet to be investigated in people with diabetes and therefore the
role of PA needs further investigation.
PA interventions are starting to emerge as methods to increase PA and have shown to
lead to improvements in health measures in patients with chronic conditions such as
hypertension and asthma. The Three Good Things exercise is an intervention that has
led to significant improvements in happiness; however the effect of this intervention has
not been investigated on health measures such as HbA1c, self-care practices, quality of
life and cardiovascular reactivity and recovery.
The aims of the project intends to fill the gaps in the existing literature and entail
designing three research studies
Aim 1: Investigate the stress-buffering hypothesis of PA
Aim 2: Investigate the relationship between PA and diabetes related measures
Aim 3: Investigate the effect of a simple PA intervention on PA and health measures

36
Chapter Two: General Methods
This chapter addresses two areas, as well as detailing a general description of the
psychological and physiological measures that have been used at various stages of this
research; it also justifies the reasoning to why we have chosen the Positive and Negative
Affect Scale (PANAS) to measure PA throughout this thesis.
2.1 Mood Related Measures
2.1.1 Positive and Negative Affect Scale
General Overview
The Positive and Negative Affect Scale (PANAS) was developed by Watson, Clark, &
Tellegan (1988) and is designed to measure two primary facets of mood, positive and
negative affect [11]
. It contains 10 Positive Affect (PA) items (interested, excited, strong,
enthusiastic, proud, alert, inspired, determined, attentive and active) and 10 Negative
Affect (NA) items (distressed, upset, guilty, scared, hostile, irritable, ashamed,
nervous, jittery and afraid). Participants are asked to rate each item on the extent to
which it describes them [144]
. Items are rated as 1 (very slightly or not at all), 2 (a little),
3 (moderately), 4 (quite a bit), and 5 (extremely). For each mood facet, total scores can
range from 1 to 50 or, alternatively, mean scores can range from 1 to 5, with the higher
scores indicating greater affect [144]
. The PANAS has demonstrated good reliability with
Cronbach’s Alpha for PA and NA ranging from 0.83 to 0.90 and .84 to .93 respectively
[11]. The inter-correlation between PA and NA are normally reported low to moderate
and negative ranging from -.12 to -.23 [145]
. A number of timeframes have been used
with the PANAS including “today”, “the past year” and “generally”.
Rationale
The Positive and Negative Affect Scale (PANAS) is a widely used questionnaire that
attempts to measure PA and NA independently [2, 46, 47, 144]
. It has been used in many

37
studies including areas such as health practices [53]
, chronic pain [146]
and cardiovascular
reactivity/recovery [46, 47]
.
There is some debate, however, over the extent to which PA is independent of NA [2, 11,
147]. It is of reasonable assumption that people would think that these measures of affect
are bipolar because the claim that PA and NA are independent, suggests that the words
positive and negative are not opposite when in actual fact they are [14]
.
Although, the items used within the PANAS are based on independence, the dimensions
still correlate. Watson and Clark suggested that the correlation between PA and NA is
very small and consistent regardless of the time frame that is chosen [11]
, however when
Schmukle et al investigated the correlation and timeframe between PA and NA [147]
, the
results showed that when using the time frame “generally” the relationship between PA
and NA was relatively independent, however when individuals were ask to respond to
“right now” the association between the two dimensions was quite correlated. These
findings suggest that there is a level of independence between PA and NA on a trait
level but not for a state level [147]
.
To address this issue, Russell and Carroll suggested that if affect activation levels are
categorised, it might remove bipolarity, such that if activation levels of affect are
grouped [(i) PA: high activation (ii) PA: medium activation (iii) PA: low activation (iv)
NA: high activation (v) NA: medium activation and (vi) NA: low activation] [14]
, by
removing the group that is 180 degrees away from the corresponding group of interest,
the presence of bipolarity could be removed. For example if PA: high activation items
were used then you would not use NA: low activation (see Figure 2.1). The PANAS
uses high activated emotions to measure PA such as ‘excited’ and ‘enthusiastic’, as well
as high activated NA items such as ‘upset’ and ‘hostile’. This, according, to Russell
and Carroll removes bipolarity [14]
.
Another factor that can influence the independence of PA and NA is how individuals
respond to a question. For example, if individuals were asked to rate how happy they
are and then rate how sad they are using the same scale that ranges from extreme
sadness to neutral to extreme happiness, then it is highly likely that the ratings obtained
will be opposite to one another. To address this issue, PA and NA need to be scored

38
separately using the same scale that does not adopt a negative-neutral-positive
continuum. Instead, a response scale that starts at 0 for both dimensions could reduce
bipolarity. The response format of the PANAS ranges from not at all to extremely, and
does not include a neutral point. Therefore if individuals scored low on PA subscale, it
would be an indication of low NA activation such as tired and bored. On the contrary if
individuals scored low on the NA subscale, it would be an indication of low PA such as
calm.
Figure 2.1 Affect categorised by valence and activation (PA = positive affect; NA =
negative affect) [14]
Based on the reasons above, the PANAS will be used in this thesis to measure PA
independently from NA. In addition, in using this instrument we can hypotheise that
the PANAS will measure PA independently from NA.

39
2.1.2 Perceived Stress Scale
The Perceived Stress Scale (PSS) was developed by Cohen & Williamson (1988) [148,
149]. It contains 10 items and is designed to measure the degree to which an individual
appraises the situations in their life [150]
. The standard response time-frame is “during
the last month” for example “In the last month, how often have you been upset because
of something that happened unexpectedly?” and “In the last month, how often have you
found that you could not cope with all the things that you had to do?” The PSS has
been used in studies that have investigated health behaviours such as sleeping, drinking
and exercising [150, 151]
. Furthermore it has also been used in studies that have
investigated biochemical markers such as cortisol [152, 153]
. The PSS has demonstrated
good reliability with Cronbach’s Alpha (coefficient to rate internal consistency) ranging
from 0.84 - .86 [149]
. Items are rated as 0 (never), 1 (almost never), 2 (sometimes), 3
(fairly often), and 4 (very often), however, items 4, 5, 7 and 8 are reversed scored.
Scores can range from 0 – 40, with the higher scores indicating greater perceptions of
stress [148]
.
2.1.3 Profile of Mood State
The Profile of Mood Scale (POMS) was developed by McNair et al (1971) [154]
and is
suitable for both research and therapy purposes [155]
. The instrument has 72 items which
are divided into 8 mood subscales; these are anxiety, depression, anger, vigour, fatigue,
confusion, friendliness and elation [156]
. Participants are asked to rate each item on the
extent to which it describes them at that moment in time. Items are rated as 0 (not at
all), 1 (a little), 2 (moderately), 3 (quite a bit), and 4 (extremely) with higher scores
indicating a greater degree of that mood state [156]
.

40
2.2 Diabetes Related Measures
2.2.1 Diabetes Quality of Life
The Diabetes Quality of Life Scale (DQOL) was developed by Jacobson et al (1988)
[157] and is designed to assess diabetes related quality of life in individuals with type 1 or
type 2 diabetes. The DQOL contains 60 items; 13 of which are specific to children and
adolescents with diabetes. These 13 items were not incorporated into the questionnaire
as none of the sample populations were children/adolescents. The DQOL provides four
subscales which are satisfaction with treatment, impact of treatment, social worries and
diabetes related worries [157]
. Items are rated on a five-point Likert scale and consist of
two general designs. The first half of the instrument asks individuals how satisfied are
they with their diabetes, for example, “How satisfied are you with the flexibility you
have in your diet?” and is scored from 1 (very satisfied) to 5 (very dissatisfied). The
second half of the instrument asks about the frequency of the negative impact of
diabetes or of the diabetes treatment, for example, “How often does your diabetes
interfere with your family life?” and is rated from 1 (never) to 5 (all the time). The
DQOL has been shown to have good internal consistency (r = 0.78–0.92), test retest
reliability (r = 0.78–0.92), and convergent validity for all subscales for people with type
1 and type 2 diabetes [158]
. For the present studies, scoring of the DQOL was
transformed [159]
so that a higher score indicated a more positive quality of life for all of
the subscales. Participants’ scores were reversed (apart from Impact items 8 and 16)
and summed to form a raw score for each subscale. This score was used to calculate a
transformed score (see Figure 2.1).
In the present studies and following Jacobson et al [157, 159]
, total sub-scale scores were
only calculated where there was enough valid data for a case. Therefore total subscales
scores were not calculated for social worries and diabetes related worries if two or more
items were missing; for impact, if five or more items were missing and for satisfaction,
if four or more items were missing.

41
Figure 2.2 Diabetes Quality of Life transformation calculation.
Equation to calculate the transformed scale for each DQOL subscale [157]
2.2.2 Summary of Diabetes Self Care Activities
The Summary of Diabetes Self Care Activities (SDSCA) was developed by Toobert et
al (2000) [160]
. It contains 12 items and measures diabetes related self-care practices
over a seven day period which includes diet, exercise, blood glucose monitoring, feet
checks and smoking status. The SDSCA is a self-report measure which is brief,
reliable, valid and multidimensional measure of diabetes self-management behaviours
[160]. Individuals report how many of the last seven days they engaged in a certain self-
care activity, for example, “on how many of the last SEVEN DAYS did you eat five or
more servings of fruits and vegetables?” Mean scores are calculated for each self-
report measure. Due to the fact that the distribution of responses for each self-care
practice was bimodal, with most individuals either engaging fully or not at all to self
care activities, parametric analysis could not be justified. For this reason two groups
were formed ≥5 days and < 5 days [161]
.
2.3 Personality Related Measures
2.3.1 Connor–Davidson Resilience Scale - 10
The Connor-Davidson Resilience Scale 10 (CD-RISC 10) [162]
is a self-report
questionnaire designed to measure an individual’s perception of their own resilience
[162]. It contains 10 items which assess individuals’ perceptions of their abilities to
adapt to change, deal with unexpected events, cope with illness, handle unpleasant
Transformed Scale = Participant raw score – lowest possible raw score *100
Raw score range

42
feelings and also maintain positivity in the face of stress [162]
. The CD-RISC 10 has
demonstrated good reliability with a Cronbach’s Alpha of 0.85 [162]
. Examples include
“I can stay focused under pressure” and “I can deal with whatever comes”. Items are
rated as 0 (not true at all), 1 (rarely true), 2 (sometimes true), 3 (often true), and 4 (true
nearly all the time). Scores range from 0 to 40 with the higher scores indicating greater
resilience [162]
. The CD-RISC-10 was chosen over the original 25-item version as it
reduces participant burden and has been shown to be highly correlated with the 25-item
version (the correlation co-efficient between the 25-item and 10-item scales has been
shown to be r = .92 in previous research indicating a strong relationship) [162]
.
2.3.2 Coping Styles
The Brief COPE scale is designed to measure a range of coping responses among adults
for all diseases [163]
. Within this instrument there are fourteen dimensions with each
dimension having two items [164]
. These include self-distraction, active coping, denial,
substance use, use of emotional support, use of instrumental support, behavioural
disengagement, venting, positive reframing, planning, humour, acceptance, religion and
self blame. The two dimensions that were selected for the present studies were active
coping and instrumental support [164]
. These were selected as they have been previously
used in a diabetes population and have been associated with positive affect [132]
. Active
coping is the process of taking active steps to try and reduce or remove the stressor or
having the ability to recognise the effects of the stressor [165, 166]
. Instrumental support is
the extent to which an individual seeks help, advice or information [165, 166]
. Both of
these coping strategies are forms of problem focused strategies [164]
. Items are rated on
a four point Likert scale ranging from 1 (I haven’t been doing this at all) to 4 (I have
been doing this a lot) with higher scores indicating greater use of these coping strategies
by the individual. Active coping and instrumental support have demonstrated good
reliability with Cronbach’s Alpha’s of .71 and .64 respectively [164]
.

43
2.4 Physiological Measures
2.4.1 Blood Pressure and Heart Rate
Blood pressure (BP) and heart rate (HR) measurements were taken using a digital blood
pressure monitor (exact model will be displayed in the appropriate chapter). The cuff
was positioned around the upper left arm so that the edges were parallel and the cuff
was mildly snug but still admitted a finger under it. The lower edge was one inch above
the bend of the elbow, if physically possible. The hose was positioned over the brachial
artery just to the inside of the midline of the elbow crease. When the arm was relaxed
the start button on the monitor was pressed. Measurements obtained were (i) systolic
pressure (ii) diastolic pressure and (iii) heart rate.
2.4.2 Body Mass Index
Body mass index (BMI) was calculated using weight and height measurements.
Participants were asked to remove any outdoor clothing and footwear i.e. coats, jackets,
heavy outerwear and shoes/boots. Participant’s weight was measured using calibrated
weighing scales in kilograms. Height was measured in meters using a height measuring
stick (Leicester Height Measure, SKU: SMSSE-0260, Model: Leicester). From these
measurements the BMI was calculated using the following equation (Weight
(kilograms))/ Height2 (metres)).
2.4.3 HbA1c Determination
HbA1c was measured self-reported and objectively within this thesis. Participants were
asked to either self-report their most recent HbA1c reading or alternatively it was
measured objectively using the Bio-Rad machine which will be explained in more detail
below. HbA1c levels fluctuate every 2-3 months and therefore the self-report measure
must be taken with slight caution as the reading would not directly correlate with the
responses to questions.

44
BioRad Clinical Procedure
The Bio-Rad in2it Analyzer was used to determine HbA1c levels. The procedure was
followed in line with the BioRad In2it (I) Instruction Manual to ensure accurate
performance of the product. Prior to the test procedure, system checks were always
performed using the In2it System Check Cartridge. This occurred (i) before the samples
were tested, (ii) if the Analyzer was moved, (iii) if there were concerns that the test
result may be incorrect or (iv) after an error message. Once completed participants were
asked to sit down and the finger prick site was cleaned with an alcohol swab. When the
area was dry, a sterile lancet was used to make the finger puncture. The finger was
gently massaged to allow a blood drop to form. Using the blood key provided by Bio-
Rad, blood was drawn into the key. Once completed, the blood key was immediately
inserted into the Bio-Rad cartridge and there after immediately placed into the
Analyzer. The analysis took ten minutes to complete. Once the test was finished, the
HbA1c percent was displayed and recorded. The cartridge was then disposed of as
biohazardous waste. The participant was given a small ball of cotton wool to put over
the puncture for a few minutes to stop the bleeding and a plaster was applied if needed.
Equipment
281-0000EX in2it (I) Analyzer, Model 501122R.1
281-0001EX in2it (I) A1c Test Cartridge
281-0002 in2it System Check Cartridge
281-0003 Blood Keys
281-0012 Cartridge Work-stand
AT1004 Owen Mumford, Unistik® 3 Normal, Single Use Safety Lancets
Information taken from the Bio-Rad in2it Analyzer manual states that the method used
to separate the glycated fraction from the non-glycated fraction was boronate affinity
chromatography. The in2it Analyzer (I) used was a fully automated system incorporated
with a single-wavelength (440nm) photometer [167]
. Each test cartridge that was used
contained a sample reagent (boronate affinity resin, surfactant, sodium azide (0.1%) and
buffer) as well as wash solution and elution buffer. Once the cartridge was in the

45
Analyzer, the analysis was automated to calculate a glycated absorbance as well as a
non-glycated absorbance [167]
.
Storage
Test cartridges were stored in their protective packaging until they were ready to use
and were stored between 2-8 oC. The operating temperature of the test was between 18
and 27 o
C and therefore the cartridges were allowed to reach room temperature before
they were used.
2.5 Positive Affect Intervention and Control Exercise
The interventions and control exercises that were given to participants were based on
established methods that have been used in the largest randomised control trial in this
area [57]
. The intervention exercises: three good things (TGT) have been shown to have
long term effects on mood. The intervention exercises have shown to increase
happiness and decrease depression up to six months while the control exercise, early
memories (EM)) did not show to have such effects [57]
. A note book and pen was given
to each participant. Based on the work of Seligman et al (2005), they were instructed to
spend 10 minutes on their allocated exercise and to complete it daily over seven
consecutive days.

46
2.5.1 PA Intervention Exercise
Three Good Things
Participants were asked to write down three good things that happened each day and
also write down why each thing went well. The following instructions were given to
participants
“We think too much about what goes wrong and not enough about what goes right in
our lives. Of course, sometimes it makes sense for us to analyse bad events so that we
can learn from them and avoid them in the future. However, people tend to spend more
time thinking about what is bad in life than is helpful. Worse, this tendency to focus on
bad events sets us up for anxiety and depression. One way to keep this from happening
is to develop our ability to think about the good in life. Most of us are not nearly as
good at analysing good events as we are at analyzing bad events, so this is a skill that
needs practice. As you become better at focusing on the good in your life, you will likely
become more grateful for what you have and more hopeful about the future. So let’s get
started.
Every night for one week, set aside 10 minutes before you go to bed. Use that
time to write down three things that went really well during that day and why
they went well. Write about these events in the notebook that we have given to
you.
Next to each positive event, answer the question “Why did this good thing
happen?”
It is important that you keep a physical record of what you have written. It is
not enough to do this exercise in your head.
Writing about “why” the positive events in your life went well may seem
awkward at first, but please stick to it. It will get easier!
Do this every night for 7 days
After 7 days, look back at what you have written in your notebook
The three things in your list can be relatively small in importance or they can be
relatively large in importance to you. For example you could write “My children
cooked me a lovely meal, I thought this was very thoughtful and caring”

47
2.5.2 Control Exercises
Two different control exercises were employed and these are described below.
Early Memories
Participants were asked to think about their earliest memories and write about them at
the end of each day for seven days. The following instructions were given to
participants
“Consider for a moment your earliest memories. Out of all the experiences of a
lifetime, we only hold onto a few in the form of early memories. A careful consideration
of our earliest memories may help us better understand who we are today.
Every night for one week, set aside 10 minutes before you go to bed. Use that
time to think about an early memory and write it down in as much detail as
possible.
Try to remember what you were doing at that time, who you were with and what
you were feeling (please do not worry if you cannot remember some of the
details, that is OK, just write down what you can remember).
Write about these events in the notebook that we have given you.
It is important that you keep a physical record of what you have written. It is
not enough to do this exercise in your head.
Do this every night for 7 days
After 7 days, look back at what you have written in your notebooks. Do you
notice any similarities or patterns across the memories?”

48
Statistical Writing
Participants were instructed to copy chunks of text taken from an introductory statistics
textbook [168]
over a seven day period. The following instructions were given to
participants
Dear Participant
You have been chosen at random to do the following task. Please follow the instructions
for the exercise below. In this envelope there are 7 pieces of paper. Each paper
corresponds to a day of the week. Day 1, Day 2, Day 3 etc
Every night, for 7 days, set aside 10 minutes before you go to bed to complete this
exercise.
On day 1, please copy the text that corresponds to day 1 into the notebook provided
On day 2, please copy the text that corresponds to day 2 into the notebook provided
On day 3, please copy the text that corresponds to day 3 into the notebook provided
On day 4, please copy the text that corresponds to day 4 into the notebook provided
On day 5, please copy the text that corresponds to day 5 into the notebook provided
On day 6, please copy the text that corresponds to day 6 into the notebook provided
On day 7, please copy the text that corresponds to day 7 into the notebook provided
After completing the writing task, all pieces of paper can be placed back inside the
envelope
It is important that you keep a physical record of what you have written. It is not
enough to just read the exercise.
Please do not spend more than 10 minutes on this exercise

49
DAY 1
The next level of measurement moves us away from categorical variables and into con-
tinuous variables. A continuous variable is one that gives us a score for each person and
can take on any value on the measurement scale that we are using. The first type of
continuous variable that you might encounter is an interval variable. This hypothesis is
the opposite of the alternative hypothesis.
DAY 2
Ratio variables go a step further than interval data by requiring that in addition to the
measurement scale meeting the requirements of an interval variable, the ratios of values
along the scale should be meaningful. For this to be true, the scale must have a true and
meaningful zero point. In our lecturer ratings this would mean that a lecturer rated as 4
would be twice as helpful as a lecturer rated with a 2.
DAY 3
Continuous variables can be, well, continuous but also discrete. This is quite a tricky
distinction. A truly continuous variable can be measured to any level of precision,
whereas a discrete variable can take on only certain values on the scale. Our example
in the text of rating lecturers on a 5-point scale is an example of a discrete variable.
The range of the scale is 1–5, but you can enter only values of 1, 2, 3, 4 or 5.
DAY 4
Things like reaction times and physiological measures are valid in the sense that a
reaction time does in fact measure the time taken to react and skin conductance does
measure the conductivity of your skin. However, if we’re using these things to infer
other things then they will be valid only if there are no other factors other than the one
we’re interested in that can influence them.
Day 5 This method is the one described above, in which different groups of people take part in
each experimental condition. The second method is to manipulate the independent
variable using the same participants. The mean is the measure of central tendency that
you are most likely to have heard of because it is simply the average score and the
media are full of average scores.
DAY 6
Randomization is important because it eliminates most other sources of systematic
variation, which allows us to be sure that any systematic variation between
experimental conditions is due to the manipulation of the independent variable. Interval
data are considerably more useful than ordinal data and most of the statistical tests in
this book rely on having data measured at this level.
Day 7
This works very nicely when we have an odd number of scores but when we have an
even number of scores there won’t be a middle value. Let’s imagine that we decided that
because the highest score was so big, we would ignore it. We have only 10 scores now.
As before, we should rank-order these scores: 22, 40, 53, 57, 93, 98, 103, 108, 116, and
121. We then calculate the position of the middle score.

50
Chapter Three: A single blind, randomised control
study to investigate the impact of a positive affect
intervention on cardiovascular reactivity and recovery
3.1 Introduction
The relationship between Positive Affect (PA) and stress has been described through a
stress buffering model (see Figure 1.4) which proposes that the effect of stress on health
is buffered by PA levels. The objective of this study was to test the stress buffering
hypothesis using an experimental design.
A number of studies have investigated how physiological indicators such as blood
pressure (BP) and heart rate (HR) change in response to acute mental stress [20, 24, 39, 42,
46, 48, 49]. These studies have generally found that individuals higher in PA react better to
and from laboratory stressors such that they have lower reactivity and faster recovery.
Changes in BP and HR in response to stress are typically measured as cardiovascular
reactivity and recovery. Heightened reactivity and delayed recovery to acute mental
stress can predict future changes in cardiovascular parameters such as BP and HR [23, 169-
171]. This area of research is important as continuous elevated changes in response to
stress can lead to the onset and progression of cardiovascular diseases (CVD).
Cardiovascular reactivity is defined as an increased elevation in BP or HR in response
to acute mental stress which involves tasks that may be challenging, aversive, or
engaging [170]
. Cardiovascular recovery is defined as the time it takes for BP and HR to
return to baseline after a stress-induced task or, alternatively, the extent of elevation that
remains during the post-task recovery period [171]
.
Chida and Steptoe [169]
conducted a meta analysis on the association between
cardiovascular responses in response to acute mental stress and cardiovascular risk
status which included factors such as elevated blood pressure, hypertension and

51
coronary calcification. The analysis found that heightened reactivity and delayed
recovery were linked longitudinally to poorer cardiovascular status.
Previous studies have investigated the relationship between PA and physiological
measures such as cardiovascular, neuroendocrine and inflammatory markers [9, 15, 20, 24,
25, 39, 46-49, 172]. Generally, studies have found associations between PA and
cardiovascular parameters such that high levels of PA have been linked to lower BP and
HR reactivity to stress and better recovery from stress [20, 24, 48-50]
. However, such
studies have yet to investigate whether PA interventions designed to increase PA could
improve reactivity to and recovery from acute mental stress. The three good things
(TGT) intervention has been shown to increase PA after one week and up to six months
[57]. In view of this, this study aimed to first see if the TGT intervention could show the
same efficacy in a healthy population and then secondly, whether the manipulation
could have a beneficial impact on reactivity and recovery in response to acute mental
stress.
As mentioned at the start of this chapter, the relationship between PA and stress has
been described though a stress buffering model (see section 1.4). In relation to acute
mental stress, individuals with higher PA are predicted to be resilient to the effects of
the stress tasks and as a consequence the effect on BP recovery and reactivity will be
more adverse for someone with lower PA. For this study we hypothesise that
participants in the intervention group will react less and recover more quickly in
response to the stress tasks after a one-week intervention compared to those in the
control group.
Another area that this study addressed was the relationship between PA and NA.
Previous research has criticised the methods with which PA has been measured. One
questionnaire in particular is the PANAS which, although has been extensively used, is
often criticised for measuring current mood state and memory recall. Nevertheless, as
reviewed in the methods chapter, the items in the PANAS (section 2.1.1) are designed
so that PA and NA are independent of each other. Therefore if the TGT intervention
can effectively manipulate PA, then it should not have any effect on NA, when
measured by the PANAS. Therefore the second aim of the study was to see if levels of

52
PA and NA change independently following the PA intervention. It is hypothesised that
participants undergoing the TGT intervention will have a greater increase in PA scores
compared to the control participants.
Most studies that have investigated the relationship between PA and CV measures have
been cross-sectional in design and therefore causality cannot be determined [20, 24, 25, 49]
.
For this reason, this was a single blind randomised control study and adds to the current
body of research. Furthermore these studies have failed to incorporate a control group
to show that a stress response actually did occur. Although the studies showed
significant increases from baseline, it is still important to compare it to a control group,
as without one, any changes can be attributed to the passage of time alone. For this
reason the study design also included a non stress group and it was hypothesised that
individuals randomised to the stress group would react more compared to people in the
no stress group.
In conclusion, based on the literature above it is hypothesised that (i) the TGT exercise
would induce an increase in PA; (ii) the PA intervention would not change negative
affect; (iii) individuals who completed the stress task would have higher systolic blood
pressure (SBP), diastolic blood pressure (DBP), heart rate (HR) and perceived stress
(PS) compared to the no stress group; (iv) the PA intervention (TGT) would reduce
SBP/DBP/HR/PS reactivity; and (v) the PA intervention (TGT) would speed post-stress
recovery.
3.2 Ethical Approval
The study proposal was submitted to the Faculty of Science and Engineering Research
Ethics and Governance Committee (FREGC) at the University of Brighton for review.
Approval was granted on 1st June 2011 (see appendix A).

53
3.3 Methods
3.3.1 Study Design
This was a randomised single blind control study and was conducted in the Clinical
Research Laboratories in the School of Pharmacy and Biomolecular Sciences at the
University of Brighton. Participants were randomly allocated to one of four independent
groups; (i) no stress: neutral (ii) no stress: three good things (TGT) (iii) stress: neutral
and (iv) stress: TGT. Although the researcher was aware of whether individuals were
randomised to the stress or no stress tasks, she was blinded to the tasks designed to alter
PA or control. This ensured that none of the researcher’s beliefs or expectations about
the exercise would affect the results. An independent person arranged appropriate
packs that corresponded to the different conditions. They were in charge of
randomising which condition participants were allocated to. They also blinded the packs
that were given to the participants by the researcher. If any participant required further
information about the exercise, the researcher explained both exercises to them again.
At the end of the study the researcher was given access to the study codes for analysis.
Stress Tasks
Participants in the stress groups were asked to complete two behavioural tasks [173]
.
Participants were asked to prepare a speech defending themselves in a role play
accusation. These were randomly assigned to one of the following (threat of
unemployment, a shop lifting accusation, or an incident involving a close relative living
in a nursing home). They were given two minutes preparation time and then were
instructed to talk about the situation for a further 3 minutes in front of a video camera
(in reality the camera did not record volunteers performance, but participants were not
informed of this until debriefing at the end of the study).
The second task involved a mirror tracing exercise whereby participants were asked to
trace a star that could only be seen in a mirror using a metal stylus. If the participant
traced outside the star, a loud beep was emitted indicating a mistake. An element of
competition was also included whereby participants were told that their score would be
marked against other participants. In addition, on their second visit, they were asked to

54
try to beat their first visit personal score. These tasks have previously been shown to
elicit a stress response [20, 46, 173]
.
No Stress Tasks
Participants in the no stress groups were asked to read an academic journal for 5
minutes [47]
. The second task also involved a mirror tracing exercise, however,
participants were asked to trace the star with a metal stylus without the mirror or shield
present and there was no element of competition.
Sample Size
The sample size was based on a power analysis for an effect size of 0.30 where n = 48
with repeated measures gives power (1-beta err prob) of 0.93 (Gpower v 3.1).
3.3.2 Participants
People were considered eligible for inclusion in this study if they fulfilled all of the
following criteria, (i) gave written informed consent to take part in the study (ii) had a
BMI between 18.5 and 29.9 (iii) were aged between 18 and 40 years and (iv) had the
ability to read and write English fluently. Volunteers were excluded from the study if
they were a current smoker, were diagnosed with any heart related problems, were on
medication or were receiving any treatment for mental health problems. Furthermore,
females who were pregnant or breastfeeding, or who thought they may be pregnant were
excluded. All data were regarded as confidential. Participant’s age and randomly
assigned experimental number were used as identification and no individual data was
reproduced.

55
3.3.3 Measures
Predictor
The PANAS was used to measure PA. Two timeframes were used for the purpose of
this study. At visit one, the timeframe used was “generally” and for visit two the
timeframe used was “during the past week” (see section 2.1.1).
Cardiovascular Measures
The primary measures which were taken using a validated blood pressure monitor (see
section 2.4.1) were systolic blood pressure, (SBP) diastolic blood pressure (DBP), heart
rate (HR) and perceived stress (PS) whereby participants were asked to rate how
stressed they were feeling. These measures were taken at baseline, during (on tasks)
and after the tasks (post tasks). The on task reading for SBP, DBP, HR and PS was
calculated by averaging the scores that were obtained from the two stress tasks or two
no stress tasks.
From these CV measures, CV reactivity and recovery were calculated and these served
as the main outcome measures. To measure reactivity, the difference between the on
task reading and the baseline reading was calculated, with a higher positive value
indicating greater reactivity. To measure recovery, the difference between the post task
reading and the on tasks reading was calculated, a higher positive score indicated better
recovery.
Demographic Factors
Participants were asked to report their age, gender, ethnic background and education.
Participants’ weight and height were measured from which BMI was calculated (see
section 2.4.2)
Psychosocial Factors
Participants were asked to complete the following validated questionnaires: the PSS and
CD-RISC which were used to measure perceived stress and resilience respectively.
These validated questionnaires have been used extensively in other research areas and
were chosen for their demonstrated reliability and validity (see section 2.1.2 and 2.3.1).

56
3.3.4 Procedure
On arrival at the laboratory at visit one, participants height and weight were measured
and then they were asked to complete three questionnaires (PANAS, PSS and CD-
RISC-10). The blood pressure monitor was then attached to the non-dominant hand of
the participant. Participants were instructed to sit quietly and after 10 minutes, three BP
and HR readings were taken and then averaged to represent baseline levels. Participants
were asked to report on a scale of 1- 7 how stressed they felt at that moment in time (1
indicating not stressful at all and 7 indicating very stressed)
Participants were then randomly assigned to either complete two stress tasks or two no
stress tasks (see section 3.3.1). The duration of each task was 5 minutes and BP and HR
readings were recorded at 3 minutes for each task. After each task participants were
asked to report on a scale of 1- 7 how stressed they felt (1 indicating not stressful at all
and 7 indicating very stressed)
After completing the second task, participants were then instructed to sit quietly for 10
minutes. BP and HR readings were taken at 5 minutes and again at 10 minutes.
Participants were then asked again to report on a scale of 1- 7 how stressed they felt (1
indicating not stressful at all and 7 indicating very stressed)
At the end of visit one, the participant’s were given a sealed envelope containing either
the PA intervention or the control exercise. Participants were instructed to complete the
written task and to come back after 7 days to complete visit two.
The laboratory procedure completed by participants at visit one was repeated at visit
two. At the end of the study participants were fully debriefed about the study. The
procedure is summarised in Figure 3.1.

57
Figure 3.1 Flow diagram illustrating order of events for visit one and visit two. TGT = Three Good Things

58
3.4 Data Analysis
The statistical software used for all analysis was PASW Statistics 18. Normality tests
were performed using the Kolmogorov-Smirnov and Normal Q-Q plots. Non-
parametric tests were used if variables did not show normality after transformation.
Data analysis was conducted in three steps; first descriptive statistics were calculated for
all measures across the four independent groups (i) no stress: neutral group (ii) no
stress: three good things (TGT) group (iii) stress: neutral and (iv) stress: TGT.
Then a series of ANOVA’s were conducted on these measures to assess if there were
any differences between the four independent groups in baseline BP, HR, PA, NA,
Resilience and Perceived Stress Scale). Where differences were found, the scores were
included as covariates in the subsequent analysis.
Finally, a series of mixed ANCOVA’s were conducted to assess the impact of the
positive affect intervention (TGT vs. neutral group) and the stress manipulation (stress
vs. no stress) on (i) PA scores (ii) NA scores, (iii) reactivity to tasks for SBP, DBP, HR,
PS and (iv) recovery from tasks for SBP, DBP, HR and PS across the two visit time-
points (visit one vs. visit two) while controlling for any significant covariates and NA1.
Furthermore, to analyse recovery data, the mean reactivity score at visit two was
included as a covariate if there was a main effect of reactivity at visit one. For all
outcomes a p-value < .05 was considered to be statistically significant.
1 NA was be used as a covariate regardless of whether or not there was a difference at baseline; this is
because we wanted to investigate PA independent of NA and to show that PA is not the bipolar opposite
of NA when measured by PANAS.

59
3.5 Results
3.5.1 Sample Characteristics
The number of individuals who completed the study was 48 of whom 60% were female
and the mean age was 22 years (SD = 4.52). All of the participants had either a college
or university degree and 59% of individuals were white/white British.
Table 3.1 shows the differences in demographics, PA, NA, PSS and CD-RISC scores
across the four groups at visit one. Significant differences were found in age (F (3, 44)
= 4.74, p = .006) and years of education (F (3, 44) = 3.77, p = .017). Post-hoc
comparisons indicated that the mean scores for participants in the no stress: neutral
group were significantly older than individuals in the (i) stress: control group and (ii)
stress: TGT group. In addition, Post-hoc comparisons also indicated that the mean
scores for participants in the no stress: neutral group had significantly higher number of
years of education than individuals in the stress: control group. Age, education and NA
will therefore be used as covariates in any subsequent analysis.
Table 3.1 Comparison of four randomised groups (i) no stress: neutral group (ii)
no stress: three good things (TGT) group (iii) stress: neutral and (iv) stress: TGT.
Mean scores (standard deviation).
No stress:
neutral
No stress:
TGT
Stress:
neutral
Stress: TGT p
value
Age (years) 25.08 (6.16) 23.08 (4.87) 19.67 (1.56) 20.17 (1.34) .006
Education
(years)
11.79 (3.39) 10.58 (2.68) 8.58 (1.44) 9.42 (2.02) .017
BMI 23.91 (3.57) 22.11 (3.59) 22.65 (2.48) 23.83 (2.60) .411
PA 3.67 (.50) 3.63 (.52) 3.48 (.53) 3.58 (.48) .813
NA 1.81 (.39) 1.79 (.65) 2.00 (.45) 1.68 (.57) .522
PSS 2.28 (.30) 2.03 (.31) 1.95 (.42) 2.15 (.36) .130
CD-RISC 3.10 (.51) 3.05 (.42) 3.00 (.34) 2.98 (.45) .899
BMI: Body Mass Index. PA: Positive Affect. NA: Negative Affect: PSS: Perceived Stress scale. CD-
RISC: Connor Davidson Resilience Scale-10.

60
3.5.2 Positive Affect Intervention
Positive Affect
Figure 3.2 shows the mean positive affect scores at visit one and visit two independent
of age and number of years of education. There was no significant main effect of visit
(F (1, 42) = .29, p = .591, partial eta squared .01) indicating that PA scores were
generally the same after the one week interval. The main effect of the stress
manipulation was also not significant, (F (1, 42) = .93, p = .927, partial eta squared <
.001), indicating no difference in PA scores between the stress task and no stress task
groups. The main effect of the PA intervention, however, was significant, (F (1, 42) =
5.39, p = .025, partial eta squared = .11), indicating that higher PA scores were observed
in the intervention group (TGT mean = 3.63, SE = .10; neutral group mean = 3.30, SE =
.10).
Importantly, there was a significant interaction between the PA intervention and visit,
(F (1, 42) = 13.81, p = .001, partial eta squared .25) indicating that PA scores decreased
at visit two for the control group (visit one mean = 3.56 SE = .10; visit two mean = 3.03
SE = .13) but not for the intervention group (visit one mean = 3.61, SE = .10; visit two
mean = 3.64, SE = .13). There was no significant interaction between the stress
manipulation and visit (F (1, 42) = .006, p = .520, partial eta squared = .01) indicating
that PA scores decreased at visit two for both the stress task and the no stress task.
There was no significant interaction between the stress task, PA intervention and visit
(F (1, 45) = .006, p = .940, partial eta squared < .001) indicating that the decrease in PA
scores for the control intervention was the same for both the stress and the no stress
group. The results therefore showed that the TGT intervention prevented the decline in
PA that occurred in the control groups, regardless of whether or not participants were in
the stress/no stress groups. For this reason Hypothesis 1 cannot be supported: the TGT
exercise did not show an increase in PA.

61
Visit 1 Visit 21
2
3
4
5
No Stress:Neutral
No Stress:TGT
Stress:Neutral
Stress:TGT
*
Visit
Po
sit
ive A
ffect
Sco
re
Figure 3.2 Mean positive affect scores at visit one and visit two in participants
randomised to either (i) no stress: neutral group (ii) no stress: three good things
(TGT) group (iii) stress: neutral and (iv) stress: TGT.
Error bars represent standard error of mean; adjusted for age and years of education. N
= 12 per group. *p < .05
Negative Affect
Figure 3.3 shows the mean NA scores at visit one and visit two independent of age and
number of years of education. The main effect of the PA intervention was not
significant, (F (1, 42) = 1.78, p = .189, partial eta squared = .04), indicating no
differences in NA scores between the TGT groups and the control group. The main
effect of the stress manipulation was also not significant, (F (1, 42) = 2.49, p = .123,
partial eta squared = .06), indicating no differences in NA scores between the stress task
and the no stress task. There was also no significant main effect of visit (F (1, 42) =
.23, p = .635, partial eta squared = .01), indicating that NA scores were generally the
same after the one week interval.

62
There was no significant interaction between the PA intervention and visit, (F (1, 42) <
.001, p = .996, partial eta squared < .001), indicating that the lack of change in NA
scores was similar in both the control group and the intervention group. There was no
significant interaction between the stress manipulation and visit (F (1, 42) = 1.28, p =
.264, partial eta squared = .03) indicating that the lack of change in NA scores was
similar for participants in the stress task and the no stress task groups.
There was no significant interaction between the stress tasks, PA intervention and visit
F (1, 42) = .01, p = .815, partial eta squared = .001 indicating that the lack of change
between the two visits is the same amongst the four groups (see Figure 3.3).
The results therefore indicate that the TGT intervention did not influence NA scores,
regardless of whether or not participants were in the stress/no stress groups. This
therefore supports Hypothesis 2; the PA intervention did not change NA.
Visit 1 Visit 21
2
3
4
5
No Stress:Neutral
No Stress:TGT
Stress:Neutral
Stress:TGT
Visit
Neg
ati
ve A
ffect
Sco
re
Figure 3.3 Mean negative affect scores at visit one and visit two in participants
randomised to either of the following groups (i) no stress: neutral (ii) no stress:
three good things (TGT) (iii) stress: neutral or (iv) stress: TGT.
Error bars represent standard error of mean; adjusted for age and years of education. N
= 12 per group.

63
3.5.3 Cardiovascular and Perceived Stress Responses
Systolic Blood Pressure Reactivity
Figure 3.4 shows the systolic blood pressure (SBP) reactivity scores at visit one and
visit two independent of age, years of education and NA. The main effect of the PA
intervention was not significant (F (1, 41) = .64, p = .428), indicating no differences in
SBP reactivity between the TGT group and the control group. As expected there was a
significant main effect of the stress manipulation (F (1, 41) = 66.54, p < .001, partial eta
squared = .62), indicating that SBP reactivity to tasks was higher in the stress group
compared to the no stress group. There was a significant main effect of visit on SBP
reactivity (F (1, 41) = 5.21, p = .028, partial eta squared = .11) indicating a decrease in
SBP reactivity scores after the one week interval (visit one mean = 10.94 SE = .88; visit
two mean = 7.74 SE 1.01).
There was no significant interaction between the PA intervention and visit (F (1, 41) =
1.01, p = .322), indicating that change in SBP reactivity scores was similar in both the
control group and intervention group. There was no significant interaction between the
stress manipulation and visit (F (1, 41) = .39, p = .537), indicating that the change in
SBP reactivity was similar for participants in the stress group and the no stress group.
There was no overall interaction between stress task, PA intervention and visit (F (1,
41) = .36, p = .550), indicating the pattern of change between the two visits was the
same amongst the four groups (see Figure 3.4).

64
Visit 1 Visit 2
-10
0
10
20
30
No Stress:Neutral
No Stress:TGT
Stress:Neutral
Stress:TGT
Visit
SB
P R
eacti
vit
y (m
mH
g)
Figure 3.4 Systolic Blood Pressure (SBP) reactivity to tasks for participants at visit
one and visit two across the four groups (i) no stress: neutral group (ii) no stress:
three good things (TGT) group (iii) stress: neutral and (iv) stress: TGT.
Error bars represent standard error of mean; adjusted for age, years of education and
negative affect. N = 12 per group.
Systolic Blood Pressure Recovery
Figure 3.5 shows SBP recovery scores at visit one and visit two independent of mean
reactivity scores at visit two, age, years of education and NA. The main effect of the
PA intervention reached near significance (F (1, 40) = 3.75, p = .060), suggesting that
there might be a trend in SBP recovery scores between the TGT group and the control
group. There was no significant main effect of the stress manipulation (F (1, 40) =
1.83, p = .183), however there was a significant interaction between the stress
manipulation and exercise such that individuals in the TGT group had reduced recovery
but not for the control group (F (1, 40) = 5.75, p = .021). There was no significant main
effect of visit on SBP recovery (F (1, 40) = 1.63, p = .210), indicating that SBP
recovery scores were generally the same after the one week interval.
There was a significant interaction between the PA intervention and visit (F (1, 40) =
8.34, p = .006, partial eta squared = .18), indicating slower recovery at visit 2 compared

65
to visit one for the TGT group (visit 1 mean = 13.03, SE = 1.22; visit 2 mean = 6.91, SE
= 1.32) but not for the control group (visit 1 mean = 7.55, SE = 1.58; visit 2 mean =
7.11, SE = .73). There was a significant interaction between the stress manipulation and
visit (F (1, 40) = 8.47, p = .006, partial eta squared = .18), indicating that recovery was
similar between visit one and visit two for the no stress group (visit one mean = 7.37,
SE = 1.64; visit two mean = 7.94, SE = .98) but not for individuals in the stress group
(visit 1 mean = 13.96, SE = 1.64; visit 2 mean = 6.25, SE = .98).
There was no overall interaction between stress task, PA intervention and visit (F (1,
40) = 2.31, p = .14), indicating the pattern of change between the two visits was the
same amongst the four groups (see Figure 3.5).
Visit 1 Visit 2
0
10
20
30
No Stress:Neutral
No Stress:TGT
Stress:Neutral
Stress:TGT
Visit
SB
P R
eco
ve
ry (
mm
Hg
)
Figure 3.5 Systolic Blood Pressure (SBP) recovery from tasks for participants at
visit one and visit two across the four groups (i) no stress: neutral group (ii) no
stress: three good things (TGT) group (iii) stress: neutral and (iv) stress: TGT.
Error bars represent standard error of mean; adjusted for mean reactivity scores at visit
two, age, years of education and negative affect. A higher score indicates a faster
recovery. N = 12 per group.

66
In summary, the results in relation to SBP reactivity showed that individuals who
completed the stress tasks had heightened SBP, regardless of whether or not participants
were in the TGT/control groups. Therefore this supports Hypothesis 3; the stress tasks
did indeed lead to heightened SBP reactivity compared to the individuals completing the
no stress tasks. In addition, individuals in the TGT groups had higher levels of PA
compared to the control group at visit two (see Figure 3.2). However, Hypothesis 4
could not be supported; the TGT groups showed no additional reduction in SBP
reactivity after the one week interval.
The results showed that individuals in the TGT group had reduced SBP recovery at visit
two compared to visit one. For this reason, Hypothesis 5 could not be supported, since
it was predicted that the Stress: TGT group would have increased post stress recovery
after the intervention.
Diastolic Blood Pressure Reactivity
Figure 3.6 shows the diastolic blood pressure (DBP) reactivity scores at visit one and
visit two independent of age, years of education and NA. The main effect of the PA
intervention was not significant (F (1, 41) = < .001, p = .967), indicating no differences
in DBP reactivity between the TGT group and the control group. Unsurprisingly, there
was a significant main effect of the stress manipulation (F (1, 41) = 60.53, p < .001,
partial eta squared = .60) indicating that DBP reactivity to tasks was higher in the stress
group compared to the no stress group. There was no significant main effect of visit on
DBP reactivity (F (1, 41) = .06, p = .806) indicating no changes in DBP reactivity after
the one week interval.
The interaction between visit and the PA intervention was not significant (F (1, 41) =
.03, p = .869), such that the lack of change in DBP reactivity was similar in both the
control groups and intervention groups. The interaction between visit and the stress
manipulation was also not significant (F (1, 41) = .28, p = .597), indicating that the lack
of change in DBP reactivity between visit one and visit two was the same for the stress
groups as the no stress groups.

67
There was no interaction between stress task, PA intervention and visit (F (1, 41) = .01,
p = .910), indicating the pattern of change between the two visits was the same amongst
the four groups (see Figure 5.6).
Visit 1 Visit 2
-5
0
5
10
15
20
No Stress:Neutral
No Stress:TGT
Stress:Neutral
Stress:TGT
Visit
DB
P R
eacti
vit
y (m
mH
g)
Figure 3.6 Diastolic Blood Pressure (DBP) reactivity to tasks for participants at
visit one and visit two across the four groups (i) no stress: neutral group (ii) no
stress: three good things (TGT) group (iii) stress: neutral and (iv) stress: TGT.
Error bars represent standard error of mean; adjusted for age, years of education and
negative affect. N = 12 per group.

68
Diastolic Blood Pressure Recovery
Figure 3.7 shows DBP recovery scores at visit one and visit two after adjusting for age,
years of education and NA. There was no significant main effect of the PA intervention
(F (1, 41) = .29, p = .591), indicating no differences in DBP recovery scores between
the TGT group and the control group. There was, however, a significant main effect of
the stress manipulation (F (1, 41) = 46.89, p <.001, partial eta squared = .53), indicating
that DBP recovery values were larger in the stress group compared to the no stress
group. This difference is not surprising as there was a main effect of the stress
manipulation for reactivity and therefore individuals in the no stress groups had less to
recover from. The main effect of visit on DBP recovery scores was not significant (F
(1, 41) = 2.44 p = .126) such that there were no differences in recovery scores between
visit one and visit two.
There was no significant interaction between the PA intervention and visit (F (1, 41) =
.15, p = .704), indicating that the lack of change in DBP recovery scores between visit
one and visit two was similar in both the control group and intervention group. There
was no significant interaction between the stress tasks and visit (F (1, 41) = .02, p =
.890) indicating that the lack of change in DBP recovery scores was similar for
participants in the stress groups and the no stress groups.
There was no interaction between stress task, PA intervention and visit (F (1, 41) =
1.35, p = .252), indicating the pattern of change between the two visits was the same
amongst the four groups (see Figure 3.7).

69
Visit 1 Visit 2
-5
0
5
10
15
20
No Stress:Neutral
No Stress:TGT
Stress:Neutral
Stress:TGT
Visit
DB
P R
eco
ve
ry (
mm
Hg
)
Figure 3.7 Diastolic Blood Pressure (DBP) recovery from tasks for participants at
visit one and visit two across the four groups (i) no stress: neutral group (ii) no
stress: three good things (TGT) group (iii) stress: neutral and (iv) stress: TGT.
Error bars represent standard error of mean; adjusted for baseline DBP, age, years of
education and negative affect. N = 12 per group.
In summary, the results in relation to DBP showed that individuals who completed the
stress tasks had heightened DBP reactivity, regardless of whether or not participants
were in the TGT/control groups. Therefore this supports Hypothesis 3, the stress tasks
did indeed lead to heightened DBP reactivity compared to the individuals completing
the no stress tasks.
As mentioned before, individuals in the TGT groups had higher levels of PA compared
to the control group at visit two (see Figure 3.2). Despite this, the results showed that
there was no reduction in DBP reactivity. For this reason, Hypothesis 4 could not be
supported, given that the TGT groups showed no reduction in DBP reactivity after the
one week interval.
The results showed that PA intervention did not alter recovery from stress. For this
reason, Hypothesis 5 could not be supported; given that the Stress: TGT group did not
have improved post stress recovery after the one week interval.

70
Heart Rate Reactivity
Figure 3.8 shows heart rate (HR) reactivity scores at visit one and visit two, after
adjusting for age, years of education and NA. The main effect of the PA intervention
was not significant (F (1, 41) = .20, p = .654), indicating no differences in HR reactivity
between the TGT group and the control group. There was a significant main effect of
the stress manipulation (F (1, 41) = 16.17, p < .001, partial eta squared = .28), indicating
that HR reactivity to tasks was higher in the stress group compared to the no stress
group. There was no main effect of visit on HR reactivity scores (F (1, 41) = 1.17 p =
.286) indicating that there was no change in HR reactivity scores at visit one and visit
two.
The interaction between visit and the PA intervention was not significant (F (1, 41) = <
.001, p = .986), such that the lack of change in HR reactivity was similar in both the
control group and intervention group. The interaction between visit and the stress
manipulation was also not significant (F (1, 41) = 1.41, p = .242), indicating that the
lack of change in HR reactivity between visit one and visit two was the same for the
stress groups and the no stress groups.
There was no interaction between stress task, PA intervention and visit (F (1, 41) = .04,
p = .848), indicating the pattern of change between the two visits was the same for the
four groups (see Figure 3.8).

71
Visit 1 Visit 2
-5
0
5
10
15
No Stress:Neutral
No Stress:TGT
Stress:Neutral
Stress:TGT
Visit
HR
Re
acti
vit
y (b
pm
)
Figure 3.8 Heart Rate (HR) reactivity to tasks for participants at visit one and visit
two across the four groups (i) no stress: neutral group (ii) no stress: three good
things (TGT) group (iii) stress: neutral and (iv) stress: TGT.
Error bars represent standard error of mean; adjusted for baseline HR, age, years of
education and negative affect. N = 12 per group.
Heart Rate Recovery
Figure 3.9 shows HR recovery scores at visit one and visit two after adjusting for age,
years of education and NA. There was no significant main effect of the PA intervention
(F (1, 41) = .09, p = .771), indicating no differences in HR recovery scores between the
TGT groups and the control groups. There was a significant main effect of the stress
manipulation (F (1, 41) = 10.19, p = .003, partial eta squared = .20), indicating that HR
recovery values were larger in the stress group. This difference is not surprising as
there was a main effect of the stress manipulation for HR reactivity and therefore
individuals in the stress group would have needed to recover more. There was no
significant main effect of visit in HR recovery (F (1, 41) = .18, p = .673), indicating that
HR recovery scores were generally the same after the one week interval.

72
There was no significant interaction between the PA intervention and visit (F (1, 41) =
.23, p = .636), indicating that the lack of change in HR recovery scores between visit
one and visit two was similar in both the control group and intervention group. The
interaction between visit and the stress manipulation was also not significant F (1, 41) =
.37, p = .546), indicating that the lack of change in HR recovery scores was similar for
participants in the stress group and the no stress group.
There was no interaction between stress task, PA intervention and visit (F (1, 41) = .34,
p = .562), indicating the pattern of change between the two visits was the same amongst
the four groups (see Figure 3.9).
Visit 1 Visit 20
5
10
15
No Stress:Neutral
No Stress:TGT
Stress:Neutral
Stress:TGT
Visit
HR
Re
co
ve
ry (
bp
m)
Figure 3.9 Heart Rate (HR) recovery from tasks for participants at visit one and
visit two across the four groups (i) no stress: neutral group (ii) no stress: three
good things (TGT) group (iii) stress: neutral and (iv) stress: TGT.
Error bars represent standard error of mean; adjusted for baseline HR, age, years of
education and negative affect. N = 12 per group.

73
In summary, the results in relation to HR showed that individuals who completed the
stress tasks had heightened HR, regardless of whether or not participants were in the
TGT/control groups. Therefore this supports Hypothesis 3, the stress tasks did indeed
lead to heightened HR reactivity compared to the individuals completing the no stress
tasks.
As mentioned before, individuals in the TGT groups had higher levels of PA compared
to the control group at visit two (see Figure 3.2). Despite this, the results showed that
individuals across all four groups did not show a reduction in HR reactivity. For this
reason, Hypothesis 4 could not be supported; the TGT groups showed no reduction in
HR reactivity after the one week interval.
Similar to other measures, HR data provided no evidence of faster recovery after the PA
intervention. Hypothesis 5 could not be supported, given that the TGT groups did not
show improved post stress recovery after the one week interval.
Perceived Stress Reactivity
Figure 3.10 shows how individuals perceived the stressfulness of the task (PS) at visit
one and two after adjusting for age, years of education and NA. There was no
significant main effect of the PA intervention (F (1, 41) = .66, p = .420), indicating that
there was no difference between the TGT group and the control group in how stressful
the task was perceived to be. There was a significant main effect of the stress
manipulation (F (1, 41) = 33.08, p < .001, partial eta squared = .45), indicating that the
stress tasks more were more perceived as such. There was no significant main effect of
visit in PS sores (F (1, 41) = 2.64, p = .112), indicating that there was no change in the
perceived stressfulness of the tasks after the one week interval.
There was no significant interaction between the PA intervention and visit (F (1, 41) =
.06, p = .817), indicating that the lack of change in which individuals perceived the
stressfulness of the tasks between visit one and visit two was similar in both the control
group and intervention group. The interaction between visit and the stress manipulation
was also not significant F (1, 41) = 3.22, p = .080), indicating that the lack of change in

74
which individuals perceived the stressfulness of the tasks was similar for participants in
the stress group and the no stress group.
There was no interaction between stress tasks, PA intervention and visit (F (1, 41) = .76,
p = .388), indicating the pattern of change between the two visits was the same for the
four groups (see Figure 3.10).
Visit 1 Visit 2-1
0
1
2
3
No Stress:Neutral
No Stress:TGT
Stress:Neutral
Stress:TGT
Visit
Pe
rce
ive
d S
tre
ss R
eacti
vit
y
Figure 3.10 Perceived stress (PS) scores (reactivity) from tasks for participants at
visit one and visit two across the four groups (i) no stress: neutral group (ii) no
stress: three good things (TGT) group (iii) stress: neutral and (iv) stress: TGT.
Error bars represent standard error of mean; adjusted for age, years of education and
negative affect. N = 12 per group

75
Perceived Stress Recovery
Figure 3.11 shows the recovery scores of perceived stress at visit one and visit two after
adjusting for age, years of education and NA. There was no significant main effect of
the PA intervention (F (1, 41) < .001, p < .971), indicating that there was no difference
between the TGT group and the control group in recovery from the perceived
stressfulness of the tasks. There was a significant main effect of the stress manipulation
(F (1, 41) = 30.12, p < .001, partial eta squared = .42), indicating that recovery scores
were greater in the stress group compared to the no stress group. This difference is not
surprising as there was a main effect of the stress manipulation for how individuals
perceived the stressfulness of the tasks and therefore individuals in the stress tasks
would have needed to recover more in the stress tasks. There was no main effect of
visit in PS recovery sores (F (1, 41) = 2.52, p = .120) indicating that there was no
change across time.
There was no significant interaction between the PA intervention and visit (F (1, 41) =
.31, p = .580), indicating that the lack of change in recovery between visit one and visit
two was similar in both the control group and intervention group. The interaction
between visit and the stress manipulation was also not significant F (1, 41) = .99, p =
.326), indicating that the lack of change in which individuals recovered from their
perceived stressfulness of the tasks was similar for participants in the stress group and
the no stress group.
There was no interaction between stress task, PA intervention and visit (F (1, 41) <
.001, p = .976), indicating the pattern of change between the two visits was the same
amongst the four groups (see Figure 3.11).

76
Visit 1 Visit 2
-1
0
1
2
3
4
No Stress:Neutral
No Stress:TGT
Stress:Neutral
Stress:TGT
Visit
Pe
rce
ive
d S
tre
ss R
eco
ve
ry
Figure 3.11 Perceived stress (PS) scores (recovery) from tasks for participants at
visit one and visit two across the four groups (i) no stress: neutral group (ii) no
stress: three good things (TGT) group (iii) stress: neutral and (iv) stress: TGT.
Error bars represent standard error of mean; adjusted for age, years of education and
negative affect. N = 12 per group
In summary, the results in relation to how individuals perceived the stressfulness of the
tasks showed that participants who completed the stress tasks perceived the tasks as
more stressful, regardless of whether or not they were in the TGT/control groups.
Therefore this supports Hypothesis 3; the stress tasks did indeed lead to greater
perceived stress.
Despite the higher levels of PA in the TGT groups at visit two (see Figure 3.2) there
were no reductions in how stressful tasks were perceived . For this reason, Hypothesis
4 could not be supported, the TGT groups showed no additional reduction in PS
reactivity after the one week interval.
The results also indicated that PA was not linked to post stress recovery. For this
reason, Hypothesis 5 could not be supported.

77
3.6 Discussion
A number of studies have investigated the association between PA and CV reactivity
and recovery in healthy samples [9, 20, 24, 48, 174]
. However, our study contributes to the
existing literature by designing an experimental study to investigate the effects of a PA
intervention on CV reactivity and recovery. This study had three key objectives: to
investigate if the TGT exercise would increase PA independent of NA, to carry out a
controlled study with an effective stress manipulation and to extend the research from
cross-sectional studies suggesting that PA is associated with better CV reactivity and
recovery in response to mental stress.
The present study found that the PA intervention did not increase PA levels over the one
week time-frame. Interestingly, however the PA intervention was able to maintain PA
levels compared to the control group where PA levels significantly decreased. The
study also found that the tasks used were able to elicit a clear stress response as
measured by SBP/DBP/HR/PS parameters. No changes were observed in DBP/HR
reactivity and DBP/HR recovery between the two visits. Differences were observed
however in SBP reactivity over the two visits, but were not dependent on the PA
intervention. SBP recovery was slower for individuals in the PA intervention group
following the one week interval. No changes were found in how individuals perceived
the stressfulness of the tasks between the two visits.
There are several reasons that might explain the lack of effect of the PA intervention.
Firstly, the relatively high levels of PA seen in participants. Based on the high levels of
PA found across the four groups at baseline, the results might indicate a “ceiling effect”
where the scores are so high on the scale that there is little room for improvement. The
consequence of the lack of effect meant that we could not investigate the causal link
between PA and CV reactivity and recovery. Nevertheless, the results from the current
study did give us the ability to compare different levels of PA that represented high and
low PA (3.04 v 3.64) respectively at visit two. It is worth pointing out however, when
Steptoe et al [46]
compared high and low PA using a median split, what might have been
considered as low PA for our study was categorised as the high PA group in their study
(Median high PA > 2.55).

78
The alternative explanation is that our study recruited healthy volunteers, however, the
TGT intervention that was originally developed by Seligman et al [57]
was completed by
individuals who were already mild to moderately depressed at baseline. This supports
the findings of Sin and Lyumburksy who found that PA interventions are more effective
in increasing well-being in people who exhibit depressive symptoms [3]
.
Another possibility is that the intervention required more time. In previous research the
TGT showed most effect after one month. However participants were only instructed to
do the intervention for one week to show an effect which did show an increase in
happiness after the one week [57]
.
Alternatively, it could be because we used a different instrument to measure PA.
Seligman et al used the Steen Happiness Index (SHI) to measure happiness which is
considered to be extremely sensitive to changes in happiness [57, 175]
, however, it can be
argued that this is only because it measures happiness using a scale that ranges from
extreme sadness to neutral to extreme happiness [14]
. In comparison we used the
PANAS, where the response format ranges from not at all to extremely, and does not
include a neutral point therefore addressing the issue of bipolarity.
Despite PA scores not changing in the PA intervention group after the one week
interval, they significantly decreased in the control group. It could be argued that
during the intervening week, the control group experienced something stressful and that
is what bought a decline in PA for the control group but not the intervention group.
However, this is unlikely since participants were randomly allocated to groups, plus
there were no differences in scores for perceived stress and NA using validated
questionnaires at visit one or visit two.
The findings that the stress tasks were associated with increased SBP/DBP/HR/PS were
expected. Although, laboratory mental stress tasks have been shown to elicit a stress
response, previous studies have not always incorporated a control group to statistically
ensure that the stress manipulation was effective [20, 28]
. By including an appropriate
control group, this study (i) demonstrated that the tasks used did indeed produce a clear
stress response and (ii) enabled determination of any specific interactions with a

79
stressor, rather than non-specific changes in CV parameters, or change just due to
habituation to the stressor.
It was anticipated that at visit two, participants who had higher PA would be more
resilient to the stress tasks and as a result their reactivity would be lower. The present
study found no interaction between stress task, PA intervention and visit for
SBP/DBP/HR/PS reactivity such that the pattern of change between the four groups was
generally the same after the one week interval. The only main effect of visit was for
SBP reactivity, whereby there was a decrease in reactivity sores at visit two but this was
not dependent on the PA intervention. It is possible that the lower reactivity score was
because individuals knew what to expect. Although we did try to address this issue by
giving the individuals different tasks/or an additional element to complete at visit two,
the procedure did not differ.
One possibility is that the tasks used in the present study were inherently less stressful
than those used in both previous studies. The average reactivity to the stress task for the
present study was 17.24mmHg and 15.59mmHg at visit 1 and 20.95mmHg and
15.52mmHg at visit 2 for SBP and DBP respectively. Although this was significantly
greater than the control group, in comparison to other studies it was relatively low. For
instance, Steptoe et al reported reactivity of 30mmHg for SBP and 20.7mmHg DBP and
Dowd et al reported 26.72mmHg for SBP and 25.75mmHg for DBP. However, we
followed the protocols of the experimental tasks used in both studies. An alternative
explanation is that the participants found that the tasks less stressful. Indeed, the stress-
buffering model would predict that with higher levels of PA observed in our sample, we
might expect to find less reactivity to the stressor across the sample. That we cannot
detect a relationship between PA and reactivity might be due to ‘floor effects’ where all
participants are relatively resilient to the stressor.
The present study found that PA was not associated with better recovery for DBP, HR
or PS. Our finding does support other studies that have not found any association
between PA and BP or HR recovery [24, 48]
. However there was an interaction between
the intervention and visit for SBP recovery such that individuals had slower recovery at
visit two compared to visit one in the PA intervention group but not in the control

80
group. Participants in the PA intervention group recovered less quickly following the
stressor than participants who did not have the intervention. This contradicts previous
research that has shown individuals high in PA to recover more quickly from a stressful
event. A possible explanation for the differences in recovery might be that high PA
individuals were more engaged at visit two and saw the tasks as a challenge as opposed
to a threat, they were still reacting even though they were in the recovery period. Some
might argue that this might be an indication of rumination; however, with the high
levels of PA seen in this study, Frederickson’s broaden and build theory [54]
suggests
that positive emotions such as joy and excitement have the ability to broaden a person’s
thinking and as a result this would build resources such as positive psychosocial factors
like the ones described above as well as overcome challenges and develop new skills.
Furthermore, if individuals were dwelling on the stress experience, then there could
have been a difference in perceived stress recovery scores at the end of the study.
In contrast to the current study, previous studies have found a link between high PA and
SBP recovery [46, 47, 58]
while some have not found any associations [24, 176]
. Papousek et
al used the PANAS to investigate CV recovery [176]
and although reactivity scores were
much lower, they used a different method to elicit a stress response which could explain
the low reactivity scores in response to stress. The results of this study found that
higher PA as measured by the PANAS was associated with better diastolic BP recovery
but not systolic BP recovery [176]
.
The results of this study did replicate some of the findings from Steptoe et al [46]
who
investigated PA using both the PANAS and EMA. They found no links between PA (as
measured by PANAS) and (i) diastolic blood pressure and (ii) heart rate. The results of
this study do not support the stress-buffering model of PA. However it is likely that a
ceiling effect occurred and future studies should investigate individuals with lower PA
to optimise the efficacy of the intervention and establish its effect on CV reactivity and
recovery.

81
3.6.1 Limitations
The sample population was relatively young (22 years, SD = 4.52) and age might have
an impact on CV reactivity and recovery scores. For instance, Gasperin et al found that
people aged over 46 were twice as likely to have greater increases in blood pressure in
response to stress [177]
. In addition, all of the participants were under taking a university
degree or had completed one, and over half the population were white/white British,
therefore the results might not generalise to other groups.
Compliance with the written tasks was down to the individual and completed in their
own time and therefore it was not possible to measure if individuals actually did
complete the exercise. Individuals were asked if everything was ok in completing the
written tasks and in response, none of the participants reported having any problems.
However, this was based on self-report and therefore we can still not be certain. In an
effort to avoid on the Hawthorne effect [86]
, where people’s behaviour changes in
response to being monitored, objective measures of task completion were felt to be
inappropriate. Future studies, however could measure compliance to the exercise by
instructing individuals to complete it online.
BP and HR measurements were taken using a calibrated BP monitor; three
measurements were taken to represent baseline levels, however only one measurement
was taken during each task and then finally another three further readings were obtained
to measure recovery. Although they do represent reactivity and recovery, previous
studies have used a Finapres instrument to measure BP and HR; this instrument measure
BP and HR continuously [9, 24, 49]
which is advantage as once it is attached to the
individual, the researcher does not have to intervene during the experimental procedure.
3.7 Conclusion
This study was the first to use a PA intervention and investigate the effect on stress, CV
reactivity and recovery. Furthermore, it is also one of few studies that have used a
control group for the stressor. Although, the intervention prevented a decline in PA, it

82
did not alter CV stress responsivity. This might be because individuals who
participated had relatively high levels of PA making it difficult to detect the impact on
CV responsivity.
The present study recruited healthy volunteers; however, there is accumulating research
towards investigating PA in populations that have chronic conditions. One reason for
this is that dealing with the effects of any chronic condition can be stressful, and as
proposed by Pressman and Cohen [2]
, PA might dampen the effects of stress which can
lead to more favourable health measures.
This thesis intends to focus on diabetes. Diabetes is a stressful chronic condition and
therefore as proposed by Pressman and Cohen, PA might dampen the effects that stress
has on important diabetes related factors. At present, there is no evidence to confirm if
there is a relationship between PA (as measured by the PANAS) and diabetes outcomes
(as measured by HbA1c, self care practices and quality of life) independent of NA, and
secondly there are at present no studies that have investigated a PA intervention among
people with diabetes.
For the reasons stated above, the next two chapters will investigate the relationship
between PA and diabetes related outcomes in people with diabetes. This will determine
whether there is a link between PA and diabetes outcomes and also the efficacy of using
an intervention designed to increase PA in people with diabetes.

83
Chapter Four: A cross-sectional study to investigate
the relationship between positive affect and health
outcomes in people with diabetes mellitus
4.1 Introduction
Diabetes Mellitus is a complex condition that requires life-long management. Three
important diabetes related measures are HbA1c, self-care practices and quality of life.
This is because these outcomes are fundamental in preventing or reducing the onset of
complications [115, 157, 178]
.
Mood state can affect diabetes-related factors, however, the majority of published
studies have focused on negative affective states, such as depression [6, 179, 180]
and stress
[127], which have long been accepted as predictors of increased illness susceptibility and
mortality [26, 140]
. Despite a growing evidence base for PA being an independent
predictor of health-outcomes in other chronic conditions, there has been very little
research to date to explore the relationships between PA and health-outcomes in people
with diabetes.
Depression has been linked to poor glycaemic control as well as adherence to treatment
regimes [6, 179, 180]
. Gonzalez et al [93]
conducted a meta analysis to examine the
relationship between depression and treatment non adherence in individuals with type 1
and type 2 diabetes. Higher baseline levels of depressive symptoms were significantly
linked to non-adherence to medication in people with type 2 diabetes. Non-adherence
to self-care practices such as medication, blood glucose monitoring, diet and exercise
can affect physiological parameters such as HbA1c [181]
, blood pressure and cholesterol
levels [181]
. Depression has also been shown to affect quality of life and studies have
generally shown that people living with diabetes have a poorer quality of life compared
to healthy individuals [139, 159, 182]
. This is perhaps because diabetes can often be
burdensome and potentially impact multiple outcomes, all of which can lead to
increased complications [183]
.

84
Studies have also shown that protective factors such as well-being [182]
and problem
focused coping strategies [184]
can assist the management of diabetes [185]
.
Huang et al [185]
investigated the effect of both protective factors for diabetes as well as
risk factors for diabetes such as age and diabetes symptoms on glycaemic control,
quality of life and self care behaviours in people with type 2 diabetes. The study found
that social and behavioural factors such as physical activity, coping strategies and social
support were related to better diabetes-related outcomes but surprisingly found no
relationship between risk factors of diabetes and diabetes-related measures. Although
this study could not determine causality, it did suggest that protective factors can play a
role in favourable diabetes health-outcomes. This study measured diabetes-related
emotional distress as a risk factor of diabetes, but failed to measure positive affect as a
protective factor as well as NA as a risk factor. This is a limitation as there is growing
evidence that PA is an important predictor of health independent of NA [140]
.
Robertson et al’s systematic review [140]
on studies published between 1970 and 2011 in
relation to PA and diabetes outcomes found that PA was linked to lower mortality,
better exercise and lower perceived treatment burden. The studies that investigated
HbA1c found no associations between PA and glycemic control. Despite there being a
growing body of literature linking psychosocial factors to diabetes related factors [50, 134,
135, 186], more studies are needed to explore the relationship between PA and diabetes
related factors (HbA1c, self-care practices and quality of life) independent of NA.
Tsenkova et al [132]
investigated the relationships between PA, coping strategies and NA
on glycaemia control and found that the relationship between coping and HbA1c was
moderated by PA. The study recruited older women without diabetes and collected data
at baseline and at 2 years. Glycaemic control is an important indicator for diabetes,
however the findings from this study were based on people without diabetes. The Mood
and Anxiety Symptom Questionnaire (MASQ) was used to measure PA independently
from NA and coping was measured using the Coping Styles Inventory [164]
. HbA1c was
measured using a fasting blood glucose sample taken by a nurse and this was monitored
by individuals staying overnight at a general clinical research centre. Multiple
regression analysis showed that problem solving coping strategies predicted HbA1c

85
levels at 2 years and showed that the strongest effects were found with active coping
and instrumental coping. Positive affect was also a predictor of HbA1c at two years and
moderated the relationship between (i) active coping (ii) instrumental coping and (iii)
suppressing competing activities. Women with high PA scores who reported lower
problem focused coping scores had lower levels of HbA1c compared to people with low
PA. Based on this evidence it would be beneficial to investigate the relationship
between problem-focused coping and PA when investigating diabetes related outcomes.
This study aims to fill the gap in the existing literature by investigating the relationship
between PA (as measured by PANAS) and (i) HbA1c, (ii) quality of life and (iii) self-
care practices in people with diabetes independent of NA and other known risk factors.
Protective resources such as coping mechanisms and social support might be able to
buffer the negative effects of diabetes. Positive psychological resources have been
shown to promote better health. According to Fredrickson [187]
these resources are built
over time in response to experiencing positive emotions which can broaden an
individual in terms of behaviour, social integration and cognition. Therefore people
who exhibit high PA should have built up resources that could potentially dampen the
adverse negative effects on health. This study focuses firstly on coping strategies, in
particular problem solving techniques such as active and instrumental coping strategies.
As mentioned earlier, these techniques have already been associated with PA in relation
to HbA1c in women without diabetes [132]
. In view of this, the aim is to extend the
existing knowledge on the handful of studies investigating PA by investigating whether
PA and coping strategies are linked to HbA1c and also other diabetes related factors
such as self-care practices and quality of life in individuals with diabetes independent of
NA and other known risk factors.
In conclusion, based on the literature above it is hypothesised that (i) PA will be related
to lower HbA1c, better quality of life and better engagement in self-care practices, (ii)
higher PA will moderate the effect that stress has on HbA1c, quality of life and self-care
practices, and (iii) PA and coping strategies (active and instrumental) will be related to
lower HbA1c, as well as better quality of life and better engagement to self-care
practices.

86
4.2 Ethical Approval
The study proposal was submitted to the School of Pharmacy and Biomolecular Science
Research Ethics Committee at the University of Brighton for review. Approval was
granted on 8th
September 2010 (see appendix B).
4.3 Methods
4.3.1 Study Design
This study was cross-sectional and was conducted in South East England. Data was
collected using a self-report questionnaire and was designed to investigate the
relationship between PA and (i) glycaemic control, (ii) quality of life and (iii) self-care
practices in people living with diabetes. Participants either completed a paper format or
an online version of the questionnaire (via SurveyMonkey).
Sample Size
Using a conservative estimate of detecting a small effect size (d = .20), a correlational
model with a 2-sided 5% significance level and a power of 80%, a minimum sample
size of 191 people was required (G Power 3.1). In total 147 respondents completed the
self-report questionnaire.
4.3.2 Procedure
Participants were recruited using an advertisement which was distributed through email,
the intranet and magazines. It was sent to Brighton University, Brighton and Sussex
Medical School, Diabetes UK support groups in the South East region and Brighton and
Hove City Council. Snowball sampling technique (whereby participants are encouraged
to ask eligible associates to also complete the questionnaire) was used to maximise
recruitment. Once recruited, participants were asked to complete the questionnaire
either online via a “SurveyMonkey” link or alternatively participants had the option to
complete a paper copy.

87
The questionnaire took approximately 15 to 20 minutes to complete2. The first page
contained information about the questionnaire and also informed participants about the
content and the rationale. If participants were willing to complete the questionnaire,
they were asked to press the “I accept” button (displayed at the end of screen/page).
This allowed the participant to complete the questionnaire. Participants that completed
the paper copy were asked to read the cover page which was exactly the same as the
online version. Completing the questionnaire was an indication of consent. On
completion, they were instructed to send it back to the research student using the free
post envelope that was provided. If participants completed the questionnaire, with
permission they were put into a prize draw to win an IPOD Touch. Recruitment period
for this study was between 1st September 2010 and 31st January 2011.
4.3.3 Participants
People were considered eligible for inclusion in this study if they fulfilled all of the
following criteria; (i) had a self-reported diagnosis of diabetes (i) were over 18 years of
age and (iii) had the ability to read and write English fluently. All data were regarded as
confidential. Participant’s age and a randomly assigned experimental number were used
as identification and no individual data was reproduced.
4.3.4 Measures
Below is a summary of the measures (predictor, outcomes and covariates) that were
included in the questionnaire.
Positive Affect
The PANAS was used to measure PA (see section 2.1.1)
Diabetes-Related Health Outcomes
The three primary outcomes for this study were HbA1c, self-care practices and Diabetes
Quality of Life (DQOL). Participants were asked to self-report their HbA1c. To assess
2 A copy of the questionnaire can be found in Appendix B (pg 194)

88
DQOL and self-care practices, participants were asked to complete the DQOL and
SDSCA questionnaire (see section 2.2).
Demographic Factors
Participants were asked to report on their current housing situation by selecting one of
the following options ‘owned - with a mortgage to pay, owned – with no mortgage to
pay, rented from council or rented from private landlord’. They were also asked about
their level of education and instructed to select one of the following options ‘GCSEs /
O-levels, A-levels, degree, postgraduate qualification, no qualification or other’. Ethnic
background (White (British, Irish, Other White background, All white groups) Black or
British Black (Caribbean, African, Other Black background, All Black groups) Mixed
(White and Black Caribbean, White and Black African, White and Asian, Other mixed
background) Asian or British Asian (Indian, Pakistani, Bangladeshi, Other Asian
background, All Asian groups) Chinese or Other Ethnic Group (Chinese, Other ethnic
group, All Chinese groups) or All Ethnic Groups) and marital status (married/civil
partnership, cohabitating, separated, divorced or single) were also categorised whereby
participants were instructed to select the category that they felt best represented them.
Participants were asked to report their age in years.
Psychosocial Factors
Participants were asked if they had ever been diagnosed with depression and if they
were currently taking medication for depression. Perceived stress was measured using
the PSS [148, 149]
and coping strategies were measured using the COPE inventory [164]
.
These validated questionnaires have been used extensively in other research areas and
were chosen for their demonstrated reliability and validity (see section 2.1.2 and 2.3.2).
Individuals were asked to report on alcohol use and data was obtained using 2 items
from the Alcohol Users Disorders Identification Test [188]
, individuals who reported that
they drank alcohol were asked to report how often which was scored as follows; less
than a month (1) 2 -4 times per month (2) 2 – 3 times per week (3) 4+ times per week
(4). Then individuals were asked to report how many units which was scored as follows
1-2 (0) 3-4 (1) 5-6 (2) 7-8 (3) 9+ (4). These scores were added together to form a score
that ranged from 1 to 8 with higher scores indicating greater units per week of alcohol

89
intake. Smoking status was assessed by asking participants how many cigarettes they
had smoked in the last week [160]
.
Diabetes and Health Related Factors
Participants were also asked to report more specifically on certain diabetes-related
factors such as type of diabetes (type 1, type 2 or gestational), duration of diabetes
(years: 0-2, 2-5, 5-10, 10-20, 20-30, 30+), medication, diabetes related co-morbidities
and other complications. Furthermore they were also asked if they had attended social
support groups or/and an NHS educational programme related to their diabetes.
Participants were asked to report their weight and height from which BMI was
calculated (see section 2.4.2, Figure 2.2).
4.4 Data Analysis
The statistical software, PASW Statistics 18, was used for all analyses. Descriptive
statistics, means, standard deviations, frequencies and percentages were calculated for
all measures. Normality tests were performed using the Kolmogorov-Smirnov and
Normal Q-Q plots. In addition, further analysis was carried out to ensure that there was
no violation of the assumptions of multicollinearity. To determine the presence of
multicollinearity two values were calculated, tolerance and variance inflation factor
(VIF). Tolerance is an indicator of how much variability of the specified predictor is not
explained by the other predictors. Values less than .10 were considered to be very low
and an indication of multicollinearity. VIF is the inverse of tolerance and values greater
than 10 indicated presence of multicollinearity. Non-parametric tests were used if
variables did not show normality after transformation. All data for the diabetes quality
of life subscales were transformed so that a positive quality of life was equivalent to a
higher score [157]
. For example, individuals who scored highly on the impact subscale
reported that diabetes did not negatively impact their lives. For all outcomes a p-value
< .05 was considered to be statistically significant. Effects size’s were based on Eta
squared where .01 is small, .06 is medium and .138 is considered large [189]
.
Relationships between all continuous variables were initially investigated with either
Pearson’s or Spearman’s Rho correlations. To investigate differences between the

90
categorical variables on diabetes related outcomes, a series of t-tests, Man-Whitney tests
and Chi squares were used.
Depending on the level of measurement and the parametric quality of the data, multiple
linear or logistic regression analysis was used to investigate the relationship between PA
and diabetes related outcomes (as measured by HbA1c, self-care practices and diabetes
quality of life). Hierarchical multiple regression was used to predict HbA1c, DQOL
satisfaction, DQOL impact, DQOL diabetes related worries and DQOL social worries
whilst taking into account NA and other significant covariates as identified by the
correlational analysis. All factors that significantly correlated with the outcome were
entered in step one. To test if PA made a unique prediction, mean PA was then
included in step two. When mean NA did not significantly correlate as a covariate with
the outcome, it was added at step three.
For interaction analysis between PA and (i) coping strategies or (ii) perceived stress,
two-way between-groups ANOVA’s were used for all DQOL subscales and HbA1c.
Direct logistic regression was used for self-care practices. The main effect predictors
were added at step one and then the interaction terms were entered at step two.
4.5 Results
4.5.1 Sample Characteristics
In total 147 respondents completed the self-report questionnaire. One hundred and four
respondents completed the questionnaire online and 43 respondents completed it using
the paper format. Table 4.1 and Table 4.2 show the descriptive statistics for all
variables. Self-care behaviours are also summarised in Table 4.3.

91
Table 4.1 Descriptive statistics for demographic, psychosocial and diabetes
variables
Continuous Measures N Mean (±SD) Minimum –Maximum
Age (years) 140 53.69 (15.23) 20 – 84
Body mass index (kg/m2) 132 29.24 (7.47) 17.0 – 58.88
Mean Positive Affect 138 3.04 (0.77) 1– 4.50
Mean Negative Affect 137 1.96 (0.79) 1– 4.00
COPE: Active 145 1.45 (1.02) 0 – 4
COPE: Instrumental 145 1.97 (1.00) 0 – 4
Mean PSS score 146 1.68 (0.75) 0 – 3.30
Alcohol (units per week) 110 3.52 (1.90) 1 – 8
HbA1c 87 7.35 (1.34) 4.30 – 12
DQOL Satisfaction 147 63.85 (17.57) 23.33 – 100
DQOL Impact 145 66.67 (11.05) 36.11 – 100
DQOL Diabetes Related Worries 127 67.54 (24.95) 8.33 – 100
DQOL Social Worries 57 73.68 (24.58) 4.76 – 100
Number of complications 145 2.03 (1.80) 0 – 8
DQOL = Diabetes Quality of Life, PSS = Perceived Stress Scale

92
Table 4.2 Descriptive statistics for categorical demographics, diabetes related
variables and depression status
n (%)
Gender (n = 141)
Male 71 (50.4)
Female 70 (49.6)
Marital status (n = 144)
Married/civil partnership 85 (59.0)
Separated 8 (5.6)
Widowed 6 (4.2)
Single 21 (14.6)
Divorced 10 (6.9)
Cohabitating 14 (9.7)
Housing (n = 140)
Owned with a mortgage to pay 55 (39.3)
Owned with no mortgage to pay 50 (35.7)
Rented from Council 12 (8.6)
Rented from Private Landlord 23 (16.4)
Ethnic Background (n = 147)
White/White British 127 (86.4)
Other 20 (13.6)
Type of Diabetes (n = 144)
Type 1 47 (32.6)
Type 2 97 (67.4)
Duration of diabetes (years) (n = 144)
0 – 2 23 (16.0)
2 – 5 34 (23.6)
5 – 10 35 (24.3)
10 – 20 23 (16.0)
20 – 30 13 (9.0)
30 + 16 (11.1)
Clinical diagnosis of depression (n = 137)
Yes 27 (19.7)
No 110 (80.3)

93
Table 4.3 Percentage of sample engaging in specific self-care behaviours
n (%)
Self-care Practices (engaged ≥ 5 days)
Healthy Diet 75 (51.0)
Specific Diet 68 (46.3)
Exercise 40 (27.2)
Blood glucose testing 47 (32.0)
Feet checks 22 (15.0)
Treatment (n = 146)
Diet and Exercise 18 (12.3)
Oral Medication 31 (21.2)
Diet, Exercise and Oral Medication 25 (17.1)
Insulin 47 (32.2)
Oral Medication and Insulin 21 (14.4)
Oral Medication, Insulin, Diet and Exercise 4 (2.7)
Taking other medication
Antihypertensive (n = 146) 77 (52.7)
Statins (n = 144) 88 (61.1)
Anti platelet (n = 143) 42 (29.4)
Attendance
Attend NHS educational course (n = 131) 48 (36.6)
Attend regular support groups (n = 131) 50 (38.2)

94
4.5.2 HbA1c
The mean HbA1c for the total sample was 7.35% (SD = 1.34; min – max = 4.3 – 12).
Correlations/associations with demographic factors
No associations were found between self-reported HbA1c and any of the demographic
factors (age, log BMI, gender, marital status and ethnic background).
Correlations/associations with psychosocial factors
Alcohol was positively correlated with HbA1c (rho = .24 p = .056) suggesting higher
levels of alcohol consumption was related to higher levels of HbA1c. However no other
association were found between HbA1c and (i) PA (ii) NA (iii) perceived stress and (iv)
coping strategies (see Table 4.4).
Correlations/associations with diabetes-related factors
As expected participants with type 1 diabetes had higher levels of HbA1c than people
with type 2 diabetes (U =607, z = -2.63, p = <.01 r = .28 n = 87) (type 1 diabetes median
= 7.5, IQR = 6.8-8.2; type 2 diabetes median = 6.9, IQR = 6.4-7.48), however for all
other diabetes-related factors (support groups, education programme, diabetes
medication and number of complications) no significant differences were found in
levels of HbA1c.

95
Table 4.4 Correlation matrix of demographic, psychosocial and diabetes related factors on diabetes related outcomes3
Demographics Psychosocial Factors
Diabetes
Related
Factors
Diabetes
Outcomes Age
Body
Mass
Index
Positive
Affect
Negative
Affect
Perceived
Stress
Active
Coping
Instrumental
Coping
Number of
Complications
HbA1c r/rho -.08 -.13 -.10 -.13 -.03 -.01 -.20 -.04
n 85 83 84 84 87 87 87 86
DQOL
Satisfaction
r/rho .38** -.29** .37** -.56** -.53** .07 .19* -.10
n 140 132 138 137 146 145 145 145
DQOL
Impact
r/rho .38** -.01 .10 -.46** -.34** -.10 -.12 -.19*
n 139 131 136 135 145 144 144 143
DQOL
Diabetes Related
Worries
r/rho .41** -.11 .18* -.46** -.42** -.04 -.01 -.19*
n 121 115 119 118 127 127 127 125
DQOL
Social Worries
r/rho .61** .19 .16 -.63** -.62** .001 -.08 -.11
n 54 50 55 54 57 57 57 56
Note r/rho = Figures here represent either the r or rho statistic as some of the data was not normally distributed. ** p< .001 * p<.05. n = number of participants
3 A more detailed version of results is provided in Appendix B (pg 193)
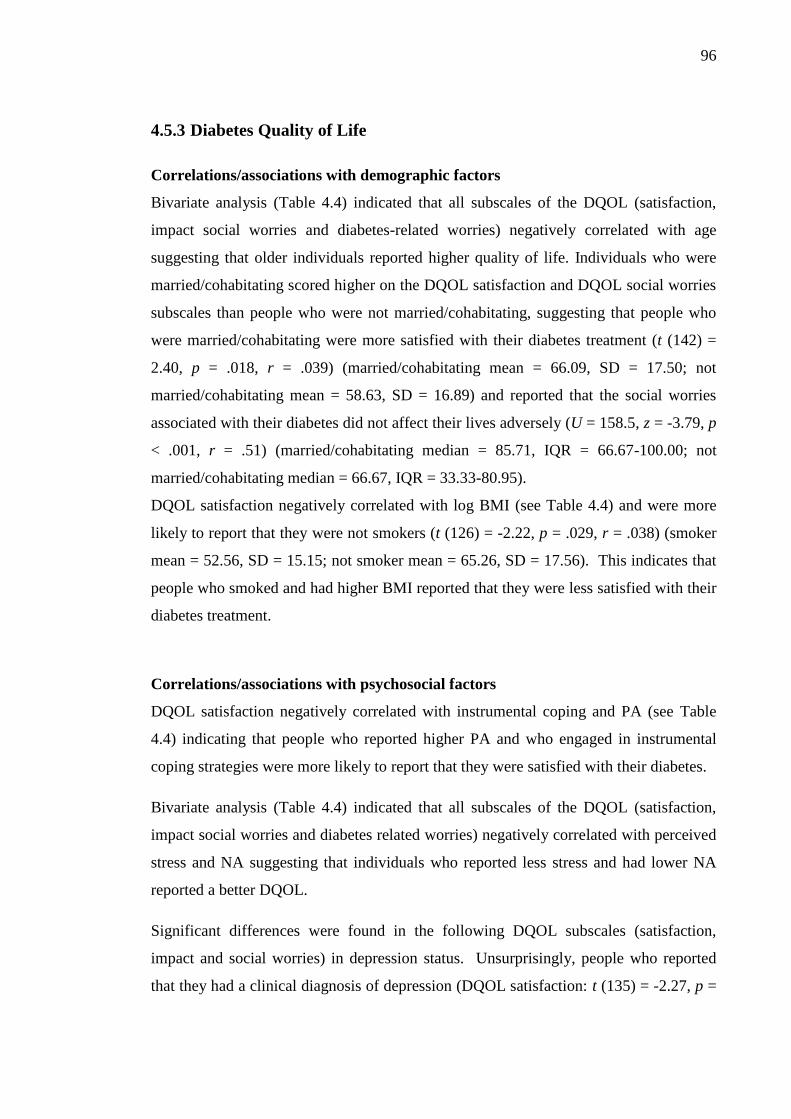
96
4.5.3 Diabetes Quality of Life
Correlations/associations with demographic factors
Bivariate analysis (Table 4.4) indicated that all subscales of the DQOL (satisfaction,
impact social worries and diabetes-related worries) negatively correlated with age
suggesting that older individuals reported higher quality of life. Individuals who were
married/cohabitating scored higher on the DQOL satisfaction and DQOL social worries
subscales than people who were not married/cohabitating, suggesting that people who
were married/cohabitating were more satisfied with their diabetes treatment (t (142) =
2.40, p = .018, r = .039) (married/cohabitating mean = 66.09, SD = 17.50; not
married/cohabitating mean = 58.63, SD = 16.89) and reported that the social worries
associated with their diabetes did not affect their lives adversely (U = 158.5, z = -3.79, p
< .001, r = .51) (married/cohabitating median = 85.71, IQR = 66.67-100.00; not
married/cohabitating median = 66.67, IQR = 33.33-80.95).
DQOL satisfaction negatively correlated with log BMI (see Table 4.4) and were more
likely to report that they were not smokers (t (126) = -2.22, p = .029, r = .038) (smoker
mean = 52.56, SD = 15.15; not smoker mean = 65.26, SD = 17.56). This indicates that
people who smoked and had higher BMI reported that they were less satisfied with their
diabetes treatment.
Correlations/associations with psychosocial factors
DQOL satisfaction negatively correlated with instrumental coping and PA (see Table
4.4) indicating that people who reported higher PA and who engaged in instrumental
coping strategies were more likely to report that they were satisfied with their diabetes.
Bivariate analysis (Table 4.4) indicated that all subscales of the DQOL (satisfaction,
impact social worries and diabetes related worries) negatively correlated with perceived
stress and NA suggesting that individuals who reported less stress and had lower NA
reported a better DQOL.
Significant differences were found in the following DQOL subscales (satisfaction,
impact and social worries) in depression status. Unsurprisingly, people who reported
that they had a clinical diagnosis of depression (DQOL satisfaction: t (135) = -2.27, p =

97
.025, r = .037) (DQOL impact: U = 1036.5, z = -2.32, p = .02, r = .20) (DQOL social
worries: U = 77.00, z = -3.15, p = .002, r = .43) reported a lower quality of life for all
three DQOL subscales (i) satisfaction (depression mean = 57.27 SD = 17.94; no
depression mean = 65.80, SD = 17.41), (ii) impact (depression median = 65.00 IQR =
55-70; no depression median = 69.59, IQR = 61.39-73.75) and (iii) social worries
(depression median = 55.95, IQR = 0-66.67; no depression median = 80.95, IQR =
67.86-95.24).
Individuals who attended support groups scored higher on the DQOL satisfaction,
DQOL impact and DQOL diabetes related worries subscales than people who did not
attend, suggesting that people who attended support groups were more satisfied with
treatment (t (129) = -3.57, p < .001, r = .09) (support group mean = 71.15 SD = 16.56;
no support group mean = 60.27, SD = 17.16), reported that their diabetes did not impact
their lives adversely (U = 1311.5, z = -3.15, p = .002, r = .28) (support group median =
72.50, IQR = 65.13-75.00; no support group median = 66.25, IQR = 56.88-72.47) and
had fewer diabetes related worries (U = 1016.5, z = -2.40, p = .016, r = .23) (support
group median = 83.33, IQR = 66.67-89.58; no support group median = 66.67, IQR =
43.75-83.33).
Correlations/associations with diabetes-related factors
As expected, individuals who had type 1 diabetes reported a lower quality of life on all
three subscales (DQOL satisfaction: t (113) = -2.07, p = .041, r = .044) (DQOL impact:
U = 1633.5, z = -2.51, p = .012, r = .21) (DQOL diabetes related worries: U = 1250.5, z
= -2.67, p = .008, r = .24): (i) satisfaction (type 1 diabetes mean = 60.30 SD = 14.55;
type 2 diabetes mean = 66.16, SD = 18.43), (ii) impact (type 1 diabetes median = 65.63
IQR = 58.13-71.56; type 2 diabetes median = 70.00, IQR = 62.32-75.00) and (iii)
diabetes related worries (type 1 diabetes median = 58.33, IQR = 42.36-81.94; type 2
diabetes median = 77.78, IQR = 56.25-91.67).

98
4.5.4 Self-care Behaviours
Individuals who followed a healthy diet for more than 5 days reported engaging in more
instrumental coping strategies (U =1988.5, z = -2.57, p = .01, r = .21) (≥ 5days median
= 2.00, IQR = 1.5-3.0; ≤ 5 days median = 2.00, IQR = 1.0-2.13) and also had higher
levels of PA (t = (136) = -2.73, p = .007, r = .052) (≥ 5days mean = 3.21 SD = .69; ≤ 5
days mean = 2.86, SD = .82).
Individuals who avoided high fat foods for more than 5 days reported engaging in both
more instrumental (U =2056.5, z = -2.26, p = .002, r = .26) (≥ 5days median = 2.00,
IQR = 1.63-3.0; ≤ 5 days median = 2.00, IQR = 1.0-2.25) and active coping strategies
(U =1839, z = -3.15, p = .024, r = .19 (≥ 5days median = 1.75, IQR = 1-2.5; ≤ 5 days
median = 1.00, IQR = .5-2.0).
Not surprisingly, individuals who reported exercising for more than 5 days had lower
log BMI (U =1313.5, z = -2.12, p = .034, r = .18) (≥ 5days median = 1.42, n = 36; ≤ 5
days median = 1.45, n = 96) and reported engaging in active coping strategies (U
=1312.5, z = -3.42, p = .001, r = .28) (U =1839, z = -3.15, p = .024, r = .19 (≥ 5days
median = 2.00, n = 39; ≤ 5 days median = 1.00, n = 106).
Individuals who reported monitoring their blood glucose levels for more than 5 days
were younger (t = (138) = 2.50, p = .014, r = .043) (≥ 5days mean = 49.17, SD = 15.22;
≤ 5 days mean = 55.89, SD = .14.82), more likely to be married (χ2 (1, n = 144) = 7.03),
had lower log BMI (t = (143) = 2.17, p = .032, r = .035) (≥ 5days mean = 1.43 SD =
.09; ≤ 5 days mean = 1.47, SD = .11), had type 1 diabetes (χ2 (1, n =144 ) = 39.49),
reported taking antidiabetic medication (χ2 (1, n =145 ) = 10.39) and reported engaging
in instrumental coping strategies (U =1793.5, z = -2.20, p = .028, r = .18) (≥ 5days
median = 2.00, n = 47; ≤ 5 days median = 2.00, n = 98).
No other significant demographic, psychosocial or diabetes related factors were found
with self-care practices.

99
4.5.5 Associations between Diabetes Related Outcomes
A Chi-square test for independence (with Yates Continuity Correction) indicated an
association between following a healthy diet and avoidance of high fat foods (χ2 (1, n
=147) = 24.01, p < .001). There was an association between individuals who reported
exercising more regularly and who reported following a healthy diet χ2 (1) = 6.91, p =
.009) and who avoided high fat foods χ2 (1) = 8.84, p = .003). There was also an
association between individuals who reported exercising and monitoring their glucose
levels for more than five days χ2 (1) = 9.39). Furthermore, in relation to HbA1c, as
expected individuals who reported following a healthy diet (U = 625.5, z = -2.69, p =
.007) (≥ 5days median = 6.80, n = 47; ≤ 5 days median = 7.40, n = 40) or avoiding high
fat foods (U =617.5, z = -2.77, p = .006) (≥ 5days median = 6.80, n = 41; ≤ 5 days
median = 7.40, n = 46) for more than five days had lower HbA1c.
Individuals who monitored their glucose levels had higher diabetes related worries (U =
1253, z = -2.82, p = .005) (≥ 5days median = 66.67, n = 43; ≤ 5 days median = 77.78, n
= 84) and had lower DQOL impact scores (U = 1744, z = -2.27, p = .023) (≥ 5days
median = 65.00, n = 46; ≤ 5 days median = 70.00, n = 99).
It is not surprising that individuals who scored highly on the DQOL satisfaction
subscale scale also reported that their diabetes did not impact their lives negatively (rho
= .54, n = 145, p < .001) had fewer social worries (rho = .45, n = 57, p < .001) and
diabetes related worries (rho = .60, n = 127, p < .001). Furthermore a positive
correlation between DQOL impact and (i) DQOL social worries (rho = .54, n = 57, p <
.001) and (ii) diabetes related worries (rho = .66, n = 126, p < .001) suggests that
individuals who reported that their diabetes did not impact their lives negatively also
reported fewer social and diabetes related worries.
In summary, PA was associated with DQOL satisfaction, DQOL diabetes related
worries and diet. This provides support for parts of Hypothesis 1, given that people
who reported higher PA had better DQOL satisfaction, fewer diabetes related worries
and were more likely to report following a healthy diet. No support was found for
Hypothesis 2, PA was not found to be associated with HbA1c, diabetes impact,
avoiding high fat foods, monitoring glucose levels, engaging in regular exercise and

100
checking feet. These outcomes do not support Hypothesis 1, given that no associations
were found between people who reported higher PA and lower HbA1c, better diabetes
impact and most self-care practices.
The next part of this results section focuses on the diabetes health-outcomes (HbA1c,
DQOL satisfaction, DQOL diabetes related worries and following a healthy diet) that
were related to PA. The objective is to see whether PA can independently predict the
health-outcomes independent of NA as well as other factors that significantly correlate
with the outcome.
4.5.6 Positive Affect and Diabetes Related Outcomes
PA and HbA1c
Although there was no significant correlation between HbA1c and PA, both factors
showed significant associations with following a healthy diet for more than 5 days. For
this reason, a two-way between-groups analysis of variance was conducted to
investigate any interaction effects between PA and following a healthy diet on HbA1c.
The main effect for healthy diet (F (1, 82) = 7.02 p = .010) was significant however the
main effect for PA (F (1, 82) = .64 p = .426) was not. The interaction effect between
following a healthy diet and PA on HbA1c was significant (F (1, 82) = 4.65 p = .034)
suggesting that the relationship between PA and HbA1c was different for people who
reported following a healthy diet and those who did not. It should be noted Levene’s
test did show heterogeneity of variances and therefore the result should be treated with
caution.
Figure 4.1 shows no direct association between PA and HbA1c (r = -.10, p = .344). For
individuals who reported not following a healthy diet for more than five days, higher
PA levels were associated with lower levels of HbA1c (reaching near significance) (rho
= -.27, p = .092). No such association was found for individuals who reported
following a healthy diet (r = .20, p = .181). This suggests that in the absence of healthy
eating PA might have a positive impact on HbA1c.

101
0 1 2 3 4 54
6
8
10
12
< 5 days 5 daysTotal population
Mean Positive Affect
Hb
A1
c (
%)
Figure 4.1 Interaction plot between Positive Affect (PA), HbA1c and following a
healthy diet
PA and DQOL Satisfaction
Hierarchical multiple regression was used to assess the ability of PA to predict DQOL
satisfaction after taking into account the variance explained by the other factors (see
Table 4.5). DQOL diabetes social worries was initially included in this model, however
was removed due to small sample size (n = 57) and the presence of multicollinearity
(Model 1: tolerance value = .02 and VIF = 39.72). The covariates that correlated
significantly with DQOL satisfaction were entered at step 1, explaining 58.2% of the
variance in DQOL satisfaction, (F (12, 96) = 11.12, p < .001). After entry of PA at step
2, the total variance explained by the model as a whole was 59.7%, (F (13, 95) = 10.82,
p < .001). PA explained an additional 1.5% of the variance in DQOL satisfaction after
controlling for type of diabetes, age, log BMI, marital status, NA, perceived stress,
depression and smoking status, instrumental coping, attending support groups, DQOL
diabetes worries and DQOL impact (R squared change = .015, F change (1, 95) = 3.61,
p = .060).

102
Table 4.5 Hierarchical multiple regression analysis for factors predicting DQOL
satisfaction
Step 1 Step 2
Variable B SE B β B SE B β
Log body mass index -31.31 12.61 -0.18* -30.64 12.45 -0.18*
Age 0.02 0.11 0.02 0.03 0.11 0.02
Marital status -0.73 2.64 -0.02 0.06 2.64 0.00
Mean perceived stress -4.11 2.34 -0.18 -2.55 2.45 -0.11
Mean negative affect -4.49 2.25 -0.20* -4.78 2.23 -0.21*
Depression status -0.72 3.32 -0.02 -0.45 3.28 -0.01
Mean instrumental
coping
3.32 1.24 0.19** 2.84 1.25 0.16*
DQOL – impact 0.32 0.16 0.20* 0.35 0.16 0.22*
DQOL - diabetes
worries
0.15 0.07 0.21* 0.13 0.07 0.18*
Attend support groups 1.95 3.00 0.05 1.82 2.96 0.05
Type of diabetes 5.24 3.06 0.14 5.17 3.02 0.14
Smoking status 2.55 4.52 0.04 3.14 4.47 0.05
Mean positive affect 3.27 1.72 0.14
R squared
.58**1
0.602
Note. * p < .05. ** p < .01. 1 This R squared value relates to Step 1 and includes covariates only.
2 This R squared value relates to Step
2 and includes covariates and PA.
PA and DQOL Diabetes Related Worries
Hierarchical multiple regression was used to assess the ability of PA to predict DQOL
diabetes worries after taking into account the variance explained by the other factors
(see Table 4.6). Although the DQOL social worries subscale was initially included in
this model, it was removed due to small sample size (n = 57). The covariates that
correlated significantly with DQOL diabetes worries were entered at step 1, explaining
57.8% of the variance in DQOL diabetes worries, (F (9, 102) = 15.55, p < .001). After
entry of PA at step 2, the total variance explained by the model as a whole was 58.1%,
(F (10, 101) = 14.01, p < .001). PA explained an additional .3% of the variance in
DQOL diabetes worries after controlling DQOL satisfaction, DQOL impact, glucose

103
monitoring, type of diabetes, total complications, attend support groups, age (years),
negative affect, and perceived stress (R squared change = .003, F change (1, 101) = 651,
p = .422). Therefore PA did not significantly predict DQOL diabetes worries once the
other factors had been accounted for.
Table 4.6 Hierarchical multiple regression analysis for factors predicting DQOL
diabetes related worries
Step 1 Step 2
Variable B SE B β B SE B β
Age 0.28 0.16 0.17 0.29 0.16 0.18
Mean perceived stress -2.61 3.21 -0.08 -1.72 3.40 -0.05
Mean negative affect 0.32 3.12 0.01 -0.01 3.15 0.00
Complications -1.58 1.05 -0.11 -1.56 1.05 -0.11
DQOL – impact 1.03 0.19 0.46** 1.05 0.20 0.47**
DQOL - satisfaction 0.30 0.13 0.21* 0.28 0.13 0.19*
Attend support groups -0.45 4.13 -0.01 -0.59 4.14 -0.01
Type of diabetes -2.88 4.59 -0.05 -3.02 4.60 -0.06
Glucose Monitoring -7.55 4.26 -0.14 -7.89 4.29 -0.15
Mean positive affect 1.94 2.40 0.06
R squared .58**1 0.58*
2
Note. * p < .05. ** p < .01. 1 This R squared value relates to Step 1 and includes covariates only.
2 This R squared value relates to Step
2 and includes covariates and PA.

104
PA and General Diet
As shown in Table 4.7, the logistic regression model at step two contained four
predictor variables. The full model at step two was statistically significant (χ2 (4, n =
136) = 34.67, p < .05) indicating that it was able to distinguish between individuals who
reported following more than 5 days of healthy eating than those who did not. The
model at step two as a whole explained 30.0% (Nagelkerke R squared) of the variance
in following a healthy diet and correctly classified 75% of cases. Both PA and
following a specific diet made significant contributions at step two. The strongest
predictor of following a healthy diet was specific diet (avoiding high fat foods) with an
odds ratio of 5.24. This suggests that people who avoided high fat foods were 5.24
times more likely to follow a healthy diet. Respondents who reported higher levels of
PA were almost twice as likely to follow a healthy diet for more than five days after
controlling for all other factors in the model (odds ratio 1.74).
When NA was included at step three, although the model remained statistically
significant as a whole (χ2 (5, n = 136) = 37.32, p < .05), PA did not make a unique
contribution in following a healthy diet (p = .089).

105
Table 4.7 Logistic regression predicting the likelihood of following a healthy diet for more than five days
Step 1 Step 2 Step 3
Variable B WALD OR CI B WALD OR CI B WALD OR CI
Mean instrumental coping 0.30 2.30 1.35 .92-1.99 0.21 1.04 1.23 .82-1.85 0.25 1.39 1.28 .85-1.94
Specific diet 1.61 16.41** 4.98 2.29-10.83 1.66 16.47** 5.24 2.36-11.66 1.73 17.01** 5.62 2.48-12.67
Exercise 0.58 1.61 1.79 .73-4.38 0.57 1.45 1.76 .7-4.43 0.63 1.79 1.88 .74-4.78
Mean positive affect 0.56 4.32* 1.74 1.03-2.94 0.47 2.89 1.60 .93-2.74
Mean negative affect -0.43 2.58 0.65 .38-1.10
Note. *p < .05. **p < .01. OR. Odds Ratio. CI. Confidence Interval
Step 1. Covariates only; Step 2. Covariates and PA; Step 3. Covariates, PA and NA.

106
4.5.7 Positive Affect and Coping Interactions on Diabetes Related Outcomes
A series of two-way between-groups ANCOVAs were conducted to assess the
relationship between coping strategies (active and instrumental) and PA on (i) HbA1c
and (ii) DQOL. To test this interaction on self-care practices, logistic regression was
used. Using a median split, two groups were calculated for PA (high vs. low).
Levene’s test of equality of error variances was conducted for each outcome. If in the
instances the variance of outcomes was not equal, caution was taken when evaluating
the results.
HbA1c
The main effect for both PA (F (1, 82) = .1.39, p = .241) and active coping (F (1, 82) =
.06 p = .815) on HbA1c did not reach statistical significance. The interaction effect
between active coping and PA on HbA1c was not statistically significant (F (1, 82) =
.36, p = .550).
The main effect for both PA (F (1, 82) = .02, p = .899) and instrumental coping (F (1,
82) = .62 p = .435) on HbA1c did not reach statistical significance. The interaction
effect between instrumental coping and PA on HbA1c was not statistically significant
(F (1, 82) = .37, p = .546).
DQOL Satisfaction
There was a statistically significant main effect of PA on DQOL satisfaction (F (1, 135)
= 21.20 p <.001), furthermore the effect size was large (partial eta squared .137). The
main effect of active coping (F (1, 135) = .00 p = .983) did not reach statistical
significance. The interaction effect between instrumental coping and PA on DQOL
satisfaction was not statistically significant (F (1, 135) = .02 p = .876).
There was a statistically significant main effect for PA on DQOL satisfaction (F (1,
135) = 21.67 p <.001), furthermore the effect size was large (partial eta squared .140).
The main effect for instrumental coping (F (1, 135) = 1.34 p = .248) did not reach

107
statistical significance. The interaction effect between instrumental coping and PA on
DQOL satisfaction was not statistically significant (F (1, 135) = .2.17 p = .143).
DQOL Impact
The main effect for both PA (F (1, 134) = 2.31 p = .131) and active coping (F (1, 134) =
.51 p = .475) on DQOL impact did not reach statistical significance. The interaction
effect between active coping and PA on DQOL impact was not statistically significant
(F (1, 134) = .08 p = .776).
The main effect for both PA (F (1, 134) = 2.40 p = .123) and instrumental coping (F (1,
134) = .1.15 p = .286) on DQOL impact did not reach statistical significance. The
interaction effect between instrumental coping and PA on DQOL impact was not
statistically significant (F (1, 134) = .71 p = .401).
DQOL Diabetes Related Worries
The main effect for both PA (F (1,117) = .11 p = .738) and active coping (F (1,117) =
1.22 p = .272) on DQOL diabetes related worries did not reach statistical significance.
The interaction effect between active coping and PA on DQOL diabetes related worries
was not statistically significant (F (1, 117) = 2.44 p = .121).
The main effect for both PA (F (1,117) = .18 p = .672) and instrumental coping (F (1,
117) = .70 p = .404) on DQOL diabetes related worries did not reach statistical
significance. The interaction effect between instrumental coping and PA on DQOL
diabetes related was not statistically significant (F (1, 117) = .85 p = .36).
DQOL Social Worries
The main effect for both PA (F (1, 59) = 1.98 p = .165) and active coping (F (1, 59) =
.02 p = .894) on DQOL social worries did not reach statistical significance. The

108
interaction effect between active coping and PA on DQOL social worries was not
statistically significant (F (1, 59) = .12 p = .728).
The main effect for both PA (F (1, 59) = 1.47 p = .23) and instrumental coping (F (1,
59) = .01 p = .940) on DQOL social worries did not reach statistical significance. The
interaction effect between instrumental coping and PA on DQOL social worries was not
statistically significant (F (1, 59) = .11 p = .747).
Self-care Practices
At step one the main effect predictors were entered in the model ((i) mean PA and
median active coping or (ii) mean PA and median instrumental coping). At step two the
interaction effect was added. The overall model at step two for specific diet, exercise,
blood glucose monitoring and foot checks did not reach statistical significance.
Therefore the model was not able to distinguish between individuals who did or did not
report to following more than 5 days of a certain self-care practice.
Only healthy diet was able to distinguish whether individuals did or did not report
following more than 5 days of healthy eating. However the interaction effect at step
two between (i) mean PA and median active coping and (ii) mean PA and median
instrumental coping did not reach significance.
In summary, no interactions were found between PA (high and low) and (i) active or (ii)
instrumental coping on (i) HbA1c, (ii) DQOL satisfaction (iii) DQOL diabetes related
worries, (iv) diabetes social worries and (v) following self-care practices respectively.
Although there was a relationship between instrumental coping and DQOL satisfaction,
PA did not influence this relationship. For these reasons, Hypothesis 2, could not be
supported.

109
4.5.8 Positive Affect and Perceived Stress on Diabetes Related Outcomes
A series of two-way between-groups ANCOVAs were conducted to explore the impact
of perceived stress and PA on (i) HbA1c and (ii) DQOL. To test this interaction on self-
care practices logistic regression was used. Using a median split, two groups were
calculated for PA (high vs. low). Levene’s test of equality of error variances was
conducted for each outcome. If in the instances the variance of outcomes was not equal,
caution was taken when evaluating the results.
HbA1c
The main effect for both PA (F (1, 82) = .22 p = .641) and perceived stress (F (1, 82) =
.55 p = .461) on HbA1c did not reach statistical significance. The interaction effect
between perceived stress and PA on HbA1c was not statistically significant (F (1, 82) =
.003 p = .958).
DQOL Satisfaction
There was a statistically significant main effect for perceived stress on DQOL
satisfaction (F (1, 135) = 37.21 p <.001), furthermore the effect size was large (partial
eta squared .219). The main effect for PA (F (1, 135) = .08 p = .776) did not reach
statistical significance. The interaction effect between perceived stress and PA on
DQOL satisfaction was not statistically significant (F (1, 135) = 1.92 p = .168).
DQOL Impact
There was a statistically significant main effect for perceived stress on DQOL impact (F
(1, 134) = 24.07 p <.001), furthermore the effect size was large (partial eta squared
.154). The main effect for PA (F (1, 134) = 2.93 p = .09), however did not reach
statistical significance. The interaction effect between perceived stress and PA on
DQOL impact was statistically significant (F (1, 134) = 4.65 p = .033), however this
finding must be taken with caution as homogeneity of variances were unequal.

110
Figure 4.2 shows a negative relationship between perceived stress and DQOL impact
(rho = -.343, p < .001). Furthermore, whilst looking at the sample as a whole, PA acted
as a moderator. For individuals who had low PA, higher stress was strongly associated
with lower quality of life (rho = -.436, p < .001). However, for individuals high in PA,
the association was weaker between DQOL impact and perceived stress (rho = -.285, p
< .05). This suggests that levels of stress did not impact DQOL as negatively for
people with high PA. This result offers some support for the stress buffering theory
whereby levels of stress had a decreased impact on QOL for individuals with high PA
compared to individuals with low PA.
0 1 2 3 420
40
60
80
100
Positive Affect 3 Positive Affect > 3Total population
Mean Percieved Stress
DQ
OL
Im
pac
t
Figure 4.2 Interaction plot of perceived stress and Positive Affect on DQOL impact
PA scores represent median PA, DQOL = Diabetes Quality of Life

111
DQOL Diabetes Related Worries
There was a statistically significant main effect for perceived stress on DQOL social
worries (F (1, 117) = 23.16, p <.001), furthermore the effect size was large (partial eta
squared .168). However the main effect for PA (F (1, 117) = .05 p = .817) did not reach
statistical significance. The interaction effect between perceived stress and PA on
DQOL social worries was not statistically significant (F (1, 117) = .57 p = .453).
DQOL Social Worries
There was a statistically significant main effect for perceived stress on DQOL social
worries (F (1, 59) = 27.87, p <.001), furthermore the effect size was large (partial eta
squared .328). However the main effect for PA (F (1, 59) = .37 p = .546) did not reach
statistical significance. The interaction effect between perceived stress and PA on
DQOL social worries was not statistically significant (F (1, 59) = .14 p = .708).
Self-care Practices
At step one the main effect predictors were entered in the model (median PA and mean
perceived stress). At step two the interaction effect between median PA and mean
perceived stress was entered. The overall models at step two for all self-care practices
failed to reach statistical significance. Therefore the model was not able to distinguish
between individuals who did or did not report to following more than 5 days of a certain
self-care practice.
In summary, no associations were found between perceived stress and (i) HbA1c and
(ii) following self-care practices, regardless of whether or not participants had high or
low PA. Hypothesis 3 therefore could not be supported.
Conversely, there were associations between perceived stress and all of the DQOL
subscales, indicating that higher perceived stress was associated with lower quality of
life (see Table 4.3). These associations remained the same for DQOL satisfaction,

112
diabetes related worries and diabetes social worries, regardless of whether or not
individuals had high or low PA. Hypothesis 3 therefore could not be supported.
The association between perceived stress and diabetes impact was dependent on
whether or not participants had high or low PA. Therefore this is the only finding that
supports Hypothesis 3, given that the relationship between perceived stress and diabetes
impact differed depending on levels of PA (see Figure 4.2).
4.6 Discussion
This study had three key objectives: to investigate the relationship between PA and
diabetes factors (HbA1c, DQOL satisfaction, impact, diabetes related worries and social
worries and self-care practices); to investigate the relationship between PA and
perceived stress on those factors; and to investigate the relationship between PA and
coping strategies in people with diabetes.
The present study found significant relationships between PA and (i) following a
healthy diet, (ii) DQOL satisfaction and (iii) DQOL diabetes related worries therefore
supporting parts of Hypothesis 1. Individuals higher in PA were more likely to follow
a healthy diet, have better DQOL satisfaction and fewer diabetes related worries.
Although, these relationships described were significant, the main objective was to
assess whether PA predicted these outcome measures independent of other important
factors (demographic, psychosocial and diabetes and health related) that also correlated
with the outcome at baseline and for this reason hierarchical and logistic regressions
were conducted.
The study found that individuals higher in PA were twice as likely to follow a healthy
diet independent of instrumental coping, exercise and avoiding high fat foods, although
this relationship was not independent of NA. Following a healthy diet was the only
self-care practice that was related to PA, however in previous studies PA has been
associated with exercise independent of NA but in individuals without a chronic

113
condition [53, 190]
. The management of diabetes involves an array of self-care
behaviours; therefore this taken together with the results of this study might suggest that
PA is linked with a greater tendency to engage in certain health behaviours like healthy
eating.
HbA1c did not correlate with any of the measured demographic or psychosocial factors.
This was unanticipated as factors such as stress and depression have previously been
associated with poor glycaemic control [6]
. There is considerable literature suggesting
that stress is linked to worsening HbA1c [127, 133]
. Studies have shown that stress can
have a physiological impact on glycaemic control [130]
, such that continuous increases in
cortisol can lead to poor management of glucose levels which over time can lead to
worsening HbA1c and consequently the onset of complications. Depression has also
been widely published in relation to diabetes (see section 1.3) [179]
, individuals are less
likely to adhere to medication, follow self-care practices and more likely develop
complications [92, 93, 114]
. The fact that we found very little in relation to HbA1c might
be due to the findings being based on self-report readings rather than obtaining blood
samples. Another possible explanation is that the individuals who chose to complete the
questionnaire might have been interested in their diabetes and therefore might have been
more likely to follow self-care behaviours and consequently have better HbA1c.
The relationship between PA and HbA1c was found to be moderated by healthy diet.
PA levels were not correlated with HbA1c in people who did follow a healthy diet, as it
was expected that they would already have relatively good glycaemic control as good
self-care practices such as following a healthy diet have been shown to improve glucose
control in prior research [191]
. This was supported by the findings of the present study
such that people who followed a healthy diet or/regularly avoided high fat foods for
more than 5 days per week had lower HbA1c. However, the association between PA
and HbA1c was statistically significant in individuals who did not follow a healthy diet.
Therefore although PA might have buffered the effects of not following a healthy diet
on HbA1c, individuals who exhibit lower PA that do not engage in healthy eating might

114
be at risk. The study highlights that if we can test an intervention designed to increase
PA, it might help people with diabetes that do not follow a healthy diet.
Delamater reported that people with diabetes might adhere more to one self-care
practice compared to another [80]
. Fifty one percent of our study population adhered to a
healthy diet. This means that about half of our study population did not follow a
healthy diet and had significantly higher HbA1c. The NICE guidelines recommend that
people should engage in a healthy and balanced diet [192]
. Diet is important for people
with diabetes, since any food that is consumed will affect the management of the
disease.
This study recruited individuals with type 1 and type 2 diabetes. Although, the main
goal of both types of diabetes treatment is to maintain blood glucose levels within
healthy bounds, the treatments that are available and the repercussions of not adhering
differ significantly. For instance, the implications of a person with type 1 diabetes not
adhering to their medication can be fatal, whereas a person with type 2 diabetes does not
face such severe short term consequences. In the present study, we addressed this issue
by including the ‘type of diabetes’ as a covariate if it significantly correlated with any of
the diabetes outcomes. The present study found a difference between type of diabetes
and glucose monitoring where people with type 1 diabetes were more likely to monitor
their glucose levels more often. This result was expected as a person with type 1
diabetes needs to continually monitor their glucose levels as they are at an increased risk
of becoming hypoglycaemic or hyperglycaemic. Individuals with type 1 diabetes also
had higher levels of HbA1c; this result might also be expected as a person with type 1
diabetes has no circulating insulin whereas a person with type 2 would still be
producing insulin which could help in maintaining blood glucose levels. As expected
people with type 2 diabetes had a higher BMI, a risk factor of type 2 diabetes [193]
.
The relationship between PA and DQOL satisfaction neared significance (p = .06) after
controlling for age, BMI, marital status, perceived stress, NA, depression status,
instrumental coping, diabetes impact, diabetes related worries, attendance of support
groups, type of diabetes, and smoking status. In addition, there were also other factors

115
that made a statistically significant contribution (p < .05) in predicting DQOL
satisfaction. There were in order of importance, DQOL impact (beta = .22), NA (beta =
-.21), BMI (beta = -.18), DQOL diabetes worries (beta = .18) and instrumental coping
(beta = .16).
The fact that PA reached near significance and that NA was a significant predictor of
DQOL satisfaction in the same model might suggest that both PA and NA can
independently predict diabetes quality of life satisfaction. This supports the view that
PA and NA might not be bipolar and can be seen as orthogonal constructs [11]
.
Individuals who report more negative affect might have a more negative attitude
towards their diabetes and therefore report a lower quality of life. Generally quality of
life is lower in people with a chronic disease and this has been shown to also be true for
people with diabetes [183]
.
Higher BMI also remained significant after adjusting for other covariates in the DQOL
satisfaction model. Individuals with higher BMI reported lower diabetes quality of life
satisfaction but no other relationships were found between BMI and the remaining
diabetes quality of life subscales. This finding supports other studies that have shown
that people who have a high BMI do have a lower quality of life [194]
. Obesity is a
complex disease that has reached epidemic levels [194]
. Excess weight is directly linked
with insulin resistance [193]
and develops from a combination of genetic, metabolic and
psychosocial factors [194]
. It is estimated that 90% of people with type 2 diabetes are
overweight or obese [193]
. For the reasons above in relation to obesity, it is
recommended (according to NICE guidelines [97]
) that lifestyle modifications such as
losing weight are the first line of treatment.
A possible explanation as to why both diabetes impact and diabetes related worries
predicted DQOL satisfaction is that although the subscales investigated separate factors
they all measure quality of life of people with diabetes. Therefore if people are satisfied
with their diabetes treatment they are probably highly unlikely to feel that their diabetes
adversely impacts their lives.

116
PA did not predict diabetes related worries after adjusting for age, perceived stress, NA,
complications, attendance of support groups, type of diabetes, glucose monitoring,
diabetes impact and DQOL satisfaction. In the final model, only two control measures
were statistically significant, with diabetes impact being more important than DQOL
satisfaction which might suggest that they do correlate.
Some demographic factors correlated with DQOL. Individuals who were older reported
better quality of life for all four DQOL subscales. However when evaluating it as a
model to predict DQOL satisfaction, age did not make a significant contribution in
predicting DQOL satisfaction. This partly supports Rubin and Peyrot who found no
‘meaningful’ link between age and quality of life in their systematic review [134]
. When
they specifically looked at physical functioning however, they did find that older
individuals are more likely to report lower scores on physical and social functioning
compared to younger people. Although this contradicts our findings, these studies did
not use specific diabetes questionnaires whereas the diabetes quality of life instrument is
a specific instrument that does address aspects of physical and social functioning [134]
.
Interestingly, Redekop et al investigated 1162 individuals with type 2 diabetes in
relation to diabetes treatment satisfaction using a specific instrument (Diabetes
Treatment Satisfaction Questionnaire) and found that individuals who reported higher
diabetes satisfaction were older, had lower HbA1c and were not on insulin therapy
compared to individuals who reported lower satisfaction [195]
.
Individuals who were married or cohabitating were more satisfied and had fewer
diabetes related worries. This is also supported by Jacobson who found that individuals
who were not married or cohabitating experienced lower levels of quality of life as
measured by the Diabetes Quality of Life instrument [159]
. Individuals who attended
support groups were more satisfied, had fewer diabetes related worries and felt that their
diabetes did not impact their lives adversely. Attending social support groups increases
networks and therefore might be linked to better access to information such as
diagnosis, management, expectations and possible complications of diabetes which can
lead to more favourable health outcomes [196, 197]
. Individuals who attend such groups

117
might have the opportunity to gain personal advice given by health care professionals or
from their peers who also have diabetes. Although we asked individuals whether they
attended social support groups, we did not measure how they perceived the support.
Despite this, we did find differences in quality of life scores and therefore it might be
possible to speculate that those who attended support groups perceived the support in a
more positive way. Gilden et al found that men with type 2 diabetes that attended
support group sessions had better diabetes knowledge and quality of life [198]
.
Perceived stress was negatively associated with all four DQOL subscales indicating that
individuals who had reported lower perceived stress were more likely to report better
quality of life. As mentioned earlier, stress can have adverse effects on health and in
particular in people with diabetes as it does not only impact physiologically but also
psychologically [127]
. For instance the daily demands of living with diabetes, as well the
constant worry of being at risk of becoming dangerously hyper or hypoglycemic and
also the fears of developing or living with complications, can all be extremely stressful
which can have an adverse impact quality of life.
The stress buffering theory was also tested in this study. It was hypothesised that people
higher in PA would be more resilient to stress and therefore this would result in more
positive outcomes compared to people who have low PA. PA was shown to moderate
the relationship between perceived stress and diabetes impact and offers some support
for Hypothesis 2. Individuals who perceive their diabetes to have impacted their lives
more adversely might be less likely to adhere, have increased stress and develop more
complications. Conversely, people who have higher PA are more likely to accumulate
more positive gains so that when they are faced with a stressor like the negative impacts
of diabetes they are able to use these resources and become more resilient to the stressor
[54, 55].
No interaction effects were found between PA and (i) active coping nor (ii) instrumental
coping on any of the diabetes related factors and therefore do not support Hypothesis 2.
This contradicts previous research which shows coping to be a positive resource in

118
improving health outcomes [129]
. For instance, Tsenkova et al found that coping
strategies are linked to lower HbA1c levels in a non-diabetic population [132]
. In the
present study, this was investigated for the first time in patients with diabetes along with
two further measures; diabetes quality of life and self-care practices. Although coping
strategies were not associated with HbA1c or diabetes quality of life; they were linked
to better engagement to self care practices. People who engaged in active coping
strategies were 5.41 times more likely to exercise for more than five days after
controlling for healthy diet, specific diet, blood glucose testing, body mass index,
positive affect and negative affect.
Generally, problem-focused coping strategies are associated with more successful health
outcomes such that they have been associated with better self-care, glycaemic control
and well-being [199]
. The present study measured active and instrumental support as
ways of coping. These problem solving strategies have the potential to help individuals
manage their diabetes effectively. With epidemic levels of obesity rising [200]
and its
association with insulin resistance, exercise is an important self-care practice that could
help to reduce this.
4.6.1 Limitations
There were some limitations to the study. Firstly, the desired sample size (n = 191) was
not reached. Post hoc power analysis showed that with an alpha set to .05 and with 147
participants who completed the questionnaire, this study had 80% power to detect an
effect size of d = .23. For two of the diabetes related factors (HbA1c (n = 87) and
DQOL social worries (n = 57)), this study had 80% power to detect an effect size of d =
.29 and d = .35.
HbA1c was self-reported and therefore may have posed further limitations; firstly
individuals may not have known this figure and therefore did not report it (n = 60) or
reported it incorrectly. Beard et al recruited 83 individuals to assess their understanding

119
of HbA1c in relation to engaging in self-care practices and reported that only 26.5% of
people had a good understanding of their HbA1c [96]
. Secondly, HbA1c levels fluctuate
over a period of 2-3 months (Diabetes UK); most individuals with diabetes would
normally have their HbA1c tested either every 6 months or once a year (Diabetes UK)
so individuals may not have reported an accurate or up-to-date reading when completing
the questionnaire.
The questionnaire was based on self-reported data and therefore might have been
subjected to response biases. Despite this however, the benefit of self-reporting data is
that it does give us an opportunity to acquire more respondents. However, to investigate
relationships more robustly, studies should try to employ more objective measures.
In this study, PA was investigated at only one time point and also it was not
manipulated; therefore the causal relationship between PA and diabetes related factors
could not be determined. To elucidate the direction of this relationship, it will be
necessary to use interventions designed to increase PA and investigate whether it can
have a beneficial impact on diabetes related outcomes such as HbA1c, self-care
practices and quality of life. This has not yet been explored in a diabetes population.
4.7 Conclusion
These results offer further support to the suggestion that PA is related to certain health
factors in individuals living with diabetes. In summary, this study suggests that people
high in PA are more likely to follow a healthy eating plan and that it might (based on
nearing significance) be linked to better DQOL satisfaction. The study contributes to
the current literature by showing that the relationship between HbA1c and PA does not
appear to be straight forward in people with diabetes and that it may be moderated by
eating a healthy diet.

120
This study investigated the relationship between PA (as measured by PANAS) and
diabetes related outcomes (as measured by HbA1c, self-care practices and quality of
life) in a diabetes population, however, because this study could not determine
causality, the next stage of this research is to employ an experimental design.
.

121
Chapter Five: A six month, randomised control study
to investigate the impact of a positive affect
intervention on health outcomes in people with
diabetes
5.1 Introduction
The results from Chapter 4 indicated that individuals high in PA were more likely to
follow a healthy diet and report better DQOL satisfaction. In addition the study found
that PA moderated the relationship between following a healthy diet and HbA1c such
that individuals higher in PA who reported not following a healthy diet for more than 5
days reported lower HbA1c. However, due to the correlational nature of the study,
causality cannot be determined. Therefore the next stage of this research was to design
a study that experimentally manipulates PA and to investigate the impact on diabetes
related factors as measured by HbA1c, self-care practices and diabetes quality of life.
Ismail et al conducted a systematic review to investigate the effectiveness of
psychological interventions in improving glycemic control in people with type 2
diabetes [201]
. The studies included in this review were all randomised controlled trials
of a psychological intervention. Glycemic control was the main outcome, as well as
blood glucose concentrations, weight and psychological distress which focused on
problems such as depression, binge eating and stress. Interventions that were chosen in
the analysis included cognitive behavioural therapy or a similar strategy to that such as
relaxation, goal setting or self monitoring of behaviours. In addition to this counselling
was also investigated. These interventions were generally compared to usual care,
education or waiting lists. In total there were 12 studies that were reviewed in relation
to HbA1c, 8 were blood glucose related, 9 were weight studies and 5 were related to
psychological distress. The findings showed that psychological interventions resulted
in a .76% reduction in HbA1c. No improvements were found in weight or blood

122
glucose concentrations. However, interventions were effective in reducing
psychological distress. Although there are various psychological interventions being
used, PA interventions have yet to be tested in people with diabetes. As discussed in
chapter 4, PA might be related to some diabetes related factors and therefore
interventions designed to increase PA might be another type of intervention that might
help people with diabetes and therefore should be addressed.
A randomised controlled trial by Pouwer et al [182]
investigated whether monitoring and
discussing psychological well being in addition to standard care, would have an effect
on mood, HbA1c and QoL. Outpatients with diabetes were randomly assigned into one
of two groups; standard care or standard care plus additional monitoring which involved
diabetes research nurses discussing the individuals’ well-being. To evaluate
psychological well-being, the study used a more general questionnaire (as opposed to a
diabetes specific questionnaire) and therefore was unable to address the emotional
aspects of diabetes, such as the fear of hypoglycaemia. Results showed that in addition
to routine standard care, discussing psychological well-being can have an impact on the
mood of patients. However it did not affect HbA1c levels, one possible reason for this
is that the sample population already had relatively good glycaemic control (7.4%) and
therefore may have been unable to detect a significant difference as there was little
room for improvement. This study showed that well-being can be improved through
psychological monitoring, and although the study investigated HbA1c, it did not
investigate the significance of improved well-being on factors such as health practices
and diabetes quality of life.
The studies [60, 61, 63]
that have investigated PA interventions in other chronic conditions
have incorporated both positive affect and self affirmation, which can be defined as
enabling an individuals’ ability to acknowledge past accomplishments that make them
proud [63]
. As reviewed in the introduction in more detail (section 1.2), these studies
investigated medication adherence and physical activity. The findings suggested that
enhancing patient education with a PA intervention could result in more favourable
health outcomes in patients with hypertension and also in patients who have undergone

123
percutaneous coronary intervention (a non-surgical procedure to treat atherosclerosis)
but not for people with asthma.
Although these studies have shown that PA combined with self affirmation can have
favourable effects on health practices, it must be appreciated that it involved many
resources such as telephone calls and gifts over a prolonged period of time. These
interventions can be costly and the feasibility of delivering such interventions might be
difficult to incorporate into a clinical setting. Furthermore it is difficult to distinguish
the specific elements of the intervention to locate what is having the biggest effect
Nevertheless, these studies do add to the growing literature that positive affect
interventions may play a role in promoting health behaviours.
PA interventions have been investigated in relation to health outcomes, however studies
have yet to explore whether PA interventions might serve as a way to improve the
management of diabetes. Therefore the main objective of the study is to see whether a
PA intervention could lead to increases in PA and as a result show improvements in
diabetes related factors such as HbA1c, self-care practices and quality of life.
This study aims to fill the gap in the existing literature by implementing a simple
intervention that has been shown to increase PA and see if it can benefit people with
diabetes. The Three Good Things intervention was used for two specific reasons: first
the intervention has shown long term increases in happiness up to 6 month [57]
, this is an
advantage because trait PA is associated with better health outcomes (see section 1.1).
Secondly, the implementation of this intervention is simple; the instructions are self
explanatory and do not require a facilitator and therefore the cost of implementation is
minimal.
It was hypothesised that (i) participants assigned to the PA intervention (TGT) would
report greater increases in PA following the intervention than participants assigned to
the control exercise and (ii) PA would be associated with lower HbA1c, better
engagement with self-care practices and better diabetes quality of life up to 6 months.

124
In addition, the PA intervention was also investigated in relation to whether or not it
independently affected NA.
5.2 Ethical Approval
The study proposal was submitted to Brighton University Faculty Research Ethics
Governance Committee (FREGC) for review. After approval, it was forwarded to
Brighton and Hove NHS Research Ethics Committee (REC). Brighton and Hove NHS
REC approval was received on 25th
June 2009. The study also required Research and
Development (R&D) approval from Brighton and Hove City Primary Care Trust (PCT)
and this was granted on 27th
August 2009. To maximise recruitment, additional PCTs
were contacted and approval was granted for Hastings and Rother PCT, East Sussex
Downs and Weald PCT and West Sussex PCT on 19th
January 2010 (see appendix C for
all ethical approval letters for this study).
5.3 Methods
5.3.1 Study Design
This was a randomised control study and was conducted in South East England. Data
was collected at five time-points over six months (baseline, 1 week, 1 month, 3 months
and 6 months). Participants were randomised (using the online random allocator
random.org) into one of two independent groups. Participants in the control group were
asked to complete the Early Memories (EM) exercise and participants in the PA
intervention group were asked to complete the Three Good Things (TGT) exercise (see
section 2.5).
Sample Size
Previous studies with non diabetic populations have shown similar interventions to
produce moderate to large effects on measures of PA [3, 57]
and adherence to treatment
[62]. Using a conservative estimate of detecting a moderate effect size (d = .50), an

125
independent samples t-test with a 2-sided 5% significance level and a power of 80%
requires a minimum sample size of 64 people in each of the two conditions (the
intervention group and the control group).
5.3.2 Procedure
Participants were initially recruited through GP surgeries, posters and the Brighton
University intranet. To maximise recruitment, three diabetes clinics were approached in
East Sussex; (i) River Lodge Surgery, (ii) Anchor Field Surgery and (iii) Newick
Surgery.
Figure 5.1 illustrates the study procedure and what information was obtained during the
study. Individuals that consented and were eligible to take part in the study were
instructed to complete various questionnaires at the start of the study (baseline). These
included the Positive Affect and Negative Affect Scale (PANAS), The Summary of
Diabetes Self-Care Activities (SDSCA), Diabetes Quality of Life (DQOL) and the
Profile of Mood States (POMS). Physiological factors that were measured were
HbA1c, blood pressure (BP), weight and height.
Once baseline data was obtained, the instructions to the allocated task (either PA
intervention or control) were given to participants at random and they were instructed to
read them. Participants were then asked to complete the Profile of Mood States again.
The participant took their randomly allocated written task home and completed it for
seven consecutive days. Thereafter, data was collected at five different time-points; at
3 months and 6 months participants were asked to attend their GP surgery. At these
time-points participants completed questionnaires the research student obtained
physiological measures. At 1 week and 1 month, the PANAS and SDSCA were sent to
participants home where they were instructed to complete the questionnaires.
Participants returned the questionnaires using a free post envelope addressed to the
research student. At the end of the study, participants were debriefed about the study.

126
Figure 5.1. Flow diagram of study procedure.
PANAS = Positive Affect and Negative Affect Scale. SDSCA = Summary of Diabetes
Self-Care Activities. DQOL = Diabetes Quality of Life. POMS = Profile of Mood
States. BP = Blood Pressure.

127
5.3.3 Participants
Inclusion eligibility was assessed using a form that included questions about participant
demographics (age, gender) and diabetes related information (duration of diabetes, type
of diabetes) and a question on depression. This was referred to participants as the “You
and Your Diabetes” questionnaire.
People were considered eligible for inclusion in this study if they fulfilled all of the
following criteria, (i) gave written informed consent to take part in the study (ii) had a
diagnosis of diabetes (iii) were over 18 and (iv) had the ability to read and write English
fluently. Personal data for all participants were regarded as confidential. Participant’s
age and randomly assigned experimental number were used as identification and no
individual data was reproduced. The design of the study was aimed at targeting mood,
therefore people who were taking medication to enhance mood or who had a
psychological disorder that was mood related were excluded from the study. People
were not considered suitable for the study if they had (i) experienced, been previously
diagnosed or were having treatment for depression (CBT/medication) (ii) treatment for
any other psychiatric disorders and (iii) serious cognitive problems. At baseline 20
individuals were recruited into each group.
5.3.4 Measures
Mood or Affect
The PANAS was used to measure PA (see section 2.1.1). The time frames selected for
this questionnaire varied according to the time the data was collected. Therefore at
baseline, the time frame used was “generally”, at 1 week the time frame was “in the
past week” at 1 month the time frame used was “in the last month”, at 3 months the
time frame used was “in the last 3 months”, and at 6 months the time frame used was
“in the last 6 months”. The PANAS and POMS were used to assess NA and current
mood states respectively.

128
Diabetes-Related Health Outcomes
The primary measures for this study were HbA1c levels, self-care practices (< 5days or
≥5 days) and DQOL scores (satisfaction, impact, diabetes related worries and social
worries). HbA1c was measured using the BioRad Analyzer (see section 2.4.3). To
assess self-care practices and DQOL, participants were asked to complete the SDSCA
and DQOL respectively (see section 2.2). The time frame used for the SDSCA was “in
the past 7 days”. The time frames used for the DQOL were “currently”, “over the past 3
months” and “over the last 6 months” depending on the time the data were collected.
Demographic Factors
Information on demographic factors were recorded from the “You and Your Diabetes”
form (age, BMI, gender, ethnic background and marital status). Participants were asked
to report on diabetes related factors such as type of diabetes and duration of diabetes. If
medical records (n = 32) were obtained then information regarding medication was
recorded. BP was measured using a calibrated BP monitor (A&D Medical, Compact
Desk Top Monitor, Digital Blood Pressure Monitor, Model No. UA-705) (see section
2.4.1).
5.4 Data Analysis
The statistical software package, PASW Statistics 18 was used for all analyses.
Normality tests were evaluated using the Kolmogorov-Smirnov and Normal Q-Q plots.
Non-parametric tests were used if variables did not show normality after transformation.
For all outcomes a p-value < .05 was considered to be statistically significant.
Descriptive statistics, means, standard deviations, frequencies and percentages were
calculated for all measures between the two independent groups ((i) Three Good Things
(TGT) and (ii) Early Memories (EM).

129
To investigate if the PA intervention had an immediate effect, paired T-tests were
conducted for both groups (before and after) using the scores from the Profile of Mood
States (POMS) subscales.
A two-way ANOVA was conducted to investigate the impact of the PA intervention
(TGT vs. EM) on (i) PA scores and (ii) NA scores across two time-points (baseline vs. 1
week). Repeated measures ANOVA’s were then carried out to investigate the effect of
the PA intervention on the diabetes outcomes (HbA1c, quality of life and self care
practices). Where there was no effect of the intervention, the sample population was
combined and further analyses were conducted to focus on scientific questions that were
generated from the results of Chapter 4. This will involve conducting correlational
analysis to investigate the associations between PA and HbA1c, healthy diet and DQOL
satisfaction across the various time points. Then hierarchical regression to assess the
ability of PA to predict DQOL satisfaction after taking into account the variance
explained in baseline scores and NA.

130
5.5 Results
5.5.1 Sample Characteristics
Forty individuals participated in this study, with 20 in each group. Tables 5.1 and 5.2
list the means (±SD) and percentage distribution for all variables and Table 5.3 presents
the number of individuals that engaged in various self-care practices.
Table 5.1 Descriptive statistics for demographic and diabetes related variables at
baseline
Control: Early
Memories
(n = 20)
PA Intervention: Three
Good Things (n = 20)
p
value
Gender (N = 40)
Male 10 10 1.00
Female 10 10
Marital status (N = 40)
Married/civil partnership 19 10 .019
Other 1 10
Ethnic Background (N = 39)
White/White British 19 19 1.00
Other White background 1 0
Type of Diabetes (n = 39)
Type 1 3 4 1.00
Type 2 16 16

131
Table 5.2 Descriptive statistics for demographic, psychosocial and diabetes related
variables at baseline.
Data represents mean scores (SD)
Control:
Early Memories
(n = 20)
PA Intervention:
Three Good Things
(n = 20)
p value
Age (years) 66.0 (8.31) 68.4 (11.78) .461
Body mass index (kg/m2) 29.82 (6.30) 30.97 (7.54) .603
Mean positive affect 3.59 (.48) 3.34 (.78) .231
Mean negative affect 1.29 (.28) 1.62 (.63) .038
Duration of Diabetes (years)1 7.96 (2.74) 7.78 (2.47) .941
HbA1c (%) 7.0 (.94) 7.64 (1.15) .062
DQOL Satisfaction 77.14 (13.34) 71.75 (15.28) .242
DQOL Impact 80.73 (9.36) 72.56 (10.07) .016
DQOL Diabetes Related Worries 78.09 (14.45) 71.39 (18.70) .228
DQOL = Diabetes Quality of Life 1 Data presented from log values

132
Table 5.3 Percentage of sample engaging in specific self-care behaviours at
baseline.
Data represents the number of individuals and (%)
Control:
Early
Memories
(n =20)
PA
Intervention:
Three Good
Things (n = 20)
p value
Self-care practice (engaged ≥ 5 days)
(N= 40)
Healthy Diet 13 (68.4) 16 (80) .645
Specific Diet 6 (31.6) 9 (47.4) .507
Exercise 6 (30) 11 (55) .201
Blood glucose testing 8 (40.0) 6 (30) 1.00
Feet checks 4 (20.0) 6 (30) .715
Diabetes Treatment (N = 24)
Diet and Exercise 1 1
Oral Medication 7 9
Insulin 1 3
Oral Medication and Insulin 2 0 .376
Taking other medication
Antihypertensive (N = 16) 5 11
Statins (N = 17) 10 7
Anti platelet (N = 3) 0 3
The two groups differed on marital status, baseline NA and baseline DQOL impact,
such that the TGT group had higher NA scores and reported lower DQOL impact at
baseline compared to the control group. A greater proportion of people were found to
be married in the control group.

133
5.5.2 Positive Affect Intervention
The Profile of Mood State questionnaire (POMS) was completed before and after the
instructions to the task was given to the individuals. Table 5.4 shows the mean/median
scores before and after the randomised exercise was given to participants. The PA
intervention showed more statistical reductions in the negative affect states compared to
the control group. There was a reduction in friendliness ratings in the PA intervention
group (see Table 5.4). Although there were some changes in the in the subscales of the
POMS, this questionnaire was not administered after this point and therefore no further
analysis could be conducted in relation to the POMS.
Table 5.4 Comparison of POMS subscales before and after the randomised
exercise was given to participants
Control
Early Memories (n = 20)
PA Intervention:
Three Good Things (n = 20)
Before After Before After
Vigour1 2.38 (.80) 2.49 (.79) 2.28 (.69) 2.17 (.78)
Friendliness1 3.05 (.52) 3.01 (.62) 2.96 (.53) 2.73 (.61)*
Elation1 2.18 (.88) 2.38 (.82) 1.90 (.80) 1.86 (.77)
Anxiety2 -.11 (-.33- .33) -.33 (-.44- -.11)* .28 (-.19- 1.33) -.11(-.33- .83)*
Depression2 .07 (0 - .32) .00 (0- 2.75)* .27 (.10- .80) .20 (.02- 57)*
Anger2 .17 (0- .31) .08 (0- .25) .42 (0- 1.25) .08 (0- .56)*
Confusion1 .08 (.42) -.21 (.23)* .54 (.86) .28 (.74)*
Fatigue1 .90 (.77) .51(.62)* 1.50 (1.09) 1.10 (1.07)*
1 Paired T test, data represent means (standard deviations).
2 Wilcoxon Signed Rank Test, data represent
medians (inter quartile range 25th
and 75th
percentiles).
*p < .05 Vs ‘before’ time-point

134
Positive Affect
Figure 5.2 and Table 5.5 show the mean Positive Affect scores at baseline and the
follow-up time points and the corresponding mixed design ANOVA output respectively.
At 1 week, 1 month and 3 months there was no main effect of time indicating that the
pattern of change in PA scores was the same. However at 6 months, there was a
significant main effect of time (F (1, 22) = 10.51, p = .004, partial eta squared = .32)
such that PA scores were lower at the 6 months interval compared to baseline (baseline
mean = 3.48 SE = .13; 6 month mean = 3.44 SE = .10). There was no main effect of the
PA intervention at any of the specified time points indicating that there were no
differences in PA scores between the two groups.
There were also no significant interaction between the PA intervention and time,
therefore indicating that the pattern of change in PA scores was the same for both the
control group and the intervention group between baseline and the specified time points.
baseline 1 week 1 month 3 months 6 months1
2
3
4
5 Control
PAIntervention
*
Po
sit
ive
Aff
ect
Sco
re
Figure 5.2 Mean Positive Affect scores at each time point in participants from the
PA intervention or the control group.
Asterisks correspond to a statistically significant (p < .05) difference in time between
the specified time point and baseline. Error bars represent standard error of mean;
adjusted for baseline Negative Affect and marital status.
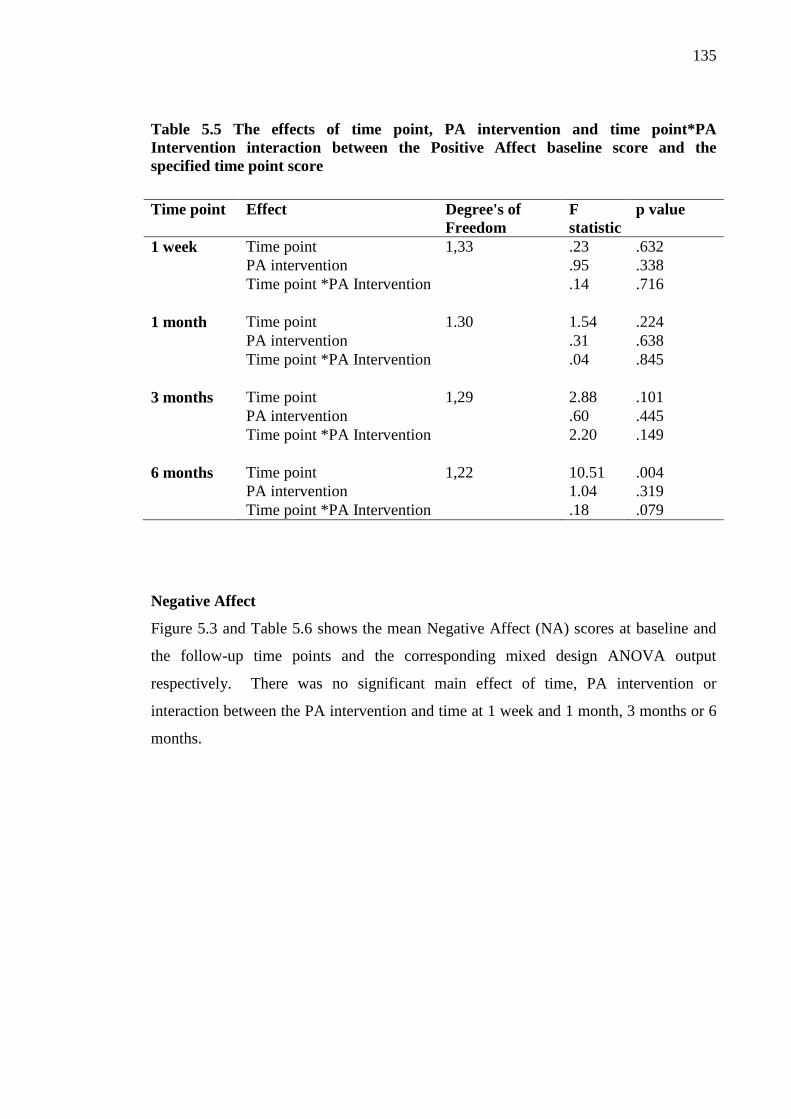
135
Table 5.5 The effects of time point, PA intervention and time point*PA
Intervention interaction between the Positive Affect baseline score and the
specified time point score
Time point Effect Degree's of
Freedom
F
statistic
p value
1 week Time point 1,33 .23 .632
PA intervention .95 .338
Time point *PA Intervention .14 .716
1 month Time point 1.30 1.54 .224
PA intervention .31 .638
Time point *PA Intervention .04 .845
3 months Time point 1,29 2.88 .101
PA intervention .60 .445
Time point *PA Intervention 2.20 .149
6 months Time point 1,22 10.51 .004
PA intervention 1.04 .319
Time point *PA Intervention .18 .079
Negative Affect
Figure 5.3 and Table 5.6 shows the mean Negative Affect (NA) scores at baseline and
the follow-up time points and the corresponding mixed design ANOVA output
respectively. There was no significant main effect of time, PA intervention or
interaction between the PA intervention and time at 1 week and 1 month, 3 months or 6
months.

136
baseline 1 week 1 month 3 months 6 months1
2
3
4
5 Control
PAIntervention
Ne
gati
ve
Aff
ect
Sco
re
Figure 5.3 Mean Negative Affect scores between the PA intervention group and the
control group at each point in time.
Error bars represent standard error of mean; adjusted for marital status.
Table 5.6 The effects of time point, PA intervention and time point*PA
Intervention interactions on Negative Affect baseline score and the specified time
point score
Time point Effect Degree's of
Freedom
F statistic p value
1 week Time point 1,34 .08 .776
PA intervention 1.07 .308
Time point *PA Intervention .01 .919
1 month
Time point
1.31
1.96
.
172
PA intervention 2.97 .095
Time point *PA Intervention .77 .388
3 months Time point 1,30 .24 .627
PA intervention 2.84 .102
Time point *PA Intervention .97 .332
6 months Time point 1,23 .06 .805
PA intervention 1.58 .222
Time point *PA Intervention .35 .560

137
5.5.3 HbA1c
Figure 5.4 and Table 5.7 show the mean HbA1c levels at baseline and the follow-up
time points and the corresponding mixed design ANOVA results respectively. There
was no significant main effect of time at either 3 or 6 months indicating no changes in
HbA1c levels. There was no main effect of the PA intervention at any of the follow-up
time points indicating no differences in HbA1c levels between the intervention and
control group.
There were also no significant interaction between the PA intervention and time,
indicating the lack of change in HbA1c levels was the same for both the control group
and the intervention group between baseline and the specified time points.
baseline 3 months 6 months0
2
4
6
8
10 Control
PAIntervention
Hb
A1
c (%
)
Figure 5.4 Mean HbA1c scores between the PA intervention group and the control
group at each point in time.
Error bars represent standard error of mean; adjusted for baseline Negative Affect and
marital status.

138
Table 5.7 The effects of time point, PA intervention and time point*PA
Intervention interactions on HbA1c and the specified time point score
Time point Effect Degree's of
Freedom
F statistic p value
3 months Time 1,29 1.17 .287
PA intervention 1.07 .309
Time*PA Intervention .56 .462
6 months Time 1,24 1.39 .251
PA intervention 2.49 .129
Time*PA Intervention .35 .560
5.5.4 Self-care practices
A series of Chi-square tests were conducted to see if individuals in the PA intervention
group were more likely to follow self-care practices for more than five days (healthy
diet, specific diet, glucose monitoring, exercise and feet checks).
Figure 5.5a-e shows the percentage of individuals that followed the specified self-care
practice for more than 5 days at each time point. No differences were found between the
PA intervention group and control in following any of the self-care practices at any of
the specified time-points (Chi Square p > .05)

139
baseline 1 week 1 month 3 months 6 months0
20
40
60
80
100 Control
PAIntervention
He
alt
hy D
iet
(%)
Figure 5.5a Percentage of individuals following a healthy diet for more than 5 days
in the PA intervention group and the control group at each point in time
baseline 1 week 1 month 3 months 6 months0
20
40
60
80
100 Control
PAIntervention
Sp
ecif
ic D
iet
(%)
Figure 5.6b Percentage of individuals who avoided high fat foods for more than 5
days in the PA intervention group and the control group at each point in time

140
baseline 1 week 1 month 3 months 6 months
0
20
40
60
80
100 Control
PA
Intervention
Glu
cose
Mo
nit
ori
ng (
%)
Figure 5.7c Percentage of individuals who monitored their glucose levels for more
than 5 days in the PA intervention group and the control group at each point in
time
baseline 1 week 1 month 3 months 6 months0
20
40
60
80
100 Control
PA
Intervention
Ex
erc
ise
(%
)
Figure 5.8d Percentage of individuals following exercise for more than 5 days in
the PA intervention group and the control group at each point in time

141
baseline 1 week 1 month 3 months 6 months0
20
40
60
80
100 Control
PAIntervention
Fe
et
Ch
eck
s (%
)
Figure 5.9e Percentage of individuals following feet checks for more than 5 days in
the PA intervention group and the control group at each point in time.
5.5.5 Diabetes Quality of Life
Figure 5.5 and Table 5.8 show the mean Diabetes Quality of Life Scores (satisfaction,
impact and diabetes related worries) at baseline and the follow-up time points and the
corresponding mixed design ANOVA output respectively. There was no significant
main effect of time at both 3 and 6 months such that there was no difference between
baseline Diabetes Quality of Life Scores for satisfaction, and diabetes related worries
and the specified time points. However, for diabetes impact, there was a main effect of
time at 3 months (F (1, 20) = 4.72, p = .042, partial eta squared = .19) such that diabetes
impact scores increased after 3 months (baseline mean = 78.11 SE = 1.79; 3 month
mean = 78.61 SE = 1.41). However at 6 months, the main effect of time did not remain
significant.
There was no main effect of the PA intervention nor was there a significant interaction
between the PA intervention and time at any of the follow-up time points indicating that
there were no differences in Diabetes Quality of Life Scores (satisfaction, impact and
diabetes related worries) between the intervention and control group.

142
baseline 3 months 6 months0
20
40
60
80
100 Control
PAIntervention
Dia
be
tes
Sat
isfa
ctio
n S
core
baseline 3 months 6 months0
20
40
60
80
100 Control
PAIntervention
*
Dia
be
tes
Imp
act
Sco
re
baseline 3 months 6 months0
20
40
60
80
100 Control
PAIntervention
Dia
be
tes R
ela
ted
Wo
rrie
s S
co
re
Figure 5.10 Mean Diabetes Quality of Life Scores (satisfaction, impact and
diabetes related worries) between the PA intervention group and the control group
at each point in time.
Asterisks correspond to a statistically significant (p < .05) difference between the
intervention group at that point in time and baseline. If no asterisk is shown, the
intervention group and the control group did not differ. Error bars represent standard
error of mean; adjusted for baseline Negative Affect and marital status.

143
Table 5.8 The effects of time point, PA intervention and time point*PA Intervention interactions on Diabetes Quality of Life (satisfaction,
impact and diabetes related worries) baseline score and the specified time point score
Time point Effect Degree's of
Freedom
F statistic p value
Diabetes Satisfaction
3 months Time 1,24 .09 .768
PA intervention .26 .616
Time*PA Intervention .05 .830
6 months Time 1,20 .34 .565
PA intervention .14 .712
Time*PA Intervention .01 .933
Diabetes Impact
3 months Time 1,20 4.72 .042
PA intervention .03 .867
Time*PA Intervention .63 .437
6 months Time 1,17 4.37 .052
PA intervention 1.88 .189
Time*PA Intervention 1.40 .253
Diabetes Related Social
Worries
3 months Time 1,20 .56 .462
PA intervention .41 .528
Time*PA Intervention <.001 .987
6 months Time 1,20 .35 .559
PA intervention .18 .680
Time*PA Intervention .23 .636

144
The above analysis illustrates that there were no significant interactions between the PA
intervention and time-points suggesting that the pattern of change between the two
groups was the same for PA, NA, HbA1c, and quality of life.
For this reason, the two groups will now be combined and the data will be analysed as
one sample (N = 40). This will enable important questions that were raised in chapter 4
to be answered.
Firstly, this study measured HbA1c objectively as opposed to self report (as measured in
chapter 4) and therefore the present study can investigate the relationship between PA
and HbA1c. Secondly the results generated in Chapter 4 did not determine causality
and the data for the study was only collected at one time. Although we will still not be
able to determine causality, we can analyse the data while controlling for baseline
measures as it was collected over a series of time-points.
The next part of this chapter will focus on scientific questions that were generated from
the results of chapter 3. This will further investigate the relationship between PA and
diabetes outcomes. First PA levels will be investigated to see if there are any
differences at the specified time-points and then following questions will be addressed.
1. Is there an association between HbA1c and PA and does baseline PA predict
HbA1c at 3 and 6 months?
2. Does diet moderate the relationship between PA and HbA1c?
3. Does PA predict DQOL satisfaction at 3 and 6 months after controlling for
baseline DQOL satisfaction?

145
5.5.6 Positive Affect
The mean PA scores at baseline for the total sample was 3.47 (SD = .65; min – max =
1.70 – 4.60). Figure 5.11 shows the mean Positive Affect scores for the total sample
population at baseline and the follow-up time points independent of NA. There were no
main effects of time indicating that PA scores stayed fairly stable across the six months.
This shows therefore that PA scores did not change significantly from baseline
throughout the study and therefore PA baseline scores will be use from this point
forward in all analysis.
baseline 1 week 1 month 3 months 6 months0
1
2
3
4
5
Po
siti
ve
Aff
ect
Sco
re
Figure 5.11 Mean Positive Affect scores at each time point for participants taking
part in the study
Error bars represent standard error of mean; adjusted for baseline Negative Affect
5.5.7 Positive Affect, Healthy Diet and HbA1c
The mean HbA1c for the total sample was 7.32% (SD = 1.09; min – max = 5.60 – 9.50).
Seventy four percent of individuals followed a healthy diet for more than five days.
Pearson’s correlations found no associations between PA and HbA1c at baseline, 3
months or 6 months (p> .05). No differences were found between people who followed
a healthy diet and those who did not in their PA levels or HbA1c levels.
As there are no associations between these three variables no further analysis will be
conducted.

146
5.5.8 Positive Affect and Diabetes Quality of Life Satisfaction
DQOL Satisfaction
Table 5.9 shows the correlation coefficients between DQOL satisfaction and affect at
baseline, 3 months and 6 months. At baseline, although no association was found
between PA and DQOL satisfaction, the relationship between PA and DQOL
satisfaction neared significance (p = .064). At 3 months and 6 months, individuals who
had higher PA scores were more satisfied with their diabetes.
Individuals with higher NA scores at all three time-points were less satisfied with their
diabetes.
Table 5.9 Correlation matrix between DQOL satisfaction and affect at baseline, 3
months and 6 months
Baseline (40) 3 Months (28) 6 Months (24)
Positive affect .296 .609** .466*
Negative affect -.357* -.481* -.412*
** p< .001 * p<.05.
Hierarchical multiple regression analysis was used to assess the ability of PA to predict
DQOL satisfaction at 3 and 6 months after taking into account the variance explained by
baseline DQOL satisfaction and NA.
For DQOL Satisfaction at 3 Months; baseline DQOL satisfaction and NA were entered
at step 1, explaining 79.3% of the variance in DQOL satisfaction at 3 months (F (3, 24)
= 30.68, p < .001). PA explained no additional variance in DQOL satisfaction after
controlling for NA and baseline DQOL satisfaction (R squared change < .001, F change
(1, 24) = .04, p = .838).

147
For DQOL Satisfaction at 6 Months; baseline DQOL satisfaction and NA were entered
at step 1, explaining 57.2% of the variance in DQOL satisfaction at 6 months, (F (3, 20)
= 13.60, p < .001). PA explained an additional 10% of the variance in DQOL
satisfaction after controlling for NA and baseline DQOL satisfaction (R squared change
< .001, F change (1, 20) = .6.04, p = .023). This result indicates that baseline PA
provided independent prediction of DQOL satisfaction scores at 6 months.
5.6 Discussion
This study aimed to see if the TGT exercise would increase PA independent of NA in a
diabetes population and to see if this impacted physiological and behavioural health
related measures. In addition, important questions in relation to PA, healthy diet,
HbA1c and DQOL satisfaction that were raised in chapter 4 were also investigated.
The present study found that the PA intervention did not increase PA at 1 week, 1
month or 3 months independent of NA and marital status. This supports the findings of
Chapter 3. Surprisingly, PA scores went down after 6 months; however this decline
was not dependent on the PA intervention and was observed in both groups. In
addition, no differences were found between the PA intervention group and control
group in HbA1c, self care practices, DQOL satisfaction and diabetes related worries
across after adjusting for NA and marital status at all time-points suggesting that these
outcomes for individuals were relatively the same across all time-points. Diabetes
quality of life impact was the only outcome measure that saw an increase after 3
months; however the pattern of change was the same for both groups.
There are a number of reasons which might explain why the PA intervention was not
effective in this study. One of the main reasons is that the sample recruited for this
study exhibited high levels of PA at baseline (3.65) and therefore it is possible that the
PA intervention could not increase PA scores any further. The high levels of PA seen in
this study might also explain the good glycemic control found in this study (mean
HbA1c: control group = 7.0%; PA intervention group = 7.64%). Pouwer et al [182]
recruited individuals with diabetes who had a mean HbA1c of 7.8% in both groups and
similar to the findings of our study, they found no differences in HbA1c between the

148
intervention group and control group after 6 months and 12 months [182]
. In light of
these findings, future studies might want to consider recruiting individuals who have
relatively high HbA1c levels in order to see an effect [182]
.
There are other reasons that might have affected the efficacy of the PA intervention and
should also be addressed. This study was the first to test the TGT intervention in people
with diabetes and therefore it is possible that a simple PA intervention might not be
effective in people with diabetes. Managing a chronic condition such as diabetes
involves adhering to a multi-complex treatment regime and therefore future studies
involving interventions might need to incorporate other elements. For instance,
Moskowitz et al investigated a similar intervention to the TGT intervention in patients
who were newly diagnosed with HIV [202]
. They referred to the written exercise as a
“positive event” where participants were instructed to write down one or more positive
things that happened that day. In addition they were also asked to report how they felt,
what they did in relation to that response and whether they amplified on it. The major
difference from the current study is that the intervention included other components that
were either facilitated or completed at home. In addition the study did not investigate
any health factors and therefore all outcomes were based on self-reported data.
Although the sample size was small (n = 9), the study is interesting because writing
positive events like the TGT might be beneficial in people with a chronic condition but
importantly, Moskowitz et al highlights that it might not be effective on its own and
therefore future studies might want to investigate a combination of PA inducing factors
as opposed to only one.
The relatively high levels of PA seen in this sample population may have influenced the
results by introducing a ‘ceiling effect’. If individuals have high PA scores prior to the
intervention, then it can be extremely difficult to demonstrate any positive effects of the
intervention. For this reason, future studies should consider recruiting individuals with
low PA by using a screening questionnaire prior to a person consenting to the study. To
further investigate whether the effect was down to the study population having diabetes,
multiple interventions could be tested [202]
or a specific intervention that is tailored to a
specific chronic condition [60, 61, 63]
as opposed to more generic based intervention as
used in the present study.
149
The PA intervention had no effect on the diabetes related measures and therefore the
sample population was combined. No differences were found in PA scores across the
specified time-points when the sample was studied as a whole. The study showed that
PA levels at baseline were predictive of DQOL satisfaction up to six months later
independent of NA; however no associations were found between PA, HbA1c and
healthy diet in people with diabetes.
In contrast to Chapter 4, the present study found no associations between HbA1c, PA
and healthy diet. The relationship between diet and HbA1c was not anticipated as
previous studies have shown that engaging in a healthy diet is associated with lower
HbA1c [191]
. Engaging in self-care activities is an integral part of the successful
management of diabetes. Although, this study did not find any associations between PA
and self-care practices, over 70% of people reported engaging in a healthy diet and
therefore this level of adherence suggests that we may have recruited a more adherent
group. Although. previous studies have not reported as high rates of adherence to diet,
in comparison our findings are consistent with other studies on poor adherence rates to
other self-care practices [80]
[132]
[203]
.
The non significant associations found between PA, diet and HbA1c might indicate that
the variability of these outcomes were restricted and therefore it would be difficult to
detect an association. This is partly because of the small sample size and partly because
the majority of respondents reported being more adherent, had higher PA scores and
relatively good glycemic control.
We found that PA predicted DQOL satisfaction at 6 months. This result shows that
even after controlling for baseline DQOL satisfaction, PA was predictive of DQOL
satisfaction. This finding provides strong evidence that PA might contribute to better
quality of life in terms of DQOL satisfaction in people with diabetes over time.
Furthermore, this result was independent of NA and therefore provides further support
that PA and NA are independent.

150
5.6.1 Limitations
There are several limitations to the methodology of this study which must be considered
when interpreting the results of this study. Recruitment was a major limitation; at the
time of planning this study, the required sample size was 64 people in each of the two
conditions, however recruitment was very challenging. Between August 2009 and
August 2010, only six participants were recruited and this was why additional PCTs
were approached for approval. Although all GP surgeries and pharmacies were sent a
letter regarding the study, the response rate was less than 1%. In addition, during the
initial stages of recruitment, there was an outbreak of swine flu and thereafter severe
weather became a hindrance. Many GP’s and pharmacies quoted these as reasons for
not participating. Despite this, some GP surgeries were willing to help, however, they
requested that information should be sent out to eligible participants on their behalf as
access to patient details was not authorised. For this to happen, an additional document
was produced by the researcher which required NHS and R&D approval through a
substantial amendment. In order to increase participant numbers, it was decided by the
research team to (i) reduce the original study from 18 months to 6 months, (ii) reduce
the number of outcome measures and (iii) get permission to approach potential
participants at GP surgeries and take measurements on site. This amendment received
approval on 23rd
June 2010. For the reasons above, the anticipated sample size required
for this study was not reached and therefore this will have reduced the power to detect
significant associations. Furthermore, it is less likely to find significant relationships in
the data especially when the effect sizes are small.
In addition, there was a substantial attrition rate such that of the forty participants who
completed baseline measures, only twenty-six (65%) completed the entire study. It is
possible that the final sample differed in some important way from the initial sample,
however, individuals who dropped out of the study did not differ from those who
remained in the study at baseline on any measured factors (all baseline characteristic p >
.05).
Patients who had a psychological disorder that was mood related were excluded from
the study. This was intentional, firstly because we did not want medication or

151
psychological treatments influencing the results and secondly we wanted to investigate
the effects of the intervention first, on people with diabetes without depression.
This study shows that the intervention might not be effective in people with high PA.
We did not anticipate seeing such high levels of PA, partly because in comparison to
previous literature PA scores were much lower and partly because diabetes is a chronic
condition, so although people might not have a psychological disorder, we assumed that
their affect would be lower. Therefore based on these reasons we hypothesised that an
intervention might have an effect on PA scores in people with diabetes.
There is evidence to suggest that the TGT intervention does alleviate depressive
symptoms and therefore it will be interesting to extend this research by investigating a
diabetes population that is depressed. Studies that have investigated diabetics with
depression have shown to have significantly higher levels of HbA1c (> 8%) [204, 205]
which would address the issue of recruiting people who already have good glycemic
control.
Compliance to the PA intervention for the full seven days was not monitored and
therefore we cannot confirm the effectiveness of the PA intervention. In an attempt to
avoid on the Hawthorne effect [86]
, we did not want our study participants to think that
because we were recording their behaviour, they were required to report in a certain
way. On the contrary, individuals were informed about the study and understood that
they would have to complete a written task for ten minutes for seven days and therefore
if they were not prepared to commit to the study; it is likely that they would not have
consented to the study.
To keep the burden of respondents to a minimum, the study did not measure other
important variables that may have influenced the relationship. Adaptive factors such as
coping strategies and social support may have a crucial role in the mediating the link
between PA and diabetes measures, however the present study did not incorporate them.
Despite this, it would have been difficult to carry out more complex analysis as the
sample size was extremely small.

152
The study population represents a convenience sample of adults who were
predominantly white British from 3 surgeries in Lewes. Therefore additional studies are
needed to represent other diabetes populations as the intervention may have shown
some effect. It might be interesting to recruit people with diabetes who have mild
depression as the TGT intervention has shown to alleviate depressive symptoms. The
prevalence of depression in people with diabetes is high and this can have a negative
impact on diabetes management [91, 114]
.
5.7 Conclusion
The novelty of this randomised control study was evident in that it was the first to
investigate a PA intervention (TGT) in a diabetes population and investigate outcomes
such as HbA1c, self-care practices and quality of life. The study found that the TGT
exercise did not affect PA scores over 6 months. In addition, no differences were found
between the PA intervention and control groups in diabetes related measures.
This study was also able to analyse the relationship between PA and diabetes related-
outcomes by following the sample population longitudinally and found that PA was
only predictive of diabetes satisfaction up to six months. More investigation into the
design of PA interventions is needed for people with diabetes.
In summary, this study has investigated the relationship between PA and health
outcomes and the impact of a PA intervention. The results generated throughout this
thesis will now be discussed in chapter 6 collectively with particular focus on the novel
contributions and the future directions.

153
Chapter Six: General Discussion
The research conducted in this thesis fills a gap in existing knowledge because, despite
there being a growing body of literature to suggest that PA is associated with better
health outcomes in a number of chronic conditions [2, 9]
, there are no studies that have
investigated a PA intervention in people with diabetes.
The original aims of this thesis were to test the stress-buffering hypothesis of PA using
an experimental design, to test the association between PA and health outcomes in
people living with diabetes, and to test the effectiveness of a simple intervention to
improve PA in people with diabetes. This thesis contributes to the existing literature in
three main ways:
i. by testing the stress-buffering hypothesis using a experimental manipulation of
PA
ii. by investigating the association between PA and health-outcomes in people with
diabetes
iii. by investigating the efficacy of a PA intervention in both diabetes and non-
diabetes populations on subjective and objective health outcomes
This chapter will now conclude as follows. It will summarise the main findings from
each study and then it will discuss (i) the methodological limitations of the studies; (ii)
the efficacy of PA interventions; (iii) the stress-buffering model of PA; (iv) the role of
PA in people with diabetes; and finally (v) the implications and future directions of this
research.

154
6.1 Summary of Main Findings
6.1.1 Impact of the TGT intervention on reactions to stress (Chapter 3)
The TGT intervention maintained PA levels after one week compared to the control
group where they significantly decreased. The stress manipulation did elicit a stress
response at visit one and visit two. No changes were observed in DBP/HR reactivity
and DBP/HR recovery between the two visits. Differences were observed however in
SBP reactivity over the two visits, but were not dependent on the PA intervention. SBP
recovery was slower for individuals in the PA intervention group following the one
week interval. No changes were found in how individuals perceived the stressfulness of
the tasks between the two visits.
6.1.2 The relationship between PA and diabetes health outcomes (Chapter 4)
No direct association was found between PA and HbA1c. However, when analysed
further, ‘following a healthy diet’, was found to moderate the relationship between PA
and HbA1c such that PA predicted HbA1c in participants who reported not following a
healthy diet but did not in people who did. Higher levels of PA were associated with
lower levels of HbA1c in participants who reported not following a healthy diet.
Additionally, individuals higher in PA were twice as likely to adhere to a healthy diet
independent of exercise, avoiding high fat foods and instrumental coping. This
relationship, however, was not independent of NA. Individuals who adhered to a
healthy diet and avoided high fat foods had lower HbA1c. A significant relationship
between PA and diabetes quality of life was found such that individuals higher in PA
had better DQOL satisfaction and fewer diabetes related worries. Hierarchical
regression analysis showed that the relationship between PA and DQOL satisfaction
reached near significance independent of type of diabetes, age, BMI, marital status, NA,
perceived stress, depression and smoking status, instrumental coping, attending support
groups, DQOL diabetes worries and DQOL impact. PA levels moderated the
relationship between perceived stress and DQOL impact.

155
6.1.3 Impact of a PA intervention in people with Diabetes (Chapter 5)
The PA intervention did not affect PA levels in participants with diabetes. There were
no significant interaction effects of time and PA on diabetes related outcome measures
indicating that the pattern of change in diabetes related outcome measures was the same
for both the control group and the intervention group. In combining the sample
population, PA predicted DQOL satisfaction up to 6 months after controlling for
baseline DQOL satisfaction and NA. No link was found between PA, healthy diet and
HbA1c.
6.2 Methodological Limitations
There are a number of limitations that need to be considered when interpreting the
findings of these studies. Firstly, in Chapter 5, the actual sample size that was recruited
at baseline for each group was 20. Post hoc power analysis showed that with an alpha
set to .05 and 20 participants in each group, this study had 80% power to detect an
effect size of d = .91. In contrast, Chapter 3 was adequately powered; however it still
failed to detect an effect of the TGT intervention. In Chapter 4, the a priori sample size
calculations specified a required sample size of 191. Post hoc power analysis showed
that with an alpha set to .05 and with 147 participants who completed the questionnaire,
this study had 80% power to detect an effect size of d = .23. For two of the diabetes
related factors (HbA1c (n = 87) and DQOL social worries (n = 57)), this study had 80%
power to detect an effect size of d = .29 and d = .35.
Recruitment was voluntary in all of the studies and this might have had some bearing on
the type of person that would have participated. Participants that voluntarily take part in
studies tend to be more motivated and interested in the study itself [3]
which might
explain why we saw high levels of PA in all of our studies.
The studies reported in Chapters 3 and 5 did not measure whether individuals completed
the intervention tasks for the week. This was intentional, partly to avoid a Hawthorne
effect where the study participants change their behaviour simply because they think
that someone is watching them [86]
, and partly to mimic what might occur in primary

156
care setting where it would be difficult to follow up patients advised to follow a simple
intervention. Additionally, knowledge that the note-books were to be collected may
have increased attrition to the task or the study. The downside of this is that we cannot
say for certain whether participants did complete the TGT intervention or not. However,
individuals were asked whether everything was ok in completing the written tasks and
in response, none of the participants reported having any problems.
Our studies utilised self-report questionnaires to measure behavioural and psychosocial
factors as well as some physiological factors. Self-report measures can be criticised for
being open to bias. To overcome this, only questionnaires that had demonstrated
reliability and validity were used. We also tried to address this issue by measuring
objective markers such as HbA1c which is known to correlate with better diabetes
management. By introducing these measures, it meant that participants were asked to
visit their local surgery thus increasing participant burden which might also explain the
small sample size recruited in Chapter 5. We used the PANAS to measure PA
independently from NA. Although this questionnaire has been criticised for memory
recall and the influence of current mood state [9]
, the participant burden of other
methods to measure PA such as Ecological Momentary Assessment (EMA) and Positive
Emotional Style (PES) may impede the research. Furthermore, it cannot measure both
PA and NA at the same time and therefore if we had used any of these methods we
would have had to use another instrument to measure NA thus increasing participant
burden.
Although it was our intention to investigate a causal link between PA and health
outcomes, the PA intervention used in Chapters 3 and 5 did not increase PA.
Nevertheless, we were still able to investigate two clear groups as opposed to
performing a median split to compare high and low PA in Chapter 3 and in Chapter 5;
we were able to investigate the effects of PA longitudinally in people with diabetes.
In Chapter 5, we recruited people from one specific area which meant recruitment was
restricted to a sub population. As a consequence, we were unable to explore the effect of
the intervention in a diverse population with diabetes.

157
6.3 Efficacy of Positive Affect Interventions
Chapters 3 and 5 provided novel contributions to the current literature through
investigation of a PA intervention on diabetes related measures (HbA1c, self-care
practices and quality of life) and also on cardiovascular measures (reactivity and
recovery). Previous research has suggested that such interventions are beneficial in
increasing well-being [3, 57, 58]
and that well-being is linked to better health [2, 50]
.
Whilst there has been minimal research in demonstrating this link, no studies have been
conducted in a diabetes population.
The findings from our studies suggest that a simple intervention administered alone was
not effective in increasing PA. This contradicts previous research which has shown the
same intervention to increase happiness and decrease depression for up to six months
[57]. One explanation for this is that the high levels of PA seen in the samples for
Chapters 3 and 5 may have dampened the efficacy of the TGT intervention. Therefore,
as opposed to the results of the studies showing that TGT intervention is not effective in
increasing PA, the results might indicate a “ceiling effect” where the scores are so high
on the scale that there is little room for improvement. This would suggest that the TGT
intervention may still be beneficial for individuals lower in PA.
Indeed, the TGT intervention was originally first tested in people who were mildly
depressed [57]
and significant improvements were found in levels of happiness and
depression. Based on a ratio calculation, as the maximum score for the PANAS is 5 and
for the Steen Happiness Scale (SHI) is 10, our study samples exhibited higher levels of
PA (6.6) at baseline compared to the Seligman et al study where participants scored on
average, 5.6 at baseline. In addition, Sin and Lyumbursky found in a meta-analysis of
4235 participants that people who were depressed experienced more increases in well-
being and reductions in depression compared to people who were not depressed. They
discuss this in relation to a possible “floor effect” where depressed people have more to
gain from the intervention.
We used the PANAS to measure changes in PA and NA whereas; Seligman et al used
the SHI to measure changes in happiness. The SHI is extremely sensitive to changes in
happiness and this is highly probable because this questionnaire measures happiness

158
using a scale that ranges from extreme sadness to neutral to extreme happiness [14]
. The
PANAS however uses a ‘not at all’ to ‘extreme’ response format which is another
reason to why we may have not seen an immediate effect.
An alternative explanation for the lack of effect found of the intervention is that the
demographic of the samples used for the current studies differed in some important
ways from the samples used in published studies finding an effect. For instance, Sin and
Lyumbursky report that the benefits of positive interventions correlate with age such
that older individuals are more likely to benefit more from PA interventions compared
to the younger population. Thus we would expect the intervention to be less beneficial
in a sample with a young mean age. However, the PA intervention did not affect our
diabetes population who had a mean age of 65 years.
PA interventions promote positive feelings and behaviours, rather than directly focusing
on the negative consequences. Interventions designed to increase PA have been
associated with both physiological and psychological health measures [3, 60, 61, 63]
.
Individuals can vary in strengths, interests and preferences and therefore we must also
appreciate that individuals might find certain interventions more effective than others
and therefore more work is needed to see if PA interventions more generally can be
effective on health outcomes.
6.4 The stress-buffering model
One of the original aims of this thesis was to test the stress-buffering model of PA [2]
.
According to the model, people with higher levels of PA respond better to stress and
thus do not experience the negative health consequences that have been linked to stress
[2]. Our studies extended previous research in two ways. Firstly, by testing the effect of a
PA intervention on reactions to stress; and secondly, by testing the model in a diabetes
population.
The results reported in Chapter 3, showed that following the intervention, participants
who had been assigned to the TGT intervention had significantly higher levels of PA
than those assigned to the control condition. Despite this, no significant differences

159
were observed between the groups in their reactivity to the stress task. This does not
provide support for the stress-buffering model and contradicts other research which has
shown people higher in PA to react better to stressful tasks [20, 24, 39, 42, 46, 48, 49]
. These
contradictions in findings may be due to variations in the measurements of PA or the
tasks used to elicit stress. Steptoe et al found that EMA-derived measures of PA were
associated with lower BP reactivity and more rapid recovery following a stress-task but
PANAS-derived scores were not [46]
. EMA-derived measures provide multiple
measures of affect that are derived within or between days [9]
.
In chapter 4, we found that high levels of PA dampened the effect of perceived stress on
diabetes quality of life impact. This subscale addressed questions such as “pain
associated with treatment” “feeling physically ill” and general restrictions to daily life.
A poor diabetes impact quality of life score might lead to poorer adherence to
treatments which could potentially increase the risk of developing complications. We
found that in people who had PA levels greater than 3, the relationship between stress
and quality of life was less strong. This is interesting because the mean participants PA
levels in all of the other studies were greater than 3 and therefore this might be a reason
why we did not find a link between PA and certain health outcomes.
Overall, our studies failed to provide support for the stress-buffering model but this may
be due to individuals participating in our studies having high levels of PA. Another
explanation might be that in response to stress (Chapter 3), individuals perceived the
tasks as a challenge as opposed to a threat. The broaden and build theory suggests that
positive emotions such as joy and excitement have the ability to broaden a person’s
thinking and as a result this would build resources such as positive psychosocial factors
to overcome challenges [187]
. The slower recovery found in SBP for people in the TGT
group might suggest that it was because they had higher PA and therefore, reacting to
the stressor as a challenge even though they were in the recovery period. It is possible
that the slower recovery might be because of other factors, however if this was the case,
then perceived stress scores at the end of the study could have possibly been higher.

160
6.5 Positive Affect and Diabetes Mellitus
The studies reported in Chapters 4 and 5 were among the first to investigate the
relationship between PA and (i) HbA1c (ii) self-care practices and (iii) quality of life in
people with diabetes. Furthermore, they contribute to existing knowledge by
investigating the relationship between PA and (i) HbA1c and healthy diet (ii) DQOL
satisfaction and (iii) diabetes related worries using a longitudinal study design in people
with diabetes.
The main findings presented in Chapter 4 were not replicated in Chapter 5. The only
exception was DQOL satisfaction where we found that PA reached near significance in
predicting diabetes quality of life satisfaction in the cross-sectional study (Chapter 4)
and predicted DQOL satisfaction up to 6 months in the longitudinal study (Chapter 5).
Studies have reported that individuals with diabetes have lower quality of life compared
to the general population. Testa et al found that increases of HbA1c greater than 1%
was linked to a decrease in quality of life [206]
. Poor quality of life can lead to lack of
engagement towards self-care practices which can then impact the management of the
condition. Diabetes quality of life satisfaction was measured using the DQOL
instrument and addressed issues such as satisfaction to sleep, flexibility, time spent
exercising, social relationships and life in general. All of these items indicate how
satisfied the individual is in managing their condition. The findings here support
previous research that has demonstrated a link between PA and health related quality of
life in other chronic conditions [207]
.
No association was found between PA and HbA1c in the present studies. This
contradicts previous research that has established a link between the two in non-diabetic
women [132]
. As mentioned, throughout this discussion, PA levels were high among the
participants for our studies compared to other published literature. Additionally HbA1c
levels were relatively low in the diabetes samples and therefore the restricted variability
in PA levels and HbA1c levels may explain the lack of relationship found between the
two.

161
Tsenkova et al reported that the sample recruited for their study had HbA1c levels of
5.34% at baseline and found that PA was a significant predictor of lower HbA1c over
two years [132]
. In comparison, as expected, our samples mean HbA1c was higher
(Chapter 5 = 7.32%), however we found no association between PA and HbA1c over
time. Furthermore, Tsenkova et al also investigated coping strategies and found that PA
moderated the relationship between problem focused coping strategies and HbA1c.
However, our study (Chapter 4) showed no associations between coping style, PA and
HbA1c. Generally, problem focused coping strategies have been linked with better
adjustment and lower distress in people with diabetes [166, 184]
. We discussed in our
studies that PA showed no relationship with HbA1c because our samples had good
glycemic control at baseline. However, Tsenkova et al [132]
, also report low levels of
HbA1c in their sample and do report an association with PA. Factors that are more
diabetes specific might impede HbA1c in people with diabetes such as type of diabetes,
duration and treatment and medication regime. Indeed ‘following a healthy diet’ was
found to moderate the PA/HbA1c relationship.
One final explanation for the lack of relationship found in a diabetes population is that
the strength of the association between PA and health is less strong in diseased
populations [30]
. While previous literature has shown a link between PA and health [2]
,
some studies suggest that the link may be stronger in healthy populations than diseased
ones [30]
.
6.6 Implications and Future Research
Research has shown that PA can be beneficial in predicting better health outcomes [2, 9]
,
however, many of these studies have investigated the relationship using both cross-
sectional and longitudinal study designs. Pressman and Cohen proposed two theoretical
models [2]
linking PA to health (see Figures 1.1 and 1.2). Although, these models
suggest a causal pathway, many studies fail to incorporate an experimental
methodology. This thesis contributed to existing knowledge by attempting to design
studies that could determine a causal link between PA and health outcomes in people
with diabetes. The findings highlight that the link between PA and health outcomes

162
might not be seen in people who already exhibit high levels of PA. Based on this, our
studies were unable to demonstrate causality, however future studies could potentially
use our study design on different study populations incorporating a more extensive PA
intervention. Furthermore, because of the high levels of PA seen in all of our studies,
future studies should consider incorporating a screening questionnaire that assesses
individuals PA scores and anyone above a certain affect level be excluded.
We did not measure compliance to the PA intervention; however, it would be beneficial
to know whether participants actually completed the exercises, while allowing them to
feel like they are not being judged. A possible solution might be to instruct individuals
to complete the tasks online. An investigator can then monitor if they have completed
the task without access to the written content.
Both of our diabetes studies were underpowered. To address the issue of recruitment,
future studies should consider increasing the catchment area. For instance, by
expanding the recruitment area, it will not only increase the sample population but more
importantly it might increase the diversity of people that participate which unfortunately
is where this study came short of.
Both of the diabetes studies were advertised to people with type 1 or type 2 diabetes.
The prognosis and management of type 1 and type 2 diabetes differ and therefore future
studies might want to consider only recruiting people with either type 1 or type 2
diabetes.
Chapters 3 and 5 used a PA intervention that was simple, cost effective and easy to
implement. Diabetes is a chronic condition that involves a complex treatment regime
and therefore the objective was to use a PA intervention that does not add to the burden
of the condition. However, the results of that study highlighted that the PA intervention
might need to be tested in diabetics with low PA or that it might need to be more
specifically tailored. For instance, Charlson et al designed a PA intervention that was
based on quantitative and qualitative methodologies [59]
. The methodology incorporated
both self affirmation and positive affect and this showed favourable effects in people
with a chronic condition [59]
. It would be interesting to recruit people with diabetes and
follow Charlson et al methodology [59]
.

163
Chapters 3 and 5 excluded people who had a psychological disorder that was mood
related. This was intentional, firstly because we did not want medication or
psychological treatments influencing the results and secondly we wanted to investigate
the effects of the intervention first, on people with diabetes without depression. This
thesis has demonstrated that the intervention might not be effective in people with high
PA. We did not anticipate seeing such high levels of PA, partly because in comparison
to previous literature PA scores were much lower and partly because diabetes is a
chronic condition, so although people might not have a psychological disorder, we
assumed that their affect would be lower. Therefore based on these reasons we
hypothesised that an intervention might have an effect on PA scores. There is evidence
to suggest that the TGT intervention does alleviate depressive symptoms and therefore it
will be interesting to extend this research by investigating a diabetes population that is
depressed. Studies that have investigated diabetics with depression have shown to have
significantly higher levels of HbA1c (> 8%) [204, 205]
which would address the issue of
recruiting people who already have good glycemic control.
Although not inevitable, the onset of diabetes complications is not foreseen at the start
and individuals are more likely to develop complications as the condition progresses,
therefore quality of life might worsen as the duration increases. Our studies found that
PA is predictive of DQOL satisfaction up to six months and therefore future studies
might want to investigate patients who have diabetes complications and see whether PA
buffers the relationship between quality of life and complications. People who have
developed complications are more likely to have lower quality of life but if PA buffers
this relationship, it can potentially reduce cost as people higher in PA should be more
satisfied with their diabetes and therefore are more likely to physically feel better and
motivated to look after themselves compared to people who have low PA.
Chapter 3 used a laboratory stressor to elicit a stress response in healthy participants.
Goetsch et al investigated blood glucose levels in responses to laboratory stressors in
people with diabetes [208]
. This study recruited 22 individuals with diabetes and 9
people without diabetes. The results of this study found significant increases in blood
glucose levels in response to stress compared to people without diabetes, however this
study did not measure mood and in particular PA. With growing evidence suggesting

164
that PA is linked to biological measures in response to stress, future studies might want
to investigate whether PA dampens the effect of stress on blood glucose levels in people
with diabetes.
The Positive Affect and Negative Affect Schedule (PANAS) is a widely used
instrument and it was used in this thesis to measure PA independently from NA. The
method in which PA is measured as well as the independence of PA and NA has come
under some scrutiny (see section 2.1.1), however the PA intervention used in this thesis
supported that PA and NA are independent using the PANAS. For instance, in Chapter
3, we were able to conclude that the PA intervention affected PA scores but not NA
scores after the one week interval (see figures 3.2 and 3.3). It is important that the
current literature does investigate the PA independently from NA as it highlights and
provides a strong basis that PA is not the bipolar opposite but an independent dimension
in predicting favourable health.
6.7 Conclusion
The objective of this research was to contribute to the existing literature by investigating
the role of PA in people with diabetes. The randomised control studies that were
implemented in this thesis were amongst the first to use an intervention designed to
increase PA and investigate the impact on health outcomes such as HbA1c, self-care
practices, quality of life and CV reactivity and recovery.
The results of this thesis found that the TGT intervention might not be as effective in
people with high PA and therefore to test efficacy of the TGT intervention on health
outcomes further, people who exhibit lower levels of PA or who exhibit depressive
symptoms should be recruited.
The results also showed that PA might be linked to better diabetes-related outcomes
(healthy eating and diabetes quality of life) but not to CV reactivity and recovery. The
relatively high levels of PA seen in volunteers participating in these studies may have
influenced the results.

165
The role of PA in health outcomes is an interesting area of research that is evolving.
However, as much of the literature is based on studies that are cross-sectional or
prospective in design, a shift towards the set up of experimental study designs, as
demonstrated in this thesis, needs to be implemented to investigate the causal link
between PA and health outcomes.

166
References
1. Diener, E. and M.Y. Chan, Happy People Live Longer: Subjective Well-Being
Contributes to Health and Longevity. Applied Psychology: Health and Well-
Being, 2011. 3(1): p. 1-43.
2. Pressman, S.D. and S. Cohen, Does Positive Affect Influence Health?
Psychological Bulletin, 2005. 131(6): p. 925-971.
3. Sin, N.L. and S. Lyubomirsky, Enhancing well-being and alleviating depressive
symptoms with positive psychology interventions: a practice-friendly meta-
analysis. Journal of Clinical Psychology, 2009. 65(5): p. 467-487.
4. International Diabetes Federation. 5th edn ed. IDF Diabetes Atlas. 2011,
Belgium: International Diabetes Federation.
5. DiMatteo, M.R., H.S. Lepper, and T.W. Croghan, Depression is a risk factor for
noncompliance with medical treatment: meta-analysis of the effects of anxiety
and depression on patient adherence. Arch Intern Med, 2000. 160(14): p. 2101-
7.
6. Lustman, P.J. and R.E. Clouse, Depression in diabetic patients: The relationship
between mood and glycemic control. Journal of Diabetes and its Complications,
2005. 19(2): p. 113-122.
7. King, S.L. and K.M. Hegadoren, Stress hormones: how do they measure up?
Biol Res Nurs, 2002. 4(2): p. 92-103.
8. Berges, I.M., G. Seale, and G.V. Ostir, Positive affect and pain ratings in
persons with stroke. Rehabil Psychol, 2011. 56(1): p. 52-7.
9. Steptoe, A., S. Dockray, and J. Wardle, Positive affect and psychobiological
processes relevant to health. J Pers, 2009. 77(6): p. 1747-76.

167
10. van den Broek, K.C., F.B. Tekle, M. Habibovic, M. Alings, P.H. van der Voort,
and J. Denollet, Emotional distress, positive affect, and mortality in patients with
an implantable cardioverter defibrillator. Int J Cardiol, 2011.
11. Watson, D., L.A. Clark, and A. Tellegen, Development and validation of brief
measures of positive and negative affect: The PANAS scales. Journal of
Personality and Social Psychology, 1988. 54(6): p. 1063-1070.
12. Mayne, T.J., Negative affect and health: The importance of being earnest.
Cognition & Emotion, 1999. 13(5): p. 601-635.
13. Feldman Barrett, L. and J.A. Russell, The Structure of Current Affect:
Controversies and Emerging Consensus. Current Directions in Psychological
Science, 1999. 8(1): p. 10-14.
14. Russell, J.A. and J.M. Carroll, On the bipolarity of positive and negative affect.
Psychological Bulletin, 1999. 125(1): p. 3-30.
15. Polk, D.E., S. Cohen, W.J. Doyle, D.P. Skoner, and C. Kirschbaum, State and
trait affect as predictors of salivary cortisol in healthy adults.
Psychoneuroendocrinology, 2005. 30(3): p. 261-272.
16. Denollet, J., Emotional distress and fatigue in coronary heart disease: the
Global Mood Scale (GMS). Psychol Med, 1993. 23(1): p. 111-21.
17. Radloff, L.S., The CES-D Scale: A Self-Report Depression Scale for Research in
the General Population. Applied Psychological Measurement, 1977. 1(3): p.
385-401.
18. Stone, A.A. and S. Shiffman, Ecological momentary assessment (EMA) in
behavorial medicine. Annals of Behavioral Medicine, 1994.
19. Moskowitz, D.S. and S.N. Young, Ecological momentary assessment: what it is
and why it is a method of the future in clinical psychopharmacology. J
Psychiatry Neurosci, 2006. 31(1): p. 13-20.

168
20. Bostock, S., M. Hamer, A.J. Wawrzyniak, E.S. Mitchell, and A. Steptoe,
Positive emotional style and subjective, cardiovascular and cortisol responses to
acute laboratory stress. Psychoneuroendocrinology, 2011. 36(8): p. 1175-1183.
21. Cohen, S. and S.D. Pressman, Positive Affect and Health. Current Directions in
Psychological Science, 2006. 15(3): p. 122-125.
22. Danner, D.D., D.A. Snowdon, and W.V. Friesen, Positive emotions in early life
and longevity: Findings from the nun study. Journal of Personality and Social
Psychology, 2001. 80(5): p. 804-813.
23. Matthews, K.A., S. Zhu, D.C. Tucker, and M.A. Whooley, Blood Pressure
Reactivity to Psychological Stress and Coronary Calcification in the Coronary
Artery Risk Development in Young Adults Study. Hypertension, 2006. 47(3): p.
391-395.
24. Steptoe, A., J. Wardle, and M. Marmot, Positive affect and health-related
neuroendocrine, cardiovascular, and inflammatory processes. Proc Natl Acad
Sci U S A, 2005. 102(18): p. 6508-12.
25. Steptoe, A. and J. Wardle, Positive affect and biological function in everyday
life. Neurobiology of Aging, 2005. 26(1, Supplement 1): p. 108-112.
26. Moskowitz, J.T., E.S. Epel, and M. Acree, Positive affect uniquely predicts
lower risk of mortality in people with diabetes. Health Psychology, 2008. 27(1):
p. S73-S82.
27. Xu, J. and R.E. Roberts, The power of positive emotions: it's a matter of life or
death--subjective well-being and longevity over 28 years in a general
population. Health Psychol, 2010. 29(1): p. 9-19.
28. Steptoe, A. and J. Wardle, Positive affect measured using ecological momentary
assessment and survival in older men and women. Proceedings of the National
Academy of Sciences, 2011.

169
29. Krijthe, B.P., S. Walter, R.S. Newson, A. Hofman, M.G. Hunink, and H.
Tiemeier, Is positive affect associated with survival? A population-based study
of elderly persons. Am J Epidemiol, 2011. 173(11): p. 1298-307.
30. Chida, Y. and A. Steptoe, Positive psychological well-being and mortality: a
quantitative review of prospective observational studies. Psychosom Med, 2008.
70(7): p. 741-56.
31. Ostir, G.V., K.S. Markides, M.K. Peek, and J.S. Goodwin, The association
between emotional well-being and the incidence of stroke in older adults.
Psychosom Med, 2001. 63(2): p. 210-5.
32. Fredman, L., W.G. Hawkes, S. Black, R.M. Bertrand, and J. Magaziner, Elderly
patients with hip fracture with positive affect have better functional recovery
over 2 years. J Am Geriatr Soc, 2006. 54(7): p. 1074-81.
33. Bhattacharyya, M.R., D.L. Whitehead, R. Rakhit, and A. Steptoe, Depressed
mood, positive affect, and heart rate variability in patients with suspected
coronary artery disease. 2008. p. 1020-7.
34. Cohen, S., C.M. Alper, W.J. Doyle, J.J. Treanor, and R.B. Turner, Positive
Emotional Style Predicts Resistance to Illness After Experimental Exposure to
Rhinovirus or Influenza A Virus. Psychosom Med, 2006. 68(6): p. 809-815.
35. Cohen, S., W.J. Doyle, R.B. Turner, C.M. Alper, and D.P. Skoner, Emotional
Style and Susceptibility to the Common Cold. Psychosomatic Medicine, 2003.
65(4): p. 652-657.
36. Fisher, M.N., S.A. Snih, G.V. Ostir, and J.S. Goodwin, Positive affect and
disability among older Mexican Americans with arthritis. Arthritis Rheum,
2004. 51(1): p. 34-9.
37. Kahn, R.L. and F.T. Juster, Well–Being: Concepts and Measures. Journal of
Social Issues, 2002. 58(4): p. 627-644.

170
38. Bertrand, M. and S. Mullainathan, Do People Mean What They Say?
Implications for Subjective Survey Data. American Economic Review, 2001.
91(2): p. 67-72.
39. Steptoe, A., K. O'Donnell, E. Badrick, M. Kumari, and M. Marmot,
Neuroendocrine and Inflammatory Factors Associated with Positive Affect in
Healthy Men and Women. American Journal of Epidemiology, 2007. 167(1): p.
96-102.
40. Marmot, M. and E. Brunner, Cohort Profile: The Whitehall II study.
International Journal of Epidemiology, 2005. 34(2): p. 251-256.
41. Carroll, D., G.D. Smith, M.J. Shipley, A. Steptoe, E.J. Brunner, and M.G.
Marmot, Blood Pressure Reactions to Acute Psychological Stress and Future
Blood Pressure Status: A 10-Year Follow-Up of Men in the Whitehall II Study.
Psychosom Med, 2001. 63(5): p. 737-743.
42. Hamer, M., K. O'Donnell, A. Lahiri, and A. Steptoe, Salivary cortisol responses
to mental stress are associated with coronary artery calcification in healthy men
and women. European Heart Journal, 2010. 31(4): p. 424-429.
43. Kumari, M., J. Head, and M. Marmot, Prospective Study of Social and Other
Risk Factors for Incidence of Type 2 Diabetes in the Whitehall II Study. Arch
Intern Med, 2004. 164(17): p. 1873-1880.
44. Nabi, H., M. Kivimaki, R.D. Vogli, M.G. Marmot, and A. Singh-Manoux,
Positive and negative affect and risk of coronary heart disease: Whitehall II
prospective cohort study. BMJ, 2008. 337(jun30_1): p. a118-.
45. O'Donnell, K., E. Badrick, M. Kumari, and A. Steptoe, Psychological coping
styles and cortisol over the day in healthy older adults.
Psychoneuroendocrinology, 2008. 33(5): p. 601-611.
46. Steptoe, A., E. Leigh Gibson, M. Hamer, and J. Wardle, Neuroendocrine and
cardiovascular correlates of positive affect measured by ecological momentary

171
assessment and by questionnaire. Psychoneuroendocrinology, 2007. 32(1): p.
56-64.
47. Dowd, H., A. Zautra, and M. Hogan, Emotion, Stress, and Cardiovascular
Response: An Experimental Test of Models of Positive and Negative Affect.
International Journal of Behavioral Medicine, 2010. 17(3): p. 189-194.
48. Brummett, B.H., S.H. Boyle, C.M. Kuhn, I.C. Siegler, and R.B. Williams,
Positive affect is associated with cardiovascular reactivity, norepinephrine level,
and morning rise in salivary cortisol. Psychophysiology, 2009. 46(4): p. 862-
869.
49. Steptoe, A., Positive affect and health-related neuroendocrine, cardiovascular,
and inflammatory processes. 2005. p. 6508(5).
50. Steptoe, A., K. O'Donnell, M. Marmot, and J. Wardle, Positive affect and
psychosocial processes related to health. British Journal of Psychology, 2008.
99: p. 211-227.
51. Steptoe, A., K. O'Donnell, M. Marmot, and J. Wardle, Positive affect,
psychological well-being, and good sleep. Journal of Psychosomatic Research,
2008. 64(4): p. 409-415.
52. Griffin, K.W., R. Friend, P. Eitel, and M. Lobel, Effects of environmental
demands, stress, and mood on health practices. Journal of Behavioral Medicine,
1993. 16(6): p. 643-661.
53. Kelsey, K.S., B.M. DeVellis, M. Begum, L. Belton, E.G. Hooten, and M.K.
Campbell, Positive affect, exercise and self-reported health in blue-collar
women. 2006. p. 199-207.
54. Fredrickson, B.L., What good are positive emotions? Review of General
Psychology, 1998. 2(3): p. 300-319.
55. Mohan, N., Examining the Nature of Resilience and Executive Functioning in
People with Brain Injury and People with Multiple Sclerosis, in School of

172
Medicine, Faculty of Health Sciences. 2010, Flinders University: Adelaide,
Australia. p. 478.
56. Layous, K., J. Chancellor, S. Lyubomirsky, L. Wang, and P.M. Doraiswamy,
Delivering happiness: translating positive psychology intervention research for
treating major and minor depressive disorders. J Altern Complement Med,
2011. 17(8): p. 675-83.
57. Seligman, M.E., T.A. Steen, N. Park, and C. Peterson, Positive psychology
progress: empirical validation of interventions. Am Psychol, 2005. 60(5): p.
410-21.
58. Tugade, M.M., B.L. Fredrickson, and L.F. Barrett, Psychological resilience and
positive emotional granularity: examining the benefits of positive emotions on
coping and health. J Pers, 2004. 72(6): p. 1161-90.
59. Charlson, M.E., C. Boutin-Foster, C.A. Mancuso, J.C. Peterson, G. Ogedegbe,
W.M. Briggs, L. Robbins, A.M. Isen, and J.P. Allegrante, Randomized
controlled trials of positive affect and self-affirmation to facilitate healthy
behaviors in patients with cardiopulmonary diseases: Rationale, trial design,
and methods. Contemporary Clinical Trials, 2007. 28(6): p. 748-762.
60. Mancuso, C.A., T.N. Choi, H. Westermann, S. Wenderoth, J.P. Hollenberg,
M.T. Wells, A.M. Isen, J.B. Jobe, J.P. Allegrante, and M.E. Charlson,
Increasing physical activity in patients with asthma through positive affect and
self-affirmation: a randomized trial. Arch Intern Med, 2012. 172(4): p. 337-43.
61. Ogedegbe, G.O., C. Boutin-Foster, M.T. Wells, J.P. Allegrante, A.M. Isen, J.B.
Jobe, and M.E. Charlson, A randomized controlled trial of positive-affect
intervention and medication adherence in hypertensive African Americans. Arch
Intern Med, 2012. 172(4): p. 322-6.
62. Ogedegbe, G.O., C. Boutin-Foster, M.T. Wells, J.P. Allegrante, J.B. Jobe, and
M.E. Charlson, Abstract 5131: The Healthy Habits Trials: Positive affect
induction improves medication adherence in hypertensive African Americans.

173
Circulation, 2008. 118(18_MeetingAbstracts %U http://circ.ahajournals.org %8
October 28, 2008): p. S_1148-.
63. Peterson, J.C., M.E. Charlson, Z. Hoffman, M.T. Wells, S.C. Wong, J.P.
Hollenberg, J.B. Jobe, K.A. Boschert, A.M. Isen, and J.P. Allegrante, A
randomized controlled trial of positive-affect induction to promote physical
activity after percutaneous coronary intervention. Arch Intern Med, 2012.
172(4): p. 329-36.
64. Zimmet, P., Preventing diabetic complications: A primary care perspective.
Diabetes Research and Clinical Practice, 2009. 84(2): p. 107-116.
65. Surwit, R.S. and M.S. Schneider, Role of stress in the etiology and treatment of
diabetes mellitus. Psychosom Med, 1993. 55(4): p. 380-393.
66. Rorsman, P., Review: Insulin secretion: function and therapy of pancreatic beta-
cells in diabetes. The British Journal of Diabetes & Vascular Disease, 2005.
5(4): p. 187-191.
67. Weyer, C., C. Bogardus, D.M. Mott, and R.E. Pratley, The natural history of
insulin secretory dysfunction and insulin resistance in the pathogenesis of type 2
diabetes mellitus. J Clin Invest, 1999. 104(6): p. 787-94.
68. Reimann, M., E. Bonifacio, M. Solimena, P.E.H. Schwarz, B. Ludwig, M.
Hanefeld, and S.R. Bornstein, An update on preventive and regenerative
therapies in diabetes mellitus. Pharmacology & Therapeutics, 2009. 121(3): p.
317-331.
69. Deshpande, A.D., M. Harris-Hayes, and M. Schootman, Epidemiology of
Diabetes and Diabetes-Related Complications. PHYS THER, 2008. 88(11): p.
1254-1264.
70. Song, M.-S. and H.-S. Kim, Intensive management program to improve
glycosylated hemoglobin levels and adherence to diet in patients with type 2
diabetes. Applied Nursing Research, 2009. 22(1): p. 42-47.

174
71. Cohen, R.M. and L. Sadler. Treatment Options for Diabetics. 2006; Available
from: http://www.netwellness.org/healthtopics/diabetes/treatingdiabetes.cfm.
72. Diagnosis and Classification of Diabetes Mellitus. Diabetes Care, 2004.
27(suppl 1): p. s5-s10.
73. Clark, N.G., K.M. Fox, and S. Grandy, Symptoms of Diabetes and Their
Association With the Risk and Presence of Diabetes. Diabetes Care, 2007.
30(11): p. 2868-2873.
74. Tiv, M., J.-F. Viel, F. Mauny, E. Eschwège, A. Weill, C. Fournier, A. Fagot-
Campagna, and A. Penfornis, Medication Adherence in Type 2 Diabetes: The
ENTRED Study 2007, a French Population-Based Study. PLoS One, 2012. 7(3):
p. e32412.
75. Soo, H. and S. Lam, Stress management training in diabetes mellitus. J Health
Psychol, 2009. 14(7): p. 933-943.
76. Swanson, V., A. Gold, and A. Keen, ‘Doing Diabetes’: an evaluation of
communication skills and behaviour change training for health professionals.
Practical Diabetes International, 2011. 28(3): p. 119-123a.
77. Vermeire Etienne, I.J.J., J. Wens, P. Van Royen, Y. Biot, H. Hearnshaw, and A.
Lindenmeyer (2005) Interventions for improving adherence to treatment
recommendations in people with type 2 diabetes mellitus. Cochrane Database of
Systematic Reviews, DOI: 10.1002/14651858.CD003638.pub2.
78. Burkhart, P.V. and E. Sabate, Adherence to long-term therapies: evidence for
action. J Nurs Scholarsh, 2003. 35(3): p. 207.
79. White, H.D., Adherence and outcomes: it's more than taking the pills. The
Lancet, 2005. 366(9502): p. 1989-1991.
80. Delamater, A.M., Improving Patient Adherence. Clin. Diabetes, 2006. 24(2): p.
71-77.

175
81. Harris, M.I., Frequency of Blood Glucose Monitoring in Relation to Glycemic
Control in Patients With Type 2 Diabetes. Diabetes Care, 2001. 24(6): p. 979-
982.
82. Khattab, M., Y.S. Khader, A. Al-Khawaldeh, and K. Ajlouni, Factors
associated with poor glycemic control among patients with Type 2 diabetes.
Journal of Diabetes and its Complications, 2010. 24(2): p. 84-89.
83. Roebuck, M.C., J.N. Liberman, M. Gemmill-Toyama, and T.A. Brennan,
Medication Adherence Leads To Lower Health Care Use And Costs Despite
Increased Drug Spending. Health Affairs, 2011. 30(1): p. 91-99.
84. Asche, C., J. LaFleur, and C. Conner, A Review of Diabetes Treatment
Adherence and the Association with Clinical and Economic Outcomes. Clinical
Therapeutics, 2011. 33(1): p. 74-109.
85. The Hawthorne effect. Occupational Medicine, 2006. 56(3): p. 217.
86. Renders Carry, M., D. Valk Gerlof, J. Griffin Simon, E. Wagner, M. van Eijk
Jacques Th, and J.J. Assendelft Willem (2000) Interventions to improve the
management of diabetes mellitus in primary care, outpatient and community
settings. Cochrane Database of Systematic Reviews, DOI:
10.1002/14651858.CD001481.
87. Jimmy, B. and J. Jose, Patient medication adherence: measures in daily
practice. Oman medical journal, 2011. 26(3): p. 155-159.
88. Gonzalez, J.S., S.A. Safren, E. Cagliero, D.J. Wexler, L. Delahanty, E.
Wittenberg, M.A. Blais, J.B. Meigs, and R.W. Grant, Depression, Self-Care,
and Medication Adherence in Type 2 Diabetes. Diabetes Care, 2007. 30(9): p.
2222-2227.
89. Cassano, P. and M. Fava, Depression and public health: An overview. Journal of
Psychosomatic Research, 2002. 53(4): p. 849-857.

176
90. Moussavi, S., S. Chatterji, E. Verdes, A. Tandon, V. Patel, and B. Ustun,
Depression, chronic diseases, and decrements in health: results from the World
Health Surveys. Lancet, 2007. 370(9590): p. 851-8.
91. Anderson, R.J., K.E. Freedland, R.E. Clouse, and P.J. Lustman, The Prevalence
of Comorbid Depression in Adults With Diabetes. Diabetes Care, 2001. 24(6): p.
1069-1078.
92. Ciechanowski, P.S., W.J. Katon, and J.E. Russo, Depression and Diabetes:
Impact of Depressive Symptoms on Adherence, Function, and Costs. Arch Intern
Med, 2000. 160(21): p. 3278-3285.
93. Gonzalez, J.S., M. Peyrot, L.A. McCarl, E.M. Collins, L. Serpa, M.J. Mimiaga,
and S.A. Safren, Depression and Diabetes Treatment Nonadherence: A Meta-
Analysis. Diabetes Care, 2008. 31(12): p. 2398-2403.
94. Mor, N. and D. Haran, Cognitive-Behavioral Therapy for Depression. The Israel
Journal of Psychiatry and Related Sciences, 2009. 46(4): p. 269-269-73.
95. Kristian, F.H., Blood glucose control and microvascular and macrovascular
complications in diabetes. Diabetes, 1997. 46: p. S101.
96. Beard, E., M. Clark, S. Hurel, and D. Cooke, Do people with diabetes
understand their clinical marker of long-term glycemic control (HbA1c levels)
and does this predict diabetes self-care behaviours and HbA1c? Patient
Education and Counseling, 2010. 80(2): p. 227-232.
97. National Collaborating Centre for Chronic Conditions: Type 2 diabetes:
national clinical guideline for management in primary and secondary care
(update) (CG66) 2008, Royal College of Physicians: London.
98. Bergenstal, R.M. and J.R. Gavin Iii, The role of self-monitoring of blood glucose
in the care of people with diabetes: report of a global consensus conference. The
American Journal of Medicine, 2005. 118(9, Supplement): p. 1-6.

177
99. Salanitro, A.H. and C.L. Roumie, Blood Pressure Management in Patients With
Diabetes. Clinical Diabetes, 2010. 28(3): p. 107-114.
100. Ong, K.L., B.M.Y. Cheung, Y.B. Man, C.P. Lau, and K.S.L. Lam, Prevalence,
Awareness, Treatment, and Control of Hypertension Among United States
Adults 1999–2004. Hypertension, 2007. 49(1): p. 69-75.
101. Player, M.S., D.E. King, A.G. Mainous, III, and M.E. Geesey, Psychosocial
Factors and Progression From Prehypertension to Hypertension or Coronary
Heart Disease. Ann Fam Med, 2007. 5(5): p. 403-411.
102. Egan, B.M., Y. Zhao, and R.N. Axon, US Trends in Prevalence, Awareness,
Treatment, and Control of Hypertension, 1988-2008. JAMA: The Journal of the
American Medical Association, 2010. 303(20): p. 2043-2050.
103. Lago, R.M., P.P. Singh, and R.W. Nesto, Diabetes and hypertension. Nat Clin
Pract End Met, 2007. 3(10): p. 667-667.
104. Implications of the United Kingdom Prospective Diabetes Study. Diabetes Care,
2002. 25(suppl 1): p. s28-s32.
105. Naik, A.D., M.A. Kallen, A. Walder, and R.L. Street, Improving Hypertension
Control in Diabetes Mellitus. Circulation, 2008. 117(11): p. 1361-1368.
106. Valensi, P. and S. Picard, Lipids, lipid-lowering therapy and diabetes
complications. Diabetes & Metabolism, 2011. 37(1): p. 15-24.
107. Joint Formulary Committee. British National Formulary. 63 ed. 2011, London:
BMJ Group and Pharmaceutical Press.
108. Fowler, M.J., Microvascular and Macrovascular Complications of Diabetes.
Clinical Diabetes, 2008. 26(2): p. 77-82.
109. Kengne, A.P., F. Turnbull, and S. MacMahon, The Framingham Study, Diabetes
Mellitus and Cardiovascular Disease: Turning Back the Clock. Progress in
Cardiovascular Diseases. 53(1): p. 45-51.

178
110. Haffner, S.M., S. Lehto, T. Rönnemaa, K. Pyörälä, and M. Laakso, Mortality
from Coronary Heart Disease in Subjects with Type 2 Diabetes and in
Nondiabetic Subjects with and without Prior Myocardial Infarction. New
England Journal of Medicine, 1998. 339(4): p. 229-234.
111. Cheung, N., P. Mitchell, and T.Y. Wong, Diabetic retinopathy. The Lancet,
2010. 376(9735): p. 124-136.
112. Said, G., Diabetic neuropathy - a review. Nat Clin Pract Neuro, 2007. 3(6): p.
331-340.
113. Zhao, Y., W. Ye, K.S. Boye, J.H. Holcombe, J.A. Hall, and R. Swindle,
Prevalence of other diabetes-associated complications and comorbidities and its
impact on health care charges among patients with diabetic neuropathy. Journal
of Diabetes and its Complications, 2008. 24(1): p. 9-19.
114. de Groot, M., R. Anderson, K.E. Freedland, R.E. Clouse, and P.J. Lustman,
Association of Depression and Diabetes Complications: A Meta-Analysis.
Psychosom Med, 2001. 63(4): p. 619-630.
115. DCCT and EDIC: The Diabetes Control and Complications Trial and Follow-
up Study The National Institute of Diabetes and Digestive and Kidney Diseases
(NIDDK) May 2008.
116. Song, M., C.M. Alexander, P. Mavros, V.A. Lopez, S. Malik, H.M. Phatak, and
N.D. Wong, Use of the UKPDS Outcomes Model to predict all-cause mortality
in U.S. adults with type 2 diabetes mellitus: comparison of predicted versus
observed mortality. Diabetes Res Clin Pract. 91(1): p. 121-6.
117. Albers, J.W., W.H. Herman, R. Pop-Busui, E.L. Feldman, C.L. Martin, P.A.
Cleary, B.H. Waberski, J.M. Lachin, and f.t.D.E.R. Group, Effect of Prior
Intensive Insulin Treatment During the Diabetes Control and Complications
Trial (DCCT) on Peripheral Neuropathy in Type 1 Diabetes During the
Epidemiology of Diabetes Interventions and Complications (EDIC) Study.
Diabetes Care, 2010. 33(5): p. 1090-1096.

179
118. DiabetesUK, Diabetes: State of the Nations 2005: Progress made in delivering
the national diabetes frameworks. 2005.
119. Davies, M.J., S. Heller, T.C. Skinner, M.J. Campbell, M.E. Carey, S. Cradock,
H.M. Dallosso, H. Daly, Y. Doherty, S. Eaton, C. Fox, L. Oliver, K. Rantell, G.
Rayman, and K. Khunti, Effectiveness of the diabetes education and self
management for ongoing and newly diagnosed (DESMOND) programme for
people with newly diagnosed type 2 diabetes: cluster randomised controlled
trial. BMJ, 2008. 336(7642): p. 491-495.
120. Lawton, J. and D. Rankin, How do structured education programmes work? An
ethnographic investigation of the dose adjustment for normal eating (DAFNE)
programme for type 1 diabetes patients in the UK. Social Science & Medicine.
71(3): p. 486-493.
121. Gillett, M., H.M. Dallosso, S. Dixon, A. Brennan, M.E. Carey, M.J. Campbell,
S. Heller, K. Khunti, T.C. Skinner, and M.J. Davies, Delivering the diabetes
education and self management for ongoing and newly diagnosed (DESMOND)
programme for people with newly diagnosed type 2 diabetes: cost effectiveness
analysis. BMJ, 2010. 341.
122. Anderson, R.M. and M.M. Funnell, Patient empowerment: Myths and
misconceptions. Patient Education and Counseling, 2010. 79(3): p. 277-282.
123. van Dam, H.A., F. van der Horst, B. van den Borne, R. Ryckman, and H.
Crebolder, Provider-patient interaction in diabetes care: effects on patient self-
care and outcomes: A systematic review. Patient Education and Counseling,
2003. 51(1): p. 17-28.
124. Anderson, R.M., M.M. Funnell, J.T. Fitzgerald, and D.G. Marrero, The Diabetes
Empowerment Scale: a measure of psychosocial self-efficacy. Diabetes Care,
2000. 23(6): p. 739-743.

180
125. Anderson, R.M., M.M. Funnell, P.M. Butler, M.S. Arnold, J.T. Fitzgerald, and
C.C. Feste, Patient Empowerment: Results of a randomized controlled trial.
Diabetes Care, 1995. 18(7): p. 943-949.
126. Brown, M.T. and D. LeRoith, Overcoming challenges in Type 2 diabetes
management to improve patient outcomes. Expert Review of Endocrinology &
Metabolism, 2010. 5(5): p. 741-751.
127. Lloyd, C., J. Smith, and K. Weinger, Stress and Diabetes: A Review of the Links.
Diabetes Spectrum, 2005. 18(2): p. 121-127.
128. Martin, B. Fight or Flight. 2006; Available from:
http://psychcentral.com/lib/2006/fight-or-flight/.
129. Folkman, S. and J.T. Moskowitz, Positive affect and the other side of coping.
American Psychologist, 2000. 55: p. 647 - 654.
130. Chida, Y. and M. Hamer, An association of adverse psychosocial factors with
diabetes mellitus: a meta-analytic review of longitudinal cohort studies.
Diabetologia, 2008. 51(12): p. 2168-2178.
131. Peyrot, M., J.F. McMurry, Jr., and D.F. Kruger, A Biopsychosocial Model of
Glycemic Control in Diabetes: Stress, Coping and Regimen Adherence. Journal
of Health and Social Behavior, 1999. 40(2): p. 141-158.
132. Tsenkova, V.K., G. Dienberg Love, B.H. Singer, and C.D. Ryff, Coping and
positive affect predict longitudinal change in glycosylated hemoglobin. Health
Psychology, 2008. 27(2): p. S163-S171.
133. Surwit, R.S., M.A.L. van Tilburg, N. Zucker, C.C. McCaskill, P. Parekh, M.N.
Feinglos, C.L. Edwards, P. Williams, and J.D. Lane, Stress Management
Improves Long-Term Glycemic Control in Type 2 Diabetes. Diabetes Care,
2002. 25(1): p. 30-34.
134. Rubin, R.R. and M. Peyrot, Quality of life and diabetes. Diabetes/Metabolism
Research and Reviews, 1999. 15(3): p. 205-218.

181
135. Debono, M. and E. Cachia, The impact of diabetes on psychological well being
and quality of life. The role of patient education. Psychology, Health &
Medicine, 2007. 12(5): p. 545-555.
136. Rubin, R.R. and M. Payrot, Psychological Issues and Treatments for People
with Diabetes. Journal of Clinical Psychology, 2001. 57: p. 457.
137. Lee, H.J., D. Chapa, C.W. Kao, D. Jones, J. Kapustin, J. Smith, C. Krichten, T.
Donner, S.A. Thomas, and E. Friedmann, Depression, quality of life, and
glycemic control in individuals with type 2 diabetes. Journal of the American
Academy of Nurse Practitioners, 2009. 21(4): p. 214-224.
138. Luyster, F.S. and J. Dunbar-Jacob, Sleep Quality and Quality of Life in Adults
With Type 2 Diabetes. The Diabetes Educator, 2011. 37(3): p. 347-355.
139. Paddison, C.A.M., F.M. Alpass, and C.V. Stephens, Psychological Factors
Account for Variation in Metabolic Control and Perceived Quality of Life
Among People with Type 2 Diabetes in New Zealand. International Journal of
Behavioral Medicine, 2008. 15(3): p. 180 - 186.
140. Robertson, S.M., M.A. Stanley, J.A. Cully, and A.D. Naik, Positive Emotional
Health and Diabetes Care: Concepts, Measurement, and Clinical Implications.
Psychosomatics, 2012. 53(1): p. 1-12.
141. Skaff, M.M., J.T. Mullan, D. Almeida, L. Hoffman, U. Masharani, D. Mohr, and
L. Fisher, Daily Negative Mood Affects Fasting Glucose in Type 2 Diabetes.
2009. p. 265-272.
142. Stenström, U., A. Göth, C. Carlsson, and P.-O. Andersson, Stress management
training as related to glycemic control and mood in adults with Type 1 diabetes
mellitus. Diabetes Research and Clinical Practice, 2003. 60(3): p. 147-152.
143. van der Does, F.E., J.N. de Neeling, F.J. Snoek, P.A. Grootenhuis, P.J.
Kostense, L.M. Bouter, and R.J. Heine, Randomized study of two different target

182
levels of glycemic control within the acceptable range in type 2 diabetes. Effects
on well-being at 1 year. 1998. p. 2085-93.
144. McDowell, I., Measuring Health: A Guide to Rating Scales and Questionnaires
3rd ed. 2006: Oxford University Press.
145. Crawford, J.R. and J.D. Henry, The Positive and Negative Affect Schedule
(PANAS): Construct validity, measurement properties and normative data in a
large non-clinical sample. British Journal of Clinical Psychology, 2004. 43(3):
p. 245-265.
146. Zautra, A.J., L.M. Johnson, and M.C. Davis, Positive Affect as a Source of
Resilience for Women in Chronic Pain. J Consult Clin Psychol, 2005. 73(2): p.
212-220.
147. Schmukle, S.C., B. Egloff, and L.R. Burns, The relationship between positive
and negative affect in the Positive and Negative Affect Schedule. Journal of
Research in Personality, 2002. 36(5): p. 463-475.
148. Cohen, S., & Williamson, G., Perceived stress in a probability sample of the
United States. The social psychology of health: Claremont Symposium on
applied social psychology. In S. Spacapan & S. Oskamp (Eds.), Newbury Park,
CA: Sage, 1988.
149. Sheldon, C., T. Kamarck, and R. Mermelstein, A Global Measure of Perceived
Stress. Journal of Health and Social Behavior, 1983. 24(4): p. 385-396.
150. Roberti, J.W., L.N. Harrington, and E.A. Storch, Further Psychometric Support
for the 10-Item Version of the Perceived Stress Scale. Journal of College
Counseling, 2006. 9(2): p. 135.
151. Steptoe, A., Z. Lipsey, and J. Wardle, Stress, hassles and variations in alcohol
consumption, food choice and physical exercise: A diary study. British Journal
of Health Psychology, 1998. 3(1): p. 51-63.

183
152. van Eck, M., H. Berkhof, N. Nicolson, and J. Sulon, The effects of perceived
stress, traits, mood states, and stressful daily events on salivary cortisol.
Psychosomatic Medicine, 1996. 58(5): p. 447-58.
153. O’Connor, D.B., H. Hendrickx, T. Dadd, T.D. Elliman, T.A. Willis, D. Talbot,
A.E. Mayes, K. Thethi, J. Powell, and L. Dye, Cortisol awakening rise in
middle-aged women in relation to psychological stress.
Psychoneuroendocrinology, 2009. 34(10): p. 1486-1494.
154. McNair D, L.M., Droppleman L, Profile of Mood States (Manual), in
Educational and Industrial Testing Service. 1971: San Diego.
155. Pollock, V.B.A., D.W.P.D. Cho, D.R.N. Reker, and J.A.N.M.D.P.D. Volavka,
Profile of Mood States: The Factors and Their Physiological Correlates. Journal
of Nervous & Mental Disease, 1979. 167(10): p. 612-614.
156. De Wit H, D.P., Preference for ethanol and diazepam in light and moderate
social drinkers: a within-subjects study. Psychopharmacology 1994. 115: p.
529-538.
157. Bradley, C., Jacobson AM, the DCCT Research Group: The Diabetes Quality of
Life Measure. In Handbook of Psychology and Diabetes: A Guide to
Psychological Measurement in Diabetes Research and Practice. 1994, Chur,
Switzerland,: Harwood Academic Publishers.
158. Burroughs, T.E., R. Desikan, B.M. Waterman, D. Gilin, and J. McGill,
Development and Validation of the Diabetes Quality of Life Brief Clinical
Inventory. Diabetes Spectrum, 2004. 17(1): p. 41-49.
159. Jacobson, A.M., M.D. Groot, and J.A. Samson, The Evaluation of Two
Measures of Quality of Life in Patients With Type I and Type II Diabetes.
Diabetes Care, 1994. 17(4): p. 267-274.

184
160. Toobert, D.J., S.E. Hampson, and R.E. Glasgow, The summary of diabetes self-
care activities measure: results from 7 studies and a revised scale. Diabetes
Care, 2000. 23(7): p. 943-950.
161. Redmond, E.H., Diabetes Self-Care Activities in Older Adults And The Ability
Of A Nutrition And Diabetes Education Program To Effect Change, in Dean of
the Graduate School. 2004, The University of Georgia Athens. p. 197.
162. Campbell-Sills, L. and M.B. Stein, Psychometric analysis and refinement of the
connor–davidson resilience scale (CD-RISC): Validation of a 10-item measure
of resilience. Journal of Traumatic Stress, 2007. 20(6): p. 1019-1028.
163. Yusoff, N., W.Y. Low, and C.H. Yip, Reliability and Validity of the Brief COPE
Scale (English Version) Among Women with Breast Cancer Undergoing
Treatment of Adjuvant Chemotherapy: A Malaysian Study. Med J Malaysia,
2010. 65(1): p. 41-44.
164. Carver, C.S., You want to measure coping but your protocol's too long:
Consider the brief COPE. International Journal of Behavioral Medicine, 1997.
4: p. 92 - 100.
165. Bardwell, W.A., S. Ancoli-Israel, and J.E. Dimsdale, Types of coping strategies
are associated with increased depressive symptoms in patients with obstructive
sleep apnea. Sleep, 2001. 24(8): p. 905-9.
166. Tuncay, T., I. Musabak, D.E. Gok, and M. Kutlu, The relationship between
anxiety, coping strategies and characteristics of patients with diabetes. 2008. p.
79.
167. Bio-Rad Laboratories. in2it (l) System. A1c Test Cartridges. Instruction Manual.
2007. p. 10.
168. Field, A., Discovering Statistics Using SPPS. Third edition ed. 2009: SAGE
Publications Ltd.

185
169. Chida, Y. and A. Steptoe, Greater Cardiovascular Responses to Laboratory
Mental Stress Are Associated With Poor Subsequent Cardiovascular Risk
Status: A Meta-Analysis of Prospective Evidence. Hypertension, 2010. 55(4): p.
1026-1032.
170. Moseley, J.V. and W. Linden, Predicting Blood Pressure and Heart Rate
Change With Cardiovascular Reactivity and Recovery: Results From 3-Year and
10-Year Follow Up. Psychosom Med, 2006. 68(6): p. 833-843.
171. Stewart, J.C., D.L. Janicki, and T.W. Kamarck, Cardiovascular Reactivity to
and Recovery From Psychological Challenge as Predictors of 3-Year Change in
Blood Pressure. Health Psychology, 2006. 25(1): p. 111-118.
172. Clow, A., F. Hucklebridge, T. Stalder, P. Evans, and L. Thorn, The cortisol
awakening response: More than a measure of HPA axis function. Neuroscience
& Biobehavioral Reviews, 2010. 35(1): p. 97-103.
173. Hamer, M., E. Williams, R. Vuonovirta, P. Giacobazzi, E.L. Gibson, and A.
Steptoe, The Effects of Effort-Reward Imbalance on Inflammatory and
Cardiovascular Responses to Mental Stress. Psychosomatic Medicine, 2006.
68(3): p. 408-413.
174. Steptoe, A., E.L. Gibson, M. Hamer, and J. Wardle, Neuroendocrine and
cardiovascular correlates of positive affect measured by ecological momentary
assessment and by questionnaire. Psychoneuroendocrinology, 2007. 32(1): p.
56-64.
175. Mitchell, J., D. Vella-Brodrick, and B. Klein, Positive Psychology and the
Internet: A Mental Health Opportunity. E-Journal of Applied Psychology, 2011.
6(2): p. 30-41.
176. Papousek, I., K. Nauschnegg, M. Paechter, H.K. Lackner, N. Goswami, and G.
Schulter, Trait and state positive affect and cardiovascular recovery from
experimental academic stress. Biol Psychol, 2010. 83(2): p. 108-15.

186
177. Gasperin, D., G. Netuveli, J.S. Dias-da-Costa, and M.P. Pattussi, Effect of
psychological stress on blood pressure increase: a meta-analysis of cohort
studies. Cadernos de Saúde Pública, 2009. 25: p. 715-726.
178. DCCT, The Effect of Intensive Treatment of Diabetes on the Development and
Progression of Long-Term Complications in Insulin-Dependent Diabetes
Mellitus. New England Journal of Medicine, 1993. 329(14): p. 977-986.
179. Engum, A., A. Mykletun, K. Midthjell, A. Holen, and A.A. Dahl, Depression
and Diabetes. Diabetes Care, 2005. 28(8): p. 1904-1909.
180. Lin, E.H.B., W. Katon, M. Von Korff, C. Rutter, G.E. Simon, M. Oliver, P.
Ciechanowski, E.J. Ludman, T. Bush, and B. Young, Relationship of Depression
and Diabetes Self-Care, Medication Adherence, and Preventive Care. Diabetes
Care, 2004. 27(9): p. 2154-2160.
181. Kujala, U.M., Evidence on the effects of exercise therapy in the treatment of
chronic disease. British Journal Of Sports Medicine, 2009. 43(8): p. 550-5.
182. Pouwer, F., F.J. Snoek, H.M. van der Ploeg, H.J. Ader, and R.J. Heine,
Monitoring of Psychological Well-Being in Outpatients With Diabetes: Effects
on mood, HbA1c, and the patient's evaluation of the quality of diabetes care: a
randomized controlled trial. Diabetes Care, 2001. 24(11): p. 1929-1935.
183. Richard R. Rubin, M.P., Quality of life and diabetes. Diabetes/Metabolism
Research and Reviews, 1999. 15(3): p. 205-218.
184. Duangdao, K. and S. Roesch, Coping with diabetes in adulthood: a meta-
analysis. Journal of Behavioral Medicine, 2008. 31(4): p. 291-300.
185. Huang, M.-F., M. Courtney, H. Edwards, and J. McDowell, Factors that affect
health outcomes in adults with type 2 diabetes: A cross-sectional study.
International Journal of Nursing Studies, 2010. 47(5): p. 542-549.

187
186. Sundaram, M., J. Kavookjian, J.H. Patrick, L.A. Miller, S.S. Madhavan, and V.
Scott, Quality of life, health status and clinical outcomes in Type 2 diabetes
patients. Quality Of Life Research, 2007. 16(2): p. 165.
187. Fredrickson, B.L., The broaden-and-build theory of positive emotions. Philos
Trans R Soc Lond B Biol Sci, 2004. 359(1449): p. 1367-78.
188. Alcohol Users Disorders Identification Test (AUDIT): This brief intervention
package is based on the Drink-Less programme originally developed at the
University of Sydney as part of a W.H.O. collaborative study. Available from:
http://www.leeds.ac.uk/lsmp/healthadvice/alcohol/ALCOHOL%2010%20QUES
TIONNAIRE.pdf.
189. Pallant, J., SPSS Survival Manual: A Step by Step Guide to Data Analysis Using
SPSS for Windows 2007: Open University Press; 3 edition.
190. Garcia, D., T. Archer, S. Moradi, and A.-C. Andersson-Arntén, Exercise
Frequency, High Activation Positive Affect, and Psychological Well-Being:
Beyond Age, Gender, and Occupation. Psychology, 2012. 3(4): p. 328-336.
191. Lichtenstein, A.H., L.J. Appel, M. Brands, M. Carnethon, S. Daniels, H.A.
Franch, B. Franklin, P. Kris-Etherton, W.S. Harris, B. Howard, N. Karanja, M.
Lefevre, L. Rudel, F. Sacks, L. Van Horn, M. Winston, and J. Wylie-Rosett,
Diet and Lifestyle Recommendations Revision 2006. Circulation, 2006. 114(1):
p. 82-96.
192. National Institute for Health and Clinical Excellence, Lifestyle advice on diet
and physical activity. 2012: London: NICE Pathways.
193. Whitmore, C., Type 2 diabetes and obesity in adults. British Journal of Nursing,
2010. 19(14): p. 880-886.
194. Kolotkin, R.L., K. Meter, and G.R. Williams, Quality of life and obesity.
Obesity Reviews, 2001. 2(4): p. 219-229.

188
195. Redekop, W.K., M.A. Koopmanschap, R.P. Stolk, G.E.H.M. Rutten, B.H.R.
Wolffenbuttel, and L.W. Niessen, Health-Related Quality of Life and Treatment
Satisfaction in Dutch Patients With Type 2 Diabetes. Diabetes Care, 2002.
25(3): p. 458-463.
196. van Dam, H.A., F.G. van der Horst, L. Knoops, R.M. Ryckman, H.F.J.M.
Crebolder, and B.H.W. van den Borne, Social support in diabetes: a systematic
review of controlled intervention studies. Patient Education and Counseling,
2005. 59(1): p. 1-12.
197. Zhang, X., S.L. Norris, E.W. Gregg, and G. Beckles, Social Support and
Mortality Among Older Persons With Diabetes. The Diabetes Educator, 2007.
33(2): p. 273-281.
198. Gilden, J.L., M.S. Hendryx, S. Clar, C. Casia, and S.P. Singh, Diabetes support
groups improve health care of older diabetic patients. J Am Geriatr Soc, 1992.
40(2): p. 147-50.
199. Grey, M., Coping and diabetes. Diabetes Spectrum, 2000. 13: p. 167-169.
200. Spellman, C.W. and Suppl, Achieving glycemic control: Cornerstone in the
treatment of patients with multiple metabolic risk factors. The Journal of
American Osteopathic Association, 2009. 109: p. S8-S13.
201. Ismail, K., K. Winkley, and S. Rabe-Hesketh, Systematic review and meta-
analysis of randomised controlled trials of psychological interventions to
improve glycaemic control in patients with type 2 diabetes. The Lancet, 2004.
363(9421): p. 1589-1597.
202. Moskowitz, J.T., J.R. Hult, L.G. Duncan, M.A. Cohn, S. Maurer, C. Bussolari,
and M. Acree, A positive affect intervention for people experiencing health-
related stress: Development and non-randomized pilot test. Journal of Health
Psychology, 2012. 17(5): p. 676-692.

189
203. Lawton, M.P., L. Winter, M.H. Kleban, and K. Ruckdeschel, Affect and Quality
of Life: Objective and Subjective. Journal of Aging and Health, 1999. 11(2): p.
169-198.
204. Aikens, J., D. Perkins, and J. Piette, Association between depression and
concurrent Type 2 diabetes outcomes varies by diabetes regime. Diabetic
Medicine, 2008. 25(11): p. 1324-1329.
205. Papelbaum, M., H.M. Lemos, M. Duchesne, R. Kupfer, R.O. Moreira, and W.F.
Coutinho, The association between quality of life, depressive symptoms and
glycemic control in a group of type 2 diabetes patients. Diabetes Research and
Clinical Practice, 2010. 89(3): p. 227-230.
206. Testa, M. and D. Simonson, Health economic benefits and quality of life during
improved glycemic control in patients with type 2 diabetes mellitus: a
randomized, controlled, double-blind trial.[see comment]. JAMA, 1998.
280(17): p. 1490 - 1496.
207. Stauber, S., J.-P. Schmid, H. Saner, H. Znoj, G. Saner, J. Grolimund, and R. von
Känel, Health-Related Quality of Life is Associated with Positive Affect in
Patients with Coronary Heart Disease Entering Cardiac Rehabilitation. Journal
of Clinical Psychology in Medical Settings, 2013: p. 1-9.
208. Goetsch, V.L., B. VanDorsten, L.A. Pbert, I.H. Ullrich, and R.A. Yeater, Acute
effects of laboratory stress on blood glucose in noninsulin-dependent diabetes.
Psychosomatic Medicine, 1993. 55(6): p. 492-6.

190
Appendices
Appendix A: Ethical Approval Letter and Supporting Documents for
Chapter 3

191

192
Appendix B: Ethical Approval Letter and Supporting Documents for
Chapter 4

193
Table 6.1 Correlational matrix of main results
Note r/rho = Figures here represent either the r or rho statistic as some of the data was not normally distributed. ** p< .001 * p<.05. n = number of participants
1 2 3 4 5 6 7 8 9 10 11 12 13 14 15 16 17 18 19 20 21 22 23 24 25
1. PA (n = 138) -
2. NA (n = 137) -.22** -
3. PSS (n = 146) -.43** .69** -
4. Active Coping (n = 145) .19* .01 -.04 -
5. Instrumental Coping (n = 145) .23** .08 -.01 .63** -
6. Total Complications (n = 145) -.01 .01 -.04 .19* .02 -
7. HbA1c (n = 87) -.10 -.13 -.03 -.01 -.20 -.04 -
8. Healthy Diet (n = 147) .23** -.12 -.13 .15 .21** .02 -.29** -
9. Specific Diet (n = 147) .09 .05 -.02 .19* .26** .07 -.30** .42** -
10. Exercise (n = 147) .06 .08 .00 .29** .15 -.06 -.12 .23** .26** -
11. Glucose testing (n = 147) .11 -.03 .02 .1 .18* .08 .17 .03 .07 .27** -
12. Feet checks (n = 147) .08 .07 .05 .06 .11 -.01 -.07 .14 .07 .04 -.04 -
13. Smoking (n = 128) .09 -.12 -.21* .02 .13 .05 .01 .05 .14 .04 .08 .13 -
14. DQOL satisfaction (n = 147) .37** -.56** -.53** .07 .19* -.10 -.07 .15 .14 .05 -.03 .03 .19* -
15. DQOL Impact (n = 145) .10 -.46** -.34** -.10 -.12 -.19* -.08 .07 .05 -.002 -.19* -.05 .03 .54** -
16 DQOL Social Worries(n = 127) .16 -.63** -.62** .001 -.08 -.11 -.06 .16 .07 -.10 -.21 .23 .20 .45** .54** -
17. DQOL Diabetes worries (n = 57) .18* -46** -.42** -.04 -.01 -.19* -.13 .09 -.03 .01 -.25** -.02 .13 .60** .66** .59** -
18. BMI (n = 132) -.14 .11 .20* -.07 -.14 .06 -.13 -.13 .07 -.19* -.19* .12 -.11 .42** -.05 .19 -.11 -
19. Maritial status (n = 144) -.25** .25** .25** .002 -.10 .01 -.05 -.05 -.05 .03 -.24** -.04 -.11 -.29** -.09 -.51** -.09 .09 -
20. Depression diagnosis (n = 137) .09 -36** -.38** -.09 -.09 -.12 .05 -.03 -.10 .03 -.04 .02 .14 -.19* .20* .44** .16 -.17 -.15 -
21. Alcohol (n = 110) -.13 -.10 -.10 -.07 -.09 -.04 .24 -.12 -.30** -.01 .05 .03 .01 .18* -.08 -.05 -.06 -.23* -.05 .17 -
22. Type of diabetes (n = 144) -.06 -.01 .08 .04 -.08 -.07 -.28** .11 .12 -.14 -.54** .13 -.02 -.11* .21* .25 .24** .30** .01 -.17 -.08 -
23. Education Course (N/Y) (n = 131) -.07 .19* .22* .14 .12 -.04 -.14 -.12 .02 .01 -.08 .10 .02 -.05 -.06 -.05 -.04 .14 .08 -.11 .08 .10 -
24. Attend support group (N/Y) (n = 131) .11 -.19 -.14 .28** .20* .21* .06 .07 .15 .09 .13 .04 .10 .30** .28** .25 .23* -.08 -.18* -.05 -.07 .08 .22* -
25. Gender (F/M)(n = 141) .04 -.22* -.22** -.07 -.05 .05 .18 -.18* -.18 -.04 -.02 .02 -.06 .08 -.09 .19 .01 -.18* -.04 .17* -.13 -.16 -.12 -.17 -
26. Age (n = 140) .12 -.31** -.32** .12 -.004 .32** -.08 .10 .07 -.08 -.21* .10 .17 .38** .38** .61** .41** -.04 -.13 .02 .38** .42** .09 .52** -.03

Page 1
1
1. You and Your Diabetes Online Study
Thank you for showing an interest in this study. If you decide to complete this survey you can be automatically put
into a draw for a chance to win an IPOD touch.
This survey will take approximately 20 minutes to complete and it is designed to measure how you feel about your
diabetes. It also includes some general questions about yourself and your diabetes care. Your answers will not be
judged in any way or affect your care. You can miss out any questions that you do not wish to answer. All
information about you will be anonymous and will be handled in confidence and will be kept in a secure place.
If you feel that when completing the questionnaire you no longer would like to take part then please press "Exit this
survey" which is on the right hand corner of each page. In doing this, your answers will not be used for this study.
I would like to thank you for your time and hope that you are still interested in taking part.
Best Wishes
Meenal Patel

Page 195
195
2. You and Your Diabetes Online Study
1. What type of diabetes do you have
...('{ Type 1 diabetes
...('{ Type 2 diabetes
...('{ Gestational diabetes
2. How many years ago were you diagnosed with diabetes
...('{ 0-2 ...('{ 2-5 ...('{ 5-10 ...('{ 10-20 ...('{ 20-30 ...('{ 30+
3. What treatment are you currently taking to control your diabetes
_jlj Diet and Exercise
_jlj Oral Medication
_jlj Insulin
_jlj Oral Medication and Insulin
Other (please specify)
4. Are you currently taking medication prescribed by a doctor to lower your blood
pressure?
...('{ Yes
...('{ No
5. Are you currently taking medication prescribed by a doctor to lower your
cholesterol?
...('{ Yes
...('{ No
6. Are you currently taking a daily low dose of Aspirin (75mg)
...('{ Yes
...('{ No
7. Your doctor probably takes a blood sample from you to measure your HbA1C. This
test gives you and your doctor an indication on how well you are controlling your
diabetes.
If you know or can find out your most recent HbA1c result please write it below.

Page 196
196
8. Please can you list all medication/insulin you are currently taking.
Please tell us the name, dosage and frequency (eg Metformin, 500mg, 2xdaily)
Name of Medication
Dosage
Frequency
Name of Medication
Dosage
Frequency
Name of Medication
Dosage
Frequency
Name of Medication
Dosage
Frequency
Name of Medication
Dosage
Frequency
Name of Medication
Dosage
Frequency
Name of Medication
Dosage
Frequency
Name of Medication
Dosage
Frequency
Name of Medication
Dosage
Frequency
Name of Medication
Dosage
Frequency
Name of Medication
Dosage
Frequency
Nam e of Medication
Dosage
Frequency
Nam e of Medication
Dosage
Frequency

Page 197
197
3. You and Your Diabetes Online Study
1. Have you ever had any of the following conditions?
_jlj Heart Disease _jlj Diabetic ketoacidosis _jlj Cancer
_jlj Angina _jlj Eye Trouble (cataracts) _jlj Osteoporosis
_jlj Heart Attack _jlj Any other Eye problems _jlj Asthma and respiratory diseases
_jlj Stroke _jlj Thyroid Dysfunction _jlj Arthritis
_jlj Congestive Heart Failure _jlj Nerve damage _jlj HIV
_jlj Hypertension _jlj Amputation from foot disease _jlj Back pain
_jlj Hypercholesterolemia (high _jlj Hypoglycaemia (low blood sugar) _jlj Alzheimer's disease
cholesterol) _jlj
Erectile dysfunction
_jlj Kidney Disease
Other Medical Conditions (please specify)
....
2. Mental Health Yes No NA
Have you been diagnosed with depression ._jl_j ._jl_j ._jl_j
If you answered yes - are you taking medication for depression _jlj _jlj _jlj
If you answered yes - please can you write the name of the medication

Page 198
198
4. You and Your Diabetes Online Study
1. The questions below ask you about your diabetes self-care activities during your
last 7 consecutive days you were not sick.
How many of the last SEVEN DAYS did you
0 1 2 3 4 5 6 7
follow a healthy eating plan? ...(' { ...(' { ...(' { ...(' { ...(' { ...(' { ...(' { ...(' {
eat five or more servings of fruit and
vegetables?
...('{ ...('{ ...('{ ...('{ ...('{ ...('{ ...('{ ...('{
test your blood sugar? ...(' { ...(' { ...(' { ...(' { ...(' { ...(' { ...(' { ...(' {
test your blood sugar the number of times
recommended by your health care
provider?
participate in at least 30 minutes of
physical activity? (Total minutes of
continuous activity, including walking)
did you participate in a specific exercise
session (such as swimming, walking, biking)
other than what you do around the house
or as part of your work?
eat hight fat foods such as red meat or full
fat dairy products?
...('{ ...('{ ...('{ ...('{ ...('{ ...('{ ...('{ ...('{
...(' { ...(' { ...(' { ...(' { ...(' { ...(' { ...(' { ...(' {
...('{ ...('{ ...('{ ...('{ ...('{ ...('{ ...('{ ...('{
...(' { ...(' { ...(' { ...(' { ...(' { ...(' { ...(' { ...(' {
check your feet? ...('{ ...('{ ...('{ ...('{ ...('{ ...('{ ...('{ ...('{
inspect the inside of your shoes? ...(' { ...(' { ...(' { ...(' { ...(' { ...(' { ...(' { ...(' {
2. On average, over the past month, how many DAYS PER WEEK
0 1 2 3 4 5 6 7
have you followed your eating plan? ...(' { ...(' { ...(' { ...(' { ...(' { ...(' { ...(' { ...(' {
3. Have you smoked a cigarette - even one puff during the past SEVEN DAYS?
...('{ Yes
...('{ No
4. If yes, how many cigarettes did you smoke on an average day? Number of
cigarettes
5. Do you ever drink alcohol?
...('{ No – Please go to question 6
...('{ Yes – please complete the additional questions below
6. How often do you have a drink that contains alcohol?
...('{ Monthly or less ...('{ 2 to 4 times per month ...('{ 2 to 3 times per week ...('{ 4+ times per week

Page 199
199
7. How many UNITS of alcohol do you drink on a typical day when you are drinking?
...('{ 1 to 2 ...('{ 3 to 4 ...('{ 5 to 6 ...('{ 7 to 8 ...('{ 9 to 10 ...('{ 11+
8. The scale consists of a number of words that describe different feelings and
emotions. Read each word and then click the appropriate answer next to that word.
Indicate to what extent you felt this way in general. Use the following scale to record
your answers.
Very slightly or not at
all
A little Moderately Quite a bit Extremely
Interested ...('{ ...('{ ...('{ ...('{ ...('{
Distressed ...('{ ...('{ ...('{ ...('{ ...('{
Excited ...('{ ...('{ ...('{ ...('{ ...('{
Upset ...('{ ...('{ ...('{ ...('{ ...('{
Strong ...('{ ...('{ ...('{ ...('{ ...('{
Guilty ...('{ ...('{ ...('{ ...('{ ...('{
Scared ...('{ ...('{ ...('{ ...('{ ...('{
Hostile ...('{ ...('{ ...('{ ...('{ ...('{
Enthusiastic ...('{ ...('{ ...('{ ...('{ ...('{
Proud ...('{ ...('{ ...('{ ...('{ ...('{
Irritable ...('{ ...('{ ...('{ ...('{ ...('{
Alert ...('{ ...('{ ...('{ ...('{ ...('{
Ashamed ...('{ ...('{ ...('{ ...('{ ...('{
Inspired ...('{ ...('{ ...('{ ...('{ ...('{
Nervous ...('{ ...('{ ...('{ ...('{ ...('{
Determined ...('{ ...('{ ...('{ ...('{ ...('{
Attentive ...('{ ...('{ ...('{ ...('{ ...('{
Jittery ...('{ ...('{ ...('{ ...('{ ...('{
Active ...('{ ...('{ ...('{ ...('{ ...('{
Afraid ...('{ ...('{ ...('{ ...('{ ...('{

Page 200
200
the amount of time it takes
to manage you diabetes?
the amount of time you
spend getting checkups?
Very Satisfied Moderately Satisfied Neither Very dissatisfied dissatisfied
...('{
...('{
...('{
...('{
...('{
...('{
...('{
...('{
...('{
...('{
the amount of time it takes
to determine your sugar
...('{
...('{
...('{
...('{
...('{
levels? your current treatment?
...('{
...('{
...('{
...('{
...('{
the flexibility you have in
your diet?
...('{
...('{
...('{
...('{
...('{
the burden your diabetes
is placing on your family?
...('{
...('{
...('{
...('{
...('{
the knowledge about your
diabetes?
...('{
...('{
...('{
...('{
...('{
your sleep?
...('{
...('{
...('{
...('{
...('{
your social relationships
and friendships?
...('{
...('{
...('{
...('{
...('{
your sex life?
...('{
...('{
...('{
...('{
...('{
your work, school, and
house hold activities?
...('{
...('{
...('{
...('{
...('{
the appearance of your
body?
...('{
...('{
...('{
...('{
...('{
the time you spend
exercising?
...('{
...('{
...('{
...('{
...('{
your leisure time?
...('{
...('{
...('{
...('{
...('{
9. Please read each statement carefully. Please indicate how satisfied or dissatisfied
you currently are with the aspect of your life described in the statement. There are no
right or wrong answers to these questions. We are interested in your opinion.
How satisfied are you with Moderately
life in general? ...('{ ...('{ ...('{ ...('{ ...('{

Page 201
201
10. How often do you
feel pain associated with
the treatment of your
diabetes?
embarrassed by having to
deal with your diabetes in
public?
Never Very Seldom Sometimes Often All of the Time
...('{ ...('{ ...('{ ...('{ ...('{
...('{ ...('{ ...('{ ...('{ ...('{
feel physically ill? ...('{ ...('{ ...('{ ...('{ ...('{
feel good about yourself? ...('{ ...('{ ...('{ ...('{ ...('{
feel restricted by your
diet?
feel that because of your
diabetes you go to the
toilet more than others?
feel teased because you
have diabetes
...('{ ...('{ ...('{ ...('{ ...('{
...('{ ...('{ ...('{ ...('{ ...('{
...('{ ...('{ ...('{ ...('{ ...('{
have low blood sugar? ...('{ ...('{ ...('{ ...('{ ...('{
have a bad night's sleep? ...('{ ...('{ ...('{ ...('{ ...('{
find your diabetes limiting
your social relationships
and friendships?
miss work, school, or
household duties because
of your diabetes?
find yourself explaining
what it means to have
diabetes?
that your diabetes
interrupts your leisure-time
activities?
tell others about your
diabetes?
find that you eat
something you rather
shouldn’t rather than tell
someone you have
diabetes?
hide from others that you
are having an insulin
reaction?
...('{ ...('{ ...('{ ...('{ ...('{
...('{ ...('{ ...('{ ...('{ ...('{
...('{ ...('{ ...('{ ...('{ ...('{
...('{ ...('{ ...('{ ...('{ ...('{
...('{ ...('{ ...('{ ...('{ ...('{
...('{ ...('{ ...('{ ...('{ ...('{ ...('{ ...('{ ...('{ ...('{ ...('{
11. How often does your diabetes
interfere with your family
life?
interfere with your sex
life?
keep you from driving a
car or using a machine?
(e.g., a type writer)
Never Very Seldom Sometimes Often All of the Time
...('{ ...('{ ...('{ ...('{ ...('{
...('{ ...('{ ...('{ ...('{ ...('{
...('{ ...('{ ...('{ ...('{ ...('{
interfere with your career? ...('{ ...('{ ...('{ ...('{ ...('{

Page 202
202
12. Please indicate how often the following events happen to you. Please select the
option that best describes your feelings. If the question is not relevant to you, select
"does not apply"
How often do you worry about whether you will
Never Very Seldom Sometimes All the time Does not apply
get married?
...('{
...('{
...('{
...('{
...('{
have children?
...('{
...('{
...('{
...('{
...('{
not get a job you want?
...('{
...('{
...('{
...('{
...('{
be denied insurance?
...('{
...('{
...('{
...('{
...('{
be able to complete your
education?
...('{
...('{
...('{
...('{
...('{
miss work?
...('{
...('{
...('{
...('{
...('{
be able to take a vacation
or a trip?
...('{ ...('{ ...('{ ...('{ ...('{
pass out? ...('{ ...('{ ...('{ ...('{ ...('{
get complications from
your diabetes?
...('{ ...('{ ...('{ ...('{ ...('{
13. How often do you worry
Never Very Seldom Sometimes All the time Does not apply
that your body looks
differently because you
have diabetes?
about whether someone
will not go out with you
because you have
diabetes?
...('{ ...('{ ...('{ ...('{ ...('{
...('{ ...('{ ...('{ ...('{ ...('{

Page 203
203
14. The questions in this scale ask you about your feelings and thoughts during the
last month. In each case, please indicate by selecting how often you felt or thought a
certain way.
In the last month, how often have you
Never Almost Never Sometimes Fairly Often Very Often
been upset because of
something that happened
unexpectedly?
felt that you were unable
to control the important
things in your life?
felt nervous and
“stressed”?
felt confident about your
ability to handle your
personal problems?
felt that things were going
your way?
found that you could not
cope with all the things
that you had to do?
been able to control
irritations in your life?
felt that you were on top
of things?
been angered because of
things that were outside of
your control?
felt difficulties were piling
up so high that you could
not overcome them?
...('{ ...('{ ...('{ ...('{ ...('{
...('{ ...('{ ...('{ ...('{ ...('{
...('{ ...('{ ...('{ ...('{ ...('{
...('{ ...('{ ...('{ ...('{ ...('{
...('{ ...('{ ...('{ ...('{ ...('{
...('{ ...('{ ...('{ ...('{ ...('{
...('{ ...('{ ...('{ ...('{ ...('{
...('{ ...('{ ...('{ ...('{ ...('{
...('{ ...('{ ...('{ ...('{ ...('{
...('{ ...('{ ...('{ ...('{ ...('{
15. Please indicate how you usually deal with the statements described below
I usually don't do this at
all
I usually only do this
sometimes
I usually do this fairly
often
I usually do this alot
I concentrate my efforts on doing
something about my diabetes.
I take action to try and make my diabetes
better.
I try to get advice or help from other
people about what to do about my
diabetes.
I receive help and advice about my
diabetes from other people.
...('{ ...('{ ...('{ ...('{
...('{ ...('{ ...('{ ...('{
...('{ ...('{ ...('{ ...('{
...('{ ...('{ ...('{ ...('{
16. Have you attended an NHS educational programme (for example DESMOND)?
...('{ Yes
...('{ No
17. Do you attend any support groups on a regular basis
...('{ Yes
...('{ No
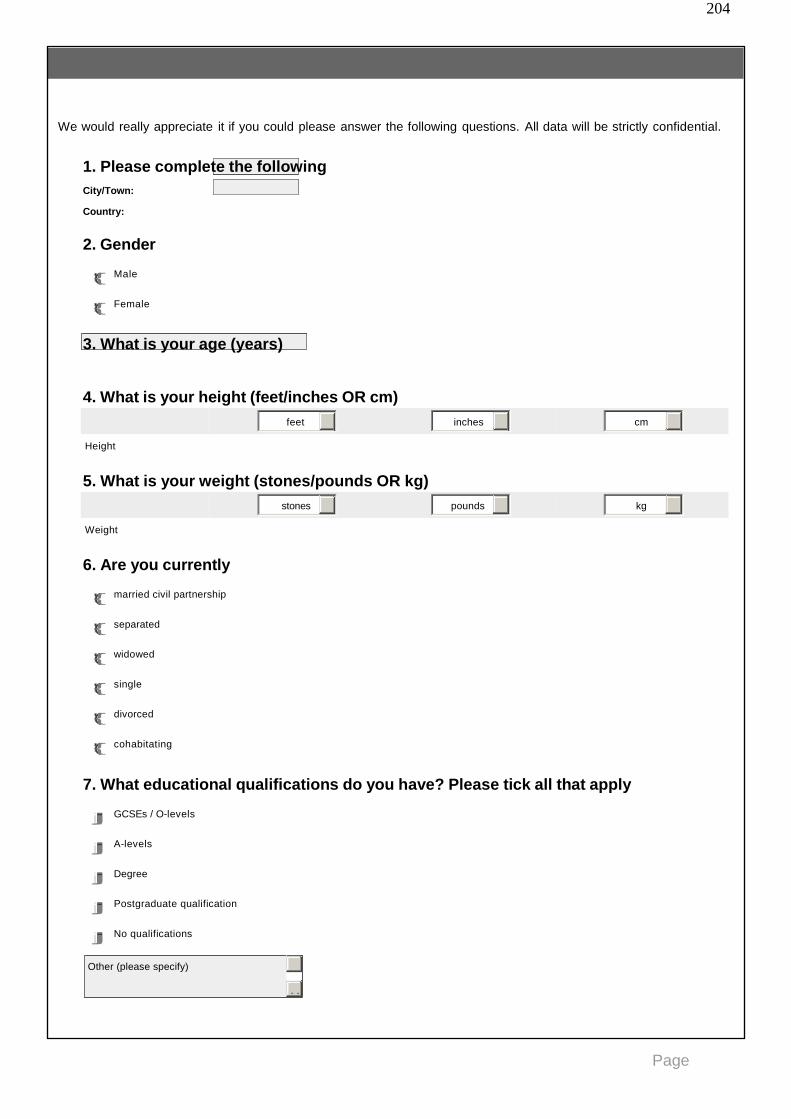
Page 204
204
5. You and Your Diabetes
We would really appreciate it if you could please answer the following questions. All data will be strictly confidential.
1. Please complete the following
City/Town:
Country:
2. Gender
...('{ Male
...('{ Female
3. What is your age (years)
4. What is your height (feet/inches OR cm)
feet inches cm
Height
5. What is your weight (stones/pounds OR kg)
stones pounds kg
Weight
6. Are you currently
...('{ married civil partnership
...('{ separated
...('{ widowed
...('{ single
...('{ divorced
...('{ cohabitating
7. What educational qualifications do you have? Please tick all that apply
_jlj GCSEs / O-levels
_jlj A-levels
_jlj Degree
_jlj Postgraduate qualification
_jlj No qualifications
Other (please specify)
....

Page 205
205
8. Is your home
_jlj Owned - with a mortgage to pay
_jlj Owned – with no mortgage to pay
_jlj Rented from council
_jlj Rented from private landlord
Other (please specify)
....
9. Ethnic Origin
_jlj White _jlj Other mixed background _jlj African
_jlj White British _jlj Asian or Asian British _jlj Other Black background
_jlj Irish _jlj Indian _jlj All Black groups
_jlj Other White background _jlj Pakistani _jlj Chinese or Other Ethnic Group
_jlj All white groups _jlj Bangladeshi _jlj Chinese
_jlj Mixed _jlj Other Asian background _jlj Other ethnic group
_jlj White and Black Caribean _jlj All Asian groups _jlj All Chinese or Other Groups
_jlj White and Black African _jlj Black of Black British _jlj All Ethnic Groups
_jlj White and Asian _jlj Caribbean

Page 206
206
6. End of Online Survey
Thank you for completing this online questionnaire. To show our appreciation you have a chance to win an IPOD
touch. For more details please see below.
Thank you for your time
Best Wishes
Meenal
1. If you would like to be entered into this draw, please can you give us
either your email address or telephone number so we can contact you
if you win.
Please note that this information will be stored separately from the responses you
have made in this questionnaire.
Email Address:
Phone Number:

Page 207
207
Appendix C: Ethical Approval Letter and Supporting Documents for
Chapter 5

Page 208
208

Page 209
209

Page 210
210

Page 211
211

Page 212
212

Page 213
213

Page 214
214

Page 215
215
Appendix D: Presentation of Research
EXTERNAL
Poster Presentation: Investigating the impact of a positive affect intervention on
cardiovascular responses to acute laboratory stress (March 14th
2013).
Diabetes UK Professional Conference 2013: The Future of Diabetes: Putting Evidence
into Practice. Manchester Central Convention Complex, Manchester, 13th
- 15th
March
2013
Poster Presentation: Investigating the relationship between positive affect and health
outcomes in people living with diabetes (March 8th
2012).
Diabetes UK Professional Conference 2012: Diabetes: Overcoming Hurdles, Achieving
Success. Scottish Exhibition and Conference Centre (SECC), Glasgow, 7th
- 9th
March
2012
Poster presentation: Is Positive Affect related to Health Outcomes in People Living
with Diabetes? (September 16th
2011).
British Psychological Society, Division of Health Psychology Annual Conference &
Silver Jubilee. Southampton University, 14-16th September 2011.
Page 216
216
INTERNAL
Presentation: Diabetes and Health Outcomes: The Role of Positive Affect (25th
June
2012)
University of Brighton Doctoral College: The 1st Faculty of Science and Engineering
Post- Graduate Research Student Conference. The Impact of Your Research, 25th
– 26th
June 2012.
Presentation: Positive Psychology and Diabetes (23rd
April 2010)
Spring Festival of Social Sciences and Humanities, University of Brighton, Hastings
Campus (23rd
April 2010).
OTHER
Although these were not conferences (i.e. no abstracts were required) – the work was
still presented
Presentation: Diabetes Module: Research presented to University of Brighton, final
year pharmacy students (28th
March 2011)
Presentation: Burgess Hill and District Diabetes Support Group (24th
Feb 2010).
Poster: University of Brighton Researchers’ Poster Competition (27th
Dec 2009)

Page 217
217
ATTENDENCE ONLY
UK Society for Behavioural Medicine 7th Annual Scientific Meeting: Motivating,
enabling and prompting behaviour change for health. University of Sterling, 13th
-14th
December 2011.
Diabetes UK Professional Conference 2011: One step ahead: meeting future challenges
in diabetes. International Convention Centre (ICC) London ExCeL, 30th
March – 1st
April 2011
Diabetes UK Professional Conference 2010: Diabetes: Challenges in all ages. Arena
and Convention Centre (ACC) Liverpool, 3rd
- 9th
March 2010