
Diabetes Alphabet Soup - NPAIHB Alphabet Soup Topics • A1C, BP, and Lipid targets • SDPI Update...
55
Ann Bullock, MD Acting Director/Clinical Consultant Division of Diabetes Treatment and Prevention Indian Health Service Diabetes Alphabet Soup
-
Upload
nguyenhanh -
Category
Documents
-
view
223 -
download
2
Transcript of Diabetes Alphabet Soup - NPAIHB Alphabet Soup Topics • A1C, BP, and Lipid targets • SDPI Update...

Ann Bullock, MD Acting Director/Clinical Consultant Division of Diabetes Treatment and
Prevention Indian Health Service
Diabetes Alphabet Soup

Topics
• A1C, BP, and Lipid targets • SDPI Update • Data
– Diabetes Care and Outcomes Audit – Diabetes Prevalence Nationally and by Area – Updated ESRD Incidence
• Ever-expanding science on diabetes risk factors

Changing Guidelines for A1C, Blood Pressure, and
Lipids

Management of Hyperglycemia in Type 2 Diabetes:
A Patient-Centered Approach
Position Statement of the American Diabetes Association (ADA) and the European Association for the Study of Diabetes (EASD)
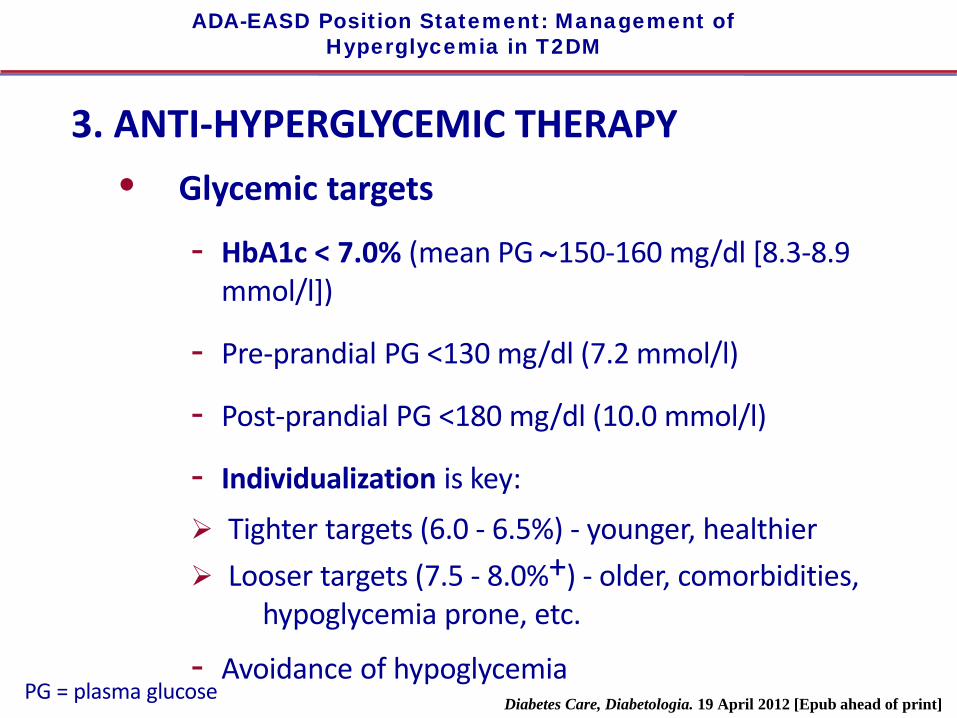
ADA-EASD Position Statement: Management of Hyperglycemia in T2DM
3. ANTI-HYPERGLYCEMIC THERAPY • Glycemic targets
- HbA1c < 7.0% (mean PG ∼150-160 mg/dl [8.3-8.9 mmol/l])
- Pre-prandial PG <130 mg/dl (7.2 mmol/l)
- Post-prandial PG <180 mg/dl (10.0 mmol/l)
- Individualization is key:
Tighter targets (6.0 - 6.5%) - younger, healthier Looser targets (7.5 - 8.0%+) - older, comorbidities,
hypoglycemia prone, etc.
- Avoidance of hypoglycemia
PG = plasma glucose Diabetes Care, Diabetologia. 19 April 2012 [Epub ahead of print]

Approach to the Management of Hyperglycemia
ADA. 6. Glycemic Targets. Diabetes Care 2015;38(suppl 1):S37. Figure 6.1; adapted with permission from Inzucchi SE, et al. Diabetes Care, 2015;38:140-149
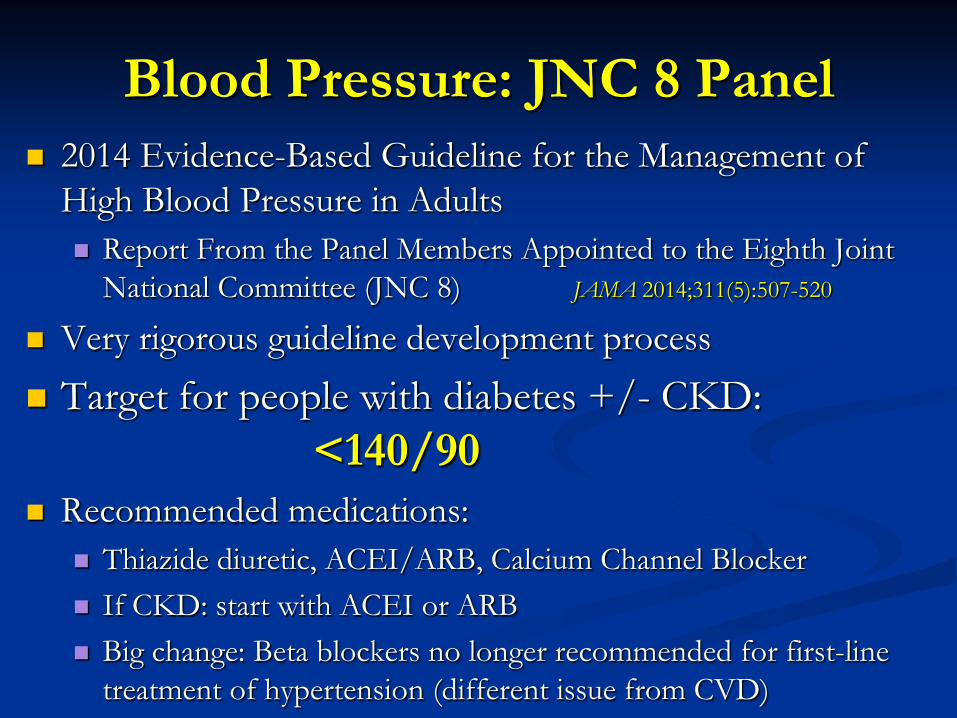
Blood Pressure: JNC 8 Panel 2014 Evidence-Based Guideline for the Management of
High Blood Pressure in Adults Report From the Panel Members Appointed to the Eighth Joint
National Committee (JNC 8) JAMA 2014;311(5):507-520
Very rigorous guideline development process
Target for people with diabetes +/- CKD: <140/90
Recommended medications: Thiazide diuretic, ACEI/ARB, Calcium Channel Blocker If CKD: start with ACEI or ARB Big change: Beta blockers no longer recommended for first-line
treatment of hypertension (different issue from CVD)

Goals • People with diabetes and hypertension should be treated to
a systolic blood pressure goal of <140 mmHg A • Lower systolic targets, such as <130 mmHg, may be
appropriate for certain individuals, such as younger patients, if it can be achieved without undue treatment burden C
• Patients with diabetes should be treated to a diastolic blood pressure <90 mmHg A
• Lower diastolic targets, such as <80 mmHg, may be appropriate for certain individuals, such as younger patients, if it can be achieved without undue treatment burden B
Recommendations: Hypertension/Blood Pressure Control
ADA. 8. Cardiovascular Disease and Risk Management. Diabetes Care 2015;38(suppl 1):S49
2013 ACC/AHA Guideline on the Treatment of Blood Cholesterol
to Reduce Atherosclerotic Cardiovascular Risk in Adults
J Am Coll Cardiol E-pub: November 12, 2013

ACC/AHA Cholesterol Guidelines
• ATP IV panel’s work in conjunction with ACC/AHA • Guideline highlights (it’s all about statins!)
– No longer recommended to treat to LDL targets – Treat w/moderate or high-intensity statin therapy:
• Clinical CVD: high-intensity if <75 y/o, moderate if older • LDL ≥190mg/dL: high-intensity • DM pts 40-75 y/o with LDL 70-189 mg/dL but no known
CVD: moderate—high-intensity if 10-yr CVD risk ≥7.5% • Other pts with 10-yr CVD risk ≥7.5%: moderate or high
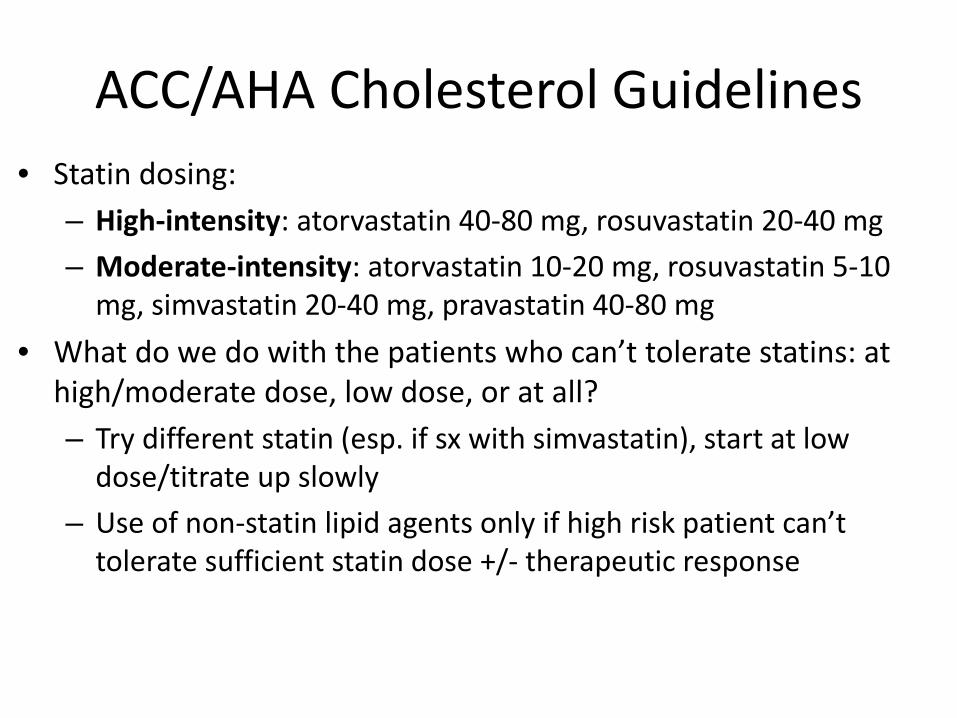
ACC/AHA Cholesterol Guidelines • Statin dosing:
– High-intensity: atorvastatin 40-80 mg, rosuvastatin 20-40 mg – Moderate-intensity: atorvastatin 10-20 mg, rosuvastatin 5-10
mg, simvastatin 20-40 mg, pravastatin 40-80 mg • What do we do with the patients who can’t tolerate statins: at
high/moderate dose, low dose, or at all? – Try different statin (esp. if sx with simvastatin), start at low
dose/titrate up slowly – Use of non-statin lipid agents only if high risk patient can’t
tolerate sufficient statin dose +/- therapeutic response

Recommendations for Statin Treatment in People with Diabetes (4)
Age Risk factors Recommended statin dose*
Monitoring with lipid panel
<40 years
None None Annually or as needed to monitor for adherence
CVD risk factor(s)**
Moderate or high
Overt CVD*** High
40–75 years None Moderate As needed to
monitor adherence
CVD risk factors High Overt CVD High
>75 years
None Moderate As needed to monitor adherence
CVD risk factors Moderate or high
Overt CVD High * In addition to lifestyle therapy. ** CVD risk factors include LDL cholesterol ≥100 mg/dL (2.6 mmol/L), high blood pressure, smoking, and overweight and obesity. *** Overt CVD includes those with previous cardiovascular events or acute coronary syndromes. ADA. 8. Cardiovascular Disease and Risk Management. Diabetes Care 2015;38(suppl 1):S52, Table 8.1

Treatment recommendations and goals • Combination therapy has been shown not to
provide additional cardiovascular benefit above statin therapy alone and is not generally recommended A
• Statin therapy is contraindicated in pregnancy B
Recommendations: Dyslipidemia/Lipid Management (6)
ADA. 8. Cardiovascular Disease and Risk Management. Diabetes Care 2015;38(suppl 1):S52

So what do we do with all this in 2015?
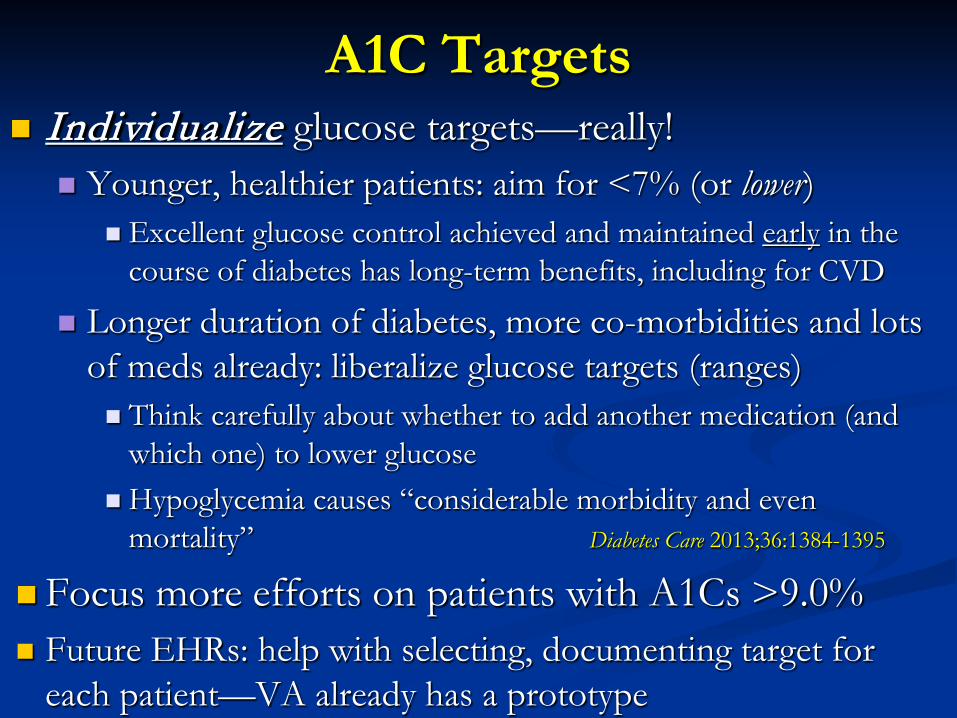
A1C Targets Individualize glucose targets—really!
Younger, healthier patients: aim for <7% (or lower) Excellent glucose control achieved and maintained early in the
course of diabetes has long-term benefits, including for CVD
Longer duration of diabetes, more co-morbidities and lots of meds already: liberalize glucose targets (ranges) Think carefully about whether to add another medication (and
which one) to lower glucose Hypoglycemia causes “considerable morbidity and even
mortality” Diabetes Care 2013;36:1384-1395
Focus more efforts on patients with A1Cs >9.0% Future EHRs: help with selecting, documenting target for
each patient—VA already has a prototype

BP Targets
<140/90: target for (most) diabetes patients Good BP control definitely reduces CVD, CKD risks Balance need for good BP control with risk of
problems Hypotension, fatigue, polypharmacy issues are common Use caution in patients who have symptoms at <140/90
and/or with meds needed to achieve it Higher risk: Older, comorbidities, longer duration of
DM, on lots of meds, autonomic neuropathy Antihypertensive meds associated with falls/injuries in
elderly JAMA Intern Med 2014;doi:10.1001/jamainternmed.2013.14764

LDL Cholesterol ACC/AHA and ADA guidelines now aligned Statin use is the major issue—prescribe them in diabetes pts:
With overt CVD: use high-intensity dose regardless of LDL Without overt CVD:
If ≥40 yrs old (esp. with any other CVD risk factor) regardless of LDL level at moderate or high-intensity
If <40 yrs old, decide based on CVD risk
What to do for patients who can’t tolerate a statin at high enough dose or at all? Non-statin lipid meds can lower LDL, but little evidence that they
reduce CVD risk Clinical judgment as to when to use these in high risk patients

Special Diabetes Program for Indians

Special Diabetes Program for Indians (SDPI)
• SDPI was established by Congress in 1997 – Today, provides $150 million/year for the prevention
and treatment of diabetes through FY 2015
• The SDPI currently provides grants for 404 programs in 35 states:
– 336 Community-Directed Programs
– 68 DP/HH Initiatives

Special Diabetes Program for Indians 1997 - 2014
$30 M $100 M $150 M 1997-2000 2001-2003 2004-2014

Special Diabetes Program for Indians
404 Grantees

SDPI Community–Directed Programs
• 336 community-directed diabetes programs:
– Implement diabetes treatment and prevention programs
based on scientifically proven Best Practices
– Are designed to address local community priorities
– Have increased access to many types of services – Large variety of diabetes treatment and
prevention programs
- Makes for challenges in quantifying direct
impact of SDPI
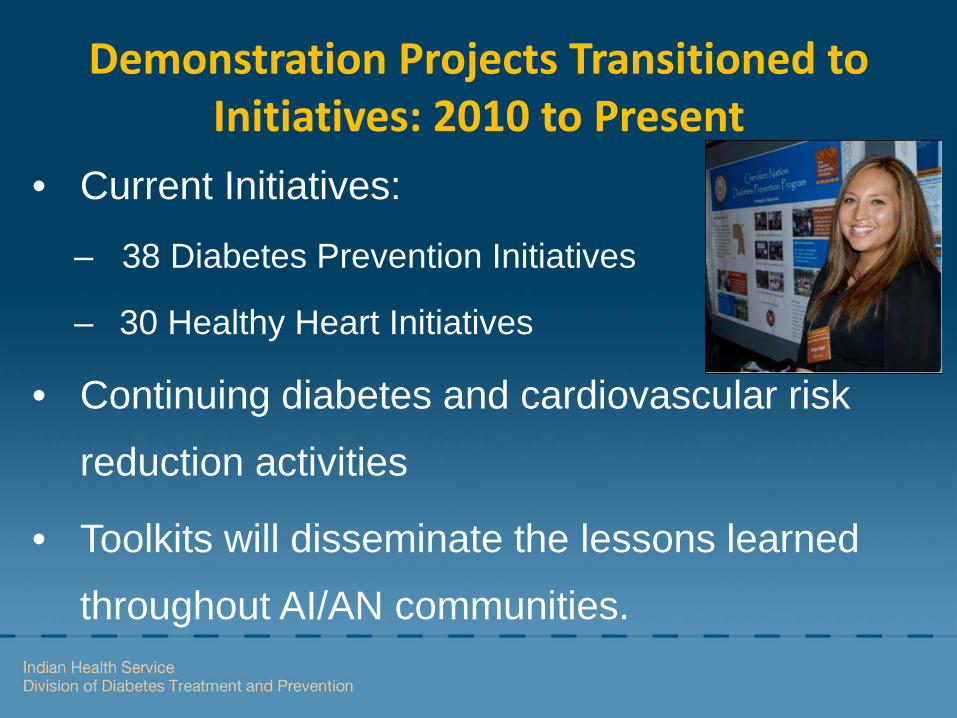
Demonstration Projects Transitioned to Initiatives: 2010 to Present
• Current Initiatives:
– 38 Diabetes Prevention Initiatives
– 30 Healthy Heart Initiatives
• Continuing diabetes and cardiovascular risk reduction activities
• Toolkits will disseminate the lessons learned throughout AI/AN communities.
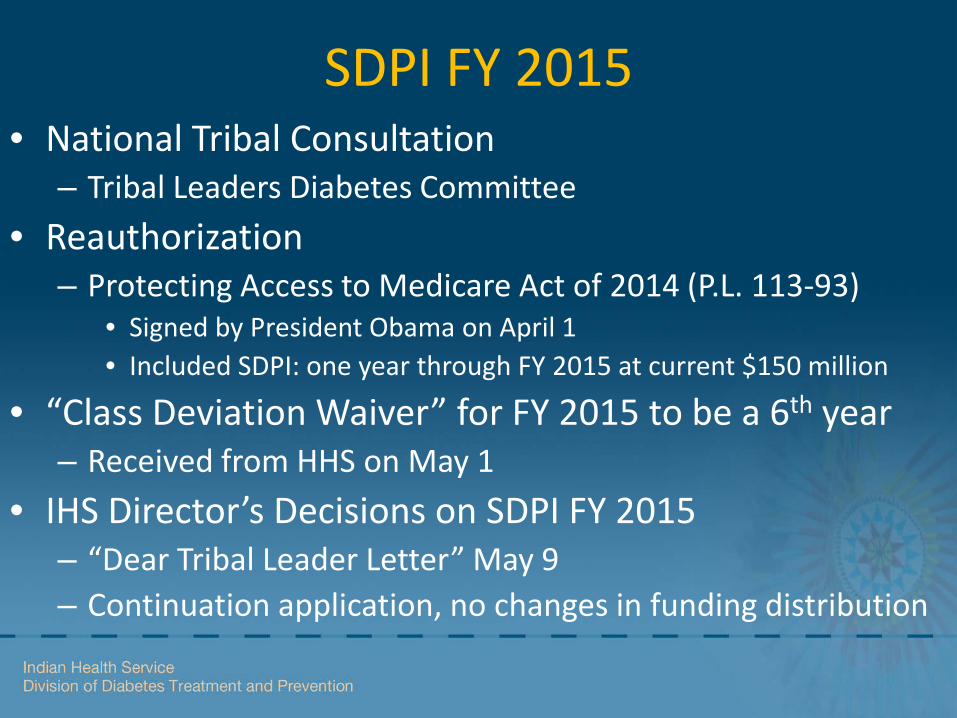
SDPI FY 2015 • National Tribal Consultation
– Tribal Leaders Diabetes Committee • Reauthorization
– Protecting Access to Medicare Act of 2014 (P.L. 113-93) • Signed by President Obama on April 1 • Included SDPI: one year through FY 2015 at current $150 million
• “Class Deviation Waiver” for FY 2015 to be a 6th year – Received from HHS on May 1
• IHS Director’s Decisions on SDPI FY 2015 – “Dear Tribal Leader Letter” May 9 – Continuation application, no changes in funding distribution

SDPI National Funding Distribution Total: $150m
– Community-Directed Grants (I/T): $108.9m
– Diabetes Prevention/Healthy Heart Grants: $27.4m
– Set-Asides:
• Urban Indian Health Programs: $7.5m
• Data Infrastructure Improvement: $5.2m
• CDC Native Diabetes Wellness Program: $1.0m

FY 2016 and Beyond • Will SDPI be reauthorized?
– If so, 1 year? Multi-year?
• Regardless, if there is SDPI in FY 2016, will almost certainly have to be a competitive application year – Will there be any changes in SDPI? – Tribal consultation
• TLDC meetings: September 11-12, February 4-5, 2015
• New Best Practices format – Tied to Audit elements

IHS Division of Diabetes Treatment and Prevention
(DDTP)
Diabetes Care and Outcomes Audit 2014
331 I/T/U Facilities
115,724 Charts

0
40
80
120
160
200
240
280
320
360
# of
Fac
ilitie
s
Audit Year
Number of Participating Facilities 1997-2014
Source: IHS Diabetes Care and Outcomes Audit

0
10
20
30
40
50
60
70
80
90
100
110
120
Num
ber o
f Cha
rts
(100
0's)
Audit Year
Number of Charts Audited 1997-2014
Source: IHS Diabetes Care and Outcomes Audit

6.0
6.5
7.0
7.5
8.0
8.5
9.0
9.5
10.0
Mea
n A1
C (%
)
Audit Year
Mean A1C 1997-2014
Source: IHS Diabetes Care and Outcomes Audit
0
10
20
30
40
50
60
70
80
90
100
% P
atie
nts
Audit Year
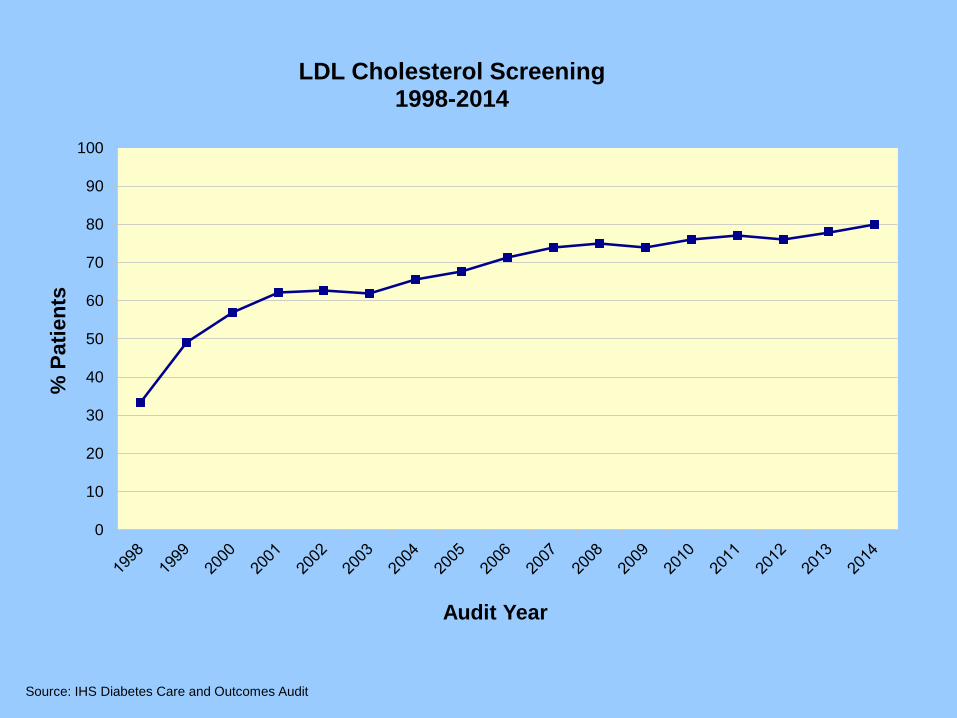
LDL Cholesterol Screening 1998-2014
Source: IHS Diabetes Care and Outcomes Audit

70
80
90
100
110
120
130
140
150
Mea
n LD
L C
hole
ster
ol (m
g/dl
)
Audit Year
Mean LDL Cholesterol 1998-2014
Source: IHS Diabetes Care and Outcomes Audit

60
70
80
90
100
110
120
130
140
150
160
Mea
n B
P (m
mH
G)
Audit Year
Mean Blood Pressure 1997-2014
Source: IHS Diabetes Care and Outcomes Audit
Systolic
Diastolic

0
10
20
30
40
50
60
70
80
90
100
% P
atie
nts
with
Exa
m D
one
Audit Year
Exams 1997-2014
Foot Exam Eye Exam
Source: IHS Diabetes Care and Outcomes Audit

0
10
20
30
40
50
60
70
80
90
100
% P
atie
nts
Audit Year
Immunizations 1997-2014
Pneumovax
Flu Vax
Source: IHS Diabetes Care and Outcomes Audit

0
10
20
30
40
50
60
70
80
90
100
% P
atie
nts
Audit Year
Td/Tdap 1998-2014
Source: IHS Diabetes Care and Outcomes Audit

0
10
20
30
40
50
60
70
80
90
100
% P
atie
nts
Audit Year
Hepatitis B Vaccine 2012-2014
Source: IHS Diabetes Care and Outcomes Audit

0
10
20
30
40
50
60
70
80
90
100
% P
atie
nts
Audit Year
Education 1997-2014
DM Nutrition Physical Activity
Source: IHS Diabetes Care and Outcomes Audit

0
10
20
30
40
50
60
70
80
90
100
% P
atie
nts
Audit Year
Tobacco Use and Cessation Counseling 1998-2014
Use Cessation Counseling in Users
Source: IHS Diabetes Care and Outcomes Audit
0
10
20
30
40
50
60
70
80
90
100
% P
atie
nts
Audit Year
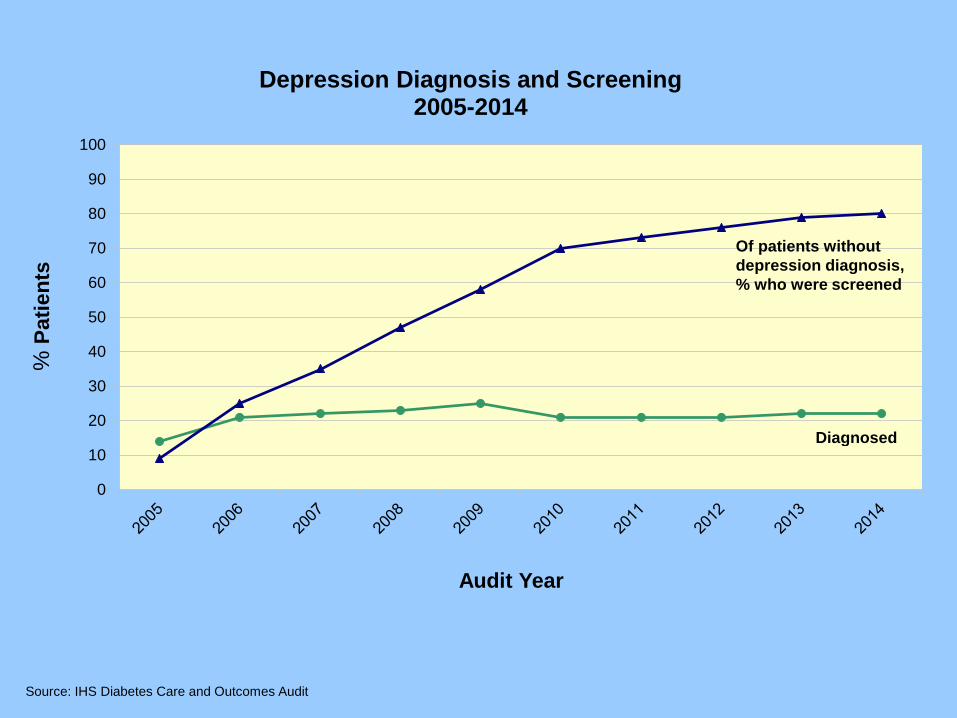
Depression Diagnosis and Screening 2005-2014
Diagnosed
Of patients without depression diagnosis, % who were screened
Source: IHS Diabetes Care and Outcomes Audit

0
10
20
30
40
50
60
70
80
90
100
% P
atie
nts
Audit Year
Diagnosed CVD 2013-2014
Of patient with CVD dx, antiplatelet therapy prescribed
Of patients with CVD dx, statin prescribed
Diagnosed CVD
Source: IHS Diabetes Care and Outcomes Audit

0
10
20
30
40
50
60
70
80
90
100
% P
atie
nts
Audit Year
Combined Measures 2013-2014
eGFR and UACR
A1c<8% & LDL<100 & BP<140/<90
Source: IHS Diabetes Care and Outcomes Audit
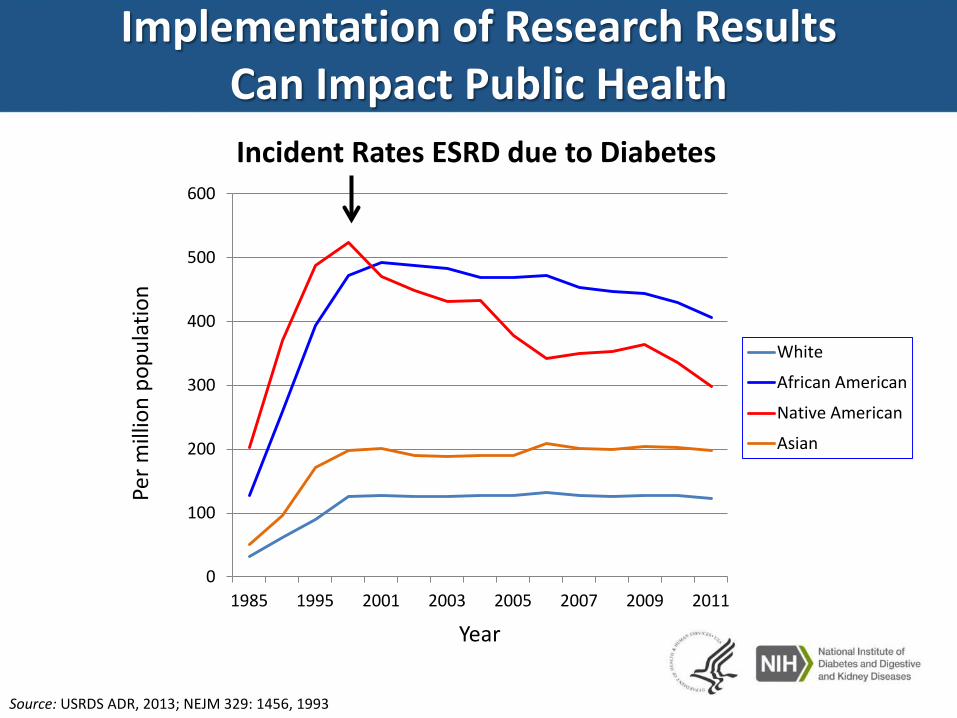
Implementation of Research Results Can Impact Public Health Incident Rates ESRD due to Diabetes
Per m
illio
n po
pula
tion
Year
0
100
200
300
400
500
600
1985 1995 2001 2003 2005 2007 2009 2011
White
African American
Native American
Asian
Source: USRDS ADR, 2013; NEJM 329: 1456, 1993

Diabetes Prevalence in AI/AN People*
2006-2013
*Among patients who seek care from sites which submit data to the IHS National Data
Warehouse

0
5
10
15
20
25
30
35
40
2006 2007 2008 2009 2010 2011 2012 2013
Diab
etes
Pre
vale
nce
(%)
Fiscal Year Prepared By: IHS Division of Diabetes Treatment and Prevention, June 2014 Data Source: IHS National Data Warehouse General Data Mart
Diabetes Prevalence in American Indians and Alaska Natives: 2006-2013 Adults (20+) - Age Adjusted to the US Population

0
5
10
15
20
25
30
35
40
2006 2007 2008 2009 2010 2011 2012 2013
Diab
etes
Pre
vale
nce
(%)
Fiscal Year Prepared By: IHS Division of Diabetes Treatment and Prevention, June 2014 Data Source: IHS National Data Warehouse General Data Mart
65+
45-64
20-44
<20
Diabetes Prevalence in American Indians and Alaska Natives by Age Group: 2006-2013

0 5 10 15 20 25 30 35 40
Alaska
Portland
California
Oklahoma
Bemidji
IHS
Navajo
Billings
Aberdeen
Albuquerque
Nashville
Phoenix
Tucson
Diabetes Prevalence (%)
Diabetes Prevalence in American Indians and Alaska Natives By Area for FY 2013
Adults (20+) - Age Adjusted to the US Population
Prepared By: IHS Division of Diabetes Treatment and Prevention, June 2014 Data Source: IHS National Data Warehouse General Data Mart

Diabetes Prevalence in Youth
• SEARCH for Diabetes in Youth Study – AI youth have the
• Lowest prevalence of type 1 diabetes (0.35 per 1000) • Highest prevalence of type 2 diabetes (1.2 per 1000)
– Between 2001 and 2009, prevalence of type 2 diabetes
• Increased in whites, Hispanic, and black youth • No increase in AI or API youth JAMA 2014;311:1778-1786

Thank you for all you do to
improve the health of AI/AN people in the Portland Area
www.diabetes.ihs.gov

A very short discussion of the emerging science around
diabetes risk factors

Emerging science on DM risk factors
• In utero and early life stress/nutrition – Leg length in adulthood (marker of early life deprivation)
independently assoc with lower insulin sensitivity Diabetes Care 2013;36:3599-3606 – Lower insulin sensitivity predicts decline in physical activity
in peripubertal Hispanic and African American girls Diabetes Care 2013;36:3739-3745
• Diet quality associated with weight gain even if calories restricted – Overeating, ↓ physical activity as consequences of poor
diet quality, stress JAMA, published online May 16, 2014

“Understanding the Origins of Diabetes” “Despite the emphasis on Western lifestyle as contributing to NCD risk, attempts to address the problem through modifying behavior in adults have met with limited success, indicating that such interventions occur too late in life to reduce risk substantially. Attention is now focused on ways in which early developmental factors contribute to later NCD risk, offering a new approach to how NCDs, such as diabetes, are inherited. …Aspects of the early developmental environment, reflected in the diet, behavior, and lifestyle of the mother and …father, play an important role, acting on the developing fetus through epigenetic processes that appear to contribute to risk via links to adiposity.” JAMA 2014;311:575-576 • Inverse association between gestational age and elevated
insulin levels at birth and in early childhood JAMA 2014:311:587-596

Association Between Casino Opening and Obesity
117 school districts that encompassed tribal lands in California between 2001 and 2012 57 gained/expanded a casino 24 had a preexisting casino but did not expand 36 never had a casino
Every slot machine per capita gained was assoc with a $541 ↑ in per capita annual income and a decrease in percentage in poverty of 0.6% among AI living on tribal lands And ↓ probability of overweight/obesity of 0.19% in AI kids
JAMA 2014;311:929-936

“Early Life Investments Substantially Boost Adult Health”
Carolina Abecedarian Project
Study: 4 cohorts of disadvantaged children born 1972-77 Birth thru age 5 yrs Intervention children received
Devel of language, emotional regulation, cognitive skills Caregiving/supervised play Nutrition: 2 meals and a snack at childcare center Primary pediatric care
In their mid-30s: lower prevalence of CVD and metabolic disease risk factors incl BP, A1C, obesity, HDL c/w controls
Science 2014;343:1478-1485

Imagine what our interventions to
prevent diabetes will look like!


