
DIA-CORE POLICY BRIEF Costs and Benefits of RES in...
13
Page 1 DIA-CORE POLICY BRIEF Costs and Benefits of RES in Europe up to 2030 Marijke Welisch, Gustav Resch, Arno Behrens and Monica Alessi 24 June 2014 Key Messages and Recommendations System-related benefits in terms of avoided fossil fuels and CO2 emissions vary considerably across Member States. Similarly, system-related costs, and in particular those related to capital expenditures, also vary across Member States and represent a substantial share of GDP for some of them. The financial burden of the binding EU-wide RES target of at least 27% of the EU’s energy consumption by 2030 seems to be bearable. However, a clear concept and an agreement on the effort sharing across Member States has to follow. Alternative scenarios show that despite increased costs, a higher target set at EU level would increase system related benefits significantly. In addition, it would benefit the EU trade balance due to a (significantly) decreased demand for fossil fuels and related imports from abroad. If prevailing non-economic barriers were removed and energy efficiency measures implemented, a higher RES share for 2030 of 30% or more would be much more easily achievable. A trend among Member States shows that overall, Eastern European and Baltic states face higher support expenditures but also benefit more in terms of avoided fossil fuels and CO2 emissions. Launched in April 2013, DIA-CORE is carried out under the Intelligent Energy Europe programme. Its main objective is to ensure a continuous assessment of the existing policy mechanisms and to establish a fruitful stakeholder dialogue on future policy needs for renewable electricity (RES-E), heating & cooling (RES-H) and transport (RES-T). Thus, DIA-CORE seeks to facilitate convergence in RES support across the EU and to enhance investments, cooperation and coordination.
Transcript of DIA-CORE POLICY BRIEF Costs and Benefits of RES in...

Page 1
DIA-CORE POLICY BRIEF
Costs and Benefits of RES in Europe up to 2030 Marijke Welisch, Gustav Resch, Arno Behrens and Monica Alessi
24 June 2014
Key Messages and Recommendations
System-related benefits in terms of avoided fossil fuels and CO2
emissions vary considerably across Member States. Similarly, system-related costs, and in particular those related to capital expenditures, also vary across Member States and represent a substantial share of GDP for some of them. The financial burden of the binding EU-wide RES target of at least 27% of the EU’s energy consumption by 2030 seems to be bearable. However, a clear concept and an agreement on the effort sharing across Member States has to follow.
Alternative scenarios show that despite increased costs, a higher target set at EU level would increase system related benefits significantly. In addition, it would benefit the EU trade balance due to a (significantly) decreased demand for fossil fuels and related imports from abroad.
If prevailing non-economic barriers were removed and energy efficiency measures implemented, a higher RES share for 2030 of 30% or more would be much more easily achievable.
A trend among Member States shows that overall, Eastern European and Baltic states face higher support expenditures but also benefit more in terms of avoided fossil fuels and CO2 emissions.
Launched in April 2013, DIA-CORE is carried out under the Intelligent Energy Europe programme. Its main objective is to ensure a continuous assessment of the existing policy mechanisms and to establish a fruitful stakeholder dialogue on future policy needs for renewable electricity (RES-E), heating & cooling (RES-H) and transport (RES-T). Thus, DIA-CORE seeks to facilitate convergence in RES support across the EU and to enhance investments, cooperation and coordination.
Page 2
1 Introduction
This Policy Brief follows-up on the DIA-CORE Policy Brief on “Assessing costs and benefits of deploying renewables”, dated 26 September 2014, which highlighted the complexities in making a comprehensive and appropriate assessment of costs and benefits resulting from an increased use of renewable energy sources (RES). It distinguished the different types of effects into system-related effects, distributional effects and macro-economic effects, and looked at the related data requirements, which need to be comprehensive and standardised.
This DIA-CORE Policy Brief uses the tools proposed in the previous Policy Brief to estimate the effects on Member States of reaching the EU-wide RES target of 27% of the EU’s energy consumption by 2030. This allows to draw some conclusions on the differentiated impacts across Member States, and the potential implications for an effort sharing approach. It also assesses whether a higher ambition level could be beneficial. The paper also takes into account the implications of national policy frameworks and highlights the importance of reforms to reduce the costs of RES adoption.
The policy context - past progress and future perspectives for RES in the EU
The first decade of the new millennium was characterised by a continuously growing deployment of RES across EU Member States – total RES generated output increased by more than 40%. The structural changes in Europe’s energy supply are the result of a combination of strong national policies and the general focus on RES created by the EU Renewable Energy Directives in the electricity and transport sectors towards 2010 (2001/77/EC and 2003/30/EC).
The pathway for renewables towards 2020 was set and accepted by the European Council, the European Commission and the European Parliament in April 2009. The related policy package, in particular the EU Directive on the support of energy from renewable sources (2009/28/EC), subsequently named RES Directive, comprises the establishment of binding RES targets for each Member State. The calculation of the particular targets is based on an equal RES share increase modulated by the respective Member State’s GDP per capita. This provides a clear framework and vision for renewable technologies in the short to mid-term.
Despite the growth of the RES sector over the last decade, substantial challenges still lie ahead. The EU Energy Roadmap 2050 gave first signals of renewable energy development pathways beyond the year 2020 and identified renewables as a “no-regret” option. A binding EU-wide RES target of achieving at least 27% as RES share in gross final energy demand was adopted. This has to be seen as an important first step in defining the framework for RES post 2020. Other steps, like a clear concept for and agreement on the effort sharing across Member States have to follow.

Page 3
The aim of this Background Report is to present costs and benefits resulting from increased RES deployment in the 2020 and 2030 frameworks. After briefly outlining the methodology, the key findings are presented followed by policy conclusions and recommendations.
Methodological Aspects
To properly assess impacts of RES deployment, the system boundaries must be clearly defined as should research question and time horizon. Another question is the dimension of the effect, i.e. whether we focus on economic effects only or whether environmental, technological and social effects should be included as well.
Allocating costs to a RES-based technology system, to a fossil fuel based system, or to heat and power is not always clear-cut. Therefore, the analysed technologies and systems (heat, electricity) should be (clearly) specified. Furthermore, the geographic area that is covered by the analysis is crucial as well as whether sectoral or overall economic effects are considered. When looking at the impacts of RES deployment or RES policies, three main types of effects can be identified (see Figure 1) that occur at three different levels:
Figure 1: Categories of main effects related to RES deployment
Source: Breitschopf and Diekmann, 2011, adapted
System-related effects encompass all benefits and direct and indirect costs of RES deployment. While direct costs are directly related to electricity or heat generation, indirect costs are caused by integrating RE into the existing generation system. Benefits from RES-

Page 4
use arise e.g. as a result of avoided GHG emissions and air pollutants. The main characteristics of system-related costs and benefits are that they represent additional costs or benefits of a RES-based generation system compared to a reference system based on fossil fuels and nuclear. System-related effects reflect the costs of input factors based on market prices (labour, capital, natural resources). Capital expenditures are also taken into account for the analysis. However, in this paper, capital expenditures are regarded as investments that need to be taken - but not as costs per se. They thus do not fall into the cost category but are displayed as a third neutral category.
Distributional effects focus on costs that accrue for selected economic agents or groups from a micro-economic perspective. They show to what extent the different economic agents have to bear the additional costs or benefit from the additional positive effects – who pays for RES deployment and who receives the resulting revenues from this deployment.
Macro-economic effects are measured at the macro-level and comprise gross and net effects in an economy. Gross effects refer to the RE sector, i.e. they show the effects in all industries that are directly related to RES. To get the real net effects (net employment, GDP) of RES deployment – net of all costs – for the overall economy (all sectors) all positive and negative effects of RES deployment should be included.
Figure 2: GDP per capita [€1000/capita] (average 2011-2020) of the EU28
To put the effects outlined in the following sections into perspective, Figure 2 depicts the respective Member State’s GDP per capita. This way, absolute effects as shown in Figure 7 for the EU28 level are made quantifiable in their relative values at country level as well (cf. Figure 7).
Figure 3: Deployment by 2020 of new RES (installed in the period of 2011 to 2020)

Page 5
Figure 3, on the other hand, shows how the 2020 generation that stems from new RES installations of this decade (i.e. 2011 to 2020) is to be valued at Member State level, for comparative reasons expressed as (RES) share in the respective Member State’s gross final energy demand.1 Note that all subsequent indicators refer to this expansion.
The policy assessment tool: the Green-X model
By use of a specialised energy system model (Green-X) a quantitative assessment was conducted to show pathways of possible RES developments up to 2030. As in previous European projects such as FORRES 2020, OPTRES or PROGRESS the Green-X model2 was applied to perform a detailed quantitative assessment of the future deployment of renewable energies on country-, sector- as well as technology level. The core strength of this tool lies in the detailed RES resource and technology representation accompanied by a thorough energy policy description, which allows assessing various policy options with respect to resulting costs and benefits.
2 Costs and Benefits of RES up to 2020
In this section we show costs and benefits of RES installations added between 2011 and 2020 on the aggregated EU-level as well as disaggregated for the 28 EU Member States. The results focus on five categories. Costs of new RES installations include support expenditures and additional generation costs. Capital expenditures are counted as a neutral category, being neither costs nor benefits, as they do imply expenditures but also induce macro-economic added value. Benefits of new RES installations include avoided fossil fuel costs and avoided costs for CO2 emissions.
For the period up to 2020 different intensities of cooperation between the Member States were analysed. The ranges of the results presented below result from three different scenarios depicting limited, medium and strong intensities of cooperation between Member States.
The results show that the largest bandwidth occurs with support expenditures. The maximum average annual expenditures for this period are €25.2 billion at EU level whereas in the case of stronger cooperation between EU Member States this value falls to €23.5 billion per year. The other categories do not exhibit such substantial variance. Specifically, additional generation costs are roughly at €3.8 billion per year, whereas capital expenditures are significantly higher at €71 to €72 billion.
1 The research interest lies in assessing costs and benefits for the period 2011 to 2020 and specifically of the new deployment of RES needed to achieve the 2020 targets. Therefore, the focus of the analysis is only on new RES installations in the period 2011-2020.
2 For a detailed description of the model, please refer to www.green-x.at
Page 6
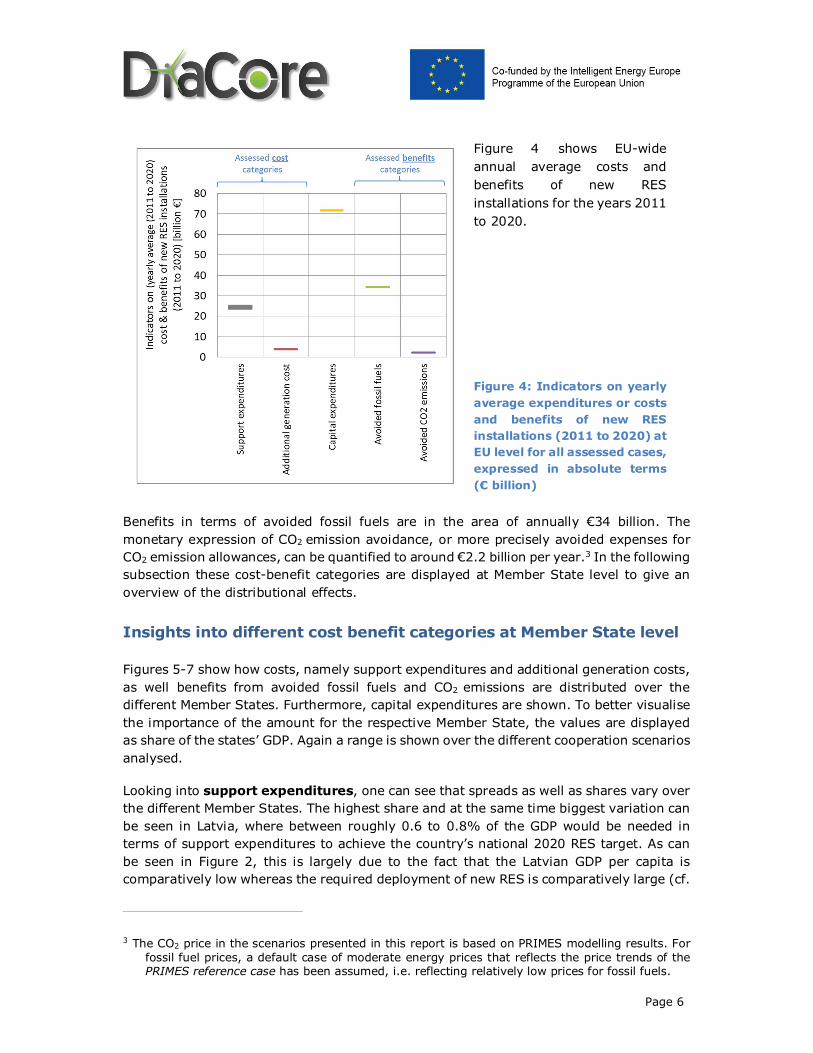
Figure 4 shows EU-wide annual average costs and benefits of new RES installations for the years 2011 to 2020.
Figure 4: Indicators on yearly average expenditures or costs and benefits of new RES installations (2011 to 2020) at EU level for all assessed cases, expressed in absolute terms (€ billion)
Benefits in terms of avoided fossil fuels are in the area of annually €34 billion. The monetary expression of CO2 emission avoidance, or more precisely avoided expenses for CO2 emission allowances, can be quantified to around €2.2 billion per year.3 In the following subsection these cost-benefit categories are displayed at Member State level to give an overview of the distributional effects.
Insights into different cost benefit categories at Member State level
Figures 5-7 show how costs, namely support expenditures and additional generation costs, as well benefits from avoided fossil fuels and CO2 emissions are distributed over the different Member States. Furthermore, capital expenditures are shown. To better visualise the importance of the amount for the respective Member State, the values are displayed as share of the states’ GDP. Again a range is shown over the different cooperation scenarios analysed.
Looking into support expenditures, one can see that spreads as well as shares vary over the different Member States. The highest share and at the same time biggest variation can be seen in Latvia, where between roughly 0.6 to 0.8% of the GDP would be needed in terms of support expenditures to achieve the country’s national 2020 RES target. As can be seen in Figure 2, this is largely due to the fact that the Latvian GDP per capita is comparatively low whereas the required deployment of new RES is comparatively large (cf.
3 The CO2 price in the scenarios presented in this report is based on PRIMES modelling results. For fossil fuel prices, a default case of moderate energy prices that reflects the price trends of the PRIMES reference case has been assumed, i.e. reflecting relatively low prices for fossil fuels.

Page 7
Figure 3). Thus, this shows that especially the lower income Member States partly face relatively high expenditures in direct comparison. Most of the other Member States range in the area of 0.1 to 0.2% of their GDP in this cost category. These values can be quite diverging when looking at the respective absolute values of GDP. While e.g. Cyprus and Sweden exhibit the same relative share in support costs, Sweden’s GDP per capita is nearly double the Cyprian. This benchmark has to be kept in mind when interpreting all relative values depicted in the following. The EU average lies close to 0.2% of GDP.
Additional generation costs have a more diverse distribution in the share of GDP of the respective member states, whereas the share is comparatively small in all countries Czech Republic exhibits the highest share in the given range, with around 0.12%. It is followed by Slovakia, Finland and Denmark which all have shares of around 0.06% of their GDP in additional generation costs. Countries with very low shares are e.g. Cyprus, Greece or the Netherlands with below 0.02%. The EU average lies at 0.04%.
The next category, capital expenditures taken on by the respective member states shows even more variation over the different states and at a much higher level – up to almost 1.6 % of GDP for some states as Latvia and Bulgaria. Outliers with quite low shares of their GDP (around 0.2%) in terms of capex are the UK, the Netherlands and Luxembourg. An average value over all 28 EU Member States lies around 0.54% of GDP. Austria, Belgium, Cyprus and Germany, for example can also be located in this area with their range over the different scenarios.
Figure 5: Range of average yearly values of costs for new RES installations (2011-2020)

Page 8
Figure 6: Range of average yearly values of capital expenditures for new RES
installations (2011-2020)
Figure 7: Range of average yearly values of benefits for new RES installations (2011-
2020)
Looking into benefits from new RES installations, avoided fossil fuels is the first category that has been assessed. Member States that benefit the most in relative terms are Finland, Sweden and Latvia, saving around 0.8, 0.7 and 0.9% of their GDP. Countries that exhibit lower savings are the UK, the Netherlands and Malta – all three are below the threshold of 0.2% of GDP. The EU average lies at 0.26% of GDP.
Finally, savings can be quantified for the avoided CO2 emissions in the different scenarios assessed. Again variation is quite large in the EU, but the share of GDP is significantly smaller than with avoided fossil fuels. Countries benefitting the most are Estonia, Sweden, Finland and Bulgaria – all smaller or equal 0.05% of their GDP. The EU average lies below 0.02% of the GDP in this case. An important point concerning savings in fossil fuels and avoided CO2 emissions is that countries substituting more of their conventional power plants benefit relatively more in these categories.
A trend among Member States shows that overall, Eastern European and Baltic states face higher support expenditures but also benefit more in terms of avoided fossil fuels and CO2

Page 9
emissions. Countries that are already well on track with their target achievement do not observe substantial increases in neither category.
3 Outlook to 2030
This section illustrates the outcomes of the model-based assessment of future RES deployment up to 2030 within the European Union and regarding the Member States according to different RES policy pathways.
Direct impacts of future RES deployment: Costs, expenditures and benefits related to (at least) 27% RES by 2030
The outcomes of Green-X modelling related to capital, O&M, and fuel expenditures of RES as well as to additional generation costs, support expenditures and savings related to fossil fuel (imports) are presented in this section. The results are complemented by a short qualitative discussion based on key indicators.
The scenarios analysed combine two different characteristics: different ambition levels for RES deployment in 2030 in particular and different support policies for renewables from 2020 onwards.
In the “Strengthened National Policies (SNP)” scenario (that relates to a target of 27% RES by 2030), a continuation of the current policy framework with national RES targets (for 2030 and beyond) is assumed. Each country uses national support schemes in the electricity sector to meet its own target, complemented by RES cooperation if necessary. Support levels are generally based on technology specific generation costs per country.
In the scenarios referring to the use of a quota system (i.e. QUO-27 and QUO-30), an EU-wide harmonised support scheme is assumed for the electricity sector, such that the marginal technology to meet the EU RES-target sets the price for the overall portfolio of RES technologies in the electricity sector. The policy costs occurring in the quota system can be calculated as the certificate price multiplied by the RES generation under the quota system. Each type of consumer across the EU then pays the same (virtual) surcharge per unit of electricity consumed.4
As a further sensitivity variant for the 27% RES by 2030 target we assessed the impact of having no dedicated support for biofuels post 2020.
As reference for all alternative policy scenarios, a baseline case is derived, assuming that RES policies are applied as currently implemented (without any adaptation) until 2020,
4 In the same way as assumed for other support schemes the contribution of industry consumers will be limited to 20% of the relative levy and the remaining amount will be distributed among households and services.

Page 10
while for the post-2020 timeframe a gradual phase-out of RES support is presumed. Moreover, in the baseline case it is assumed that non-economic barriers remain.
Indicators of costs, expenditures and benefits of RES
Figure 8: Indicators on yearly average cost, expenditures and benefits of RES at EU28 level for
all assessed cases, monetary expressed in absolute terms (€ billion) per decade (2021 to 2030)
Figure 8 summarises the assessed costs, expenditures and benefits arising from future RES deployment in the focal period 2021 to 2030. More precisely, these graphs show the additional5 investment needs, O&M and (biomass) fuel expenditures and the resulting costs – i.e. additional generation cost, and support expenditures for the selected cases (all on average per year throughout the assessed period). So to say, all values are deviations from the baseline scenario, i.e. discontinuing support policies for RES after 2020 (i.e. a gradual phase-out in accordance with PRIMES reference scenario is presumed) which would lead the EU to a RES share of 21.1% in 2030 according to Green-X modelling results. Moreover, they indicate the accompanying benefits in terms of supply security (avoided fossil fuels expressed in monetary terms – with impact on a country’s trade balance) and climate protection (avoided CO2 emissions – expressed in monetary terms as avoided expenses for emission allowances).
Some key observations can be made from Figure 8:
Not so surprisingly scenarios that reach a 27% target lead to overall costs in a comparable order of magnitude. Also it can be observed that a 27% Quota generally leads to lower capital expenditures as well as lower additional generation costs compared to the case of national policies. However these savings can hardly be
5 Additional here means the difference to the baseline for all policy cases and indicators, indicating the additional costs or benefits accompanying the anticipated RES policy intervention.
05
101520253035404550
Avoided fossilfuels
Avoided CO2emissions
Capitalexpenditures
Fuelexpenditures
O&Mexpenditures
Additionalgeneration cost
Supportexpenditures
Indi
cato
rs o
n co
st, e
xpen
ditu
res &
be
nefit
s of R
ES i
n th
e pe
riod
2021
to
2030
-ye
arly
ave
rage
val
ues (
2021
to
2030
), de
viat
ion
to b
asel
ine
[bill
ion
€]
SNP-27 QUO-27 QUO-27 (no biofuel support) QUO-30
Page 11
passed on to consumers due to the “one size fits all” approach inherent to all technology neutral policy instruments.6
Moving from a 27% to a 30% target comes at a cost, in this case average additional generation costs increase by about 50% to about €7.5 billion per year in order to “achieve” the last three percentage points of RES deployment.
These extra costs however are also mirrored by increasing benefits. In all scenarios average yearly capital expenditures are surpassed by the monetary value of avoided fossil fuels. In other words: Fuel cost savings of conventional plants alone are sufficient to finance the support expenditures necessary for new RES installations.
System-related benefits in terms of avoided fossil fuels and avoided CO2 emissions have a larger effect for those states that substitute more of their fossil generation, so depending on where new RES installations are deployed, CO2 emission avoidance will develop differently.
Furthermore when interpreting the numbers it has to be kept in mind that all scenarios assume a reference case with respect to energy demand development. Thus efficiency improvements could make a 30% target much more easily achievable.
4 Concluding remarks
As shown in the introductory section of this Background Report, it is a challenging task to appropriately assess costs and benefits resulting from an increased use of renewables. The analysis performed with the Green-X model served to better understand especially the system related dimension and produces the following results:
Costs and benefits of RES deployment in the 2020 context
The European Commission guidance for the design of renewables support schemes highlights maximising the benefits from intra-European trade in renewable energy through cooperation mechanisms as a key measure to ensure that Europe's energy market can function efficiently. The quantitative results above show that costs and benefits of RES targets are rather unevenly distributed among EU Member States. Therefore stronger cooperation between countries will be of mutual benefit.
Quite some variation among Member States can be observed in the different cost and benefit categories. Concretely, system-related benefits in terms of avoided fossil fuels and avoided CO2 emissions are visible in all Member States, but have a larger effect for those states who substitute more of their fossil generation, not least for exporting RES under a increased RES cooperation scenario. Support costs, which fall under the term of distributional effects are quite stable across different members and amount to a share of 0.2% of GDP in an EU average. At the same time, capital expenditures are quite high
6 The rationale behind this is that technology neutral instruments enable windfall profits for producers of cheaper technologies. The result is that the main share of the profits remains on the producer side. Nevertheless, the differences are negligible in this respect.

Page 12
overall and make up a substantial share of GDP for some Member States, whereas the rise in generation costs is relatively small at an average of 0.04% of EU-wide GDP.
Prospects for RES beyond 2020
The binding EU-wide RES target of achieving at least 27% as RES share in gross final energy demand as adopted recently by the Council has to be seen as an important first step in defining the framework for RES post 2020. Other steps, like a clear concept for and an agreement on the effort sharing across Member States have to follow.
The agreed target of 27% RES appears feasible to achieve but not without a financial burden for the EU and at country level. Alternative policy scenarios related to 27% RES by 2030 lead to moderate increases in system costs and support expenditures at EU-28 level compared to baseline conditions (where a phase-out of RES support beyond 2020 is presumed). At the same time generation costs do not increase substantially with a high ambition target for RES deployment.
With a higher ambition for the target set at EU level, system related benefits would in turn increase, i.e. significantly more fossil fuels and CO2 emissions would be avoided. Regardless, the increase in renewables would come along with increased benefits related to Europe’s trade balance due to a (significantly) decreased demand for fossil fuels and related imports from abroad.
A clear and guiding framework and a removal of currently prevailing non-economic barriers is however a key necessity to keep the cost burden low and to balance costs nicely with accompanying benefits. More than 27% RES by 2030 appears feasible but requires additional efforts to be taken.

Page 13
5 References
Breitschopf, B, Held, A. (2014): Guidelines for assessing costs and benefits of RET deployment. Report compiled within the European project DiaCore, supported by Intelligent Energy, IEE/12/833/SI2.645735, Fraunhofer ISI, Karlsruhe, Germany. Accessible at: http://diacore.eu/
COM (2014) 15 final, A policy framework for climate and energy in the period from 2020 to 2030, Brussels, 22.1.2014.
DIRECTIVE 2001/77/EC OF THE EUROPEAN PARLIAMENT AND OF THE COUNCIL of 27 September 2001 on the promotion of electricity produced from renewable energy sources in the internal electricity market
DIRECTIVE 2003/30/EC OF THE EUROPEAN PARLIAMENT AND OF THE COUNCIL of 8 May 2003 on the promotion of the use of biofuels or other renewable fuels for transport
DIRECTIVE 2009/28/EC OF THE EUROPEAN PARLIAMENT AND OF THE COUNCIL of 23 April 2009 on the promotion of the use of energy from renewable sources and amending and subsequently re-pealing Directives 2001/77/EC and 2003/30/EC
European Commission (2013): EU energy, transport and GHG emissions trends to 2050: Reference Scenario 2013. DG Energy, DG Climate Action and DG Mobility and Transport, December 2013.
Klessmann, C., de Visser, E., Wigand, F., Gephart, M., Resch, G., Busch, S. (2014). Cooperation between EU Member States under the RES Directive – Task 1, A report compiled within the European project “Cooperation between EU MS under the Renewable Energy Directive and interaction with support schemes”, Project number: DESNL13116.
Ragwitz, M., Steinhilber, S., Breitschopf, B., Resch, G., Panzer, C., Ortner, A., Busch, S., Rathmann, M., Klessmann, C., Nabe, C., De Lovinfosse, I., Neuhoff, K., Boyd, R., Junginger, M., Hoefnagels, R., Cusumano, N., Lorenzoni, A., Burgers, J., Boots, M., Konstantinaviciute, I. and Weöres, B. (2012), RE-Shaping: Shaping an effective and efficient European renewable energy market. Report compiled within the European project RE-Shaping, supported by Intelligent Energy - Europe, ALTENER, Grant Agreement no. EIE/08/517/SI2.529243. Fraunhofer ISI, Karlsruhe, Germany.
Resch, G., Ortner, A., Panzer, C. (2014). 2030 RES targets for Europe - a brief pre-assessment of feasibility and impacts, A report compiled within the Intelligent Energy Europe project Keep-on-Track!, coordinated by Eufores and Eclareon. TU Vienna, Energy Economics Group, Vienna, Austria, 2014. Accessible at: www.keepontrack.eu.
Resch, G., Busch, S., Liebmann, L. (2014): Prospects for RES in Europe up to 2030 (Interim Report) Report compiled within the European project DiaCore, supported by Intelligent Energy, IEE/12/833/SI2.645735,EEG, TU Wien, Austria. Accessible at: http://diacore.eu/