DHET TVET CONFERENCE 18 AND 19 NOVEMBER 2014 Conference/Commission 3/Nick... · · 2015-05-20DHET...
27
A case study – Monitoring and evaluation to improve college performance DHET TVET CONFERENCE 18 AND 19 NOVEMBER 2014
Transcript of DHET TVET CONFERENCE 18 AND 19 NOVEMBER 2014 Conference/Commission 3/Nick... · · 2015-05-20DHET...
A case study – Monitoring and evaluation to improve college performance
DHET TVET CONFERENCE
18 AND 19 NOVEMBER 2014
A case study – Monitoring and evaluation (M&E) to improve college performanceTVET colleges in South Africa are committed to improving student performance. To ensure that this goal is met, all aspects of the management cycle (planning, implementation, monitoring and evaluation) must be improved. The first part of this session is aimed at enhancing our understanding of how effective monitoring and evaluation can be used to improve college performance by:
discussing the monitoring and evaluation processlinking monitoring and evaluation to reportingsharing specific monitoring and evaluation tools used by the collegeoffering advice on implementing a successful monitoring and evaluation programmebriefly exploring an international perspective (OFSTED) on monitoring and evaluation of colleges
The second part of the session will enable delegates to exchange ideas, share best practices, generate new ideas, and identify challenges and possible solutions regarding monitoring and evaluation and college performance.
“Individually, we are one drop. Together, we are an ocean.” Satoro

Each college is unique
COMMON GOAL:To improve College Performance
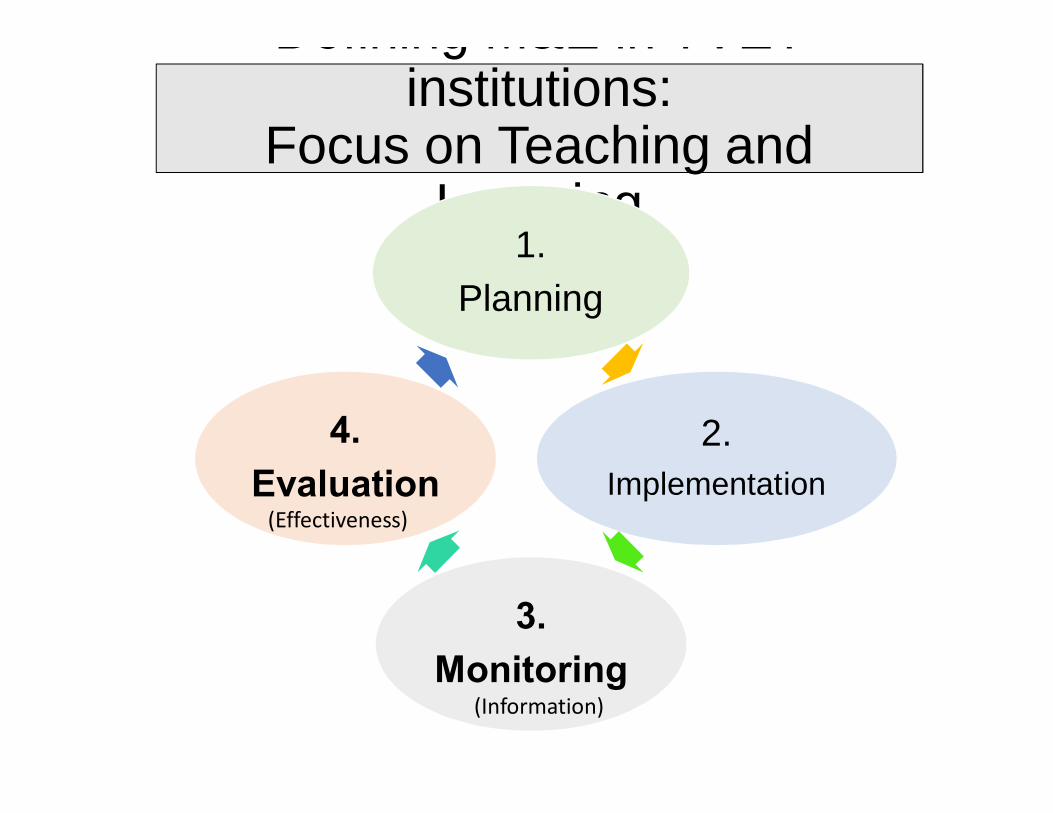
Defining M&E in TVET institutions:
Focus on Teaching and Learning
1.Planning
2.Implementation
3.Monitoring
4.Evaluation
(Effectiveness)
(Information)

Great things are never done by a single person, they are done by a team
Steve Jobs
Core: Teaching and Learning
For M&E to be successful, teamwork is essential


For M&E to be successful, it must be embraced and implemented at all levels of the college
M&E
Governance Level
College Level
Campus level
GOAL:Create a
M&E culture
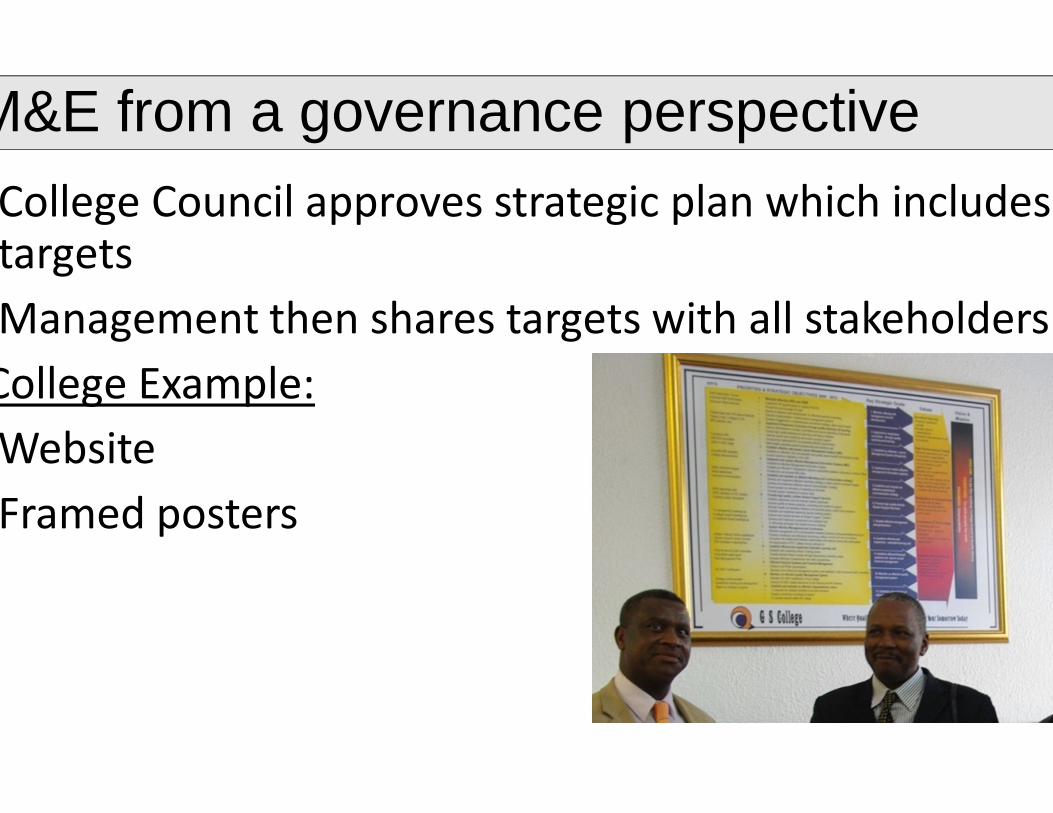
M&E from a governance perspectiveCollege Council approves strategic plan which includes targetsManagement then shares targets with all stakeholders
College Example:WebsiteFramed posters
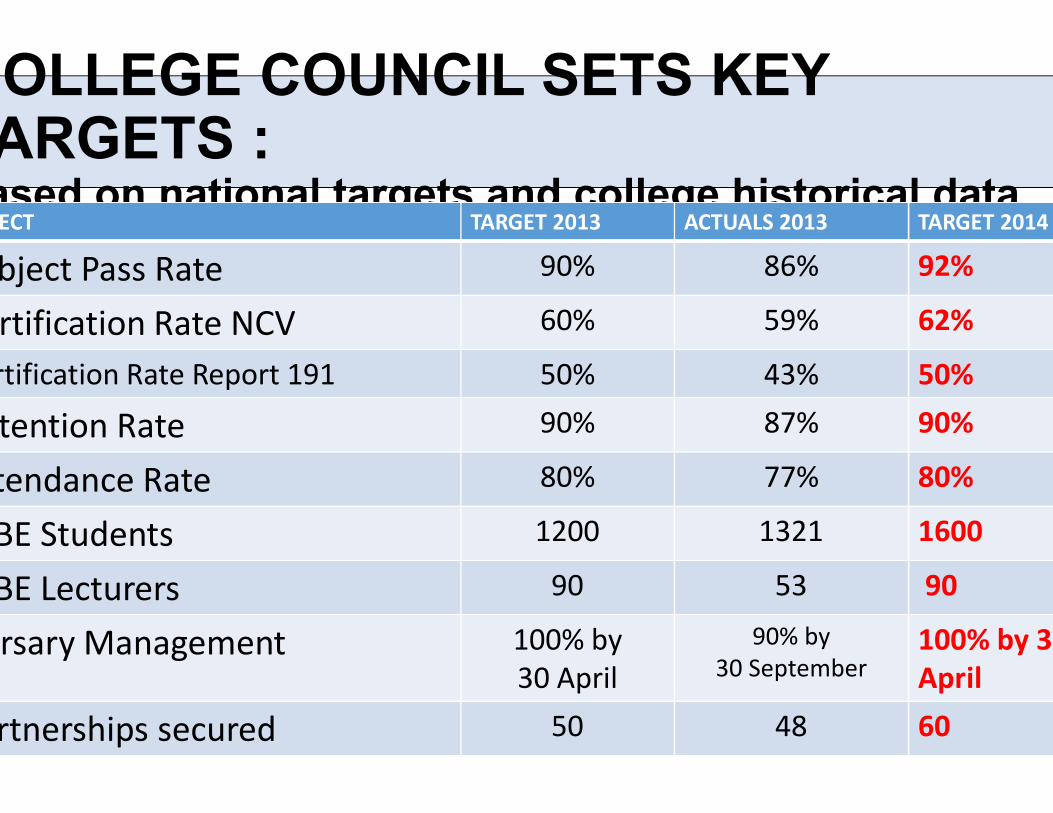
COLLEGE COUNCIL SETS KEY TARGETS : based on national targets and college historical data ASPECT TARGET 2013 ACTUALS 2013 TARGET 2014
Subject Pass Rate 90% 86% 92%
Certification Rate NCV 60% 59% 62%
Certification Rate Report 191 50% 43% 50%
Retention Rate 90% 87% 90%
Attendance Rate 80% 77% 80%
WBE Students 1200 1321 1600
WBE Lecturers 90 53 90
Bursary Management 100% by 30 April
90% by 30 September
100% by 30 April
Partnerships secured 50 48 60
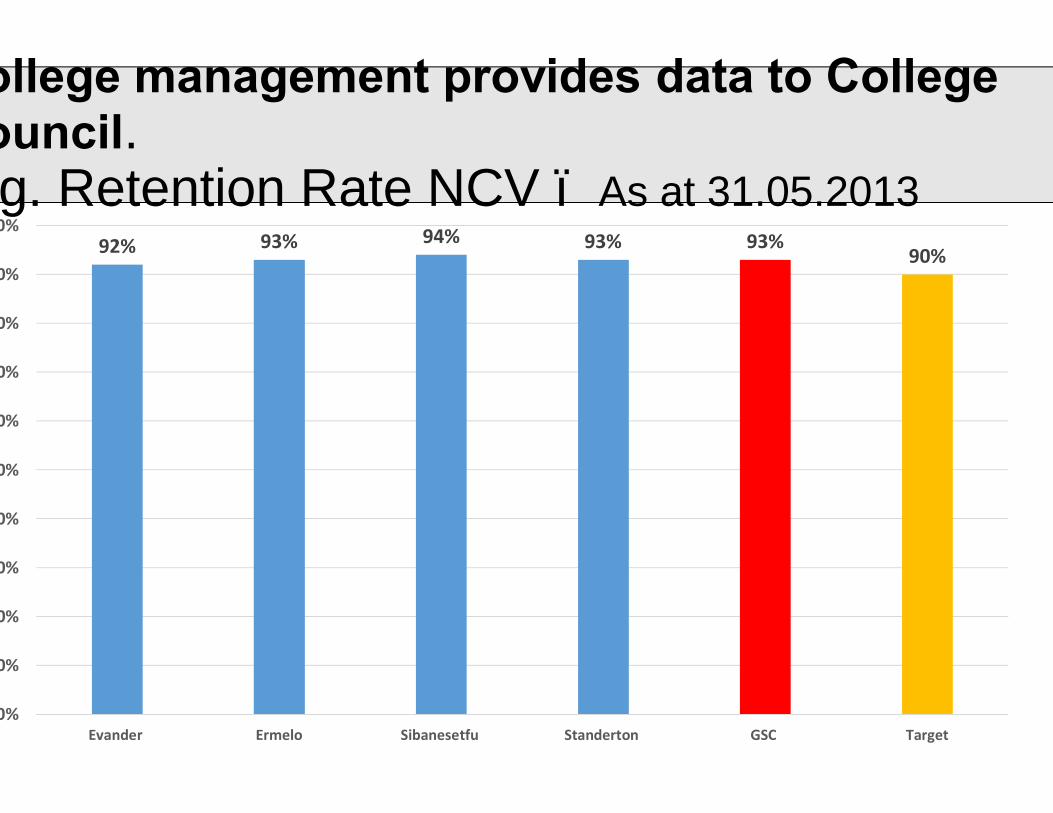
College management provides data to College Council. E.g. Retention Rate NCV – As at 31.05.2013
92% 93% 94% 93% 93%90%
0%
10%
20%
30%
40%
50%
60%
70%
80%
90%
100%
Evander Ermelo Sibanesetfu Standerton GSC Target
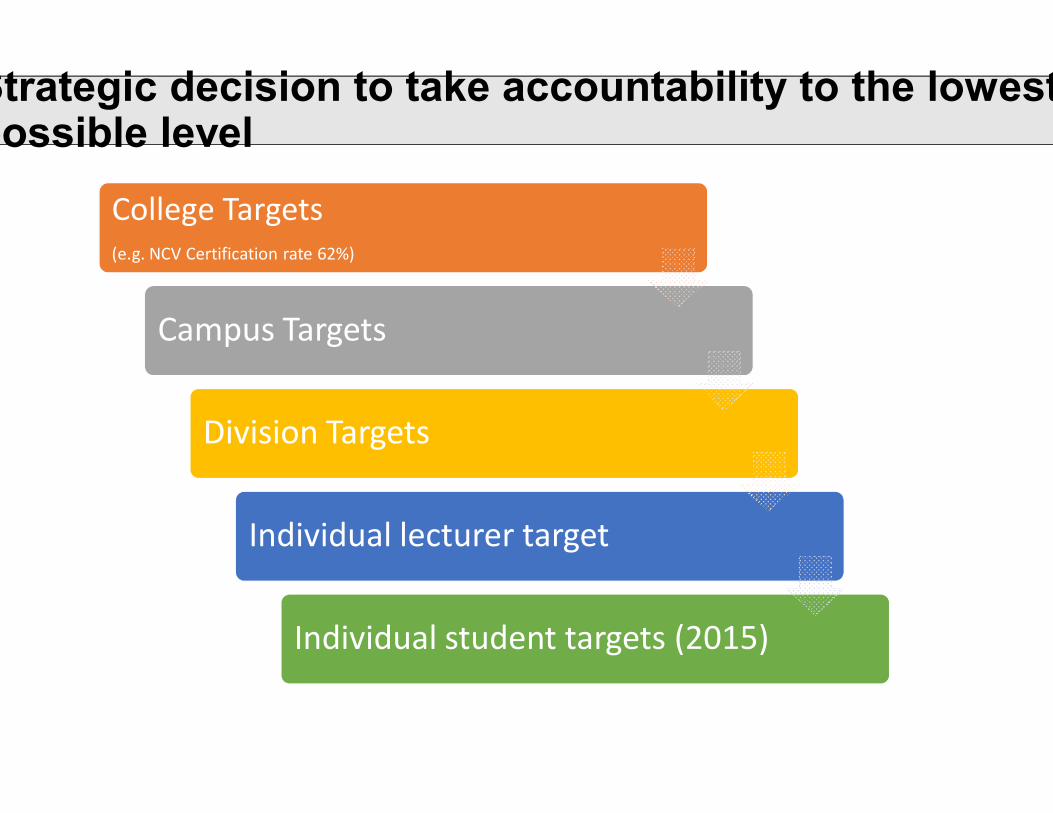
Strategic decision to take accountability to the lowest possible level
College Targets (e.g. NCV Certification rate 62%)
Campus Targets
Division Targets
Individual lecturer target
Individual student targets (2015)
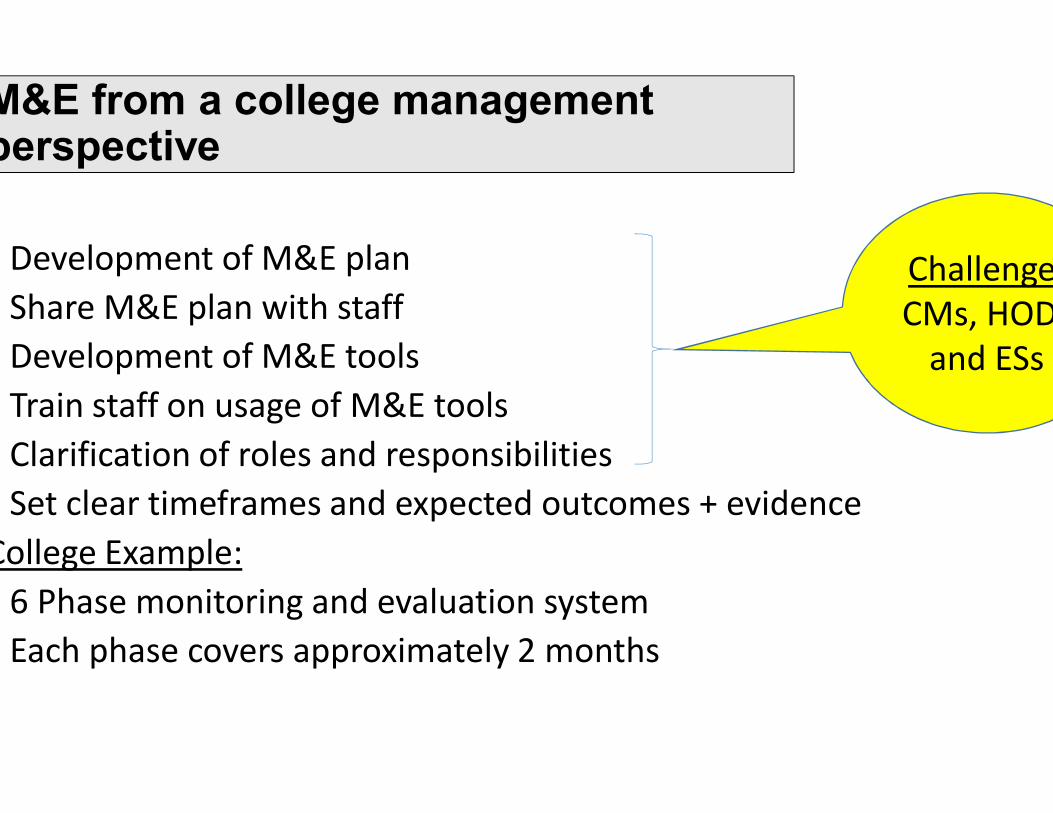
M&E from a college management perspective
Development of M&E planShare M&E plan with staffDevelopment of M&E toolsTrain staff on usage of M&E toolsClarification of roles and responsibilitiesSet clear timeframes and expected outcomes + evidence
College Example:6 Phase monitoring and evaluation system Each phase covers approximately 2 months
Challenge: CMs, HODs
and ESs
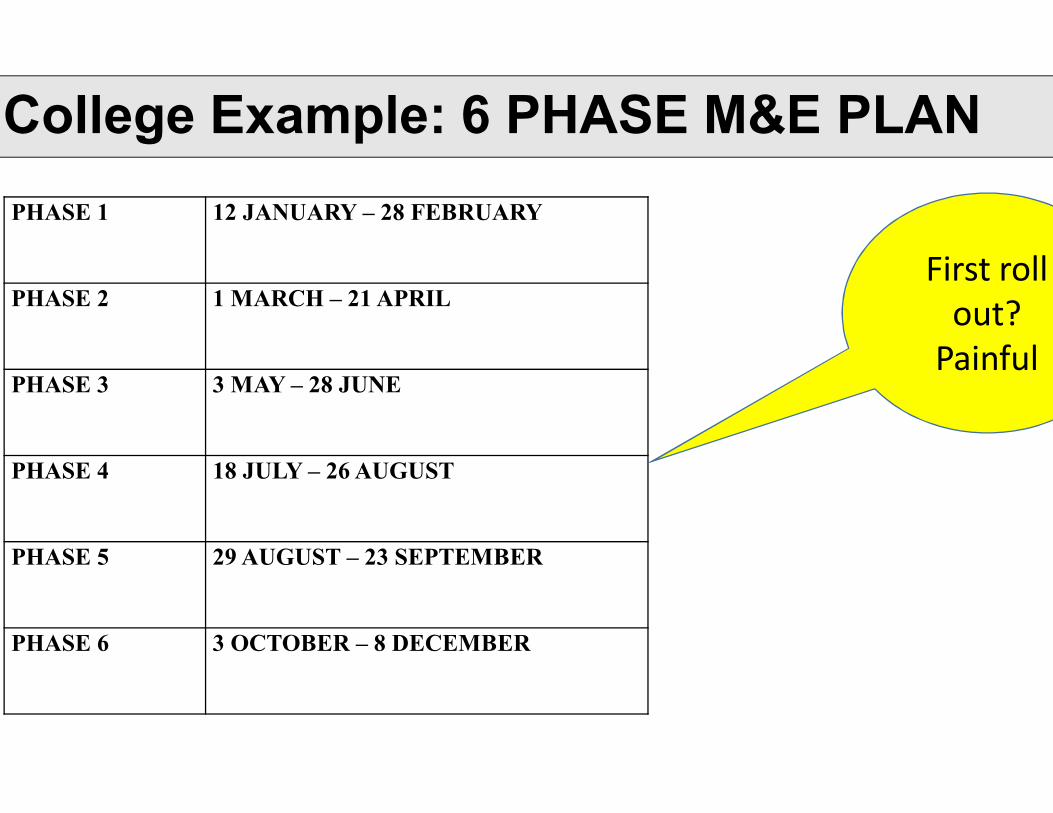
College Example: 6 PHASE M&E PLAN PHASE 1 12 JANUARY – 28 FEBRUARY
PHASE 2 1 MARCH – 21 APRIL
PHASE 3 3 MAY – 28 JUNE
PHASE 4 18 JULY – 26 AUGUST
PHASE 5 29 AUGUST – 23 SEPTEMBER
PHASE 6 3 OCTOBER – 8 DECEMBER
First roll out?
Painful
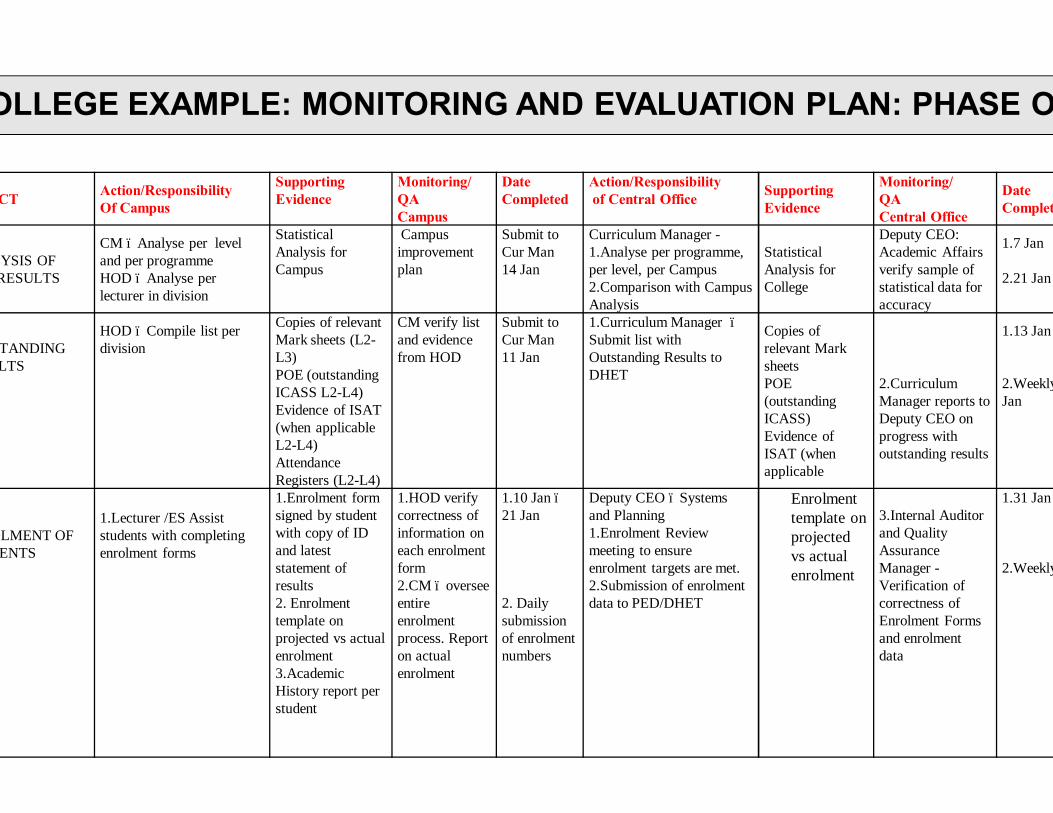
COLLEGE EXAMPLE: MONITORING AND EVALUATION PLAN: PHASE ONE
ASPECT Action/ResponsibilityOf Campus
Supporting Evidence
Monitoring/QA Campus
Date Completed
Action/Responsibilityof Central Office Supporting
Evidence
Monitoring/QACentral Office
Date Completed
ANALYSIS OF NOV RESULTS
CM – Analyse per level and per programmeHOD – Analyse per lecturer in division
Statistical Analysis for Campus
Campus improvement plan
Submit to Cur Man14 Jan
Curriculum Manager -1.Analyse per programme, per level, per Campus2.Comparison with Campus Analysis
Statistical Analysis for College
Deputy CEO: Academic Affairs verify sample of statistical data for accuracy
1.7 Jan
2.21 Jan
OUTSTANDING RESULTS
HOD – Compile list per division
Copies of relevant Mark sheets (L2-L3)POE (outstanding ICASS L2-L4)Evidence of ISAT (when applicable L2-L4)Attendance Registers (L2-L4)
CM verify list and evidence from HOD
Submit to Cur Man 11 Jan
1.Curriculum Manager –Submit list with Outstanding Results to DHET
Copies of relevant Mark sheetsPOE (outstanding ICASS)Evidence of ISAT (when applicable
2.Curriculum Manager reports to Deputy CEO on progress with outstanding results
1.13 Jan
2.Weekly from 17 Jan
ENROLMENT OF STUDENTS
1.Lecturer /ES Assist students with completing enrolment forms
1.Enrolment form signed by student with copy of ID and latest statement of results2. Enrolment template on projected vs actual enrolment3.Academic History report per student
1.HOD verify correctness of information on each enrolment form2.CM – oversee entire enrolment process. Report on actual enrolment
1.10 Jan –21 Jan
2. Daily submission of enrolment numbers
Deputy CEO – Systems and Planning1.Enrolment Review meeting to ensure enrolment targets are met.2.Submission of enrolment data to PED/DHET
Enrolment template on projected vs actual enrolment
3.Internal Auditor and Quality Assurance Manager -Verification of correctness of Enrolment Forms and enrolment data
1.31 Jan
2.Weekly
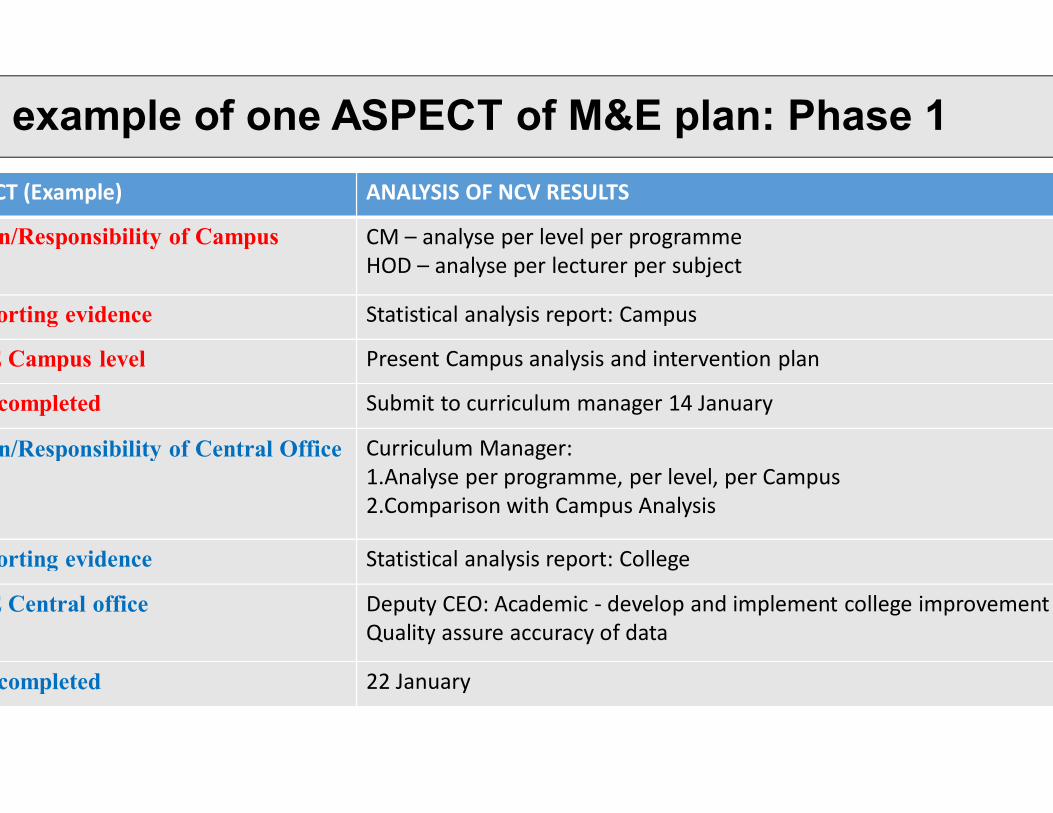
An example of one ASPECT of M&E plan: Phase 1ASPECT (Example) ANALYSIS OF NCV RESULTS
Action/Responsibility of Campus CM – analyse per level per programmeHOD – analyse per lecturer per subject
Supporting evidence Statistical analysis report: Campus
M&E Campus level Present Campus analysis and intervention plan
Date completed Submit to curriculum manager 14 January
Action/Responsibility of Central Office Curriculum Manager:1.Analyse per programme, per level, per Campus2.Comparison with Campus Analysis
Supporting evidence Statistical analysis report: College
M&E Central office Deputy CEO: Academic - develop and implement college improvement plan Quality assure accuracy of data
Date completed 22 January
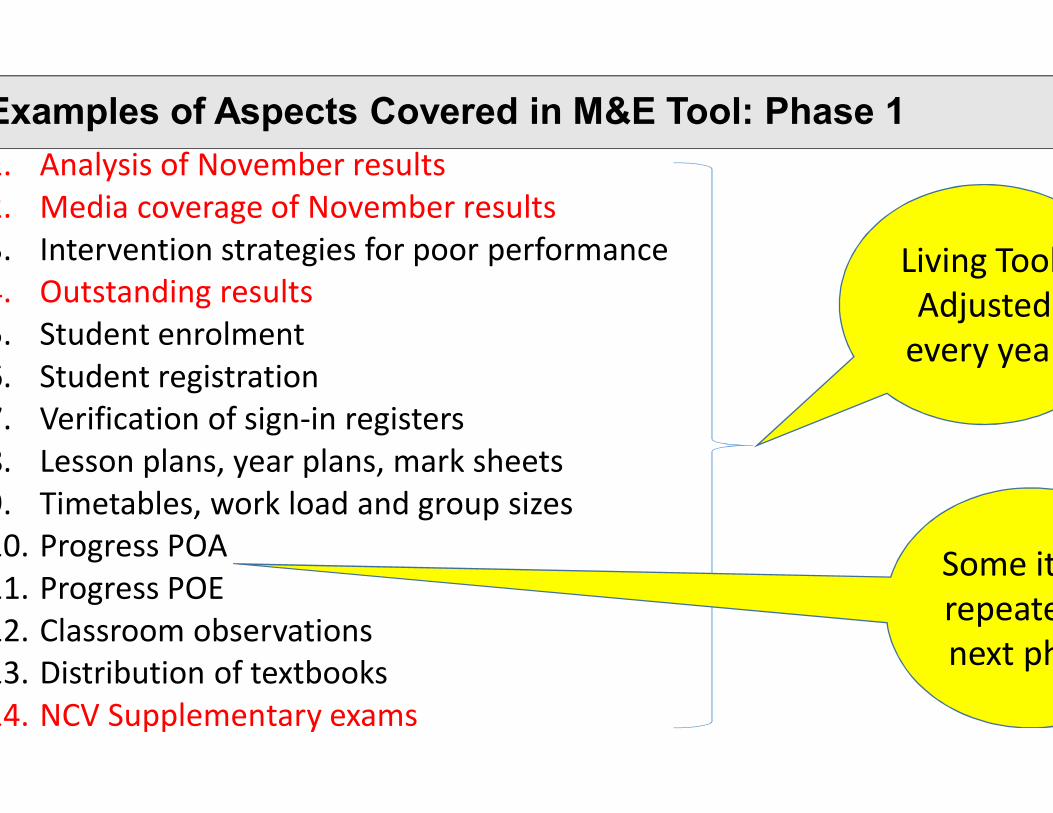
Examples of Aspects Covered in M&E Tool: Phase 11. Analysis of November results2. Media coverage of November results3. Intervention strategies for poor performance4. Outstanding results5. Student enrolment6. Student registration7. Verification of sign-in registers8. Lesson plans, year plans, mark sheets9. Timetables, work load and group sizes10. Progress POA11. Progress POE12. Classroom observations13. Distribution of textbooks14. NCV Supplementary exams
Living Tool: Adjusted
every year
Some items repeated in next phase
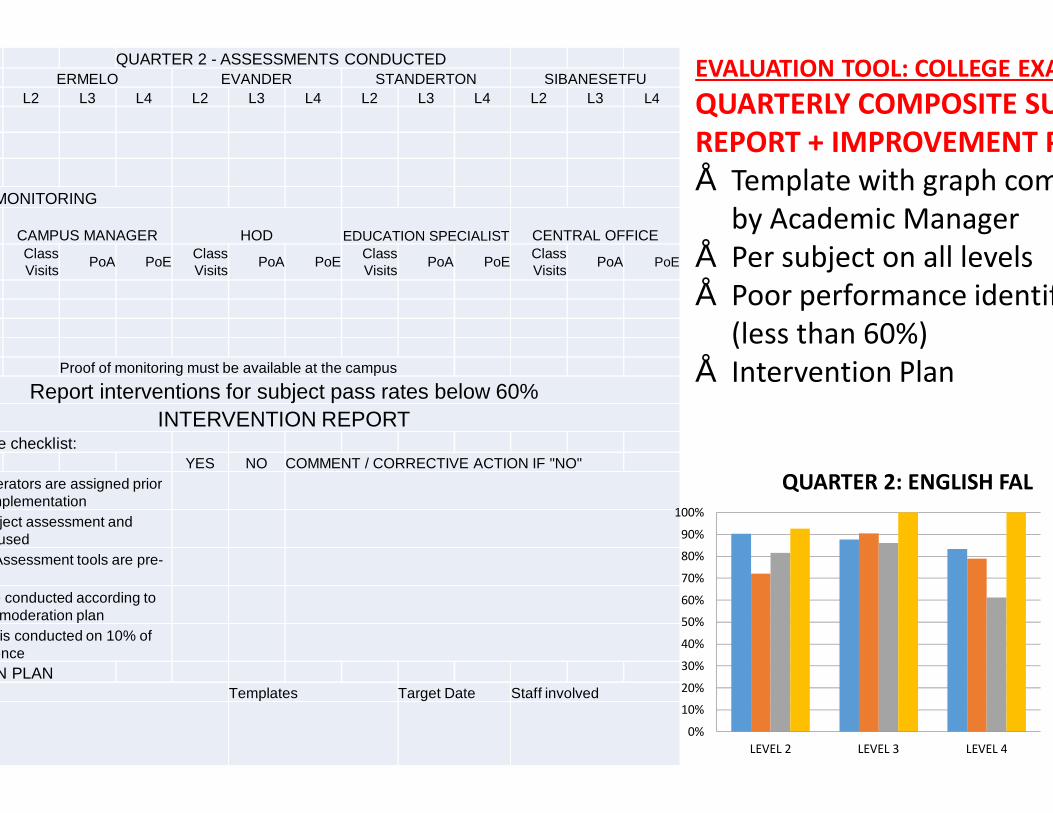
QUARTER 2 - ASSESSMENTS CONDUCTEDERMELO EVANDER STANDERTON SIBANESETFU
L2 L3 L4 L2 L3 L4 L2 L3 L4 L2 L3 L4
MONITORING
CAMPUS MANAGER HOD EDUCATION SPECIALIST CENTRAL OFFICEClass Visits PoA PoE Class
Visits PoA PoE Class Visits PoA PoE Class
Visits PoA PoE
Proof of monitoring must be available at the campus
Report interventions for subject pass rates below 60%INTERVENTION REPORT
Please complete checklist:YES NO COMMENT / CORRECTIVE ACTION IF "NO"
Lecturers & Moderators are assigned prior to assessment implementationAn approved subject assessment and moderation plan usedAssessments & Assessment tools are pre-
Assessments are conducted according to assessment and moderation plan
moderation is conducted on 10% of the marked evidenceINTERVENTION PLAN
Templates Target Date Staff involved
0%
10%
20%
30%
40%
50%
60%
70%
80%
90%
100%
LEVEL 2 LEVEL 3 LEVEL 4
QUARTER 2: ENGLISH FAL
EVALUATION TOOL: COLLEGE EXAMPLE QUARTERLY COMPOSITE SUBJECT REPORT + IMPROVEMENT PLAN• Template with graph compiled
by Academic Manager • Per subject on all levels• Poor performance identified
(less than 60%)• Intervention Plan
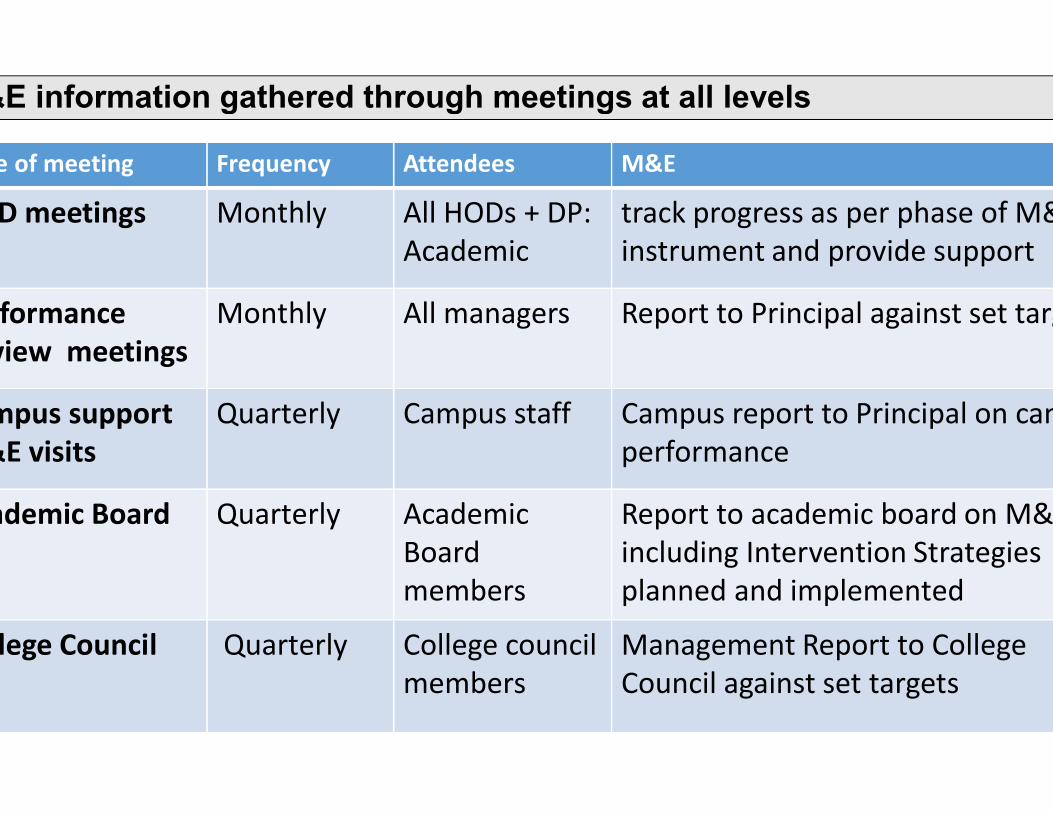
M&E information gathered through meetings at all levels
Type of meeting Frequency Attendees M&E
HOD meetings Monthly All HODs + DP: Academic
track progress as per phase of M&E instrument and provide support
Performance Review meetings
Monthly All managers Report to Principal against set targets
Campus support M&E visits
Quarterly Campus staff Campus report to Principal on campus performance
Academic Board Quarterly Academic Board members
Report to academic board on M&E including Intervention Strategies planned and implemented
College Council Quarterly College council members
Management Report to College Council against set targets

Meeting:College Example of a
Campus Monthly reporting tool:
Standerton Campus: September 2013Outcome 5: A skilled and capable workforce to support an inclusive growth path
NB: 12 PAGE TEMPLATE (only two pages are
included as examples)
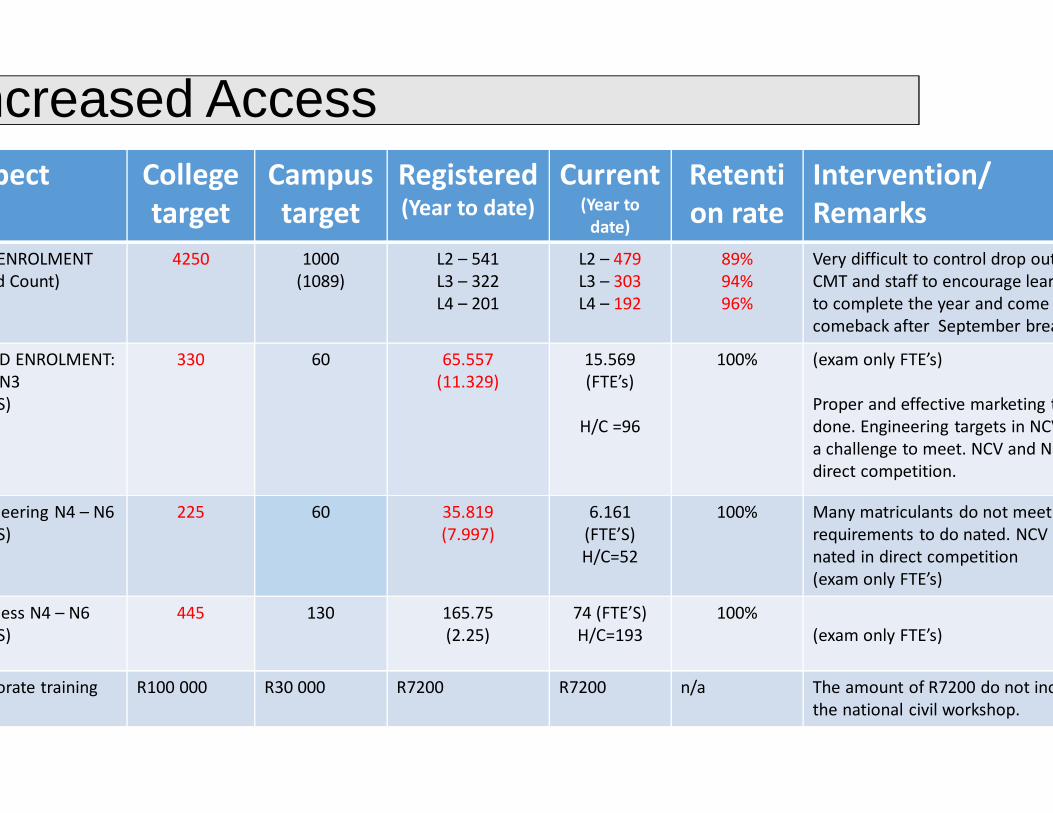
Increased AccessAspect College
targetCampus target
Registered(Year to date)
Current(Year to
date)
Retention rate
Intervention/Remarks
ENROLMENT(Head Count)
4250 1000(1089)
L2 – 541L3 – 322L4 – 201
L2 – 479L3 – 303L4 – 192
89%94%96%
Very difficult to control drop outs . CMT and staff to encourage learners to complete the year and come comeback after September break.
NATED ENROLMENT:N3
(FTE’S)
330 60 65.557(11.329)
15.569(FTE’s)
H/C =96
100% (exam only FTE’s)
Proper and effective marketing to be done. Engineering targets in NCV also a challenge to meet. NCV and Nated direct competition.
Engineering N4 – N6(FTE’S)
225 60 35.819(7.997)
6.161(FTE’S)H/C=52
100% Many matriculants do not meet the requirements to do nated. NCV and nated in direct competition(exam only FTE’s)
Business N4 – N6(FTE’S)
445 130 165.75(2.25)
74 (FTE’S)H/C=193
100%(exam only FTE’s)
Corporate training R100 000 R30 000 R7200 R7200 n/a The amount of R7200 do not include the national civil workshop.
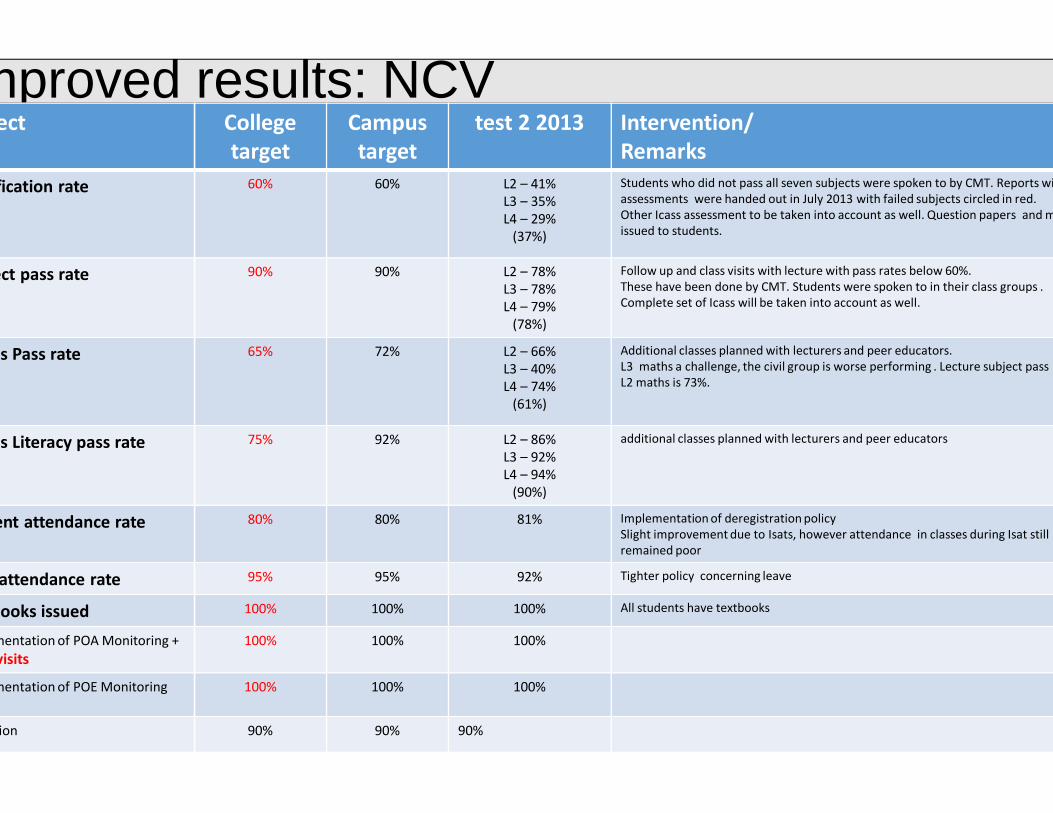
Improved results: NCVAspect College
targetCampus target
test 2 2013 Intervention/Remarks
Certification rate 60% 60% L2 – 41%L3 – 35%L4 – 29%
(37%)
Students who did not pass all seven subjects were spoken to by CMT. Reports with all assessments were handed out in July 2013 with failed subjects circled in red.Other Icass assessment to be taken into account as well. Question papers and memos issued to students.
Subject pass rate 90% 90% L2 – 78%L3 – 78%L4 – 79%
(78%)
Follow up and class visits with lecture with pass rates below 60%.These have been done by CMT. Students were spoken to in their class groups . Complete set of Icass will be taken into account as well.
Maths Pass rate 65% 72% L2 – 66%L3 – 40%L4 – 74%
(61%)
Additional classes planned with lecturers and peer educators. L3 maths a challenge, the civil group is worse performing . Lecture subject pass rate in L2 maths is 73%.
Maths Literacy pass rate 75% 92% L2 – 86%L3 – 92%L4 – 94%
(90%)
additional classes planned with lecturers and peer educators
Student attendance rate 80% 80% 81% Implementation of deregistration policySlight improvement due to Isats, however attendance in classes during Isat still remained poor
Staff attendance rate 95% 95% 92% Tighter policy concerning leave
Textbooks issued 100% 100% 100% All students have textbooks
Implementation of POA Monitoring + Class visits
100% 100% 100%
Implementation of POE Monitoring 100% 100% 100%
Retention 90% 90% 90%
M&E from an international perspective:Ofsted: OFFICE FOR STANDARDS IN EDUCATION in UK
Ofsted is the Office for Standards in Education for schools and colleges. Ofsted reports directly to Parliament and are independent and impartial.
Ofsted inspects and regulates services which care for children and young people, and those providing education and skills for learners of all ages. Results of all M&E are published on the web.
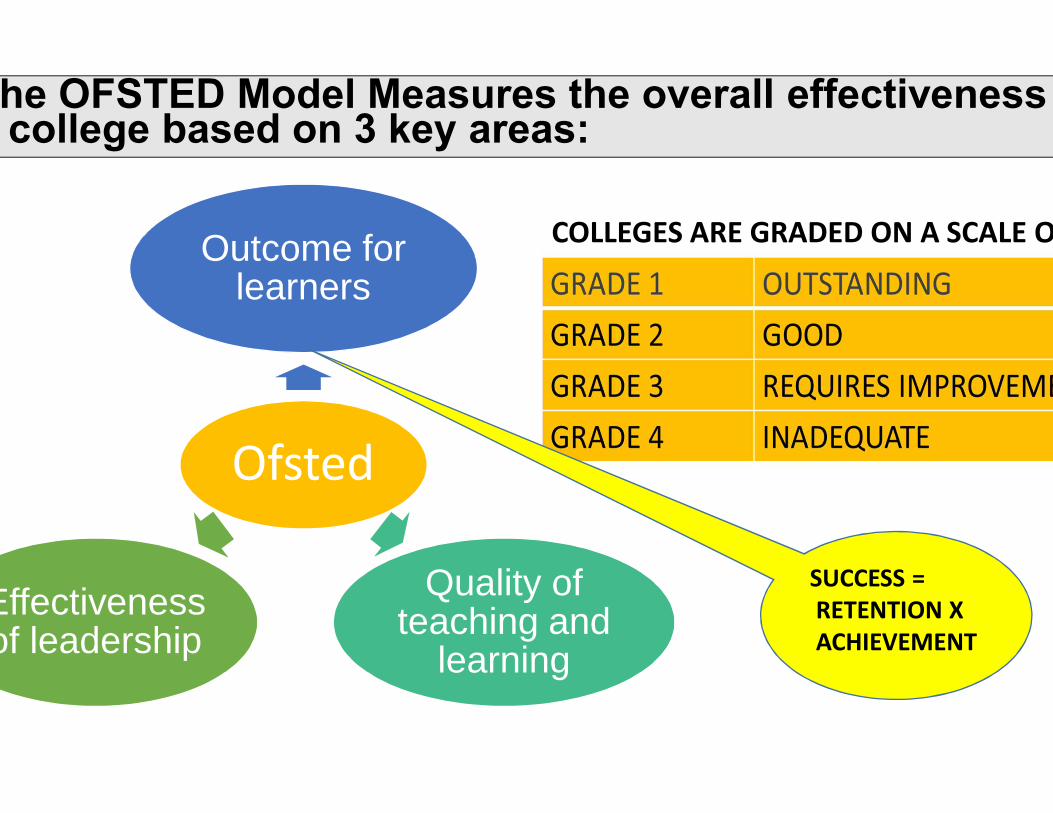
The OFSTED Model Measures the overall effectiveness of a college based on 3 key areas:
Ofsted
Outcome for learners
Quality of teaching and
learningEffectiveness of leadership
COLLEGES ARE GRADED ON A SCALE OF 1
SUCCESS =RETENTION XACHIEVEMENT
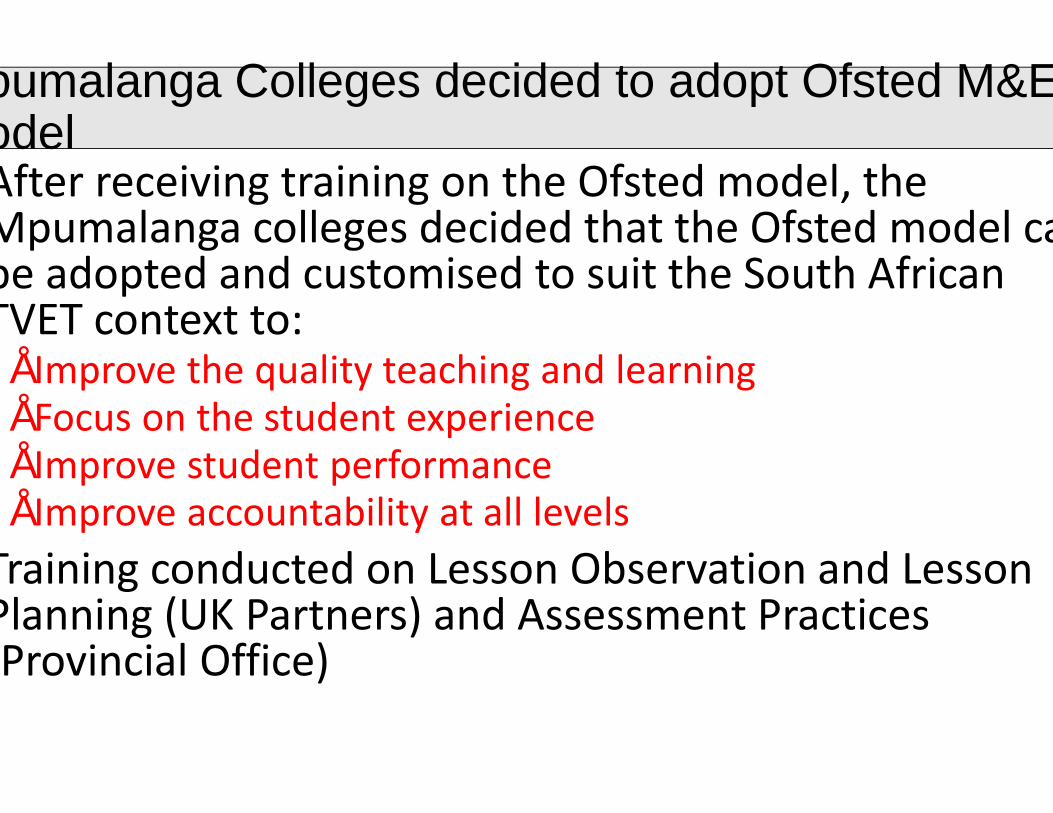
Mpumalanga Colleges decided to adopt Ofsted M&E Model
After receiving training on the Ofsted model, the Mpumalanga colleges decided that the Ofsted model can be adopted and customised to suit the South African TVET context to:
• Improve the quality teaching and learning• Focus on the student experience• Improve student performance• Improve accountability at all levels
Training conducted on Lesson Observation and Lesson Planning (UK Partners) and Assessment Practices (Provincial Office)
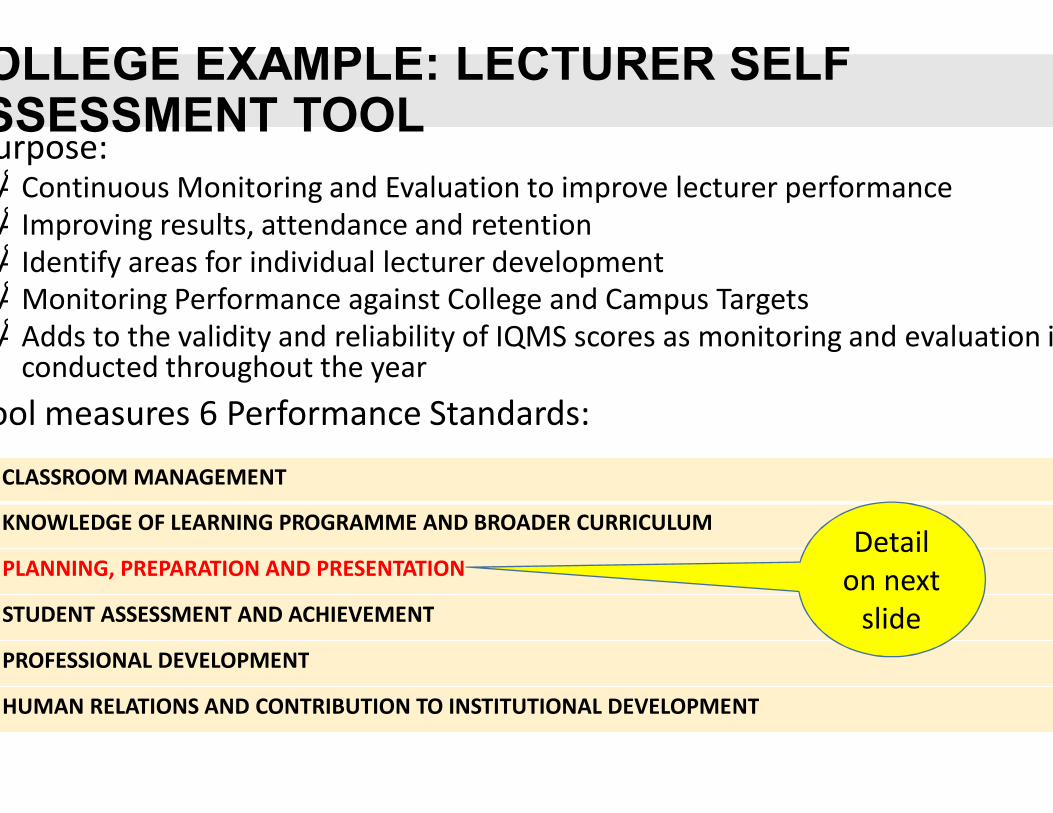
COLLEGE EXAMPLE: LECTURER SELF ASSESSMENT TOOL
Purpose:• Continuous Monitoring and Evaluation to improve lecturer performance• Improving results, attendance and retention• Identify areas for individual lecturer development• Monitoring Performance against College and Campus Targets• Adds to the validity and reliability of IQMS scores as monitoring and evaluation is
conducted throughout the yearTool measures 6 Performance Standards:
CLASSROOM MANAGEMENT
2. KNOWLEDGE OF LEARNING PROGRAMME AND BROADER CURRICULUM
3. PLANNING, PREPARATION AND PRESENTATION
4. STUDENT ASSESSMENT AND ACHIEVEMENT
5. PROFESSIONAL DEVELOPMENT
6. HUMAN RELATIONS AND CONTRIBUTION TO INSTITUTIONAL DEVELOPMENT
Detail on next
slide
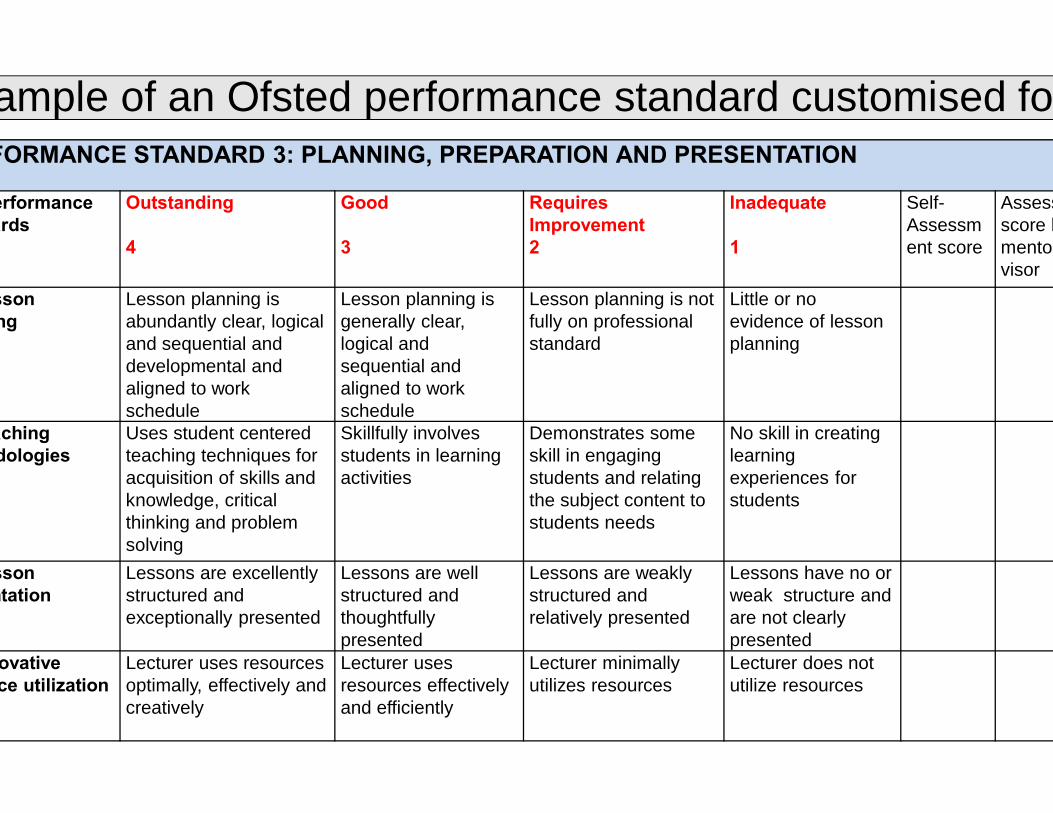
Example of an Ofsted performance standard customised for SAPERFORMANCE STANDARD 3: PLANNING, PREPARATION AND PRESENTATION
Sub Performance Standards
Outstanding
4
Good
3
Requires Improvement2
Inadequate
1
Self-Assessment score
Assessment score by mentor/supervisor
3.1 Lesson Planning
Lesson planning is abundantly clear, logical and sequential and developmental and aligned to work schedule
Lesson planning is generally clear, logical and sequential and aligned to work schedule
Lesson planning is not fully on professional standard
Little or no evidence of lesson planning
3.2 Teaching methodologies
Uses student centered teaching techniques for acquisition of skills and knowledge, critical thinking and problem solving
Skillfully involves students in learning activities
Demonstrates some skill in engaging students and relating the subject content to students needs
No skill in creating learning experiences for students
3.3 Lesson Presentation
Lessons are excellently structured and exceptionally presented
Lessons are well structured and thoughtfully presented
Lessons are weakly structured and relatively presented
Lessons have no or weak structure and are not clearly presented
3.4 Innovative resource utilization
Lecturer uses resources optimally, effectively and creatively
Lecturer uses resources effectively and efficiently
Lecturer minimally utilizes resources
Lecturer does not utilize resources
Concluding Remarks
M&E can play a key role in improving college performanceM&E requires support at all levelsAs SA does not have a M&E system for TVET colleges, this creates an opportunity to collaborate and develop a M&E model for all TVET institutions in SA. SACPO and DHET have an important role to play. Thank you for listening. Your comments, inputs and suggestions will add further value to this presentation.