dggs.alaska.govdggs.alaska.gov/webpubs/usgs/of/text/of92-0708a.pdf · STUDIES RELATED TO AMRAO The...
38
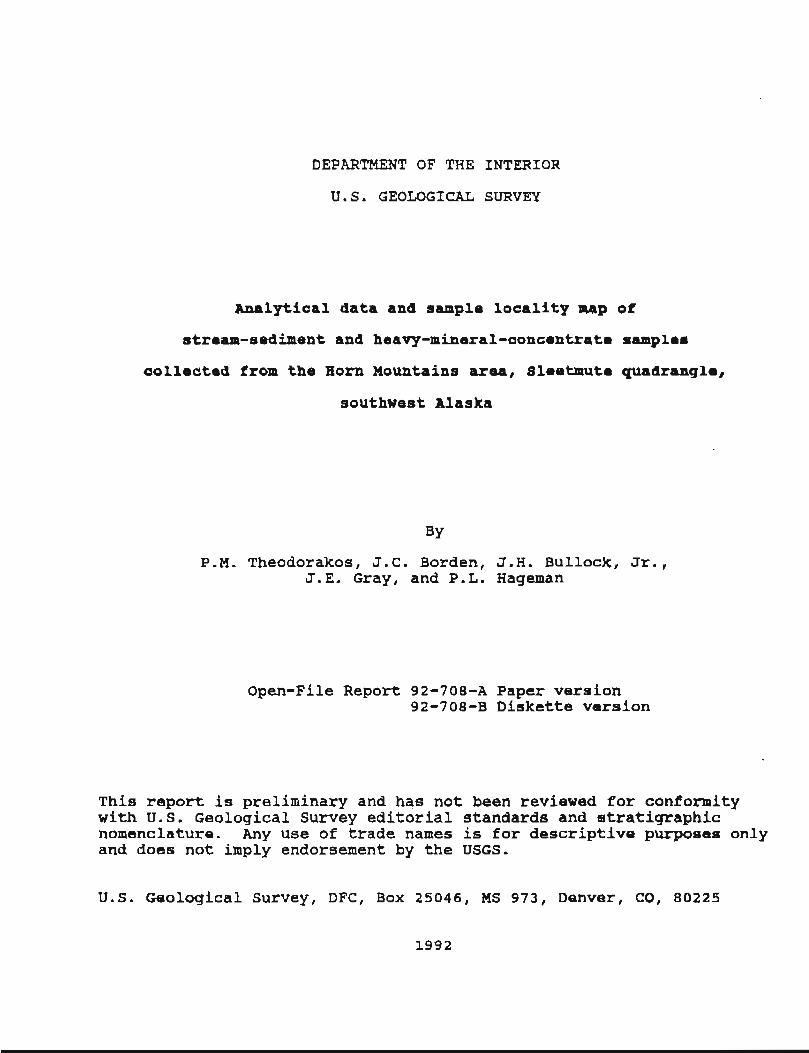
DEPARTMENT OF THE INTERIOR U.S. GEOLOGICAL SURVEY Analytical data and sample locality map of atream-sediment and heavy-mineral-aoncentrate samples collected from the Horn Mountains area, Sleetmutr quadrangle, southwest Alaska P.M. Theodorakos, J.C. Borden, J.H. Bullock, Jr., J.E. Gray, and P.L. Hageman Open-File Report 92-708-A Paper version 92-708-B Diskette version This report is preliminary and has not been reviewed for conformity with U.S. Geological Survey editorial standards and stratigraphic nomenclature. Any use of trade names is for descriptive purposes only and does not imply endorsement by the USGS. U.S. Geological Survey, DFC, Box 25046, MS 973, Denver, CO, 80225
Transcript of dggs.alaska.govdggs.alaska.gov/webpubs/usgs/of/text/of92-0708a.pdf · STUDIES RELATED TO AMRAO The...
DEPARTMENT OF THE INTERIOR
U.S. GEOLOGICAL SURVEY
Analytical data and sample locality map of
atream-sediment and heavy-mineral-aoncentrate samples
collected from the Horn Mountains area, Sleetmutr quadrangle,
southwest Alaska
P.M. Theodorakos, J.C. Borden, J.H. Bullock, Jr., J.E. Gray, and P.L. Hageman
Open-File Report 92-708-A Paper version 92-708-B Diskette version
This report is preliminary and has not been reviewed for conformity with U.S. Geological Survey editorial standards and stratigraphic nomenclature. Any use of trade names is for descriptive purposes only and does not imply endorsement by the USGS.
U.S. Geological Survey, DFC, Box 25046, MS 973, Denver, CO, 80225
Page
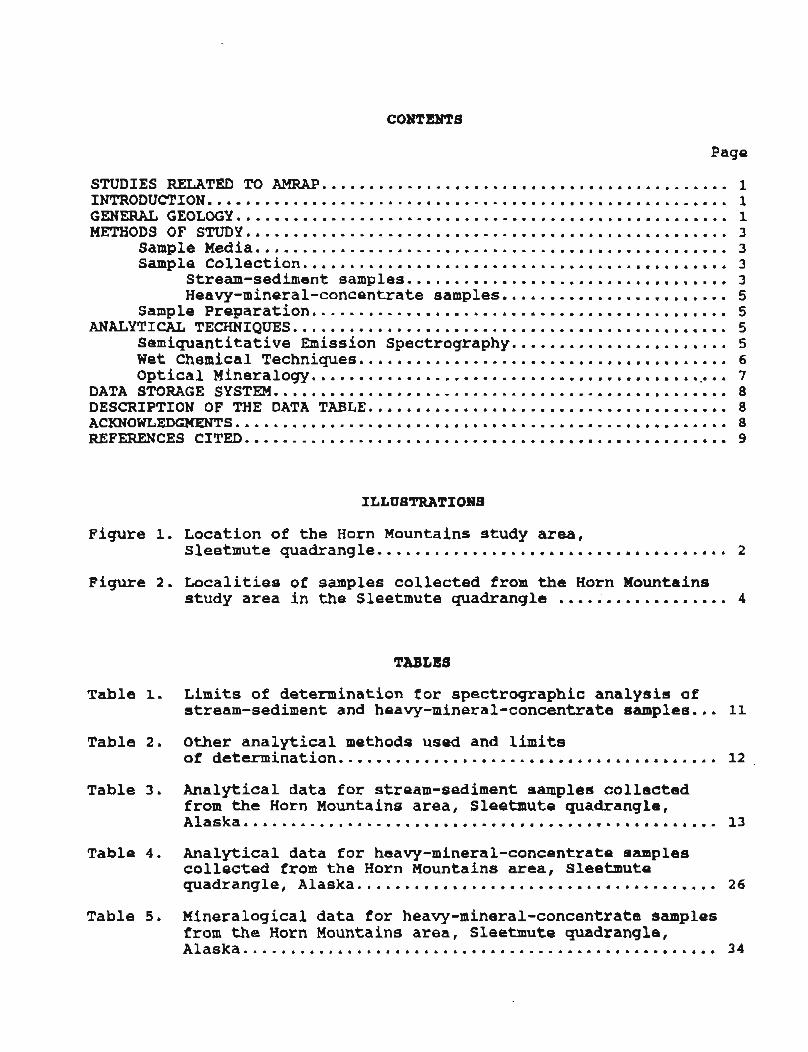
STUDIES RELATED TO AMRAP m.......................................... 1 INTRODUCTION ....................................................... 1 GENERAL GEOLOGY ..................*............................... 1 METHODS OF STUDY ................................................ 3
Sample Media .................................................. 3 Sample Collection ............................................. 3
Stream-sediment samples .................................. 3 Heavy-mineral-concentrate samples ........................ 5
Sample Preparation ............................................ 5 ANALYTICAL TECHNIQUES .............................................. 5 ....................... Semiquantitative Emission Spectrography 5
Wet Chemical Techniques .................................. 6 Optical Mineralogy . . . . . . . . . , . . . . . . . O . . . O . . . . . . . . . . . . . . . . . . . 7 ................................................ DATA STORAGE SYSTEM 8
DESCRIPTION OF THE DATA TABLE ..................................... 8 ACKNOWLEDGMENTS ............................................... 8 REFERENCES CITED ................................................... 9
ILLUSTRATIONS
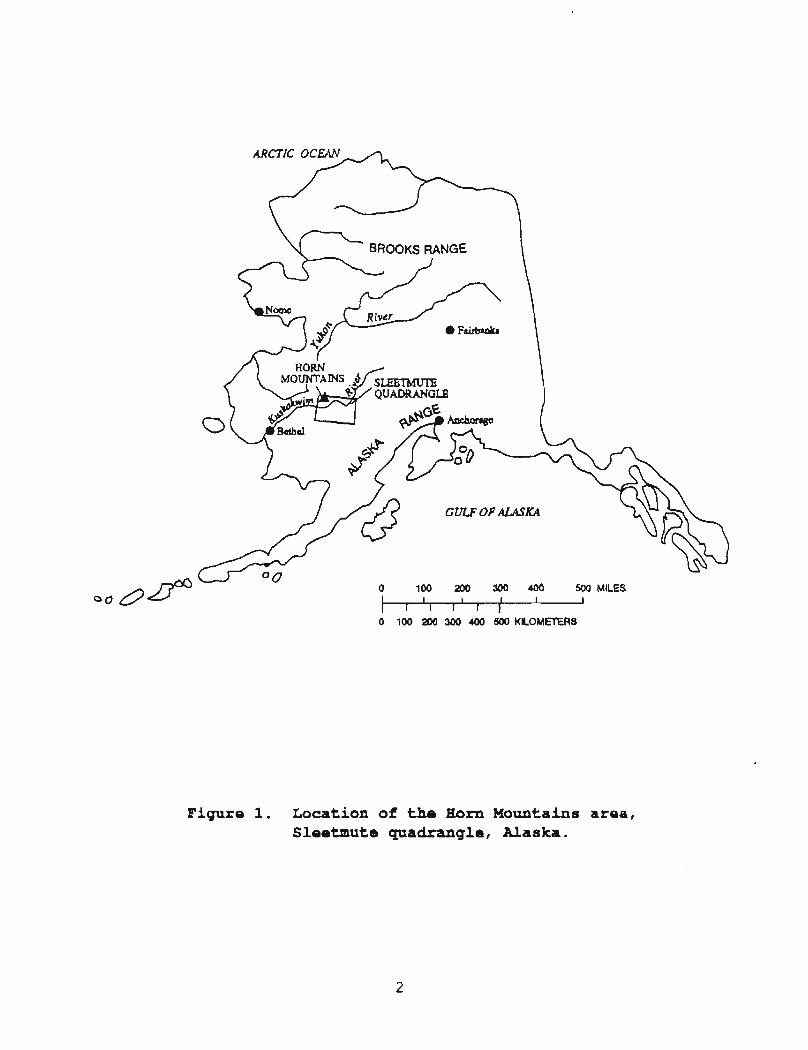
Figure 1 . Location of the Horn Mountains study area. Sleetmute quadrangle ..................................... 2
Figure 2. Localities of samples collected from the Horn Mountains study area in the Sleetmute quadrangle .................. 4
TABLES
Table 1 . Limits of determination for spectrographic analysis of stream-sediment and heavy-mineral-concentrate samples ... 11
Table 2 . O t h e r analytical methods used and limits of determination ..............*......................... 12 .
Table 3 . Analytical data for stream-sediment samples collected from the Horn Mountains area. Sleetmute quadrangle. Alaska .................................................. 13
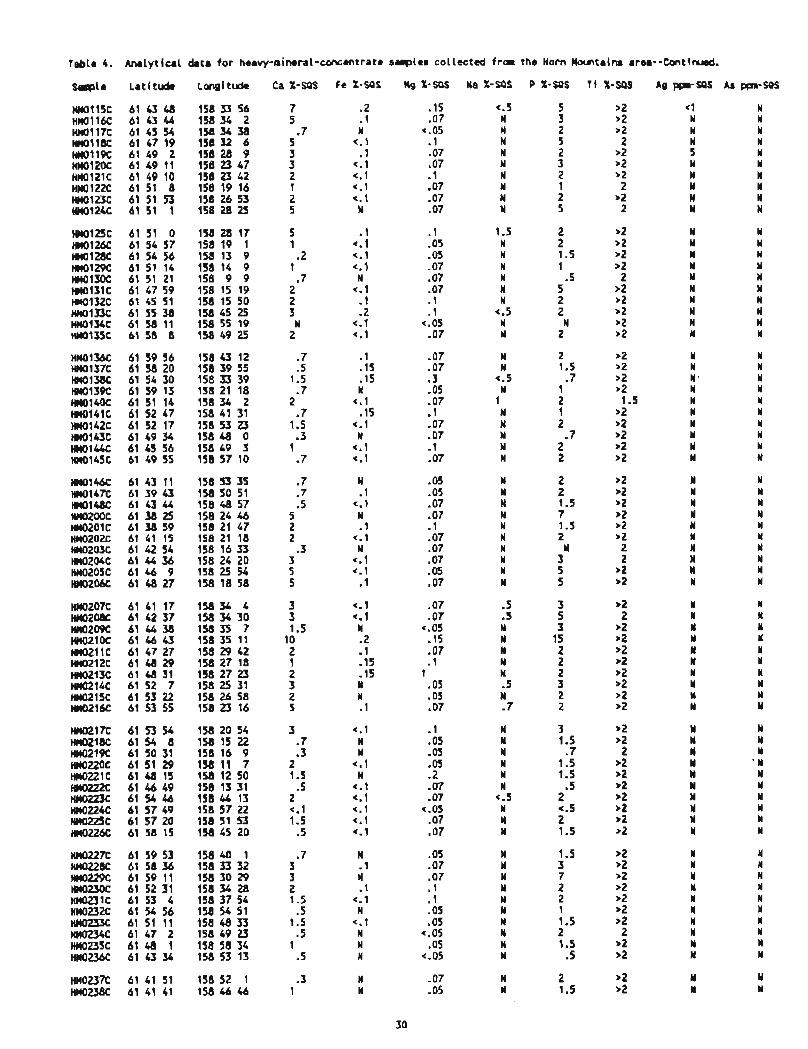
Table 4 . Analytical data for heavy-mineral-concentrate samples collected from the Horn Mountains area. Sleetmute quadrangle. Alaska ...................................... 26
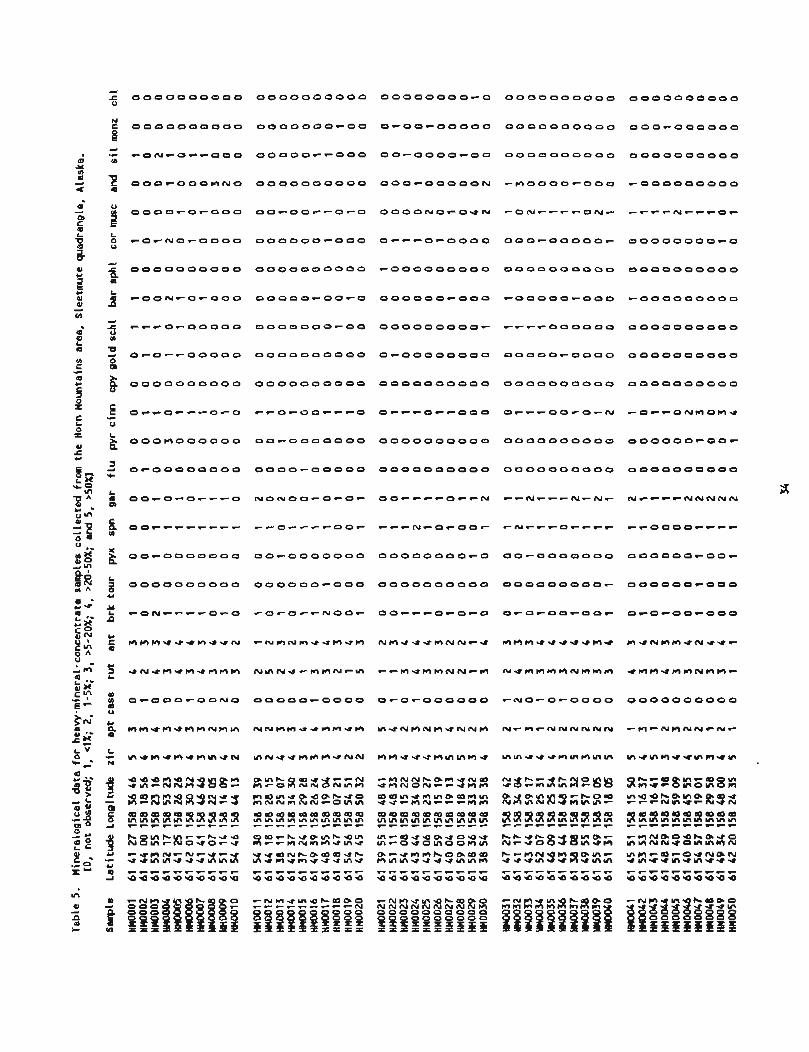
Table 5 . Mineralogical data for heavy-mineral-concentrate samples from the Horn Mountains area. Sleetmute quadrangle. Alaska ..................................................... 34

STUDIES RELATED TO AMRAO The U.S. Geological Survey is required by the Alaska National
Interests Lands conservation Act (Public Law 96-487, 1980) to survey certain federal lands to determine their mineral potential. Results from the Alaska Mineral Resource Assessment Program (AMRAP) must be made available to the public and submitted to the President and congress. This report is one of a series of publications that presents geochemical data collected during the mineral assessment study of the Sleetmute quadrangle, Alaska (fig. 1). Geochemical data for stream-sediment samples, and geochemical and mineralogical data for heavy-mineral-concentrate samples collected from the Horn Mountains and surrounding areas are presented here. The data in this report are also available on computer diskette in Theodorakos and others (1992). An interpretation of the data appears in Gray and others (in press).
INTRODUCTION In the summer of 1992, a reconnaissance geochemical survey was
conducted in the northwestern part of the Sleetmute quadrangle as part of the Alaskan Mineral Resource Assessment Program (AMRAP). The study area covers approximately 1500 km2 (579 mi2) and includes the Horn Mountains and surrounding areas (fig. 2). Reconnaissance drainage basin geochemical surveys are a rapid and efficient means of locating upstream areas with possible mineral deposits. The objective of this study was to use geochemical data from stream-sediment samples, and geochemical and mineralogical data from heavy-mineral-concentrate samples, to identify areas favorable for the presence of mineral deposits.
The most rugged topography of the study area is in the Horn Mountains where the maximum elevation is approximately 1071 rn (3515 it). However, much of the terrain lying outside of the Horn Mountains is dominated by low rolling hills with broad, sediment-filled lowlands. Some of the study area is swampy, especially along part of the Kolmakof River where the minimum elevation is approximately 60 m (200 ft). The region is covered with vegetation that ranges from northern latitude forests to subarctic tundra. No roads are found in the area and access is limited to travel by air or foot. Boat access is also possible on some of the larger rivers and creeks.
GENERAL GEOLOGY The Horn Mountains are made-up of one of several Late Cretaceous
to early Tertiary volcanoplutonic complexes found in southwestern Alaska. Volcanic rocks of these complexes generally overlie or are in fault contact with plutons that intrude and partially assimilate the volcanic rocks (Bundtzen and Gilbert, 1983). The plutonic rocks in the Horn Mountains are part of a stock of mostly quartz monzonite (Cady and others, 1955) . This stock intrudes Late Cretaceous and early Tertiary mafic to felsic tuffs and lavas of the Iditarod Volcanics (Miller and Bundtzen, 1988), and sedimentary rocks of the Cretaceous Kuskokwim Group (Cady and others, 1955). Contact metamorphic aureoles are found adjacent to the plutone where sedimentary and volcanic rocks are converted to hornfels.
Late Cretaceous and early Tertiary intermediate to mafic dikes and granite porphyry intrusions are found in the vicinity of the Horn
ARCTIC O C W m
GULF OF AL4SX4
0 100 200 300 400 SW MILES
0 100 300 400 500 KILOMETERS
Figure 1. Location of the Horn Mountains area, Sleetmute quadzangle, Alaska.
Mountains. These intrusions cut all rock types in the study area, but most commonly intrude sedimentary rocks of the Kuskokwim Group. The largest exposure of granite porphyry is at Juninggulra Mountain approximately 20 km north of the Horn Mountains. The intermediate to mafic dikes are generally small and local, typically less than 1 meter wide, discontinuous along strike, and difficult to trace for more than 10 meters (Cady and others, 1955; Miller and Bundtzen, 1993).
Rocks of the Cretaceous Kuskokwim Group surround the Horn Mountains. The Kuskokwim Group is a sequence of flysch representing turbidite fan, foreslope, shallow-marine, and shelf facies deposited into a Late Cretaceous basin (Bundtzen and Gilbert, 1983; Miller and Bundtzen, 1992). Rocks of the Kuskokwim Group were first described and named by Cady and others (1955), who suggested graywacke and lesser siltstone compose almost all of the sequence, graywacke being approximately twice as abundant as siltstone. Minor conglomerate and interbedded volcanic tuffs and flows are also found within the Kuskokwirn Group (Cady and others, 1955; Bundtzen and Laird, 1982; Miller and Bundtzen, 1993).
METHODS OF STUDY sample Media
In this reconnaissance geochemical study, stream-sediment and heavy-mineral-concentrate samples were collected to provide information about the rocks eroded from the drainage basin upstream from each sample site. Analyses of stream-sediment samples are representative of the chemistry of rocks contained within the drainage basins. Heavy-mineral-concentrate samples provide information about the more dense minerals in rocks eroded from the drainage basins. The heavy-mineral-concentrate collection procedure selectively concentrates the dense minerals, many of which may be related to ore deposits, permitting chemical determination of some elements that are not easily detected in stream-sediment samples. The mineralogical content of the heavy-mineral-concentrate samples was also determined to provide additional information that may help to delineate mineral deposits. All of this information is useful for identifying ground favorable for mineral deposits.
$ample Collection Stream-sediment samples were collected from 138 sites from first-
and second-order streams (fig. 2). Heavy-mineral-concentrates were collected from 137 sites. At sample site (HM0127), a heavy-mineral- concentrate sample was not collected because the stream drainage was swampy and lacked sufficient sand-sized material necessary for concentrate collection. Sampling density was approximately one site per 11 km2 (4.2 mi2). The area of the drainage basin sampled ranged from approximately 2.6 km2 (1 mi2) to 15 km2 (5.8 mi2) .
Stream-sediment samples Stream-sediment material collected consisted of alluvium in the
active stream channel. When possible, samples were composited by collecting sediment from several localities in the active channel. However, some sites were swampy, with deep channels where it was not possible to identify the active channel bottom. In these instances,

Figure 2 . Localities of samples collected from the Horn Mountains study area in the Sleetmute quadrangle.
4
any available sediment was collected from the channel bottom using specialized shovels with extendable handles capable of reaching into these deep streams. The stream sediment was then screened to minus-10 mesh and collected in a stainless steel gold pan. Approximately 2 kg of sediment was taken from the pan and saved as the stream-sediment sample.
Heav-mineral-concentrate samples Heavy-mineral-concentrates were collected from the same active
alluvium as the stream-sediment samples. At each sample site, the gold pan was filled with stream sediment screened to minus-10 mesh and panned until most of the less dense minerals, organic materials, and clays were removed. This panned sample was saved as the heavy- mineral-concentrate sample. Streams sampled in areas covered by swampy lowlands often contain bed load material consisting primarily of clay with minor sand-sized material. In these instances, the gold pan was refilled several times to obtain adequate sand-sized material necessary for a heavy-mineral-concentrate sample.
Sample preparation In the laboratory, all 138 stream-sediment samples were dried
below 50°C, sieved to minus-80 mesh, pulverized, and chemically analyzed. The heavy-mineral-concentrate samples were sieved to minus- 35 mesh, and then separated using bromoform (specific gravity 2.85) to remove any remaining lighter minerals, primarily quartz and feldspar. The resultant heavy-mineral-concentrate samples were then separated into magnetic, paramagnetic, and nonmagnetic fractions using a modified Frantz Isodynamic Separator. The most magnetic material was removed at a setting of 0.25 ampere and contains mostly magnetite. The paramadnetic fraction was removed at 1.75 ampere and consists largely of ferromagnesian silicates and iron oxides. The nonmagnetic fraction of the heavy-mineral-concentrate samples contains sulfide minerals, gold, and some nonmagnetic oxides and silicates; this was the only fraction chemically analyzed. The nonmagnetic heavy-mineral- concentrate samples were split using a Jones-type multiple plate splitter; one split was hand ground and chemically analyzed and the other split was used for mineralogical analysis.
All of the 137 heavy-mineral-concentrate samples collected were examined microscopically for their mineralogical content. Following heavy-liquid and magnetic separation one heavy-mineral-concentrate sample (HEi0029c) lacked sufficient material necessary for chemical analysis, resulting in a total of 136 concentrates being chemically - analyzed.
ANALYTICAL TECHNIQUES Semiquantitative Emission Bpectrography
The minus-80-mesh stream-sediment and minus-35-mesh nonmagnetic- heavy-mineral-concentrate samples were analyzed by a semiquantitative, direct-current arc emission spectrographic (SQS) technique adapted from Grimes and Marranzino (1968). Spectrographic results were determined by visually comparing spectra derived from the sample against spectra obtained from laboratory reference standards made from pure oxides and carbonates. Standard concentrations are geometrically spaced over any given order of magnitude as follows: 100, 50, 20, 10,

etc. Samples whose concentrations were estimated to fall between those values were assigned values of 70, 30, 15, etc. The precision of this analytical technique is approximately f one reporting interval at the 83 percent confidence level and f two reporting intervals at the 96 percent confidence level (Motooka and Grimes, 1976). Values determined for the major elements Fe, Mg, Cat Na, Ti, and P are given in weight percent; all other values are in parts per million (micrograms/gram). In addition, Pd and Pt were determined in the heavy-mineral-concentrate samples by SQS. The elements determined by SQS and their limits of determination are listed in table 1. Data for stream-sediment samples determined by the SQS technique are listed in table 3; SQS data for the heavy-mineral-concentrate samples are listed in table 4.
W e t ~ h m i c a l Techniques Concentrations of Ag, As, Au, Bi, Cd, Cu, Mot Pb, Sb, and Zn were
determined in the minus-80-mesh stream-sediment samples by inductively coupled plasma-atomic emission spectroscopy (ICP-AES) using the procedure developed by Motooka (1988). The sediments were decomposed with concentrated hydrochloric acid and hydrogen peroxide in a hot- water bath. The metals were extracted in diisobutyl ketone (DIBK) in the presence of ascorbic acid and potassium iodide. The DIBK phase was then aspirated directly into the plasma and element concentrations were determined simultaneously with a multichannel ICP instrument.
Concentrations of Au, Te, and T1 in the minus-80-mesh stream- sediment samples were determined by an atomic absorption spectrophotometry (AAS) technique adapted from Hubert and Chao (1985). The samples were digested using a series of hydrogen peroxide, hydrofluoric acid, aqua-regia, and hydrobromic acid-bromine solutions. Gold, Te and T1 were separated and concentrated by extraction into methyl isobutyl ketone and determined by flame AAS. Concentrations for Au in the range of 0.002 to 0.050 ppm were determined by graphite furnace AAS on samples that were shown to be less than 0.050 ppm by the flame AAS technique. The graphite furnace AAS technique for Au was adapted from Meier (1980).
The minus-80-mesh stream-sediment samples were analyzed for Se using continuous-flow hydride generation AAS (Sanzolone and Chao, 1987). In this method, the stream-sediment samples were digested using nitric, perchloric, and hydrofluoric acids; hydrochloric acid was added to form Se (IV), which is necessary for hydride generation. A mixture of hydrochloric acid, sodium borohydride, and sodium hydroxide was added to produce selenium hydride, which is then stripped and transported with inert gas to the atomizer of the atomic absorption spectrophotometer where Se concentration was determined.
Mercury was measured in the minus-80-mesh stream-sediment samples using a modified version of the cold-vapor AAS technique (Kennedy and Crock, 1987). The samples were decomposed with nitric acid and sodium dichromate. Mercury (11) was reduced to mercury gas w i t h hydroxylamine hydrochloride/sodium chloride and stannous chloride in a continuous flow system releasing the gas into a quartz cell of an atomic absorption spectrophotometer where concentration was determined.
Tungsten was determined in the minus-80-mesh stream-sediment samples by a visible spectrophotometric (VS) method by decomposing the samples with nitric, hydrofluoric, and hydrochloric acids (Welsch,
1983). Stannous chloride and dithiol solution was added to reduce the W, forming the blue tungsten-dithiol complex, which was then extracted into heptane. The color intensity of the tungsten-dithiol complex is proportional to the concentration of W in the sample. Tungsten concentrations were determined using a visible absorption spectrophotometer.
Concentrations of F were determined in the minus-80-mesh stream- sediment samples by selective-ion electrode (SIE) analysis using a method modified from Bodkin (1977). Samples were fused with lithium metaborate, and then dissolved in nitric acid. A complexing buffer was added, and F concentrations were determined using a F-selective ion electrode.
Concentrations of the platinum group elements (PGE) Pt, Pd, Rh, Ru, and Ir were determined in the minus-80-mesh stream-sediment samples using an inductively coupled plasma-mass spectrometry (ICP-MS) technique (Meier and others, 1991). Digestion and separation of the PGE was made using a nickel sulfide fire assay procedure similar to that described by Jackson and others (1990). The nickel sulfide button is dissolved in hydrochloric acid, tellurium is added and reduced with stannous chloride to coprecipitate PGE sulfides, which are retained by filtration. The residue is dissolved in aqua regia and the solution is analyzed for PGE using an ICP-MS instrument.
The elements determined by the various wet chemical techniques and their limits of determination are listed in table 2. Data determined for the stream-sediment samples by these methods are shown in table 3. Discrepancies in analyses for certain elements duplicated by different analytical methods, such as values determined for Au in stream-sediment samples, may be attributable to the particulate nature of minerals that contain Au, different sample aliquots used, and different extraction procedures. The M S analysis of Au provides the most statistically representative results due to the larger sample aliquot analyzed. For example, a 10-gram sample aliquot is used for the AAS analysis, whereas a 10-milligram sample aliquot is used in the SQS technique,
optical Mineralogy Mineral identifications were made with a binocular microscope on
each of the nonmagnetic, heavy-mineral-concentrate samples. The amount of a particular mineral in the concentrates was recorded in the following way: class 1, <I%; class 2, 1-5%; class 3, >5-20%; class 4, >20-50%; and class 5, >50%. If a particular mineral was not observed, an "Ol1 was recorded. Mineralogy results are shown in table 5.
The following minerals were recognized in heavy-mineral- concentrate samples, abbreviations are listed here in parentheses and in the column headings in table 5: zircon ( z i r ) , apatite (apt), cassiterite (cass) , rutile (rut), anatase (ant), brookite (brk) , tourmaline (tour), pyroxene (pyx), sphene (spn) , garnet (gar), fluorite (flu), pyrite (pyr), cinnabar (cinn), chalcopyrite (cpy), gold (gold), scheelite (schl), barite (bar), sphalerite (sphl), corundum (cor), muscovite (musc), andalusite (and), sillimanite (s i l ) , monazite (monz), and chlorite (chl).

DATA STORAGE SYSTEM Upon completion of the analytical work, the results were entered
into a computer-based file as part of the USGS Rock Analysis Storage System (RASS) database. This database contains both descriptive geological information and analytical data. Any of this information may be retrieved and converted to a binary form (STATPAC) for computerized analysis or publication (VanTrump and Miesch, 1976).
The data in this report are also available on a 5.25 inch, 360-KB magnetic diskette in Theodorakos and others (1992). Access to this information requires an IBM compatible computer using MS DQS and a 5.25 inch drive capable of handling 360-KB diskettes. The diskette report contains the analytical results for the stream-sediment and heavy-mineral-concentrate samples in STATPAC file (.STP) format. An executable data conversion program STP2DAT.EXE (Grundy and Miesch, 1987) is also contained on the diskette that provides various format options into which the STATPAC file may be changed.
DESCRIPTION OF DATA TABLE Table 3 contains the geochemical data for the stream-sediment
samples collected du,ring this study; tables 4 and 5 contain the geochemical and mineralogical data for the heavy-mineral-concentrate samples, respectively. Sample site locations are given in latitude and longitude in the tables, and these sample sites are plotted on figure 2. Sample site localities were abbreviated on figure 2 showing only a 3-digit number corresponding to sample numbers in the data tables.
The analytical method for each element shown in tables 3 and 4 is abbreviated as a suffix in the column headings. The designation "SQSW indicates semiquantitative emission spectrography, "ICPW indicates inductively coupled plasma-atomic emission spectroscopy and inductively coupled plasma-mass spectrometry, "AASW indicates atomic absorption spectrophotometry, "VSM indicates visible spectrophotometry, and nSIE1l indicates selective-ion electrode analysis, The letter "NW in the data table indicates that an element was looked for but not observed at the concentration shown, while an "<" indicates that an element was observed but present in concentrations below the lower limit of determination shown. A It>"
was entered in the table after the upper limit of determination if an element was observed but was present in concentrations above this value. Lower and upper limits of determination for the ICP methods listed in tables 2 and 3 may be variable due to variable sample aliquot weight, dilution of an analytical aliquot, or instrumental interference correction.
ACKNOWLEDGMENTS We would like thank Leon Bradley, Joe Curry, Jerry Motooka, Craig
Motooka, Bruce Roushey, and John Sharkey for chemical analyses. Steve Sutley provided X-ray mineral identifications and Danny Abrams performed sample preparations.

REFERENCES CITED
Bodkin, J.B., 1977, Determination of fluorine in silicates by use of an ion-selective electrode following fusion with lithium metaborate: The Analyst, v. 102, no. 1215, p. 409-413.
Bundtzen, T.X. and Gilbert, W.G:, 1983, Outline of geology and mineral resources of upper Kuskokwlm region, Alaska: Journal of the Alaska Geological Society, v. 3, p. 101-119.
Bundtzen, T.K., and Laird, G.M., 1982, Geologic map of the Iditarod D- 2 and eastern D-3 quadrangles, Alaska: Alaska Division of Geological and Geophysical Surveys, Geologic Report 72, 1 sheet, scale 1:63,360.
Cady, W.M., Wallace, R.E., Hoare, J.M., and Webber, E.J., 1955, The central Kuskokwim region, Alaska: U.S. Geological Survey Professional Paper 268, 132 p.
Gray, J.E., Theodorakos, P.M., Bradley, L.A., and Bullock, J.H:, Jr., in press, Favorable areas for metallic mineral resources Ln and near the Horn Mountains, Sleetmute quadrangle, southwestern Alaska, Dusel-Bacon, Cynthia, and Till, A.B., eds., Geologic studies in Alaska by the U.S. Geological Survey during 1992: U.S. Geological Survey Bulletin.
Grimes, D.J., and Marranzino, A.P:, 1968, Direct-current arc and alternating-current spark emission spectrographic field methods for the semiquantitative analysis of geological materials: U.S. Geological Survey Circular 591, 6 p.
Grundy, W.R., and Miesch, A.T., 1987, Brief descriptions of STATPAC and related statistical programs for the IBM personal computer: U.S. Geological Survey Open-File Report 87-411-A, 34 p.
Hubert, A.E., and Chao, T.T.! 1985, Determination of gold, indium, tellurium and thallium in the same sample digestion of geological materials by atomic-absorption spectroscopy and two-step solvent extraction: Talanta, v. 32, p. 383-387.
Jackson, S.E., Fryer, B.J., Gosse, W., Healey, D.C., ~ongerich, H.P., and Strong, D.F.! 1990, Determination of the precious metals in a
geological materials by inductively coupled plasma-mass spectrometry (ICP-MS) with nickel sulphide fire-assay collection and tellurium coprecipitation, Potts, P . J . , Dupuy, C., and Bowles, J.F.W., eds., Microanalytical Methods in Mineralogy and ~eochernistry: Chemical Geology, v. 83, p. 119-132.
Kennedy, K.R., and Crock, J.G., 1987, Determination of mercury in geological materials by continuous flow, cold-vapor, atomic-absorption spectrophotornetry: Analytical Letters, v. 20, p. 899-908.

Meier, A . L . , 1980, Flameless atomic-absorption determination of gold in geological materials: Journal of Geochemical ~xploration, v. 13, p. 77-85.
Meier, A.L., Carlson, R.R., and Taggart, J . E . ! 1991, The determination of the platinum group elements in geologlc materials by inductively coupled plasma mass spectrometry labs.]: The sixth Annual International Platinum Symposium, Perth, Australia, Abstracts with Programs.
Miller, M.L., and Bundtzen, T.K., 1988, Right-lateral offset solution for the Iditarod-Nixon Fork fault, western Alaska, in Galloway, J.P., and Hamilton, T.D., eds., Geologic studies in Alaska by the U.S. Geological Survey during 1987: U.S. Geological Survey Circular 1016, p. 99-103.
Miller, M.L:, and Bundtzen, T.K., 1992, Geologic history of the post- accretzonary rocks, Iditarod quadrangle, west-central Alaska Cabs.]: Geological Society of America Abstracts with Programs, v.24, no. 5, p. 71.
Miller, M.L., and Bundtzen, T.K., 1993, Geologic map of the Iditarod quadrangle, Alaska: U.S. Geological Survey Miscellaneous Field Studies Map MF-2219-A, scale 1:250,000.
Motooka, J.M., 1988, An exploration geochemical technique for the determination of preconcentrated organometallic halides by ICP- AES: Applied Spectroscopy, v. 42, no. 7, p. 1293-1296.
Motooka, J. M., and Grimes, D. J., 1976, Analytical precision of one- sixth order semiquantitative spectrographic analyses: U.S. Geological Survey Circular 738, 25 p.
Sanzolone, R.F., and Chao, T.T., 1987, ~etermination of selenium in thirty-two geochemical reference materials by continuous-flow hydride generation atomic absorption spectrophotometry: Geostandards Newsletter, v. 11, p. 81-85.
Theodorakos, P.M., Borden, J.C., Bullock, J.H., Jr., Gray, J.E., Hageman, P.L., 1992, Diskette version of analytical data for stream-sediment and heavy-mineral-concentrate samples collected from the Horn Mountains area, Sleetmute quadrangle, Alaska: U.S., Geological Survey Open-File Report 92-708-B, 1-360 KB diskette.
VanTrump, George, Jr., and Miesch, A.T., 1976, The U.S. Geological Survey RASS-STATPAC system for management and statistical reduction of geochemical data: Computers and Geosciences, v. 3, p. 475-388.
Welsch, E.P., 1983, A rapid geochemical spectrophotometric determination of tungsten with dithiol: Talanta, v. 30, p. 876-878.

Table 1. Limits of determination for the spectrographic analysis of stream-sediment samples, based on a 10-mg sample.
[The spectrographic limits of determination for heavy-mineral- concentrate samples are based on a 5-mg sample weight, and are therefore two reporting intervals higher than the limits given for stream sediments]
Elements Lower determination limit Upper determination limit
Percent Iron (Fe) 0.05 20 Magnesium (Mg) 0.02 10 Calcium (Ca) 0.05 20 Sodium (Na) 0.2 5 Titanium (Ti) 0.002 1 Phosphorous (P) 0.2 10
Parts aer million Silver (Ag) 0.5 5,000 Arsenic (As) 200 10,000 Gold (Au) 10 500 Boron (B) 10 2,000 Barium (Ba) 20 5,000 Beryllium (Be) 1 1,000 Bismuth (Bi) 10 1,000 Cadmium (Cd) 20 500 Cobalt (Co) 10 2,000 Chromium (cr) 10 5,000 Copper (Cu) 5 20,000 Gallium (Ga) 5 100 Germanium (Ge) 10 100 Lanthanum (La) 50 1,000 Manganese (Mn) 10 5,000 Molybdenum (Mo) 5 2,000 Niobium (Nb) 20 2,000 Nickel (Ni) 5 5,000 Lead (Pb) 10 20,000 Antimony (Sb) 100 10,000 Scandium (Sc) 5 100 Tin (Sn) 10 1,000 Strontium (Sr) 100 5,000 Thorium (Th) 100 2,000 Vanadium (V) 10 10,000 Tungsten (W) 20 10,000 Yttrium (Y) 10 2,000 Zinc (Zn) 200 10,000 Zirconium (Zr) 10 1,000 Palladium (Pd) ' 5 1,000 Platinum (Pt) ' 20 1,000
'~etermined in heavy-mineral-concentrate samples only.

Table 2. Other analytical methods used and limits of determination*. [ICP-AES, inductively coupled plasma-atomic emission spectroscopy; U S , atomic absorption spectrophotometry; VS, visible spectrophotometry; SIE, selective-ion electrode analysis; ICP-MS, inductively coupled plasma-mass spectrometry].
~nalytical Lower limit Upper limit Element Method
Silver (Ag) Arsenic (As) Gold (Au) ~ismuth ( ~ i ) cadmium (Cd) Copper (Cu) Molybdenum (Mo Lead (Pb) Antimony (Sb) Zinc (Zn)
ICP-AES ICP-AES ICP-AES ICP-AES ICP-AES ICP-AES
1 ICP-AES ICP-AES ICP-AES ICP-AES
0.045 pprn 0.6 pprn 0.15 ppm 0.6 ppm 0.03 pprn 0.03 pprn 0.09 ppm 0.6 ppm 0.6 pprn 0.03 pprn
1,500 pprn 3,000 ppm 2,400 ppm 1,500 pprn 500 ppm
1,200 ppm 1,500 pprn 12,000 pprn
800 ppm 500 ppm
Tellurium (Te) AAS 0.050 ppm ~hallium (Tl) M S 0.050 ppm Gold (Au) AAS 0.002 ppm Mercury (Hg) AAS 0.02 ppm selenium (Se) AAS 0.1 ppm Tungsten (W) VS 1 PPm Fluoride (F) SfE 0.03 % Platinum (Pt) ICP-MS 0.5 ppb Palladium (Pd) IcP-MS 0 . 5 ppb Rhodium (Rh) ICP-MS 0.5 ppb ~uthenium (Ru) ICP-MS 0.5 ppb Iridium (Ir) ICP-MS 0.5 ppb
* NOTE: Limits of determination for the ICP-AES and ICP-MS methods listed in this table are nominal, and in table 3 may be . variable. The variability in limits of determination for an element is due to variable sample aliquot weight, dilution of an analytical aliquot, or instrumental interference correction.

Table 3. Analyt ical data f o r strnrm-sediment ssmples collected from the Horn Momtains area, Sleetm~te quedrwgle, Alaska. [ICP, inductively e#plad p l a w spectroscopy; SPS, semiquenti t a t i ve miss1 on sptrogrephy; US, atolllie absorption apaetrophotolstry; W, v i s i b l e spectrophotometry; SIE , selective-ion electrode analysis; N, not detactd; *, detectad but b s l w the l i m i t of &tominat ion shown; *, determined t o be greater than the value show11
Senple Lati tude Longitude Agppn-ICP A s p - I C P Auppn-ICP Bi ppn-ICP C d ~ - I C P C u p p n - 1 C P M o p p r n - I W P b # r m - 1 ~ ~
HMO021 S HHOOUS W O U S M024S Hnoo25s m0026S m 2 7 s HnOO28S HW0029S llH003os

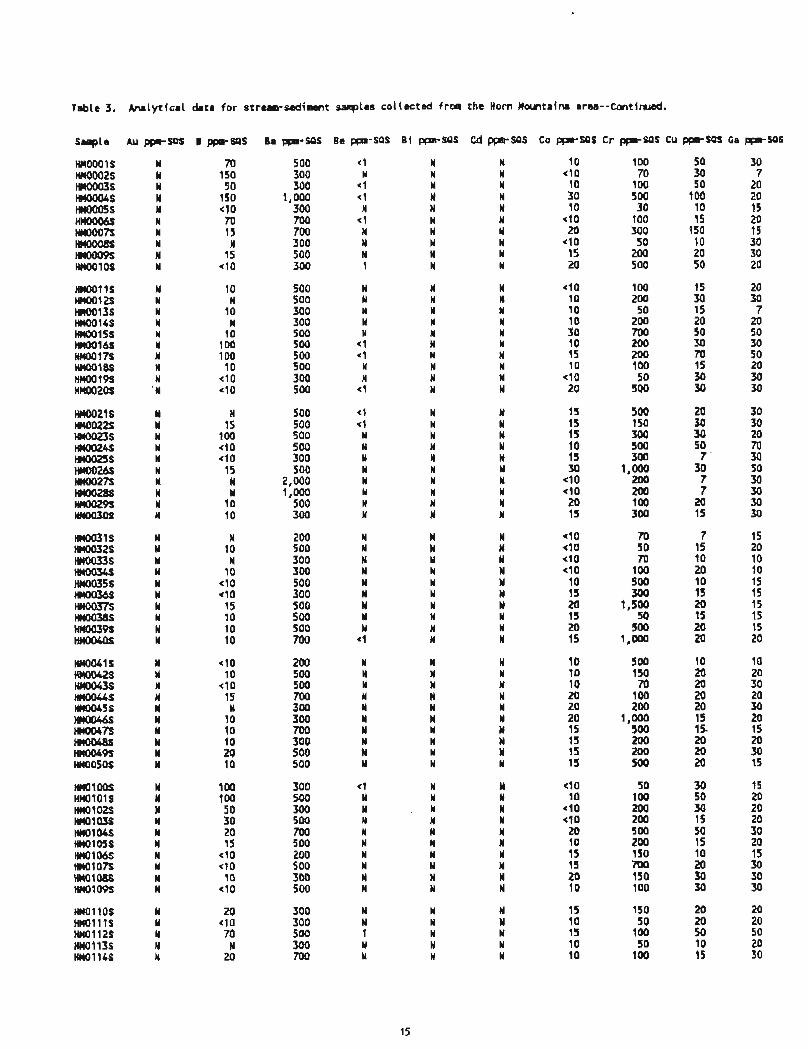
Table 3. Anelytical data for stre=-sediment samples collected from the Horn Mwntains area--Continued.

Table 3. Analytical data for stream-sedimant samples collected fran the Horn Hountains area--Continued.
1,000 ZOO 200 300 100 300 500
100 200 100 150 200 200 200 700 300 300
300 300 300 500 100 500 70 70
500 100
100 500 70
150 150 100 200 150 100 300
150 200 150 200 200 200 100 100 150 70
150 150 150 300

Table 3. Analytical data for stream-sedimnt samples col lected from the Horn Movrtalns area--Contiwed.

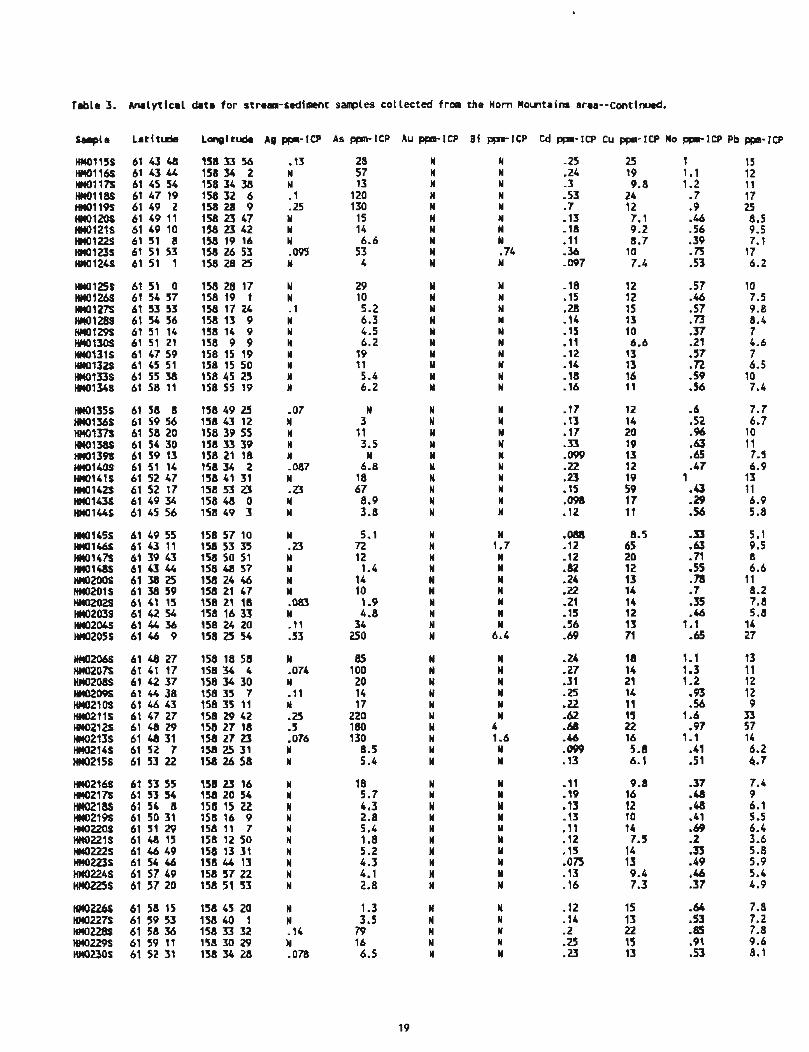
Table 3. Analytical data for streern-sediment samples collected f r m the Horn Movltains arca--continuad.
S w l e Latitude Lmgitude A g p - I C P A s p - I C P Auppn-ICP Bf ppn-ICP C d p p ~ - 1 C P C u p p n - I C P H o p p l - l C P P b # m - 1 ~ ~
W216S HMO21 h HM0218S HnO219S HHOUOS HnO221S HMOWS anO223s HM0224S HC10225S

rable 3.
S q l e
HMO1 15s HMO1 16s nHoll7s HCI0118S HtlOllPS HllOlZOS wnQl2lS wno122s w123s M0124S
Hnol25S W126S Hn0127S M128S W129S HM0130S H110131S HW0132s HM0133S HW0134S
HW0135S HMO1 36s HH0137S HW0138S W l 3 9 E HOl40S W141S W162S W l 4 3 S Hn0144S
HM0145S ~ ~ 0 1 4 6 s HM0147S HM0148S HMQ2OOS HMo201S HWO202S HW0203S H110204S HH0205S
HIJ0206s HM0207S W208S HH0209S HnO2 10s HnO2llS w212s tlM0213S H110214S W215S
H110216S HW0217S w 2 1 m HMO2198 W22OS W 2 2 l S w222s w w s Hno224S Hn0225S
HM0226S HM0227S HM0228S HM0229S HMOaOS
Analyt ical
Sb ppr1CP
6 1.1
N 7.9 4s
N 1.2 N
5.1 N
3 N N .97 N
1.2 N .99 .71 N
.n N
1.8 N N N . ft
17 2.6
N
N 22
1.4 N
3.8 1.6
.76 1.4 7.5
24
2.5 1.5
N 1.9 1.6
57 29 7
N 1.3
1.5 N N .81 N N N N
1.3 1 .a
N 2.1 5.7 2.9
N
data fo r stream-sediment sanplss collected from the Horn Movltains area--Continued.
tn #*A-ICP Ca X-SPS Fe X-SPS Mg X-sos Na X-SaS P X-SaS T i X-SPS Ag ppn-SOS AS ppn-SPS
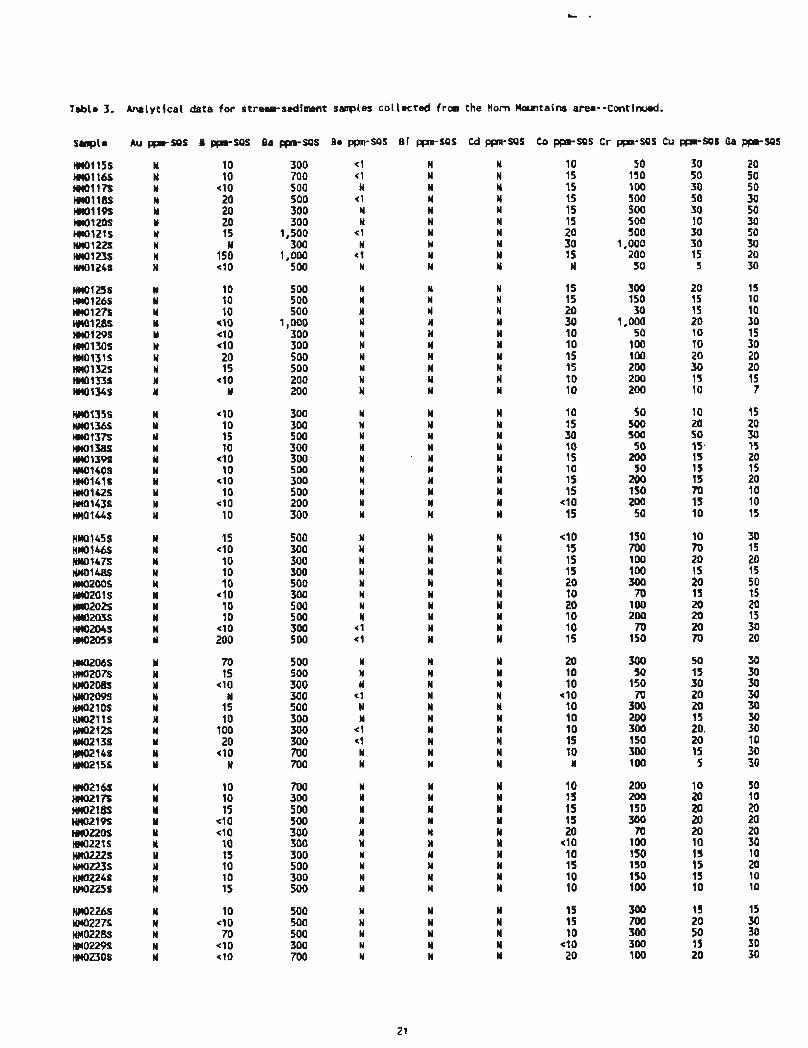
Tabla 3. Analytical data for stream-sediment samples collected frm the Horn Moultaim area--Continued.

Table 3. Analytical data for stream-sedimsnt samples coliectad frm the Horn Movltains area--Continued.
Sauplt
HMOl 15s HMOl 16s W l l f S HMO1 18s HIKHlQS nn0120s HIIO121S HMO1 22s H M O l U S HMO1 26s
HW0125S HMO1 26s HMO127S HMOl 28s
W130S HMO131S HMO152S HM0133S HC10134S
HM0135S HMO1365 HWOlfTS HMO138$ W139S HM0140S HMO1415 HMO142S Hn0143S HMOlbbS
W145S W146S W 1 4 B HMO148s HM0200S w 2 0 1 S HMOZOZS HMO203S HMO204S W205S
HMo206s HMO2OfS HM0208S HMo209S Hn0210S H110211S HCHIZlZS W213S HM0214S HMO215S
HMO21 6s HMO21 7s HM0218S Hn0219s HWO22OS HMO221 S ~ ~ 0 2 2 2 s HMO223S HClO22GS HHO225S
HM0226S HMO2275 HH0228S HM0229S HM0230S
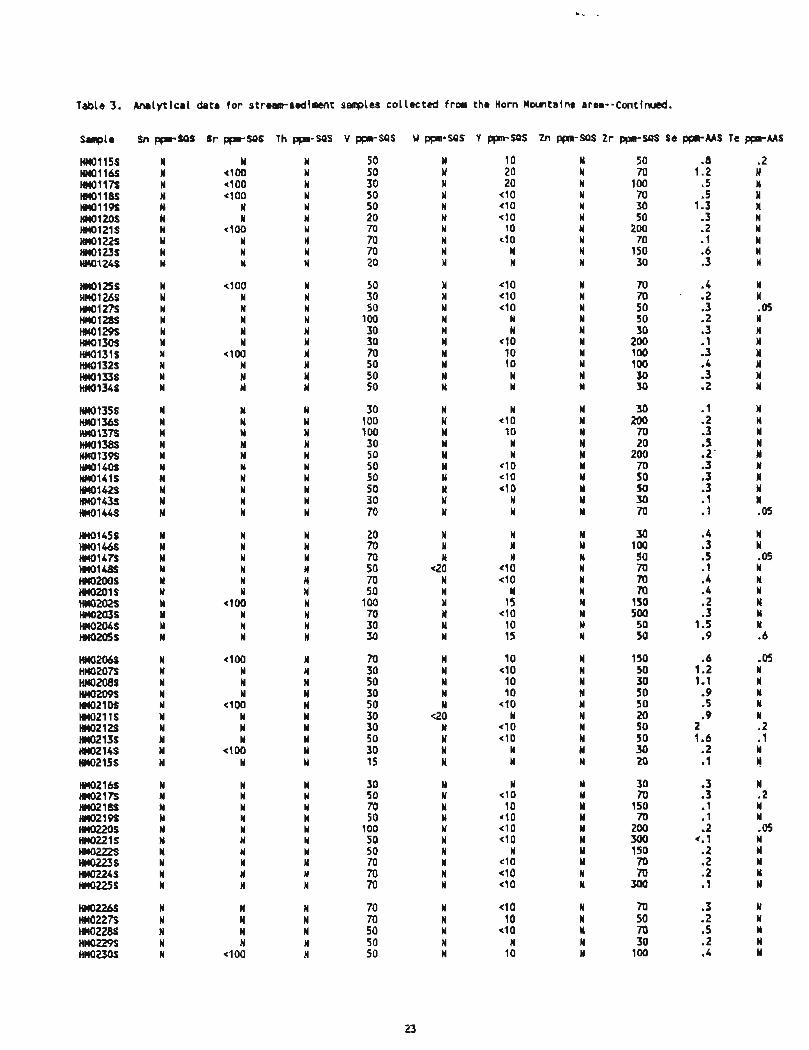
Table 3. Analytical data for strewn-scdimcnt samples coltectcd from the Horn Movltains area--Continued.
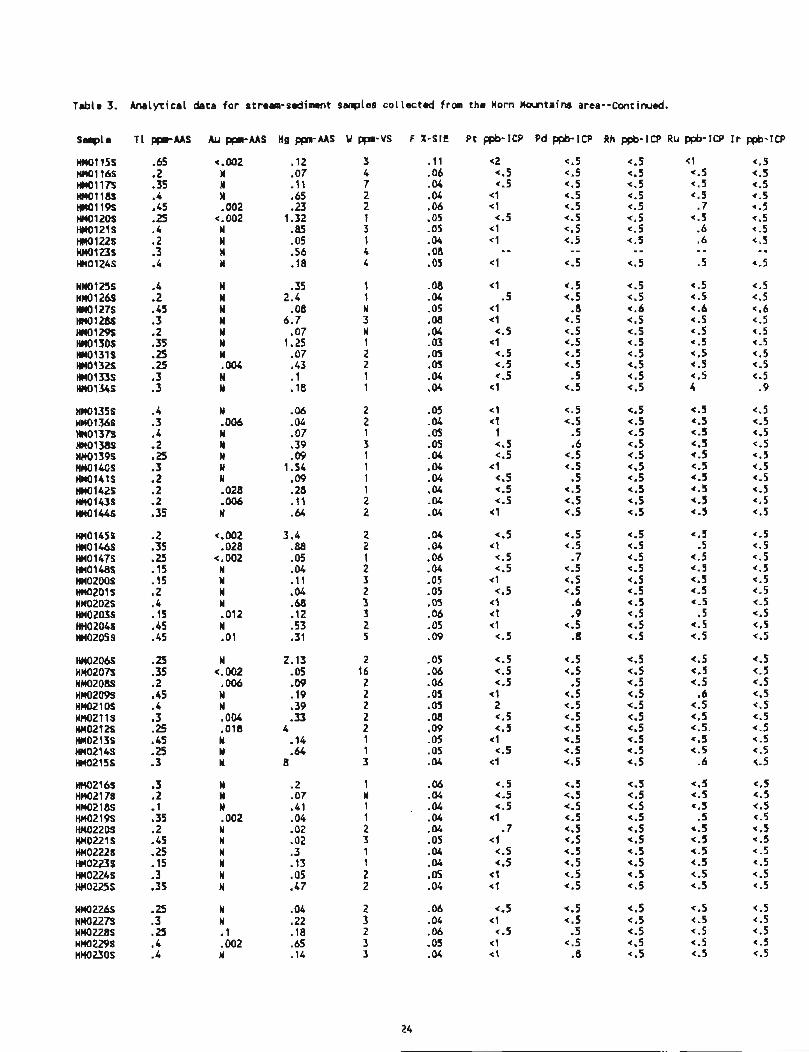
Table 3. Analytical data for stream-sediment sarrples col lected from the Horn Mwntains area--Continued.
X-S IE
-11 -06 .04 .04 .06 .05 -05 .04 . 08 . 05
-08 -04 -05 .08

Table 3. Anslytical data for stream-sediment samples col lected from the Horn Mountains area--Continued.
Sbppm-ICP Z n w - I C P CaX-SPS FeX-SQS MgX-SPS Ma%-SPS PX-SPS Ti%-SQS Agppnr-SPSAsppl-S9S
F X-SIE P t ppb-ICP Pd ppb-ICP Rh ppb-ICP Ru ppb-ICP Ir ppb-ICP
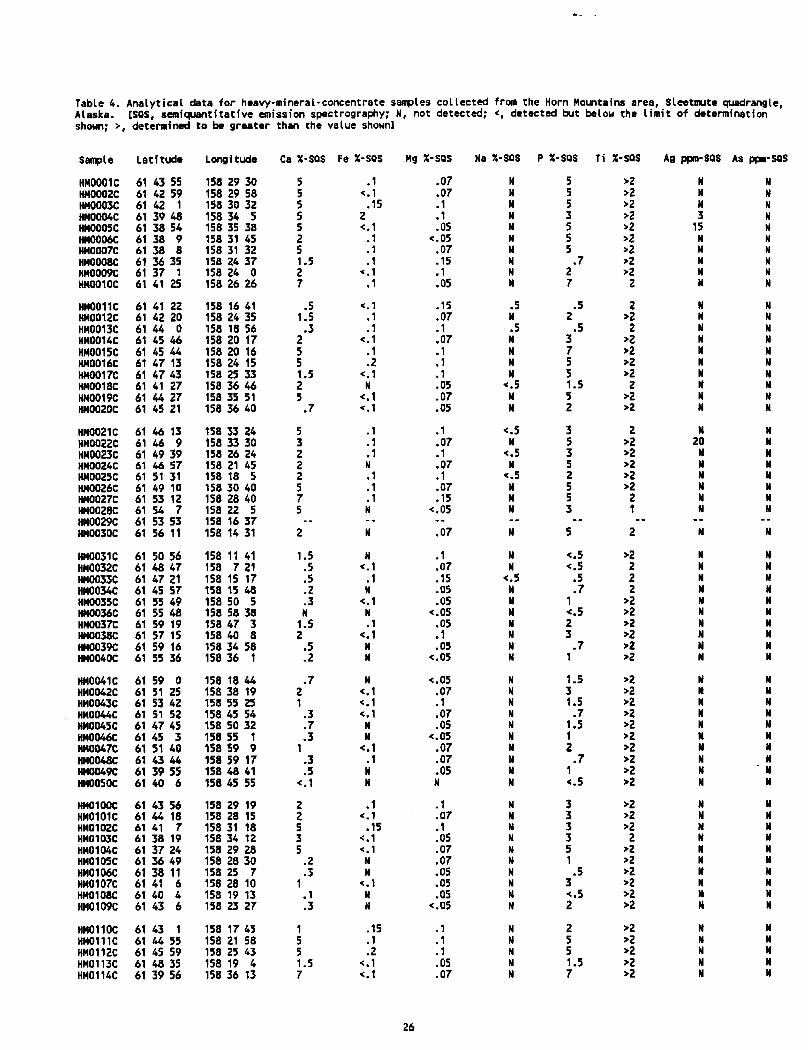
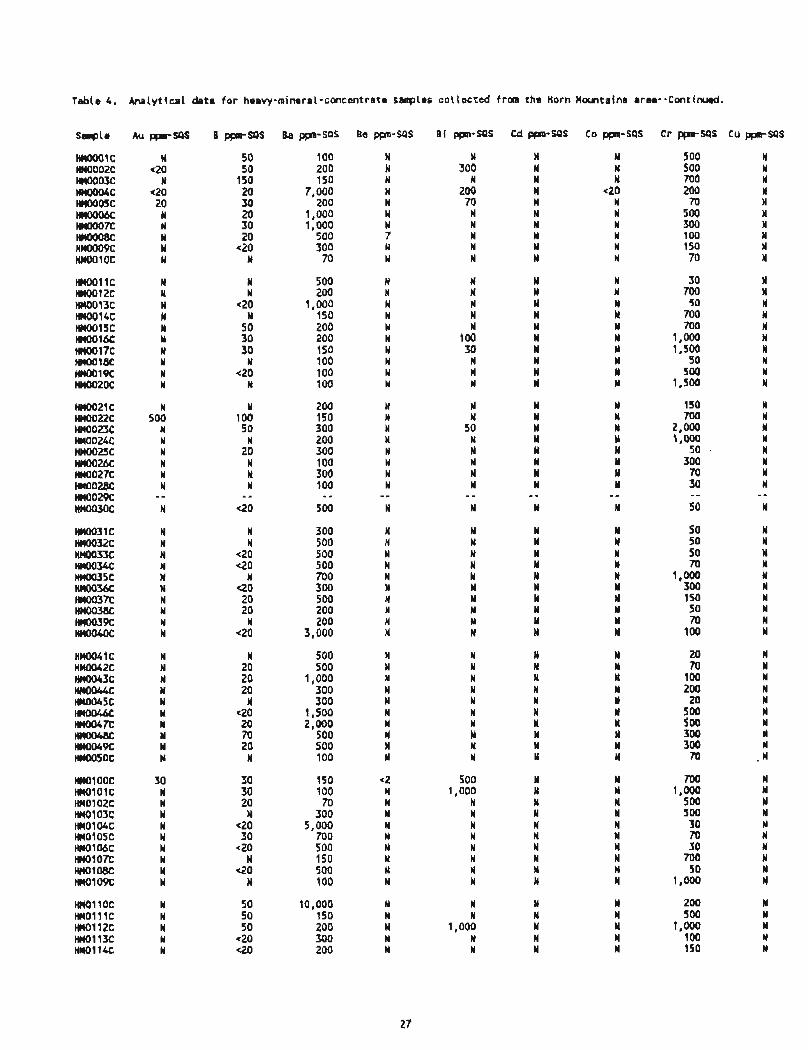
Table 4. Analytical data for heavy-mineral-concentrate sanples colLected from the Horn Mountains area--Continued.
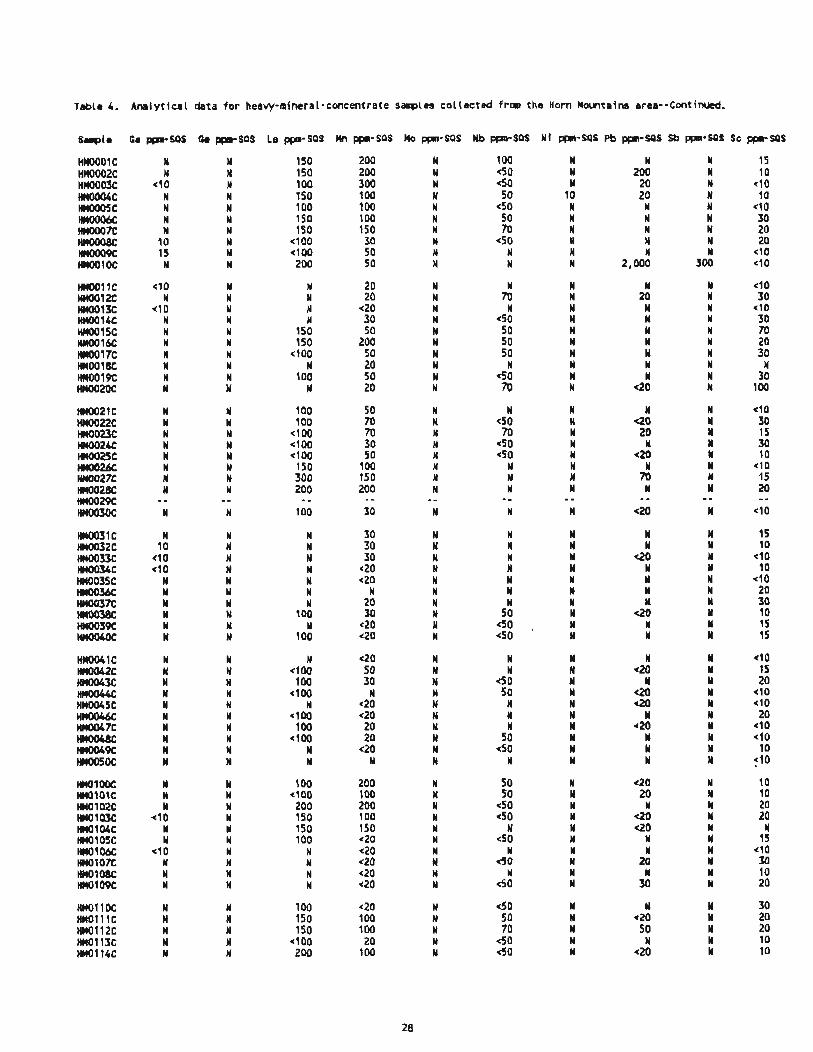
Table 4. Analytical data for heavy-mintral*concentrate sanples colLected fran the Horn Mountains area--Continued.
ppn- SPS
150 150 100 150 100 150 150 *I00 *loo zoo
N N N N
150 150 ~100
N 100
N
100 100 *I00 d 00 400 150 300 200
* - 100
N N N N N N N
100 N
100
N 400 100 400
N 400 100 *I00
N N
100 e l 00 200 150 150 100
N N N N
100 150 150 *loo ZOO

Table 4. Analytical data for heavy-mineral-concentrate sanplcs collected f r m the Horn Mountains area--Continued.
ppn- sas
300 5 00 300 5 00 500 300 300 500 200 500
200 100 100 150 300 500 200 70 300 100
150 200 150 70
1 so 150 300 200 - * 100
300 500 200 100 50 100 200 100 100 100
150 200 100 30 70 200 70 70 100 150
150 200 500 300 100 150 150 100 300 20
5 00 150 300 IS0 700
fable 4. Analytical date for heavy-mineral-concsntrate sanptes collected frm the Horn Movltains area--Continued.
Longitude Ca X-SPS Fa X-SQS Mg %-$as Na X-SPS P %-SPS T i X-SPS Ag ppl-SPS As ppn-SPS
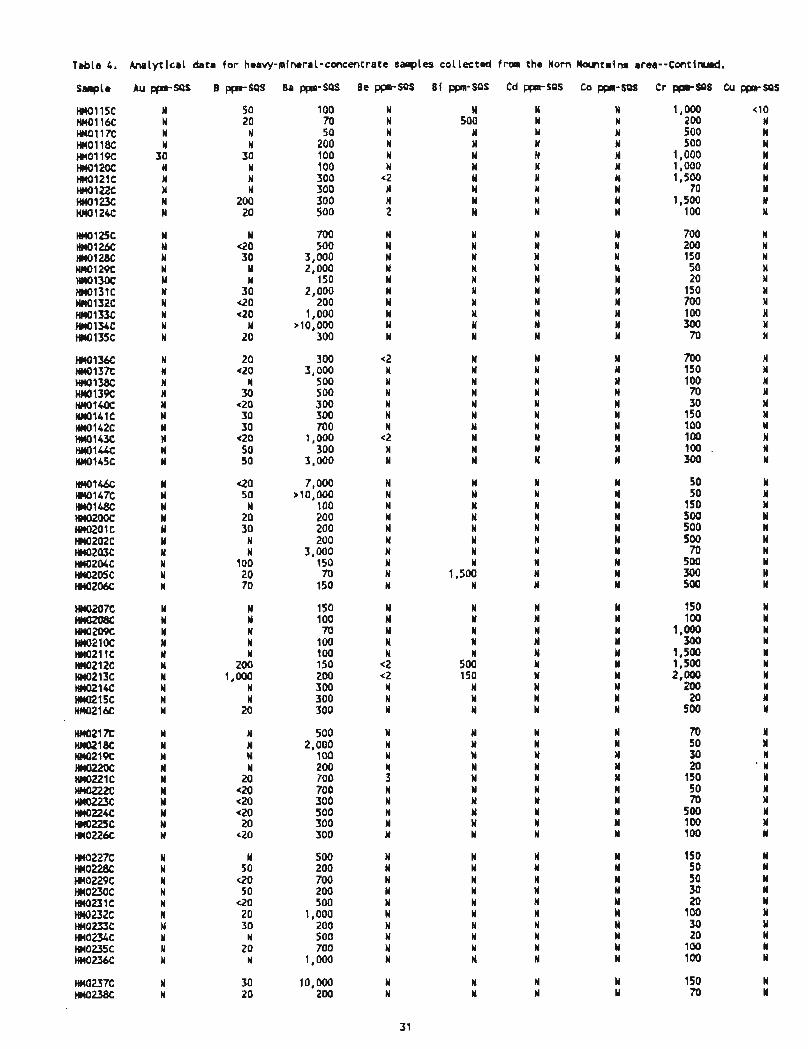
Table 4. Analytical data fo r heavy-mineral-concentrate sanples collected frm the Horn Mwta ins area--Continurd.
HMO1 15C HMOl 16C HMO 1 1 7c HMO1 18C HMOl 19C HMO1 20C HMOl21C HMO1 22C Hrm123C HMO1 24C
~no125c HH0126C HMO1 28C HMO1 29C HM0130C HH0131C HM0132C HH0133C HHO134C W0135C
HMO 136C HHOl37C HMo138C HMo139C W140C Wl41C HC10142C HMO1 43C HMO1 44C HM0145C
HW146C Hn0147C HM0148C HMOZOOC HM0201C HMO202C H M O ~ O ~ C HM0204C HM0205C m2w
HE10207C ~ 2 O B C H110209C HMO210C HMO21 1C Hnozlzc HM0213C HMO21 4C HM0215C HW216C
HMO21 7C HMO2 1 8C HM0219C HC10220C Hm)221C w 2 2 2 c HHO223C HH0224C HHO225C HMO22be
HM0227C HM022& HM0229C HM0230C HMO23 1 C HMOz2C HM0233C HM0234C HMO235C HM0236C
~ ~ 0 2 3 7 ~ Hnovac
50 20
N N
30 N N N
200 20
N ~ 2 0 30
N N
30 *20 ~ 2 0
N 20
20 *20
N 30
c20 30 30
~ 2 0 50 50
~ 2 0 50
N 20 30
N N
100 20 70
N N N N N
ZOO 1,000
N N
20
N N N N
20 czo ~ 2 0 ~ 2 0 20
czo
N 50
~ 2 0 50
*20 20 30
N 20
N
30 20
1,000 200 500 500
1 , 000 1,000 1,500 m
1,500 100
700 200 150 50 20
150 roo 100 300 70
700 150 100 70 30
150 100 100 100 300
50 50
150 So0 500 SO0 70
500 300 500
150 100
1,000 300
1,500 1,500 2,000
200 20
500
m 50 30 20
150 50 fD
500 100 100
150 50 50 30 20
100 30 20
100 100
150 70
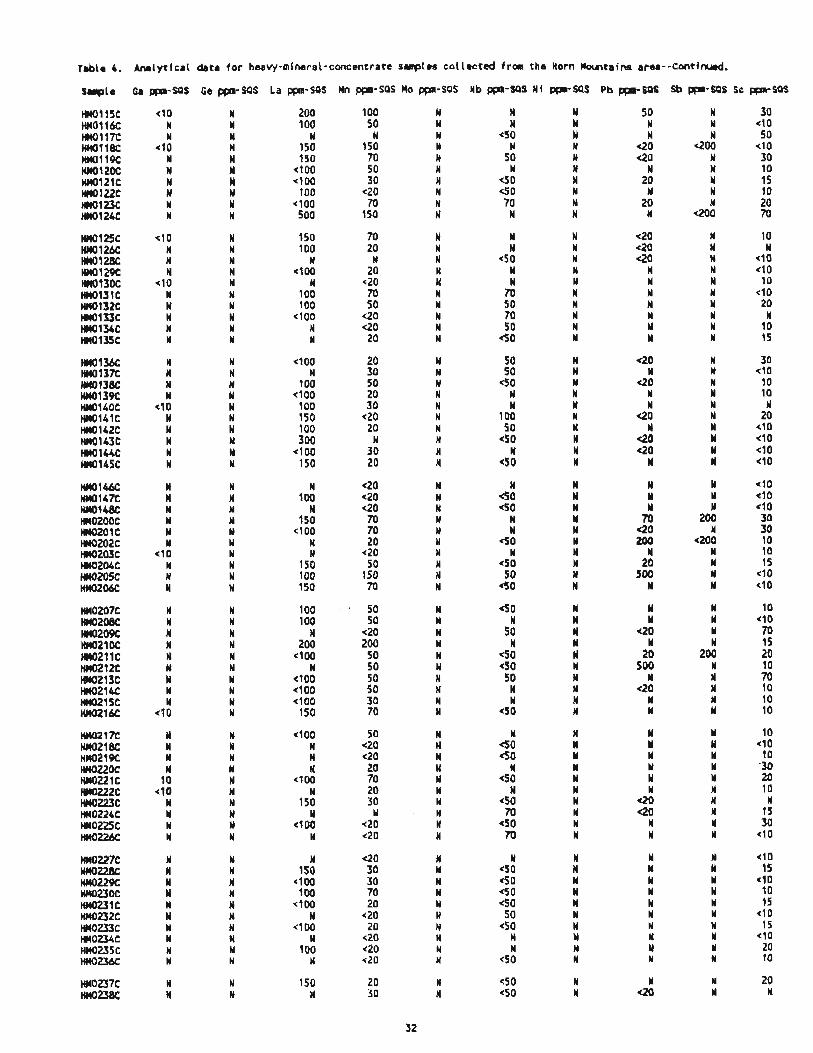
Table 4. Analytical &ta for heavy-mineral-concentrate sanples collected from the Horn M w n t a i ~ arm-
HMO1 15C HMO1 16C HMOl 17C HMOl la H n O l l 9 C w 1 2 0 c w 1 2 1 c w 1 2 2 c HnOl23C HM0124C
W 1 2 5 C w 1 2 6 C mr0128c HMO129C HM0130C W 1 3 1 C Hn0132C HMO1 3 3 C HM0134C W 1 3 5 C
HMol36C HMO137C HE10138C HMO139C HM0140C HM0141C HM0142C HE10143C HMOl U C HM0145C

Table 4. Analytical data for heavy-mineral-Concentrate samples collected frm the Horn Mountains area--Continued.
HMO1 15C HMO1 16C HMOl 17C HMO1 18C HMOl I PC HM0120C HM0121C HH0122C HMOl UC HMO1 24C
HM0227C HHO228C HH0229C HHOUOC HMO23 1 C HH0232C HM0233C HMOU4C HM0235C HMO236C
i L 0 - 0 r N 0 - D 0 0 D 0 0 0 0 0 0 - 0 0 0 0" -0 -0000 0 0 0 - O O O O 0 - O O O O W O O D F O 3 0 - d
0000000000 0000000000 -0eaOOeQOo o e o e o o o ~ o o mooooooooo P
- .- m r & oaO00000oo OoooeeeaOo oooooooooo o o o m o o o o o ~ omooaoaooo G 0
L n - c D rnro m-u m m m P.-c **a

4 5 Q 0 0 0 0 0 0 0 0 0 0 0 0 0 0 O O O O O O O O O O O O 0 O O O O O Q 0 O O Q O O O O O O O O O O O P
2 O Q r O " F c 0 n 0 O O O O O O O O O O Q P - Q m 0 O - N - 000000000- oOoO-rQo".-F m
j 5 0000000000 0 ~ 0 0 0 0 0 0 0 0 0000000000 0000000000 O O O O C O O O O O
3 4 & 5 ---0-00000 0 ~ 0 0 0 0 0 0 0 0 O O O O O O O O O O 0 0 0 ~ 0 0 r - a 0 0000000000
Z 2 -0-0000000 -000000000 0 0 0 0 0 Q 0 P O O O O O O Q O O O O O 0000000000 e ., .-
m 2 0000000000 0000009000 0000000000 0000000000 O O O O O 0 6 O Q O
% ' E 000-r--0-0 0 0 0 - - - o o - r --0--0--a0 O r 0 0 O N - - r ~ O - v r r N - 0 0 0 g '" =
0 0 Q O O t 0 0 0 0 0000000000 O O O O O O O O O O O r O O O O O O O O O O r O r O Q O O O U C
Q - d * ~ N ~ r ~ m Q ~ # c u ' t h p m U 4 a h - Q U h - ~ u I w W ~ O ~ 4-N-GWi-
m m - r N r - m m N m O r * m - * * o n m N - N m + - O r m n M O N r N M S s G z ~ ~ b = s s I ~ $ z : 2 m o n o c m m n r n nronnoonnn m a r - - m o r o n ~ O D - O - O - O N * m r m e - n m U
n m * m * * m * * * **",*",m*",*tn u * * m n n e u * * ***",nmmwnm * * m m m m m * 3 s
= 1 5555555555 5555555555 S55SSZfFSS 55ZSZSS555 5555S55555

3 --0-000-0- -r0-00---0 P*.----*m"" w------
L 0 00."rrr0000 O ~ r 0 0 0 0 0 0 - O O O O O O O O O O a000000 0
.- ; 3 o-o-00-0-0 - r -0- - -eoe a-oooo-ooo O O O O ~ N O
Y - I 3 0-0-'0-000 -600000-00 0000000000 0--00-0 m PI * L m 2 O O O O O O O O O O 0000000000 0000000000 0000000
2 8 .- m u k O o o O O O Q O O O O O O O O O O O O O 00000-000- O O O O O O O C 0