Dgf evaluation final report
139
23/04/14 Evaluation of the Danish Growth Fund Evaluation of activities, 2010 – 2012 In collaboration with Gordon Murray and Marc Cowling
description
Â
Transcript of Dgf evaluation final report
23/04/14
Evaluation of the Danish Growth Fund Evaluation of activities, 2010–2012 In collaboration with Gordon Murray and Marc Cowling

2 EVALUATION OF THE DANISH GROWTH FUND | DAMVAD.COM
EVALUATION OF THE DANISH GROWTH FUND | DAMVAD.COM 3
For information on obtaining additional copies, permissionto
reprint or translate this work, and all other
correspondence,please contact:
DAMVAD
damvad.com
Copyright 2013
4 EVALUATION OF THE DANISH GROWTH FUND | DAMVAD.COM
1 Executive summary 6
2 Executive summary DK 9
3 Summary and discussion 12
3.1 DGF Venture activities 12
3.1.1 Direct venture activities 13
3.1.2 Indirect venture activities 13
3.1.3 Selected issues 13
3.2 DGF Loan and guarantee activities 15
3.2.1 Selected issues 16
3.3 Relevance, Efficiency, Effect and Impact 17
3.3.1 Relevance 17
3.3.2 Efficiency 21
3.3.3 Effectiveness and impact 24
3.4 About this report 27
4 Introduction 28
4.1 The Danish Growth Fund (DGF) 28
4.1.1 Objective of DGF 28
4.1.2 DGF’s objective to mitigate market failure and increase socioeconomic returns 29
4.1.3 Addressing market failures 29
4.1.4 Different models and contextual structures 29
4.2 Structure 30
4.3 Similar international institutions for comparison of DGF activities 30
5 DGF’s venture activities 32
5.0 Introducing VC as a Policy Activity 32
5.0.1 Definitions and Importance of Venture Capital and Private Equity Terms 32
5.1 Ten indicators of ‘good practice’ in a public-private ‘hybrid’ VC fund 37
5.2 The Evaluation of Publicly-supported VC Activity 50
5.3 Changes in DGF’s VC Activities 51
5.4 DGF’s Equity Investment Activities 52
5.4.1 Different modes, different platforms 52
5.5 DGF’s activities in an international context 61
5.5.1 Reference countries and programmes 61
5.5.2 EVCA and DGF statistics by key criteria 62
5.7 Five questions of policy relevance 71
5.7.1 Have DGF’s activities advanced the development of the Danish VC market? 71
5.7.2 Are pari passu investment terms the optimal structure? 72
5.7.3 Should governments engage in ‘direct’ venture capital investment activity? 74
5.7.4 Should DGF continue to have a direct VC activity? 77
Contents
EVALUATION OF THE DANISH GROWTH FUND | DAMVAD.COM 5
5.7.5 Do DGF’s activities encourage private VC activity? 79
5.8 The scarcity of ‘Business Angels’ 80
5.9 DGF as a convenient government ‘platform’ – comparisons to CfEB 83
6 DGF loan and guarantee activities 86
6.1 Quantitative analysis 86
6.1.1 Growth guarantees 87
6.1.2 Get-started-loans 92
6.2 International benchmark 96
6.2.1 Loan and guarantee schemes in the UK and Denmark 96
6.2.2 Comparison of companies in schemes 97
6.2.3 Survival rate of UK companies that received loan guarantees 100
6.3 European comparison of guarantee Schemes 101
6.3.1 The nature and scale of guarantee schemes 101
6.3.2 Narrow or broad economic remit? 102
6.3.3 Scheme administration 102
6.3.4 Risk assessment 103
6.3.5 Scheme restrictions and eligibility 103
6.3.6 Scheme terms 104
6.3.7 Additionality of lending 104
6.3.8 Default 104
6.3.9 Who accesses guarantees? 104
6.3.10 Summary 105
6.3.11 Guarantees as a response to economic crisis 106
6.3.12 Learning from the UK guarantee schemes development 106
6.4 Guarantee schemes and the Danish context 111
6.4.1 Comparative scheme costs 114
6.4.2 Selected issues on loan and guarantees 115
7 Literature/references 122
8 Glossary 127
9 Appendix 129
9.0 Appendix A: Interviews 129
9.1 Appendix B: Interview respondents, VC 130
9.2 Appendix C: Interview respondents, loans and guarantees 131
9.3 Appendix D: Institutions for benchmarking 132
9.4 Appendix E: Survey 137
6 EVALUATION OF THE DANISH GROWTH FUND | DAMVAD.COM
With this report, DAMVAD, professor Gordon Mur-
ray (UK) and professor Marc Cowling (UK) evaluate
the activities of the Danish Growth Fund (DGF) from
2010 to 2012 on behalf of the Danish Ministry of
Business and Growth.
The evaluation seeks to address the objective of
DGF to mitigate market failure and create socio-
economic return in light of the development of DGF
over time and international experience in this field.
DGF is a public investment fund that aims to make
a significant contribution to innovation and eco-
nomic growth by co-financing the genesis, growth
and development of small and medium sized enter-
prises (SMEs) with high-growth potential. By provid-
ing loans and loan guarantees, DGF aims to allevi-
ate financial constraints on promising entrepreneurs
and SMEs which lack sufficient collateral and/or the
track record to obtain a bank loan on normal market
terms. Additionally, by developing the scale and
professionalism of the early-stage venture capital
(VC) market, including the related ‘entrepreneurial
ecosystem’, DGF seeks to increase the availability
of risk capital to innovative entrepreneurs and SMEs
in need of additional sources of external equity to
develop and grow their businesses.
This evaluation of DGF takes into account that the
debt and equity-related activities of DGF are funda-
mentally different and therefore need to be ap-
praised separately.
Relevance
The conclusion of the evaluation is that DGF is a
relevant public financial institution. Public interven-
tion through DGF in equity and credit markets can
be explained by the existence of market imperfec-
tions. DGF’s equity and debt products are designed
to minimise market failures and deadweight loss
from public intervention. As such DGF is highly rel-
evant.
In the case of the venture activities, the evaluation
shows that DGF s investments attracts additional in-
vestments, which would not otherwise have been
made and there is no sign of DGFs investment
crowding out private investments. Furthermore,
DGF has supported capacity building among Dan-
ish fund managers and the development of a sus-
tainable VC ecosystem, which could ultimately be-
come self-sustaining. Through indirect investments,
DGF supports both the development of SMEs and
the development of a healthy Danish VC ecosys-
tem. DGF’s indirect investments through funds and
fund-of-funds (FoF) have helped to attract private
investors to the funds and subsequently to develop
essential expertise on the various management
teams.
However, DGF’s management needs to provide a
convincing argument to explain why DGF should
continue to engage in direct VC activity. It is difficult
to see how the small number (six) of annual invest-
ments and the total size of DGF Venture’s portfolio
(approximately 40 companies) have a material influ-
ence consistent with the policy and strategic goals
of DGF. Additionally, the limited number of invest-
ments and their cross-sectorial focus appear to be
an obstacle to building and maintaining the relevant
and necessary expertise in DGF’s secretariat.
Turning to the loan and guarantee activities of
DGF, it is the conclusion of this evaluation that,
given the premium attached to the price of DGF’s
loans and guarantees, and the fact that there is de-
mand for these in the market shows that DGF is rel-
evant. This is particularly true in relation to the new
growth loans in which there is no loss limits. The
loan and guarantee activities include mechanisms
designed to minimise market imperfections and
avoid crowding out private investments.
1 Executive summary
EVALUATION OF THE DANISH GROWTH FUND | DAMVAD.COM 7
Efficiency
DGF’s operational costs are in line with the “market”
and DGF operates efficiently. The evaluation shows
that despite the differences in costs between com-
parable international public financial institutions, it is
assessed that DGF’s costs – when compared to the
level of costs in terms of wage levels, financing ac-
tivities and the book value of the assets under man-
agement – are at the level where they are expected
to be relative to the other institutions. This applies
both to DGF’s investment activities and to DGF’s
loan and guarantee activities.
However, it is extremely difficult to estimate the
costs related to value created (efficiency) from on-
going investment activities. The net value created is
apparent only when there is an exit. At this point, the
market puts a price on the company/project. Only
then is it possible to calculate total investments vs
the value created (sale price) and thus determine
the net value creation. The implication of this is that
efficiency is measured as costs relative to others
and not relative to net value creation.
Effect and Impact
DGF has had a positive effect on SMEs’ access to
both equity and debt financing.
The Danish VC-market has developed positively
and in line with the objective of DGF. This is espe-
cially the case in relation to its indirect investments,
which has supported this process.
The loan and guarantee products have also had a
positive effect. There is demand for the products
and they are widely distributed throughout Den-
mark. Loan products are demand-driven and not
target specific sectors. Finally, it is encouraging that
the instruments used as a contra cyclical policy in-
strument.
In the case of VC-investments, the evaluation
shows that DGF has contributed to the development
of the Danish VC market. In particular, the in-
creased focus on investments through FoF struc-
tures supports the professionalisation and develop-
ment of the Danish VC ecosystem. This is sup-
ported by the interviews conducted as part of the
evaluation. Several respondents consider it benefi-
cial when DGF invests in a fund, since DGF’s pres-
ence can help to attract private investors. As such,
DGF has had and continues to have a positive effect
on the development of potential high-growth com-
panies. Furthermore, DGF is perceived in the mar-
ket as a cornerstone investor, meaning that DGFs
investments attract private investments that would
not otherwise have been made.
In the case of loans and guarantees, DGF’s loan
guarantee scheme serves as a contra-cyclical busi-
ness-policy instrument and during the recent crisis
functioned as such by securing companies’ access
to financing. Furthermore, the DGF loan guarantee
scheme is widely distributed throughout Denmark
and there has been no specific sectorial focus in the
scheme. In 2011, the growth guarantee was equally
distributed between sectors. This illustrates that
DGF does not focus on specific sectors or geo-
graphical areas when administering the scheme.
This is an important conclusion, since too narrow a
scope would move DGF away from its justification
that is that DGF through its activities minimize mar-
ket failures. Furthermore, unlike VC investments,
the loan guarantee scheme does not require the
same specialisation and thus it can be used much
more widely as an instrument to help SMEs grow. It
is advisable to have the demand for loans drive the
scheme and not target it on a specific sector. This
gives broader access to the loans and ensures that
more firms have the opportunity to access these
loans.
8 EVALUATION OF THE DANISH GROWTH FUND | DAMVAD.COM
Impact in the sense of the broad economic impact
of DGFs activities must be measured by the results
of DGFs activities. The Danish VC-market has de-
veloped positively, but it remains, to be seen if there
can be generated a reasonable rate of return and if
the VC market becomes self-sustaining. However,
as with efficiency, it is difficult to measure the impact
of DGF’s VC-activities as long as the investments
are ongoing.
With respect to the loan and guarantee activities, it
is not possible to demonstrate that there are addi-
tional jobs created because of DGF activities. Simi-
lar businesses without government intervention are
performing equally to the Danish businesses. How-
ever, it is not clear whether companies who get
loans or guarantees through DGF should actually
should perform better. Companies that require gov-
ernment backed loans or guarantees do so, be-
cause market based financial institutions estimates
that they are more likely to fail than others are. How-
ever, the fact that the companies get access to fi-
nancing in itself should improve their position com-
pared to companies that do not get either private or
public financial support.
However compared with other countries the survival
of Danish businesses who gets access to govern-
ment loan and guarantee products is higher.
EVALUATION OF THE DANISH GROWTH FUND | DAMVAD.COM 9
Med denne rapport evaluerer DAMVAD, professor
Gordon Murray (UK) og professor Marc Cowling
(UK) aktiviteterne i Vækstfonden (VF) fra 2010 til
2012 på vegne af Erhvervs- og Vækstministeriet.
I lyset af VFs udvikling over tid og de internationale
erfaringer på dette område, adresserer evaluerin-
gen VFs målsætning, om at afbøde markedsfejl og
skabe et samfundsøkonomisk afkast.
VF er en offentlig investeringsfond, som har til for-
mål at yde et betydeligt bidrag til innovation og øko-
nomisk vækst ved, at medfinansiere tilblivelsen,
væksten og udviklingen af små- og mellemstore
virksomheder (SMVer) med stort vækstpotentiale.
Ved at stille lån og lånegarantier til rådighed søger
VF at afhjælpe de økonomiske begrænsninger, som
lovende iværksættere og SMVer møder, hvis de
ikke i tilstrækkelig grad er i stand til, at stille sikker-
hed og/eller ikke har eksisteret længe nok til at få et
banklån på normale markedsvilkår. Desuden forsø-
ger VF at udvikle og professionalisere det danske
marked for risikovillig kapital med fokus på de tidlige
stadier i virksomheders udvikling, for derigennem,
at øge tilgængeligheden af risikovillig kapital for in-
novative iværksættere og SMVer, der har brug for
ekstern egenkapital for, at virksomheden kan ud-
vikle sig og vokse. Herunder er der fokus på opbyg-
ningen af ’iværksætter økosystemet’.
Denne evaluering af VF tager højde for, at VFs ak-
tiviteter i relation til henholdsvis egenkapital- og kre-
ditmarkederne er fundamentalt forskellige, og derfor
må vurderes hver for sig.
Relevans
En af konklusionerne af evalueringen er, at VF er en
relevant offentlig finansiel institution. Offentlig inter-
vention i egenkapital- og kreditmarkederne kan for-
klares på baggrund af tilstedeværelsen af markeds-
fejl. VFs produkter er designet til at minimerer disse
markedsfejl og et potentielt dødvægtstab fra den of-
fentlige intervention. Som sådan, er VF yderst rele-
vant.
Hvor der er tale om aktiviteter i relation til risiko-
villig kapital, viser evalueringen, at VF s investerin-
ger tiltrækker yderligere investeringer, som eller
ikke ville være blevet foretaget, og der er ikke nogle
tegn på, at VFs investeringer fortrænger private in-
vesteringer. Ydermere understøtter VFs aktiviteter
kompetenceopbygningen hos danske ”fundmana-
gers” og udviklingen af et bæredygtigt økosystem
for risikovillig kapital, så dette på sigt kan blive selv-
bærende. Gennem indirekte investeringer støtter
VF både udviklingen af SMVer og udviklingen af et
sundt dansk økosystem for risikovillig kapital. VFs
indirekte investeringer gennem fonde og ”fund-of-
funds” har hjulpet med til at tiltrække private inve-
storer til fondene og efterfølgende til at udvikle den
nødvendige ekspertise i de forskellige ”manage-
ment”-teams.
Imidlertid bør VFs ledelse argumenterer overbevi-
sende for, hvorfor VF fortsat bør engagere sig i di-
rekte investeringsaktiviteter. Det er vanskeligt at se
hvordan det lille antal (seks) årlige investeringer og
den samlede størrelse af VFs portefølje af venture-
investeringer (cirka 40 virksomheder) skulle have
en væsentlig indflydelse, der stemmer overens med
VFs politik og strategiske mål. Desuden synes det
begrænsede antal investeringer og deres fokus på
tværs af sektorerne, at udgøre en hindring for at op-
bygge og fastholde den relevante og nødvendige
ekspertise i VFs sekretariat.
Ser man på VFs udlåns- og garantiaktiviteter, er
det denne evaluerings konklusion, at selv når man
tager den overpris i betragtning, der følger med VFs
udlån og garantier, så viser det, at der er efterspørg-
sel efter dem på markedet, at VF er relevant i denne
henseende. Dette er især tilfældet i relation til de
2 Executive summary DK
10 EVALUATION OF THE DANISH GROWTH FUND | DAMVAD.COM
nye Vækstlån, som ikke er omfattet af en tabs-
ramme. Låne- og garantiaktiviteterne indeholder
mekanismer, som har til formål at imødekomme
markedsfejl og undgå at der sker en fortrængning af
private investeringer.
Effektivitet
Evalueringen viser, at på trods af forskellene i om-
kostninger mellem sammenlignelige, internationale,
offentlige, finansielle institutioner, vurderes det, at
VFs omkostninger – når man sammenligner ni-
veauet af omkostningerne ud fra lønniveauer, finan-
sieringsaktiviteter og regnskabsværdien af de akti-
ver, der forvaltes – er på det niveau, de må forven-
tes at være på, i forhold til andre institutioner. Dette
gælder både VFs investeringsaktiviteter og VFs ud-
låns- og garantiaktiviteter. Dette understøtter kon-
klusionen, som går ud på at VFs driftsomkostninger
er på linje med ”markedet”. Vækstfonden drives
som sådan effektivt.
Imidlertid er det uhyre vanskeligt at anslå omkost-
ningerne i forhold til den skabte værdi (effektivitet)
fra de løbende investeringsaktiviteter. Den skabte
nettoværdi kan reelt kun opgøres, når der er foreta-
get en ”exit”. På det tidspunkt har markedet prissat
virksomheden/projektet, og først da er det muligt at
beregne de samlede investeringer sat over for den
skabte værdi (salgsprisen), hvorved man kan fast-
slå nettoværdiskabelsen. Dette betyder, at effektivi-
tet måles som omkostningsniveau i forhold til andre
lignende institutioner og ikke i forhold til den faktiske
nettoværdiskabelse.
Effekt og indvirkning
VF har haft en positiv effekt på SMVernes adgang
til både egenkapital- og lånefinansiering.
Det danske venturemarked har udviklet sig positivt
og i overensstemmelse med VFs formål. Det er sær-
ligt tilfældet i relation til de indirekte investeringer,
som har understøttet denne proces.
Låne- og garantiprodukterne har også haft en posi-
tiv effekt. Der er efterspørgsel efter produkterne, og
de bredt distribueret over hele Danmark. Lånepro-
dukterne er efterspørgselsdrevet og ikke målrette
specifikke sektorer. Endelig er det positivt, at disse
produkter anvendes som et konjunkturudlignende
erhvervspolitisk redskab.
I relation til risikovillig kapital, viser evalueringen,
at VF har bidraget til udviklingen af det danske mar-
ked for risikovillig kapital. Især understøtter det
øgede fokus på investeringer gennem fonde-af-
fonde professionaliseringen og udviklingen af det
danske økosystem for risikovillig kapital. Dette støt-
tes også af de interviews, der er gennemført som en
del af evalueringen. Flere respondenter anser det
for nyttigt, når VF investerer i en fond, da VFs tilste-
deværelse kan hjælpe med til, at tiltrække private
investorer. Dermed har VF og fortsætter som sådan
med at have en positiv virkning på udviklingen af
mulige højvækst-virksomheder. Desuden opfattes
VF af markedet som værende ”Cornerstone”-inve-
stor. Dvs. at deres investeringer tiltrækker private
investeringer, der ellers ikke ville være blevet fore-
taget.
I relation til VFs låne- og garantiprodukter, viser
evalueringen, at produkterne har fungeret som et
erhvervspolitisk instrument til at modvirke konjunk-
turerne, og ordningen har i den nylige krise tjent
som sådan ved, at sikre virksomheders adgang til
finansiering. Desuden er VFs lånegarantiordning
udbredt i hele Danmark, og der har ikke være et
sektorspecifikt fokus i ordningen. I 2011 blev vækst-
garantierne ligeligt fordelt mellem sektorerne. Dette
viser, at VF ikke fokuserer på specifikke sektorer el-
EVALUATION OF THE DANISH GROWTH FUND | DAMVAD.COM 11
ler geografiske områder i forvaltningen af ordnin-
gen. Dette er en vigtig konklusion, da et for snævert
anvendelsesområde ville mindske ordningens virk-
ning. Desuden kræver lånegarantiordningen – mod-
sat investeringer i form af risikovillig kapital – ikke
samme specialisering, og kan dermed anvendes
meget bredere som et instrument til at hjælpe
SMVer med at vokse. Det er tilrådeligt, at det skal
være efterspørgslen efter lån, der driver ordningen,
og ikke et sigte efter en bestemt sektor. Dette giver
bredere adgang til lånene og sikrer, at flere firmaer
har mulighed for at få adgang til disse lån.
Virkning forstået som de brede økonomiske konse-
kvenser af VFs aktiviteter, skal måles på resulta-
terne af VFs aktiviteter. Det danske marked for risi-
kovillig kapital har udviklet sig positivt, men det er
stadig uklart, om der kan genereres en rimelig for-
rentning af investeringerne og om marked for risiko-
villig kapital bliver selvbærende. Som med effektivi-
tet, er det imidlertid vanskeligt at måle effekten af
VFs ventureaktiviteter, så længe investeringerne er
i gang.
I relation til låne- og garantiaktiviteterne, er det ikke
muligt at påvise, at der skabes yderligere jobs, på
grund af VFs aktiviteter. Virksomheder hvor staten
ikke intervenerer, klarer sig sammenligneligt med
de virksomheder hvor staten intervenerer via VF.
Det er dog ikke entydigt om virksomheder der får lån
eller garantier bør klare sig bedre eller dårligere.
Virksomheder der benytter sig af offentligt støttede
låne- og garantiordninger, gør det fordi de markeds-
baserede finansielle institutter vurdere, at de er min-
dre kreditværdige end andre og derfor ikke vil stille
finansiering til rådighed. Dog vil det forhold, at virk-
somhederne får adgang til finansiering, i sig selv for-
bedre deres position, sammenlignet med virksom-
heder der ikke har adgang til hverken privat eller of-
fentlig finansiering.
Men sammenlignet med andre lande er overlevel-
sesraten i Danmark højere når man ser på virksom-
heder, der får adgang til statslige låne- og garanti-
produkter.
12 EVALUATION OF THE DANISH GROWTH FUND | DAMVAD.COM
With this report, DAMVAD, professor Gordon Mur-
ray (UK) and professor Marc Cowling (UK) evaluate
the activities of The Danish Growth Fund (DGF)
from 2010 to 2012 on behalf of the Danish Ministry
for Business and Growth.
The evaluation seeks to address the objective of
DGF to mitigate market failure and create socio-
economic return in light of the development of DGF
over time and international experience in this field.
The primary challenge in the design of public inter-
vention in the financial ecosystem is to establish a
system where the public activities on the one hand
maximise the socio-economic return and on the
other do not crowd out private investments thereby
reducing the efficiency and effectiveness of the mar-
kets for entrepreneurial finance.
In this respect, DGF is a legitimate public financial
institution that aims to make a significant contribu-
tion to innovation and economic growth by co-fi-
nancing the genesis, growth and development of a
greater supply of SMEs into the Danish economy,
while promoting the development of a sustainable
financial ecosystem.
This evaluation of DGF takes into account that the
debt and equity-related activities of DGF are funda-
mentally different and therefore need to be ap-
praised separately. A distinction is therefore made
in the evaluation of DGF between venture activities,
and loan and guarantee activities. For the most part
they will be treated separately.
3.1 DGF Venture activities
Venture capital (VC) is equity finance provided by
external investors to high-potential but high risk,
start-up and early-stage companies. Public inter-
vention in the venture capital market is used as a
policy instrument for promoting high growth and par-
ticularly innovative enterprises. The creation of a
successful venture-capital industry has almost uni-
versal appeal to governments across both the de-
veloped and developing world.
The majority of early-stage venture activity has fre-
quently resulted in very poor economic returns for a
majority of early-stage VC investors. In turn this has
resulted in a general trend since the early 2000s
with many institutional investors moving away from
significant involvement in the early-stage venture
capital market. Governments have started to realise
that a flourishing, long-term venture capital industry
requires a range of supporting infrastructure re-
sources including a material public commitment
(Wilson and Silva, 2013). Accordingly, there has
arisen a growing government focus on developing
‘entrepreneurial eco-systems’ and building up re-
lated capacities.
DGF’s venture activities can be divided into direct
and indirect investment activities.
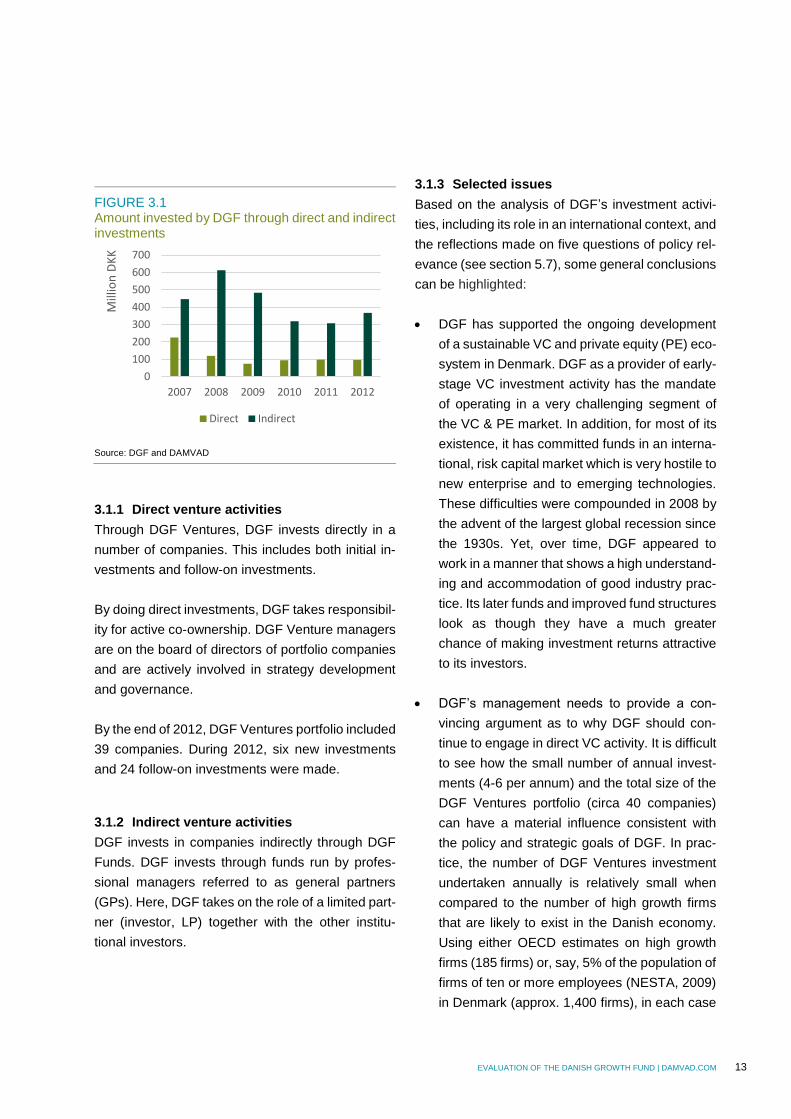
Since 2008, the amount invested by DGF through
direct investments has been relatively stable, while
the amount invested through indirect investments
has been more volatile, see Figure 3.1. This indi-
cates that for DGF to be able to do indirect invest-
ments, there must be private commitments as well.
Due to capital constraints, this was probably more
difficult to get in 2009–2011, but recent develop-
ments seem to suggest that private investors are re-
turning to the market.
3 Summary and discussion
EVALUATION OF THE DANISH GROWTH FUND | DAMVAD.COM 13
FIGURE 3.1 Amount invested by DGF through direct and indirect investments
Source: DGF and DAMVAD
3.1.1 Direct venture activities
Through DGF Ventures, DGF invests directly in a
number of companies. This includes both initial in-
vestments and follow-on investments.
By doing direct investments, DGF takes responsibil-
ity for active co-ownership. DGF Venture managers
are on the board of directors of portfolio companies
and are actively involved in strategy development
and governance.
By the end of 2012, DGF Ventures portfolio included
39 companies. During 2012, six new investments
and 24 follow-on investments were made.
3.1.2 Indirect venture activities
DGF invests in companies indirectly through DGF
Funds. DGF invests through funds run by profes-
sional managers referred to as general partners
(GPs). Here, DGF takes on the role of a limited part-
ner (investor, LP) together with the other institu-
tional investors.
3.1.3 Selected issues
Based on the analysis of DGF’s investment activi-
ties, including its role in an international context, and
the reflections made on five questions of policy rel-
evance (see section 5.7), some general conclusions
can be highlighted:
DGF has supported the ongoing development
of a sustainable VC and private equity (PE) eco-
system in Denmark. DGF as a provider of early-
stage VC investment activity has the mandate
of operating in a very challenging segment of
the VC & PE market. In addition, for most of its
existence, it has committed funds in an interna-
tional, risk capital market which is very hostile to
new enterprise and to emerging technologies.
These difficulties were compounded in 2008 by
the advent of the largest global recession since
the 1930s. Yet, over time, DGF appeared to
work in a manner that shows a high understand-
ing and accommodation of good industry prac-
tice. Its later funds and improved fund structures
look as though they have a much greater
chance of making investment returns attractive
to its investors.
DGF’s management needs to provide a con-
vincing argument as to why DGF should con-
tinue to engage in direct VC activity. It is difficult
to see how the small number of annual invest-
ments (4-6 per annum) and the total size of the
DGF Ventures portfolio (circa 40 companies)
can have a material influence consistent with
the policy and strategic goals of DGF. In prac-
tice, the number of DGF Ventures investment
undertaken annually is relatively small when
compared to the number of high growth firms
that are likely to exist in the Danish economy.
Using either OECD estimates on high growth
firms (185 firms) or, say, 5% of the population of
firms of ten or more employees (NESTA, 2009)
in Denmark (approx. 1,400 firms), in each case
0
100
200
300
400
500
600
700
2007 2008 2009 2010 2011 2012
Mill
ion
DK
K
Direct Indirect
14 EVALUATION OF THE DANISH GROWTH FUND | DAMVAD.COM
reduced five or tenfold by a further factor to
acknowledge that a majority of firms will not
wish to seek VC finance, we are likely to arrive
at rough estimates between 18 and 280 firms
that may wish to use VC finance. The former
figure is too low in practice to support a credible
and sustainable VC programme. Any major in-
crease in direct investment activity would have
to be compared to the alternatives of creating
new independently managed funds or enlarging
the existing indirect funds supported by DGF. A
further move from direct to indirect investments
would be in line with the international trend of
government funds shifting focus from direct to
indirect investments. However particularly the
Nordic countries (Finland, Norway and Sweden)
seem to continue doing direct investments and
compared to these DGFs share of investments
that are done as direct investments are rela-
tively small. This however is not in itself an ar-
gument that DGF should continue to undertake
direct investments. A number of peer funds in
these countries have an explicit regional sup-
port objective, which is typically not a focus of
interest to the most successful commercial
GPs. If the argument for maintaining direct in-
vestment activities is that DGF engages in di-
rect investment activities in order to mitigate the
consequences of Denmark not having sufficient
government supported Business Angel (BA) ac-
tivities, then it could be argued that it would be
advantageous to revisit DGFs strategy in order
to accommodate this focus. Direct government
investing is not a substitute for a well developed
BA market.
The facility to do both pari passu and asymmet-
ric incentives increases the flexibility of the gov-
ernment VC provider. It also allows the govern-
ment to experiment, a facility less available to
the private sector. Thus whether pari passu in-
vestment terms are the optimal investment
structure for governments depends on the na-
ture of the specific investment, and its objective.
However, pari passu investment activities have
an inherent sunset clause, because when the
market failure they address is no longer pre-
sent, the demand for government investments
will be automatically reduced.
Denmark is too small to have a fully diversified
VC industry. Its future will be linked to the nur-
turing of excellent young growth companies and
the finding of good international partners. The
maintaining of credibility and status of DGF is
important in this nurturing of international net-
works and clusters. This will enable Danish
companies and Danish funds to better access
international specialised VC financing.
Given that DGF cannot invest in companies lo-
cated outside Denmark, DGF must be careful
not to take disproportionately large shares of
funds, which in effect would prevent funds from
investing outside Denmark and developing in
line with the international market. The more
Denmark is international in its portfolio firm in-
vestments and receipts of LP funds, the more
credible is its VC industry. A viable Danish VC
industry cannot exclusively invest in Danish or
even Nordic originated businesses.
DGF has articulated its ambitions to be an ‘ev-
ergreen fund’. In simple terms this means that
the organisation seeks to generate sufficient
surplus from its successful investment activities
over time to become its own funder of continued
investment activity. This ambition was in part
held by Australia which ensured that a propor-
tion of investment surpluses after all costs was
ring-fenced for future IIF investment activity. In
the difficult times post 2008 during the global fi-
nancial crisis, these sequestered surpluses
EVALUATION OF THE DANISH GROWTH FUND | DAMVAD.COM 15
helped to finance a further round of the IIF pro-
gramme. However, to self-fund an activity which
is recognised as unattractive to professional in-
vestors, specifically because of the high risks
and low returns, is very challenging.
Based on numerous interviews and survey
data, there is no indication that the current VC
activities of DGF crowd out private investments.
On the contrary, the consensus among the rep-
resentatives of the VC environment and recipi-
ents of DGF financing is that DGF’s involvement
attracts additional private financing in the early
stages.
VC is necessary but not a sufficient factor for
the promotion of an innovative and entrepre-
neurial Denmark. Establishing a benign ecosys-
tem for its entrepreneurs is critical. Issues of in-
dustry/university linkages, supportive tax poli-
cies and the active promotion of an entrepre-
neurial culture among Danes remain key foun-
dations for supporting the supply of attractive
new businesses. Ultimately, for a successful VC
industry, access to world-class deal-flow
through a dense reciprocal network of opportu-
nities is crucial.
VC financing should be seen in a wider financial
context and be aligned accordingly. VC should
not be perceived as an independent policy in-
strument. VC is only one step on the financial
escalator. The term ‘financial escalator’ is
widely used to illustrate the desired policy out-
come of ‘joined up’ markets for capital for new
firms and small and medium-sized enterprises
(SMEs). The escalator is made up of various
sources of financing such as family loans,
Crowd-funding, business angels (equity) and
banks (debt).
3.2 DGF Loan and guarantee activities
By providing loans and guarantees, DGF aims to al-
leviate the credit constraints for entrepreneurs and
SMEs who lack sufficient collateral and/or record of
accomplishment to obtain a bank loan on normal
market terms due to market failures.
Thus, the aim of DGF must be to take higher risks
than normal banks or financiers are willing to, be-
cause the socioeconomic effects are considered
sufficiently high. Otherwise, the investments will or
should be made by private entities on market terms
alone.
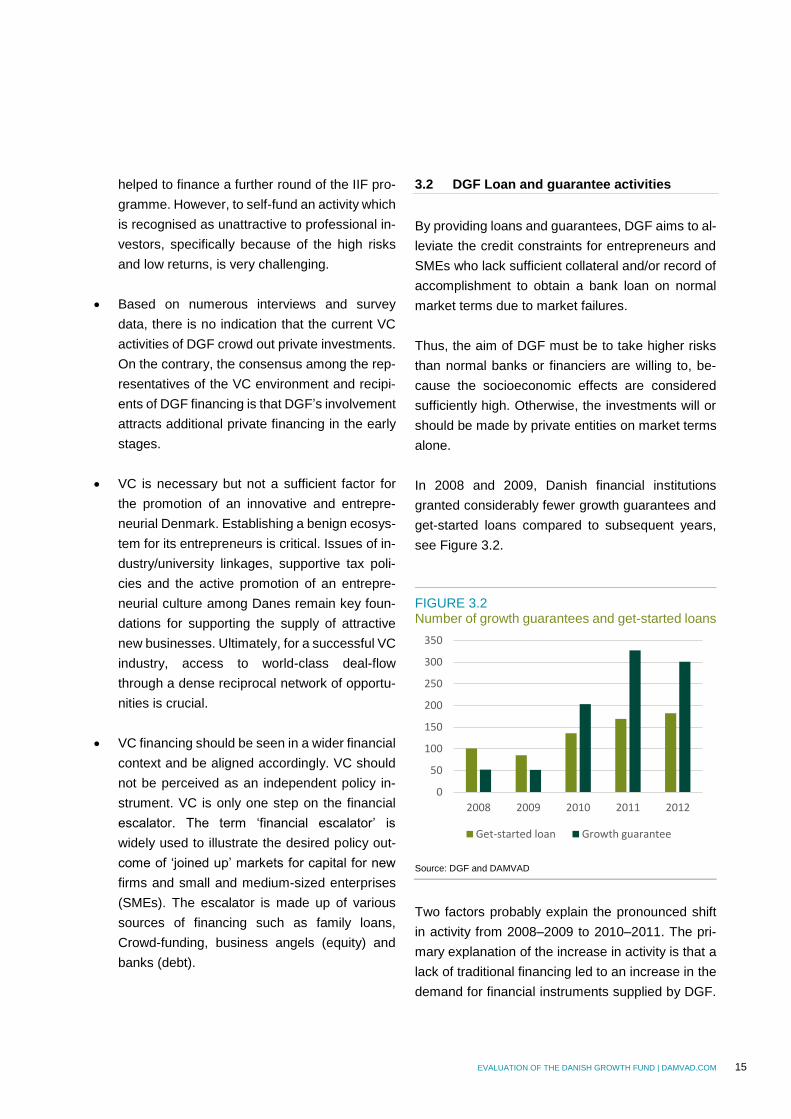
In 2008 and 2009, Danish financial institutions
granted considerably fewer growth guarantees and
get-started loans compared to subsequent years,
see Figure 3.2.
FIGURE 3.2 Number of growth guarantees and get-started loans
Source: DGF and DAMVAD
Two factors probably explain the pronounced shift
in activity from 2008–2009 to 2010–2011. The pri-
mary explanation of the increase in activity is that a
lack of traditional financing led to an increase in the
demand for financial instruments supplied by DGF.
0
50
100
150
200
250
300
350
2008 2009 2010 2011 2012
Get-started loan Growth guarantee
16 EVALUATION OF THE DANISH GROWTH FUND | DAMVAD.COM
From 2009 to 2010, the Danish Government raised
the lending capacity of DGF from DKK 100m to DKK
1.6bn. In addition, the get-started loan scheme was
expanded as part of the business package in 2010
and the credit package from 2011. The sharp in-
crease in guarantees and loans following these
packages underlines the demand for contra-cyclical
expansions of the schemes. This follows the lines
from the UK, the US, Canada and Japan, where the
schemes have been expanded to counteract the
lack of capital provided by private banks.
A secondary but none the less important reason for
the pronounced shift in activity is that the financial
crises led to increased insecurity and lower liquidity
in the loan market in general. This prompted the fi-
nancial institutions to limit the issuing of loans,
which in itself had a dampening effect on the supply
of growth guarantees and get-started loans.
Furthermore, information campaigns can be as-
sumed to have contributed to an increase in aware-
ness of the growth guarantee scheme among the
financial institutions in Denmark. In turn this could
have had a positive effect on demand.
3.2.1 Selected issues
Based on the analysis of DGF’s loan and guarantee
activities, the analysis of DGF’s activities in an inter-
national context and the reflections on four ques-
tions of policy relevance (see section 6.4), some
general conclusions can be highlighted:
The economic/financial literature tells us that
government loan guarantee schemes play an
important role in helping small firms to gain ac-
cess to financing from private financial institu-
tions. Direct financing from a government has
the challenge that the government lending firm
must do its own due diligence. This is very
costly and demands a high level of skill and ex-
perience from the staff. Furthermore it also
raises important issues around entrepreneurs’
perceptions of what direct government funding
is compared to a private bank loan in terms of
moral hazard (switching to riskier projects) and
the requirement to repay. Equally, the direct in-
vestment model raises political questions con-
cerning whether the government is prepared to
take legal action against its own citizens in the
event of default. However, direct financing can
have a positive effect on small firms, especially
in periods of credit crunch. It does not rely on
private banks’ willingness to provide capital and
is therefore a useful instrument in times of credit
restraint from banks. Additionally, DGF’s
schemes only guarantee up to 75% of the loan
amount under DKK 10m, 65% of the loan
amount between DKK 10-25m. This should re-
duce the incentive for banks and firms to take
too high a risk, thus avoiding moral hazard prob-
lems.
The academic literature is broadly supportive of
the use of financial engineering instruments to
correct for (a lack of) collateral issues in debt
markets and the lack of a “track record”. Loan
guarantee schemes have the advantage of be-
ing simple to design and administer and typi-
cally require that investment appraisal is con-
ducted on a commercial basis, thus minimising
deadweight loss. Instruments of this type are
most effective when the entrepreneurial popula-
tion and talent are more widely distributed than
the wealth throughout the general population.
This gives loan guarantee schemes the poten-
tial to have disproportionately high and positive
effects in countries and regions where (a) col-
lateral based lending is the norm, and (b) a sig-
nificant proportion of the entrepreneurial popu-
lation is not rich in assets.
EVALUATION OF THE DANISH GROWTH FUND | DAMVAD.COM 17
DGF has conducted its own due diligence since
2003 due to high losses prior to 2003. This has
proven very efficient and led to a high level of
competency among the staff when evaluating
the potential risk on loans. This is not in line with
the economic literature, but shows that there
may be differences between theory and prac-
tice. The default rate of the growth guarantee
loans has been very low (5.6%) compared to
the UK SFLG scheme1 (17%), the UK EFG
scheme2 (8%) and the Canadian Small Busi-
ness Finance Program (10%). Thus it seems
that the decision to do due diligence in-house
proved very successful. Though this principle of
conducting in-house risk assessment has made
DGF’s administrative costs very high compared
to other schemes that let the banks do the risk
assessment, it has the advantage of minimising
costs related to defaults, thus stretching the
public funding made available for the scheme
further to benefit more firms.
The pricing and coverage of DGF’s loan guar-
antee scheme seems to be reasonably priced
and follows the international standard of cover-
age. Most schemes in the developed countries
with a 70–80% guarantee and 2–3% interest
premium. Evidence from the UK Enterprise Fi-
nance Guarantee evaluation suggests that
firms are sensitive to interest rate margins
above 5% over base which represents an effec-
tive price ceiling for guaranteed loans. Above
this 5% ceiling, 85% of total issued loans would
not have been taken up by the SMEs who re-
ceived them. The DGF scheme follows these
general guidelines with guarantees of 75% and
a premium of 3% when the loan is obtained on
get started loans. For growth guarantees, the 1 The Small Firms Loan Guarantee (SFLG) scheme guarantee from gov-ernment helping small firms lacking security to access loans from banks and other lenders.
premium is typically 2% when the loan is op-
tioned and 1.25% a year. The premium reflects
that the DGF is a subordinate lender and as
such carries a higher risk.
The companies in the growth guarantee
scheme have a higher survival rate compared
to both similar Danish companies, and the Brit-
ish EFG and SFLG schemes. The companies in
the get-started-loan scheme have close to the
same survival rate as similar Danish compa-
nies, with the exception of the 2007 treatment
year, and the companies in the two British
schemes. Given that there are no loss limits,
this indicates that the loan and guarantee
schemes are well managed.
3.3 Relevance, Efficiency, Effect and Impact
3.3.1 Relevance
The relevance of the DGF is assessed by its justifi-
cation due to market failures, its ability to address
these failures, and its role as a business cycle in-
strument and cornerstone investor.
Existence of market imperfections
The relevance of DGF is most importantly a ques-
tion of whether we can explain and justify public in-
tervention in equity and credit markets on the
grounds of economic theory on market imperfec-
tions. It is widely accepted that imperfections in loan
markets exist. The most common imperfections/fail-
ures are:
Credit rationing
Information asymmetry
Lack of experience among fund managers
2 The Enterprise Finance Guarantee (EFG) is a UK loan guarantee scheme to encourage additional lending to viable small and medium-sized enterprises.
18 EVALUATION OF THE DANISH GROWTH FUND | DAMVAD.COM
In the Innovation Union Scoreboard 2013 (Euro-
pean Commission 2013), Denmark is classified as
an ‘innovation leader’. However, the linkage be-
tween research and the creation of marketable
products from such research is cited as a weak point
in relation to Denmark’s direct competitors (Euro-
pean Commission 2012a, 2012b, 2013; OECD
2014b). This apparent gap between research activ-
ities and marketable products can be seen as an in-
dication of a market failure and as such supports the
relevance of DGF’s activities.
DGF’s activities address market failures
The relevance of DGF is furthermore a question of
whether DGF actually designed its products for eq-
uity investments and loans and guarantees in a
manner to minimise market failures and dead-
weight loss from public intervention.
In the case of the venture activities, DGF demon-
strates a very clear understanding and use of
aligned incentives in the employment of agents as
general partners and investors. Its commitment to
using a pari passu investment model is encouraging
as it represents a lesser level of influence on or in-
terference with the market. However, its commit-
ment is pragmatic. The use of 75% loan guarantees
to institutional investors and the asymmetry of risk
with syndicated loans show that the organisation is
willing to find appropriate asymmetric incentives
where necessary.
Through its indirect investments, DGF manages
to support both the development of SMEs and
the development of a healthy Danish VC eco-
system. DGF’s indirect investments through
funds and fund-of-funds has helped to attract 3 Percentages vary but a relatively strong consensus of research suggest that the number of fast growth businesses in the start-up populations is
private investors for the funds and subsequently
to develop competencies in the various man-
agement teams who manage the funds which
are supported by DGF. DGF thus supports both
capacity-building among Danish GPs and fund
managers and the development of a sustaina-
ble VC-ecosystem.
Given the limited life span of funds, there is an in-
herent exit strategy in investments through funds
and funds of funds. As seen with DGF’s investments
in Sunstone Capital’s first three funds, DGF’s com-
mitment is reduced for each new fund raised. Thus,
Sunstone will eventually prove to the market that
they are able and competent fund managers and
they will be able to raise new funds without DGF’s
commitment. Thus, DGF’s commitment is automat-
ically phased out.
As mentioned preciously, DGF’s management
needs to provide a convincing argument as to why
DGF should continue to engage in direct VC activ-
ity.The whole venture creation process within a suc-
cessful market economy is based on a large number
of individual entrepreneurial ‘experiments’ (i.e. busi-
ness start-ups). The vast majority of these invest-
ments will not make a material impact on the econ-
omy. These enterprises will not employ anyone, will
remain ‘sole-traders’ and their growth will be negli-
gible. A majority of such start-ups will not survive
five years.
However, a relatively small number of ‘outliers’ of
approx. 5%3 of all start-ups are likely to become at
some stage of their lives high growth firms and have
a significant impact on the economy’s future suc-
cess and direction. Thus, an efficient entrepreneur-
ial ecosystem is predicated on several potentially
around 4-6%. These firms are fast growth for a period of their lives and this is not a permanent state. See Cowling et al 2014.
EVALUATION OF THE DANISH GROWTH FUND | DAMVAD.COM 19
successful businesses gaining access to various
forms of risk capital. It is a ‘numbers game’ as we
have little evidence that venture capitalists or busi-
ness angels will spot winners easily from the mass
of new start-ups. For many professional investors in
young enterprises, an industry ‘rule of thumb’ sug-
gests that circa 20% of portfolio companies will gen-
erate 80% of net returns to the fund or investor.
Using either OECD estimates on high growth firms
(185 firms) or, say, 5% of the population of firms of
ten or more employees (NESTA, 2009) in Denmark
(approx. 1,400 firms), in each case reduced five or
tenfold by a further factor to acknowledge that a ma-
jority of firms will not wish to seek VC finance, we
are likely to arrive at rough estimates between 18
and 280 firms that may wish to use VC finance. The
former figure is too low in practice to support a cred-
ible and sustainable VC programme.
In 2012 DGF made direct initial investments into 6
new firms. As such, the impact on the market by
DGFs direct investments are arguably non substan-
tial even though DGFs direct investments amount to
a relatively large proportion of the total number of
Danish VC investments made each year. However,
this is not to say, that individual investments may
not be healthy and profitable.
Combined with the risk that DGF assumes in rela-
tion to these, it will arguably be more appropriate to
use these funds to support the creation of more spe-
cialised funds operating on market terms and man-
aged by focused professional fund managers. How-
ever, the fact that there are projects that do not get
funding entails a risk, but conversely, the increased
investment activity through funds will secure financ-
ing for other projects. It is unlikely that DGF through
its current direct investment activities is able to
cover the market not currently covered by private
funds.
Turning to the loan and guarantee activities of
DGF, these also include mechanisms designed to
minimise market imperfections and avoid the crowd-
ing out of private investments.
In the evaluation period, DGF provided growth guar-
antees and get-started loans to Danish companies.
In both cases, DGF provides guarantees to private
financial institutions that cover 75% of individual
loans up to DKK 10m, 65% on loans from DKK 10-
25m and the get-started loans also had a maximum
and 20% of loss coverage on the total portfolio in
the individual bank. Both DGF and private financial
institutions are obliged to conduct due diligence.
These requirements aim to assure that the lender is
exposed to the markets’ mechanisms and therefore
contributes to minimising imperfections. Further-
more, the fact that DGF only covers 75% of the in-
dividual loan also provides incentive to minimise risk
transfer from financial institution to DGF.
In the case of growth guarantees, DGF also re-
quires a premium of 1.25%. The premium covers
the additional risk taken by DGF but also provides
financial institutions the incentive to consider a loan
on regular market terms in the first place. The idea
is that the higher the interest rate of the loan, the
higher the probability that the lender will default,
leading the institution to lose money.
Finally, the growth guarantee scheme has been ex-
panded to include agriculture. Making the loan and
guarantee activities available to as many busi-
nesses as possible ensures that viable companies
are not excluded in favour of less viable companies
due to sector restrictions. In other words, deciding
whether a company should qualify for loan and
guarantee schemes should be based on objective
criteria on the company’s ability to create a success-
ful business and not whether the company operates
within a restricted business sector or segment. This
implies that aiming loan and guarantees schemes to
20 EVALUATION OF THE DANISH GROWTH FUND | DAMVAD.COM
specific sectors or business segments should also
in the future be avoided if the intention is to minimise
market failure.
Business cycle instrument
In nervous markets averse to risk, young high-po-
tential enterprises, particularly growing, innovative
or internationalising businesses are less likely to re-
ceive the levels of debt or equity finance they need.
In these circumstances, the support of entrepre-
neurial finance by government and its agencies is a
critical resource to sustain economic development.
Therefore, public loan guarantee schemes are rele-
vant as a counter cyclical instrument in periods of
financial crisis where banks are liquidity con-
strained.
In Denmark, loan and guarantee schemes were
used as a counter cyclical instrument in the wake of
the financial crises. In 2010, the Danish parliament
agreed a business package, which considerably ex-
panded the volume of both growth guarantees and
get-started loans. In 2011, the Danish Parliament
expanded the schemes further with the credit pack-
age.
Keeping in mind that the financial crisis was initiated
in September 2008, one could argue that counter
cyclical elements of loan and guarantee schemes
were employed rather late. However, this would be
an erroneous conclusion, since the schemes are
only a small part of the overall effort by the Danish
government to normalise financial markets and the
economy in general.
The use of public loan guarantee schemes as a
counter cyclical instrument also implies diminishing
the schemes in periods of boom. There is an inher-
ent exit clause in the Danish model, because the
Danish parliament needs to agree on the budget
frame for DGFs loan guarantee each year as part of
the agreement on the government budget. This is
what happened in 2010 when it was decided to ex-
pand the scheme and this is the reason for the new
scheme in the end of 2012. Thus the Danish model
has an inherent sunset clause that makes it possible
to use the loan guarantee scheme as a countercy-
clical instrument.
The new scheme from ultimo 2012 restructured the
entire guarantee scheme and all except small guar-
antees of less than DKK 2m where replaced by a
new loan type, the so-called growth loans. As op-
posed to the guarantee schemes, Growth loans are
non-subsidized, subordinated loans and prized with
an interest rate premium of typically 2-3 percentage
points compared to ordinary loans from bank. Thus
the structure of the loans imply that a company
would not wish to enter into a growth loan unless no
ordinary funding option is available.
Cornerstone investor
In a significant number of interviews conducted with
key stakeholders in the Danish VC industry, the in-
terview respondents have highlighted that DGF
plays an important role as “cornerstone investor”
and that DGF’s investments in the market help to
attract institutional and private investors and addi-
tional funding. DGF (government) intervention in the
market thus increases the available capital beyond
the capital DGF provides. This supports the fact that
there might be a more appropriate use of DGF funds
to fully focus its investment activities on indirect in-
vestments. However, a lack of capital in the market
was not mentioned during the interviews as a cur-
rent problem. But that is not to say that some start-
ups may not experience access to funding as being
challenging.
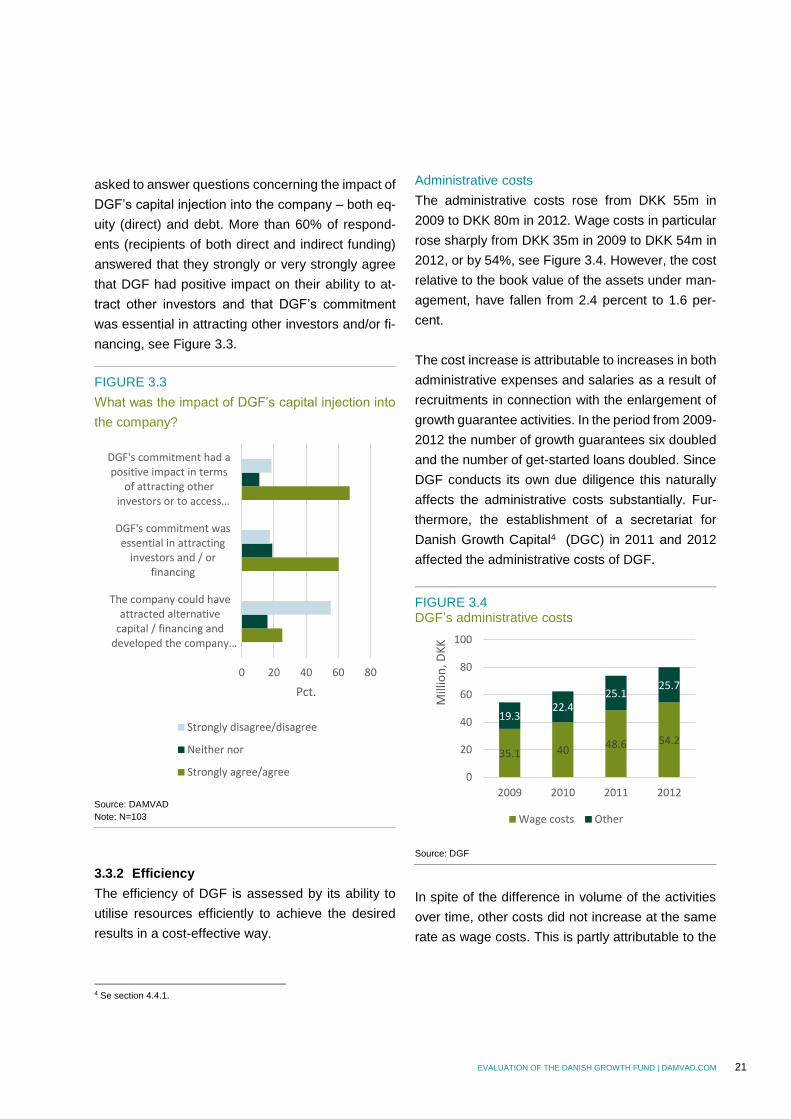
That DGF plays an important role as a “cornerstone”
investor is supported by the survey among recipi-
ents of financing from DGF that was done as part of
the evaluation. In the survey, the respondents were
EVALUATION OF THE DANISH GROWTH FUND | DAMVAD.COM 21
asked to answer questions concerning the impact of
DGF’s capital injection into the company – both eq-
uity (direct) and debt. More than 60% of respond-
ents (recipients of both direct and indirect funding)
answered that they strongly or very strongly agree
that DGF had positive impact on their ability to at-
tract other investors and that DGF’s commitment
was essential in attracting other investors and/or fi-
nancing, see Figure 3.3.
FIGURE 3.3
What was the impact of DGF’s capital injection into
the company?
Source: DAMVAD
Note: N=103
3.3.2 Efficiency
The efficiency of DGF is assessed by its ability to
utilise resources efficiently to achieve the desired
results in a cost-effective way.
4 Se section 4.4.1.
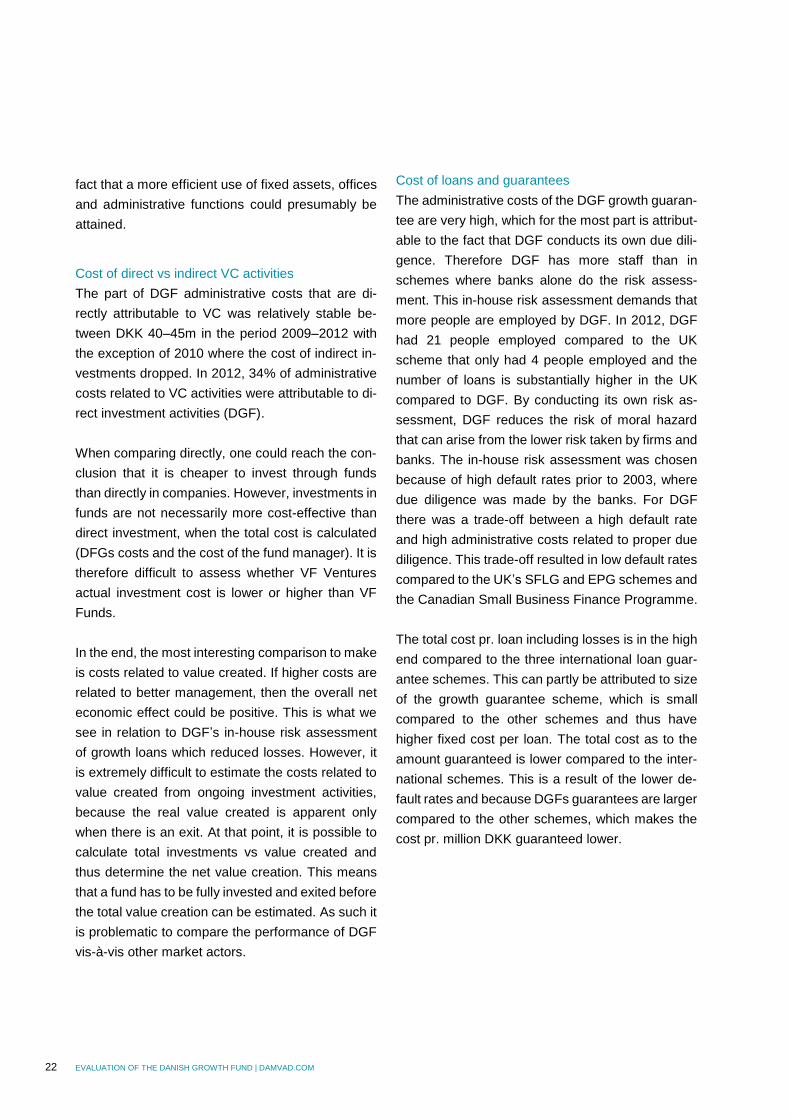
Administrative costs
The administrative costs rose from DKK 55m in
2009 to DKK 80m in 2012. Wage costs in particular
rose sharply from DKK 35m in 2009 to DKK 54m in
2012, or by 54%, see Figure 3.4. However, the cost
relative to the book value of the assets under man-
agement, have fallen from 2.4 percent to 1.6 per-
cent.
The cost increase is attributable to increases in both
administrative expenses and salaries as a result of
recruitments in connection with the enlargement of
growth guarantee activities. In the period from 2009-
2012 the number of growth guarantees six doubled
and the number of get-started loans doubled. Since
DGF conducts its own due diligence this naturally
affects the administrative costs substantially. Fur-
thermore, the establishment of a secretariat for
Danish Growth Capital4 (DGC) in 2011 and 2012
affected the administrative costs of DGF.
FIGURE 3.4 DGF’s administrative costs
Source: DGF
In spite of the difference in volume of the activities
over time, other costs did not increase at the same
rate as wage costs. This is partly attributable to the
0 20 40 60 80
The company could haveattracted alternative
capital / financing anddeveloped the company…
DGF's commitment wasessential in attracting
investors and / orfinancing
DGF's commitment had apositive impact in terms
of attracting otherinvestors or to access…
Pct.
Strongly disagree/disagree
Neither nor
Strongly agree/agree
35.1 40 48.6 54.2
19.322.4
25.125.7
0
20
40
60
80
100
2009 2010 2011 2012
Mill
ion
, DK
K
Wage costs Other
22 EVALUATION OF THE DANISH GROWTH FUND | DAMVAD.COM
fact that a more efficient use of fixed assets, offices
and administrative functions could presumably be
attained.
Cost of direct vs indirect VC activities
The part of DGF administrative costs that are di-
rectly attributable to VC was relatively stable be-
tween DKK 40–45m in the period 2009–2012 with
the exception of 2010 where the cost of indirect in-
vestments dropped. In 2012, 34% of administrative
costs related to VC activities were attributable to di-
rect investment activities (DGF).
When comparing directly, one could reach the con-
clusion that it is cheaper to invest through funds
than directly in companies. However, investments in
funds are not necessarily more cost-effective than
direct investment, when the total cost is calculated
(DFGs costs and the cost of the fund manager). It is
therefore difficult to assess whether VF Ventures
actual investment cost is lower or higher than VF
Funds.
In the end, the most interesting comparison to make
is costs related to value created. If higher costs are
related to better management, then the overall net
economic effect could be positive. This is what we
see in relation to DGF’s in-house risk assessment
of growth loans which reduced losses. However, it
is extremely difficult to estimate the costs related to
value created from ongoing investment activities,
because the real value created is apparent only
when there is an exit. At that point, it is possible to
calculate total investments vs value created and
thus determine the net value creation. This means
that a fund has to be fully invested and exited before
the total value creation can be estimated. As such it
is problematic to compare the performance of DGF
vis-à-vis other market actors.
Cost of loans and guarantees
The administrative costs of the DGF growth guaran-
tee are very high, which for the most part is attribut-
able to the fact that DGF conducts its own due dili-
gence. Therefore DGF has more staff than in
schemes where banks alone do the risk assess-
ment. This in-house risk assessment demands that
more people are employed by DGF. In 2012, DGF
had 21 people employed compared to the UK
scheme that only had 4 people employed and the
number of loans is substantially higher in the UK
compared to DGF. By conducting its own risk as-
sessment, DGF reduces the risk of moral hazard
that can arise from the lower risk taken by firms and
banks. The in-house risk assessment was chosen
because of high default rates prior to 2003, where
due diligence was made by the banks. For DGF
there was a trade-off between a high default rate
and high administrative costs related to proper due
diligence. This trade-off resulted in low default rates
compared to the UK’s SFLG and EPG schemes and
the Canadian Small Business Finance Programme.
The total cost pr. loan including losses is in the high
end compared to the three international loan guar-
antee schemes. This can partly be attributed to size
of the growth guarantee scheme, which is small
compared to the other schemes and thus have
higher fixed cost per loan. The total cost as to the
amount guaranteed is lower compared to the inter-
national schemes. This is a result of the lower de-
fault rates and because DGFs guarantees are larger
compared to the other schemes, which makes the
cost pr. million DKK guaranteed lower.
EVALUATION OF THE DANISH GROWTH FUND | DAMVAD.COM 23
Comparison to similar institutions5
By looking at DGF’s costs compared to other similar
financial institutions, it is possible to assess whether
DGF has unreasonably high operating costs, and if
they are in line with the “market”. Compared to the
average cost per employee in the period 2009–2012
for DGF and similar institutions, DGF’s costs are on
level with Almi (SE), EKF (DK) and FII (FIN), but well
below those of Industrifonden (NO) and Investinor
(NO).
Given that there are national differences in wage
levels, etc., relative differences are to be expected.
This particular source of differences can be elimi-
nated by comparing DGF with the Danish Export
Credit Fund (EKF), which is on level with DGF.
When looking at their product portfolio DGF and
EKF are not very similar, but their employees are
comparable.
The rather substantial difference in relation to the
Norwegian institutions is partly attributable to differ-
ences in cost structures. As an example, Investinor
has other costs per employee of approx. DKK 1.1m,
while other costs in DGF amount to approx. DKK
0.4m. Other costs includes the use of external con-
sultancy and advisory assistance.
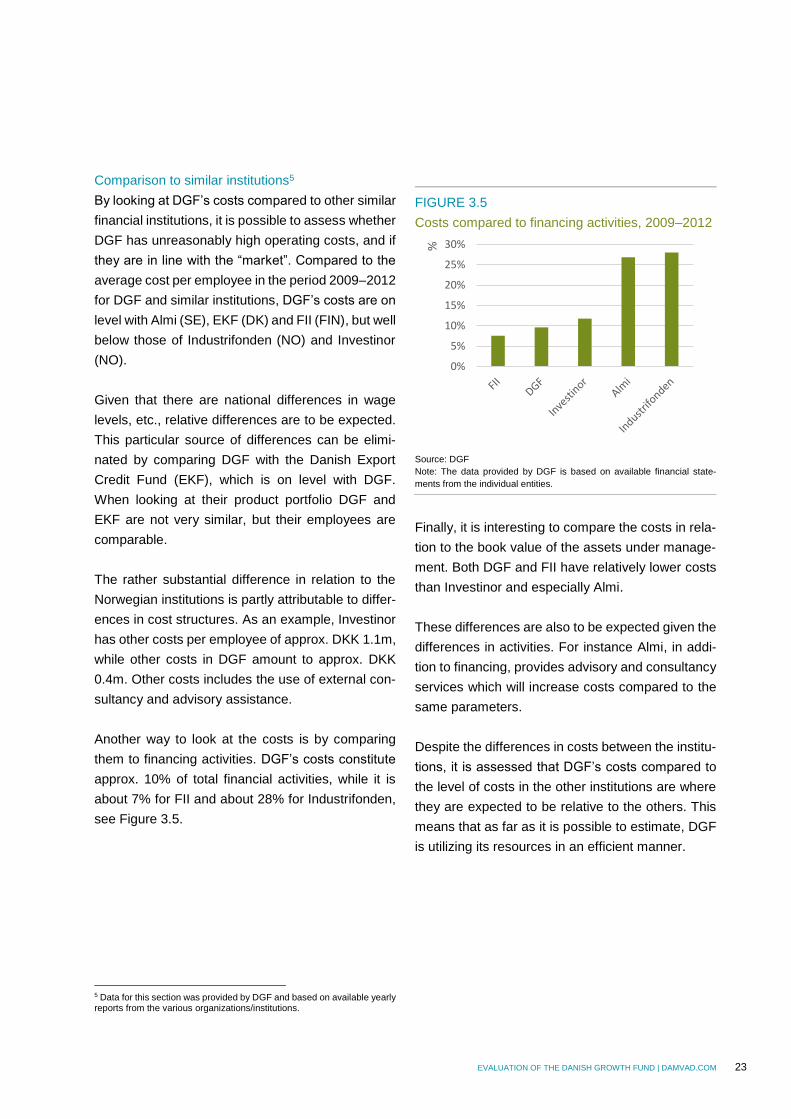
Another way to look at the costs is by comparing
them to financing activities. DGF’s costs constitute
approx. 10% of total financial activities, while it is
about 7% for FII and about 28% for Industrifonden,
see Figure 3.5.
5 Data for this section was provided by DGF and based on available yearly reports from the various organizations/institutions.
FIGURE 3.5
Costs compared to financing activities, 2009–2012
Source: DGF
Note: The data provided by DGF is based on available financial state-
ments from the individual entities.
Finally, it is interesting to compare the costs in rela-
tion to the book value of the assets under manage-
ment. Both DGF and FII have relatively lower costs
than Investinor and especially Almi.
These differences are also to be expected given the
differences in activities. For instance Almi, in addi-
tion to financing, provides advisory and consultancy
services which will increase costs compared to the
same parameters.
Despite the differences in costs between the institu-
tions, it is assessed that DGF’s costs compared to
the level of costs in the other institutions are where
they are expected to be relative to the others. This
means that as far as it is possible to estimate, DGF
is utilizing its resources in an efficient manner.
0%
5%
10%
15%
20%
25%
30%%
24 EVALUATION OF THE DANISH GROWTH FUND | DAMVAD.COM
3.3.3 Effectiveness and impact
The effectiveness of DGF is a question of whether
DGF is able to provide Danish companies with a
healthy Danish VC ecosystem, loans and guaran-
tees.
Danish VC ecosystem
A sustainable VC ecosystem is an ecosystem that
manages to provide funding for the development of
new companies, while generating income for the in-
vestors.
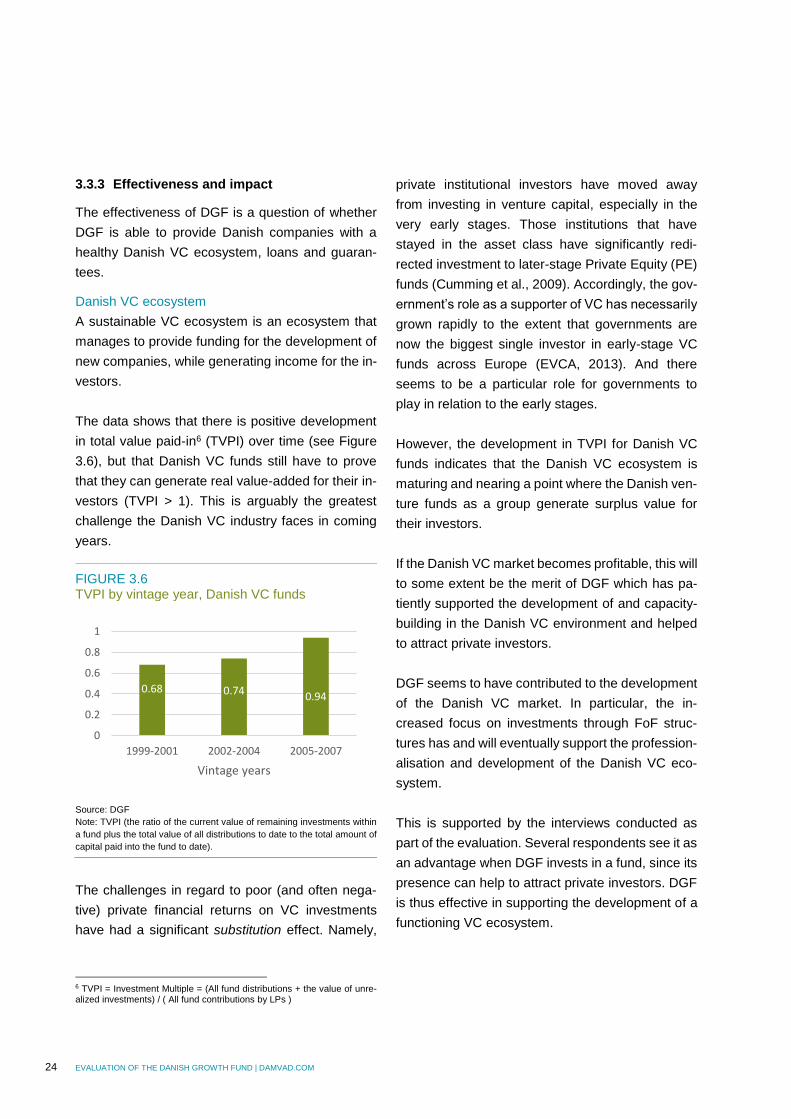
The data shows that there is positive development
in total value paid-in6 (TVPI) over time (see Figure
3.6), but that Danish VC funds still have to prove
that they can generate real value-added for their in-
vestors (TVPI > 1). This is arguably the greatest
challenge the Danish VC industry faces in coming
years. FIGURE 3.6 TVPI by vintage year, Danish VC funds
Source: DGF
Note: TVPI (the ratio of the current value of remaining investments within
a fund plus the total value of all distributions to date to the total amount of
capital paid into the fund to date).
The challenges in regard to poor (and often nega-
tive) private financial returns on VC investments
have had a significant substitution effect. Namely, 6 TVPI = Investment Multiple = (All fund distributions + the value of unre-alized investments) / ( All fund contributions by LPs )
private institutional investors have moved away
from investing in venture capital, especially in the
very early stages. Those institutions that have
stayed in the asset class have significantly redi-
rected investment to later-stage Private Equity (PE)
funds (Cumming et al., 2009). Accordingly, the gov-
ernment’s role as a supporter of VC has necessarily
grown rapidly to the extent that governments are
now the biggest single investor in early-stage VC
funds across Europe (EVCA, 2013). And there
seems to be a particular role for governments to
play in relation to the early stages.
However, the development in TVPI for Danish VC
funds indicates that the Danish VC ecosystem is
maturing and nearing a point where the Danish ven-
ture funds as a group generate surplus value for
their investors.
If the Danish VC market becomes profitable, this will
to some extent be the merit of DGF which has pa-
tiently supported the development of and capacity-
building in the Danish VC environment and helped
to attract private investors.
DGF seems to have contributed to the development
of the Danish VC market. In particular, the in-
creased focus on investments through FoF struc-
tures has and will eventually support the profession-
alisation and development of the Danish VC eco-
system.
This is supported by the interviews conducted as
part of the evaluation. Several respondents see it as
an advantage when DGF invests in a fund, since its
presence can help to attract private investors. DGF
is thus effective in supporting the development of a
functioning VC ecosystem.
0.68 0.74 0.94
0
0.2
0.4
0.6
0.8
1
1999-2001 2002-2004 2005-2007
Vintage years
EVALUATION OF THE DANISH GROWTH FUND | DAMVAD.COM 25
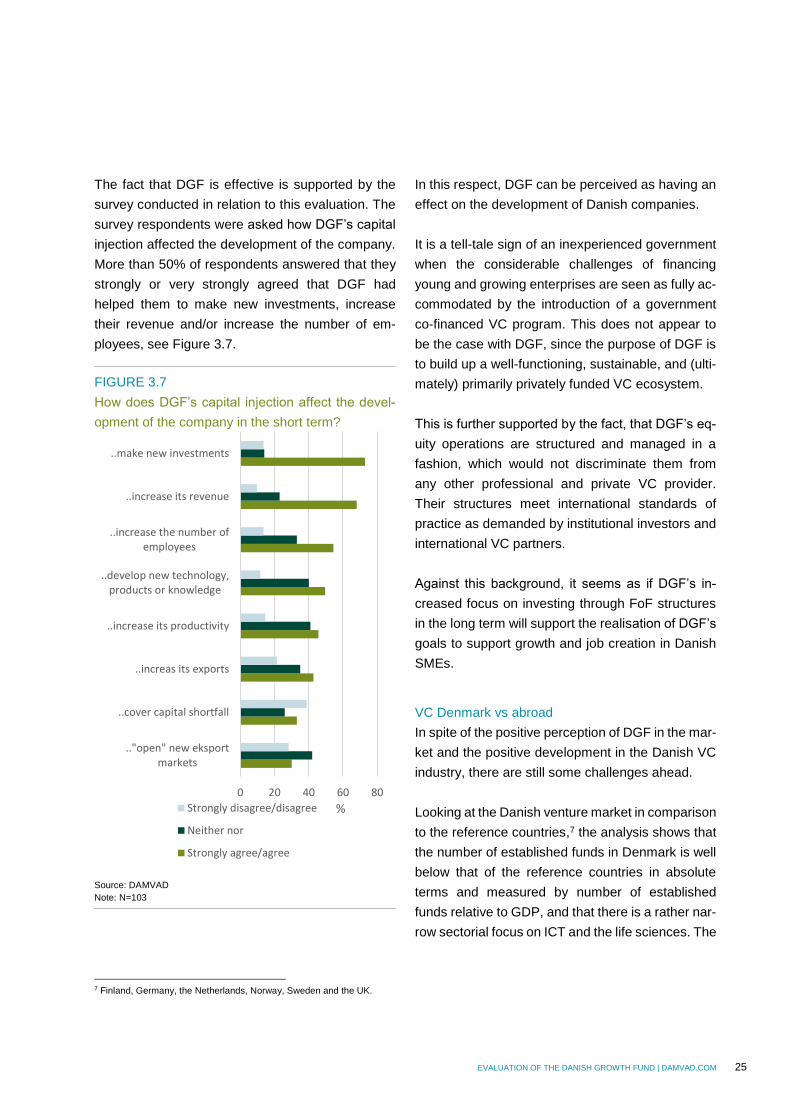
The fact that DGF is effective is supported by the
survey conducted in relation to this evaluation. The
survey respondents were asked how DGF’s capital
injection affected the development of the company.
More than 50% of respondents answered that they
strongly or very strongly agreed that DGF had
helped them to make new investments, increase
their revenue and/or increase the number of em-
ployees, see Figure 3.7.
FIGURE 3.7
How does DGF’s capital injection affect the devel-
opment of the company in the short term?
Source: DAMVAD
Note: N=103
7 Finland, Germany, the Netherlands, Norway, Sweden and the UK.
In this respect, DGF can be perceived as having an
effect on the development of Danish companies.
It is a tell-tale sign of an inexperienced government
when the considerable challenges of financing
young and growing enterprises are seen as fully ac-
commodated by the introduction of a government
co-financed VC program. This does not appear to
be the case with DGF, since the purpose of DGF is
to build up a well-functioning, sustainable, and (ulti-
mately) primarily privately funded VC ecosystem.
This is further supported by the fact, that DGF’s eq-
uity operations are structured and managed in a
fashion, which would not discriminate them from
any other professional and private VC provider.
Their structures meet international standards of
practice as demanded by institutional investors and
international VC partners.
Against this background, it seems as if DGF’s in-
creased focus on investing through FoF structures
in the long term will support the realisation of DGF’s
goals to support growth and job creation in Danish
SMEs.
VC Denmark vs abroad
In spite of the positive perception of DGF in the mar-
ket and the positive development in the Danish VC
industry, there are still some challenges ahead.
Looking at the Danish venture market in comparison
to the reference countries,7 the analysis shows that
the number of established funds in Denmark is well
below that of the reference countries in absolute
terms and measured by number of established
funds relative to GDP, and that there is a rather nar-
row sectorial focus on ICT and the life sciences. The
0 20 40 60 80
.."open" new eksportmarkets
..cover capital shortfall
..increas its exports
..increase its productivity
..develop new technology,products or knowledge
..increase the number ofemployees
..increase its revenue
..make new investments
%Strongly disagree/disagree
Neither nor
Strongly agree/agree
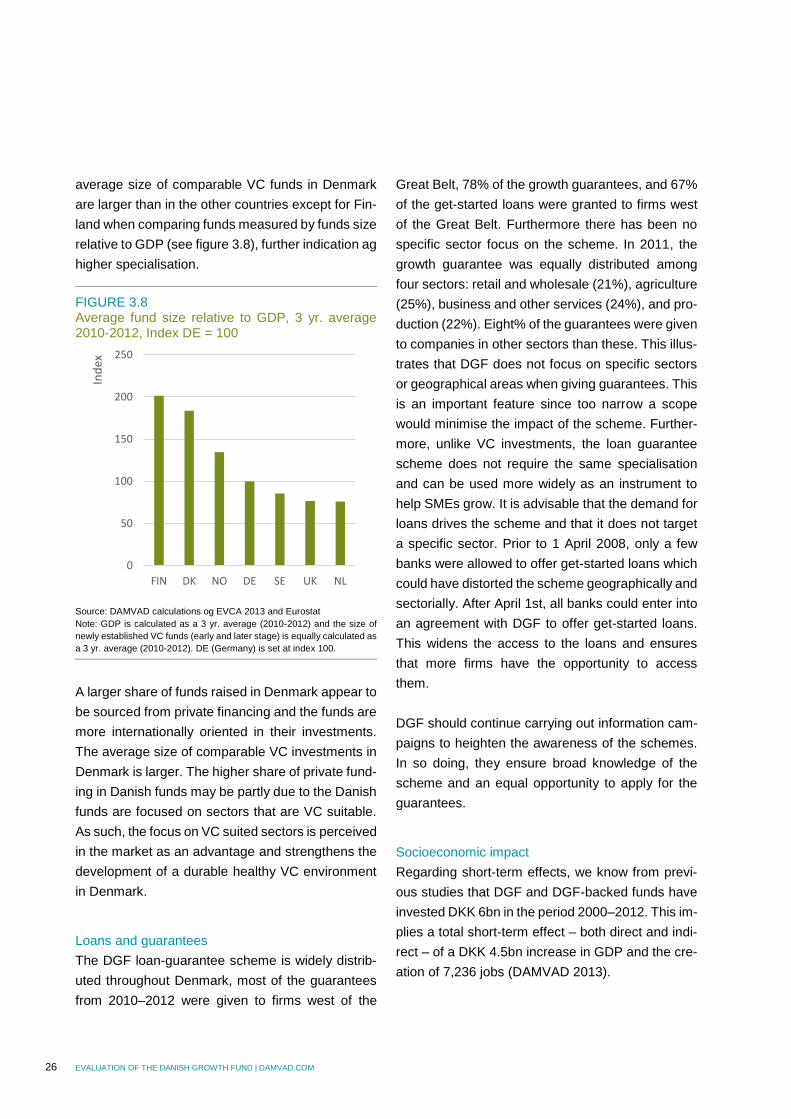
26 EVALUATION OF THE DANISH GROWTH FUND | DAMVAD.COM
average size of comparable VC funds in Denmark
are larger than in the other countries except for Fin-
land when comparing funds measured by funds size
relative to GDP (see figure 3.8), further indication ag
higher specialisation. FIGURE 3.8 Average fund size relative to GDP, 3 yr. average 2010-2012, Index DE = 100
Source: DAMVAD calculations og EVCA 2013 and Eurostat
Note: GDP is calculated as a 3 yr. average (2010-2012) and the size of
newly established VC funds (early and later stage) is equally calculated as
a 3 yr. average (2010-2012). DE (Germany) is set at index 100.
A larger share of funds raised in Denmark appear to
be sourced from private financing and the funds are
more internationally oriented in their investments.
The average size of comparable VC investments in
Denmark is larger. The higher share of private fund-
ing in Danish funds may be partly due to the Danish
funds are focused on sectors that are VC suitable.
As such, the focus on VC suited sectors is perceived
in the market as an advantage and strengthens the
development of a durable healthy VC environment
in Denmark.
Loans and guarantees
The DGF loan-guarantee scheme is widely distrib-
uted throughout Denmark, most of the guarantees
from 2010–2012 were given to firms west of the
Great Belt, 78% of the growth guarantees, and 67%
of the get-started loans were granted to firms west
of the Great Belt. Furthermore there has been no
specific sector focus on the scheme. In 2011, the
growth guarantee was equally distributed among
four sectors: retail and wholesale (21%), agriculture
(25%), business and other services (24%), and pro-
duction (22%). Eight% of the guarantees were given
to companies in other sectors than these. This illus-
trates that DGF does not focus on specific sectors
or geographical areas when giving guarantees. This
is an important feature since too narrow a scope
would minimise the impact of the scheme. Further-
more, unlike VC investments, the loan guarantee
scheme does not require the same specialisation
and can be used more widely as an instrument to
help SMEs grow. It is advisable that the demand for
loans drives the scheme and that it does not target
a specific sector. Prior to 1 April 2008, only a few
banks were allowed to offer get-started loans which
could have distorted the scheme geographically and
sectorially. After April 1st, all banks could enter into
an agreement with DGF to offer get-started loans.
This widens the access to the loans and ensures
that more firms have the opportunity to access
them.
DGF should continue carrying out information cam-
paigns to heighten the awareness of the schemes.
In so doing, they ensure broad knowledge of the
scheme and an equal opportunity to apply for the
guarantees.
Socioeconomic impact
Regarding short-term effects, we know from previ-
ous studies that DGF and DGF-backed funds have
invested DKK 6bn in the period 2000–2012. This im-
plies a total short-term effect – both direct and indi-
rect – of a DKK 4.5bn increase in GDP and the cre-
ation of 7,236 jobs (DAMVAD 2013).
0
50
100
150
200
250
FIN DK NO DE SE UK NL
Ind
ex
EVALUATION OF THE DANISH GROWTH FUND | DAMVAD.COM 27
Additionally, CEBR estimated in a 2012 study that
the issuance of a DKK 1m loan led to a GDP in-
crease of DKK 1.5m and the creation of 1.2 jobs in
the short term, when including the effects of the ad-
ditional loan capital obtained by the target group
based on the DGF-backed loan. In the medium term
(three-year period), the effects per onem DKK of
loans issued are a GDP increase of DKK 3.4m and
the creation of 4.1 jobs in the medium term (three-
year period) (DAMVAD, 2013).
3.4 About this report
The evaluation is based on a combination of quan-
titative and qualitative analyses and methods. As
part of the qualitative analysis, a series of interviews
were conducted with industry experts and insiders,
and a survey was carried out among companies that
received funding (both equity and debt) from DGF.
Both the qualitative and the quantitative analyses
were substantiated by extensive desk research. Fi-
nally, professors Gordon Murray and Marc Cowling
have provided abundant academic knowledge and
experience for the evaluation.
This evaluation does not use empirical data on port-
folio firms that received DGF debt or equity support.
Accordingly, it is not possible to look at performance
outcomes and the value added in quantitative
terms.
In order to evaluate DGF, it is necessary to compare
it to similar institutions in other countries. For that
purpose, a number of comparable institutions in
other European countries were identified and
benchmarked against DGF wherever possible.
28 EVALUATION OF THE DANISH GROWTH FUND | DAMVAD.COM
4.1 The Danish Growth Fund (DGF)
Entrepreneurs and small and medium sized enter-
prises (SMEs) are essential to job creation, innova-
tion and overall economic growth. However, market
failures such as credit rationing, learning cost and
knowledge externalities can lead to credit con-
straints and ultimately to a socially sub-optimal level
of investment.
The Danish Growth Fund (DGF) is a public invest-
ment fund that aims to make a significant contribu-
tion to innovation and economic growth by co-fi-
nancing the genesis, growth and development of
small and medium-sized enterprises (SMEs) of high
growth potential. By providing loans and loan guar-
antees, DGF aims to alleviate financial constraints
for promising entrepreneurs and SMEs, which lack
sufficient collateral and/or the track record to obtain
a bank loan on normal market terms. Additionally,
by developing the scale and professionalism of the
early-stage venture capital (VC) market, including
the related ‘entrepreneurial ecosystem’, DGF seeks
to increase the availability of risk capital for innova-
tive entrepreneurs and SMEs in need of additional
sources of external equity to develop and grow their
businesses rapidly.
Since 1992, DGF has co-financed more than 4,500
Danish enterprises with a total commitment of
around DKK 12bn. From 2000 to 2012, DGF guar-
anteed loans for almost DKK 6bn to Danish SMEs,
and invested more than DKK 4bn in high-risk,
knowledge-based companies either directly or indi-
rectly through fund investments.
In this report, DAMVAD collaborates with professors
Marc Cowling and Gordon Murray to evaluate the
8 Executive order implementing the Vækstfonden Act (Consolidated Act no. 549 of 01/07/2002).
activities of DGF from 2010 to the present (2013).
The evaluation seeks to address:
the objective of the Danish Growth Fund (DGF)
to mitigate market failure and create socioeco-
nomic returns
DGF as a contra-cyclical instrument
different models and contextual structures
This is done by keeping in mind the four criteria con-
cerning the performance and relevance of DGF.
The four criteria are:
relevance
effectiveness
efficiency
impact
Additionally, the evaluation report seeks to answer
a number of policy questions related to the success
and ability of DGF to fulfil its objective.
One caveat is necessary. This evaluation does not
use empirical data on portfolio firms that have re-
ceived DGF debt or equity support. Accordingly, it is
not possible to look at performance outcomes and
value-added in the quantitative terms familiar to
econometricians. Thus, the observations made in
this evaluation are better seen as indicative of the
current state of DGF and the identification of areas
of importance regarding its future operations.
4.1.1 Objective of DGF
DGF is a government-backed, regulated fund,
which was established in 1992 with the statutory
purpose “to promote innovation and development of
the business sector in order to achieve a higher so-
cioeconomic return”.8 To achieve this objective,
4 Introduction
EVALUATION OF THE DANISH GROWTH FUND | DAMVAD.COM 29
DGF provides risk capital to SMEs in the early
stages from pre-seed to expansion and buy-out,
and debt finance to start-ups and established com-
panies. The strategy of DGF supports its present vi-
sion of making a significant contribution to innova-
tion and growth in Danish companies.
In 2001, DGF refocused its original strategy to mak-
ing equity investments in order to be able to finance
a larger number of companies. The 2010 evaluation
of DGF focused on these activities. In 2009, the
Danish Government increased DGF’s activities
more than tenfold with the addition of debt financing
through the loan-guarantee scheme. Accordingly,
this present evaluation also includes an evaluation
on the debt-finance instruments and the composi-
tion of instruments in DGF compared to similar insti-
tutions in the UK, Finland, Germany, Sweden, the
Netherlands, Norway and the European Investment
Bank/Fund.
4.1.2 DGF’s objective to mitigate market failure
and increase socioeconomic returns
Although the level of VC finance provided by gov-
ernment co-financed (or ‘hybrid’) programmes is rel-
atively small in relation to the totality of VC and PE
finance available, its focus at the earliest and riski-
est stages of enterprise formation and growth con-
fers a policy importance larger than the sums of fi-
nance involved. In the absence of public support,
the supply of venture capital at seed or start-up
stages is likely to have reduced to negligible sums
in a majority of countries with open and competitive
markets for capital. The continued presence of
these programmes ensures that high potential but
financially rationed enterprises do get a chance to
enter markets with new goods and services. Access
to venture capital is linked to high growth for those
surviving and successful businesses. Many of these
businesses will be based on new and innovative
products and services. They are also more likely to
internationalise early and extensively (Burgel and
Murray, 2000). This report will seek to evaluate
these desired outcomes within the context of DGF
and the Danish economy, and given the data avail-
able.
4.1.3 Addressing market failures
The primarily challenge in the design of public inter-
vention is to establish a system where the public-
sector activities on the one hand maximise the soci-
oeconomic return and the other do not crowd out
private investments thus reducing the efficiency and
effectiveness of the markets for entrepreneurial fi-
nance.
This balance will vary during different periods of the
economic cycle for both debt and early-stage equity
supply. In cyclical periods of low economic activity
where the market is often more adverse to risk, like
the economic crisis from 2008 onwards, we also see
a large increase in the publicly-funded loan and
guarantee initiatives in growth financing.
This evaluation will also compare whether the same
contra-cyclical development is apparent in the coun-
tries mentioned and assess whether the instru-
ments are designed to reduce public involvement
when economic growth returns. In addition, the
evaluation assesses whether the institution is solely
designed to be contra-cyclical in its scope within
debt financing instruments and whether it is ex-
pected to generate sufficient Returns on Invest-
ments (ROI) to self-finance its investments and
losses both within VC and debt financing.
4.1.4 Different models and contextual struc-
tures
Across a number of different countries, we identify
principles or investment models in the approach to
supplementing the market for innovation capital.
30 EVALUATION OF THE DANISH GROWTH FUND | DAMVAD.COM
The first is the pari passu model, where a public and
private partner(s) invest on equal terms and assume
the same risks and rewards in direct relation to the
sums invested. This model is used in Denmark by
DGF in the venture capital market.
In the second model, the public takes a larger risk
but also a higher price according to the increased
risk and absence of collateral. Hence, this model is
also market based, and is used in Denmark in the
Growth loan scheme. This model is also used in
Sweden.
The third model is subsidy based and occurs where
the public sector finances any losses incurred. This
has previously been used in Denmark for debt fi-
nance. This ‘down-side protection’ model has not
been used in Denmark in VC market.
This evaluation compares the pros and cons of the
different investment models adopted in different
countries in Europe. The evaluation and benchmark
of DGF includes these perspectives in drawing its
own conclusions as to DGF activity.
Finally, the evaluation also contains an informed
comparison between countries taking into account
the contextual differences under which similar policy
instruments are employed. If these differences are
not taken into account, the conclusions drawn could
be misleading or erroneous. The benchmarks there-
fore take into account known and systemic differ-
ences between countries.
4.2 Structure
The evaluation of DGF takes into account that the
various equity and debt activities of DGF are funda-
mentally different and therefore cannot be meaning-
fully considered as one. A distinction is therefore
made in the evaluation of DGF with venture activi-
ties on the one hand, and loan and guarantee activ-
ities on the other.
One of the primary reasons that DGF’s equity and
debt operations are treated separately in the evalu-
ation is that the products/services of DGF target dif-
ferent segments of Danish business and there is lit-
tle overlap.
Venture activities
DGF provides capital to entrepreneurs either
through direct equity investments or through indirect
equity investments managed by other funds or via
fund of funds (FOF) investments. The common de-
nominator is that DGF takes an ownership position
in the firms and the funds supported. Accordingly,
DGF also takes part in any potential upside or down-
side.
Loan and guarantee activities
By providing loans and loan guarantees, DGF pro-
vides capital for entrepreneurs and SMEs which
lack sufficient collateral and/or a track record to ob-
tain a bank loan on normal market terms.
Based on the analysis of the two business areas, a
general discussion of the relevance, efficiency, ef-
fectiveness and impact of DGF is presented.
A short glossary of terms is included in chapter 8.
4.3 Similar international institutions for com-
parison of DGF activities
In order to evaluate DGF, it is necessary to compare
it to similar institutions in other countries. For that
purpose, a number of comparable institutions in
other European countries have been identified
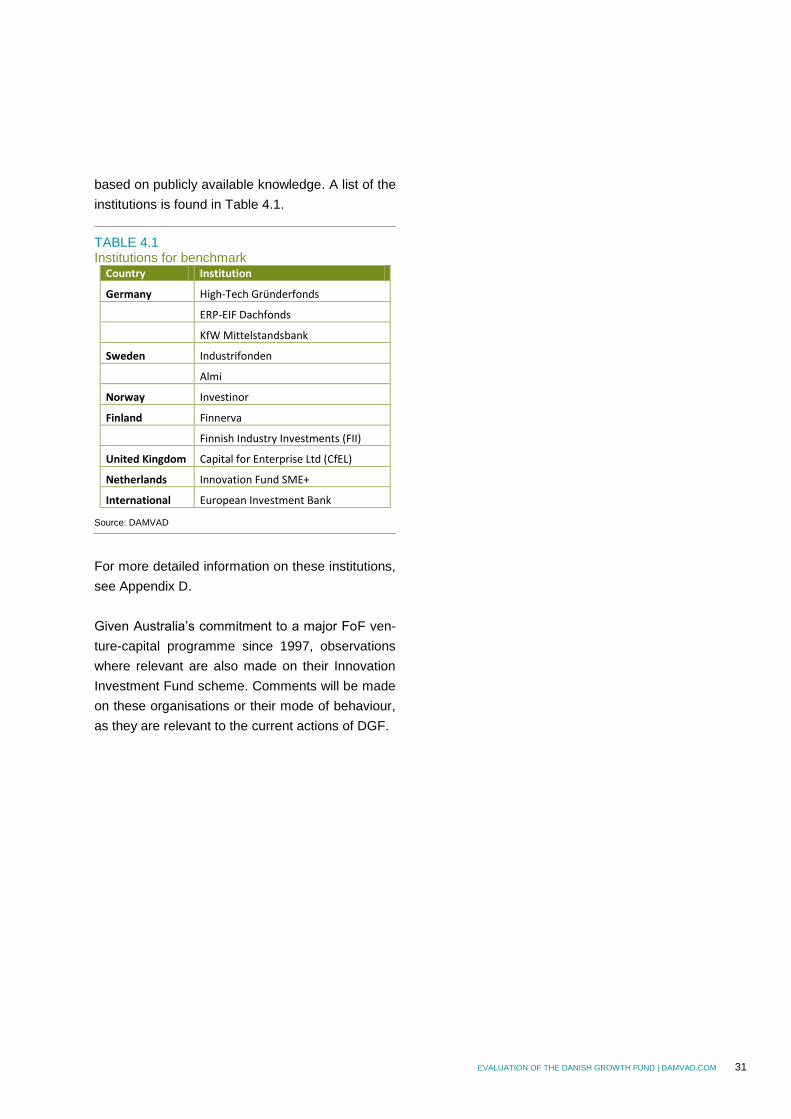
EVALUATION OF THE DANISH GROWTH FUND | DAMVAD.COM 31
based on publicly available knowledge. A list of the
institutions is found in Table 4.1. TABLE 4.1 Institutions for benchmark
Country Institution
Germany High-Tech Gründerfonds
ERP-EIF Dachfonds
KfW Mittelstandsbank
Sweden Industrifonden
Almi
Norway Investinor
Finland Finnerva
Finnish Industry Investments (FII)
United Kingdom Capital for Enterprise Ltd (CfEL)
Netherlands Innovation Fund SME+
International European Investment Bank
Source: DAMVAD
For more detailed information on these institutions,
see Appendix D.
Given Australia’s commitment to a major FoF ven-
ture-capital programme since 1997, observations
where relevant are also made on their Innovation
Investment Fund scheme. Comments will be made
on these organisations or their mode of behaviour,
as they are relevant to the current actions of DGF.
32 EVALUATION OF THE DANISH GROWTH FUND | DAMVAD.COM
5.1 Introducing VC as a Policy Activity
5.1.1 Definitions and Importance of Venture
Capital and Private Equity Terms
It is important that we use the terms venture capital
(VC) and private equity (PE) consistently and accu-
rately. Very often, the two terms are used confus-
ingly as a generic category conflating both early-
stage and later-stage activities. The glossary found
in chapter 8 contains the most common terms. How-
ever, a number of key terms need to be described
immediately. The European Venture Capital Asso-
ciation’s (EVCA) literature is used as a guide.
Venture Capital relates to seed, start-up and early
growth activities. Seed and much of start-up activity
concerns newly formed enterprises that are not yet
selling a product or service. Venture capitalists are
only interested in supporting firms with high poten-
tial and very ambitious growth plans which are often
sited in novel or innovative markets. These young
companies may not be generating profits until
sometime after their formation. VC usually involves
new money into new (or at least relatively young)
enterprises. A majority of the firms supported are
unlikely to become commercially successful. If a VC
fund makes positive returns, it is usually the result
of a small minority of portfolio companies creating
exceptional value. While some VC funds may make
very attractive returns when portfolio companies are
finally sold or floated, this activity is both very risky
and highly uncertain. In recent years, disappointing
financial returns to venture capital industries world-
wide have resulted in many institutional equity in-
vestors abandoning VC investments for later-stage,
less risky and more profitable PE deals.
Private Equity relates to later-stage investments in
companies with an established product or service,
and which have already generated revenue. They
may not be making a profit (or sufficient profit).
These companies may need additional capital to
grow or expand. The most popular PE activity is the
management buy-out (MBO) which is a form of cor-
porate restructuring by professional investors. The
size of the largest MBO targets firms bought and
taken private by PE investors in association with
debt providers can be measured in billions of dol-
lars. Since the collapse of the technology bubble in
2000, PE has attracted considerably larger funds
and generated significantly better and more stable
returns for investors compared to VC. Given that
fees are often based on a proportion of funds under
management, managing larger PE funds, has also
been far more profitable than VC for the general
partnerships. The potential of a share in the capital
gain (‘the carry’) is also more attractive in PE. Im-
portantly, PE funds are also able to accommodate
much larger investments by institutional funds given
the much greater value of both deals and PE funds
under management.
Why government is interested in VC
Venture capital as a policy instrument for promoting
high-growth enterprises has almost universal ap-
peal to governments across both the developed and
developing world, regardless of political colour (Ler-
ner, 2009). The reason for their enthusiasm is sim-
ple: venture capital is seen as a critical component
of a modern enterprise economy. It is particularly
associated with the identification and support of
young new-knowledge/new-technology firms with
the potential to bring about major disruptive
changes to markets and their users (Hellmann and
Puri, 2000; Lerner and Khortum, 2000).
Silicon Valley casts a long shadow on policy makers
wishing to emulate the USA’s premier position as a
technological and entrepreneurial innovator. Ac-
cordingly, no government with a serious interest in
enterprise and innovation – and committed to be-
coming globally competitive in areas of new
knowledge – can afford not to have a clear policy for
5 DGF’s venture activities
EVALUATION OF THE DANISH GROWTH FUND | DAMVAD.COM 33
the supply of risk capital available to its entrepre-
neurs. Countries with a high public R&D spending
are particularly likely to show a strong correlation
with VC activity (Da Rin et al., 2006).
Why VC is ‘difficult’
PE deals with established companies working in
known industries producing ‘mature’ products and
services both widely purchased and understood by
their customers. In extremis, PE is primarily the fi-
nancial re-engineering of the target business, fre-
quently with the addition of considerable debt to fa-
cilitate ‘geared’ returns to the equity holders. For the
early-stage VC investor, little of the above is true.
VCs commonly support new enterprises in ‘new
knowledge-based’ areas of science and technology
where the returns to successful companies can be
extraordinarily high. In order to exploit such novel
and emerging opportunities the investors and the
supported entrepreneurs and managers have to op-
erate in markets and sectors with enormous levels
of uncertainty regarding the technology, and the
feasibility and attractiveness of the novel products
and services produced.
Even successful products may quickly become ob-
solete as a result of rapid technological advances.
Many of the entrepreneur founders involved may be
commercially untested despite their exceptional
technical skills. The experienced venture capitalist
has to be skilled at both recognising opportunity and
being able to nurture young enterprises, which in-
cludes coaching their founders and managers to
achieve a successful, valuable commercial entity
(Sapienza 1992). Such commercial, analytical and
mentoring skills leading to a successful venturing
track record are scarce human capital resources,
even in the most advanced economies.
Market failures in early-stage VC markets
Liberal western economies seek to leave markets to
their own devices unless there is clear evidence of
serious and harmful market failure (Rigby and Ram-
logan, 2013).
As Gilson (2003) notes, the VC market demon-
strates a trinity of problems, i.e. uncertainty, infor-
mation asymmetry and opportunism. The resulting
agency costs and ‘moral hazard’ problems increase
the difficulty of the entrepreneurial transaction.
While venture capitalists can reduce agency costs
by the imposition of clear governance procedures
designed to accelerate the commercialisation pro-
cess (Cornelli and Yosha, 2003), inherent conflicts
between the interested parties still remain.
These problems stem from the reality that much
early-stage VC activity is associated with emerging
and immature technologies and the new opportuni-
ties they (might) signal. However, these signals are
often noisy, frequently misleading and their commu-
nication is problematic. Technology entrepreneurs
may know more than the professional investors in
their projects. This disparity can produce serious in-
formation asymmetries. Entrepreneurial owners’
partial disclosure is likely to be influenced by their
own interests. Venture capitalists will wish to protect
their economic position as an intermediary against
both the providers of their finances (institutional in-
vestors) and the entrepreneurial founders of the
ventures which they back.
Profound levels of uncertainty are coupled with the
critical fact that the majority of early stage venture
activity – and particularly venture activity in new
technologies – has frequently resulted in disastrous
returns for many early-stage VC investors. In turn,
this has prompted a general trend since the early
2000s with many institutional investors moving
away from significant involvement in such a highly
speculative asset class (EVCA 2013).
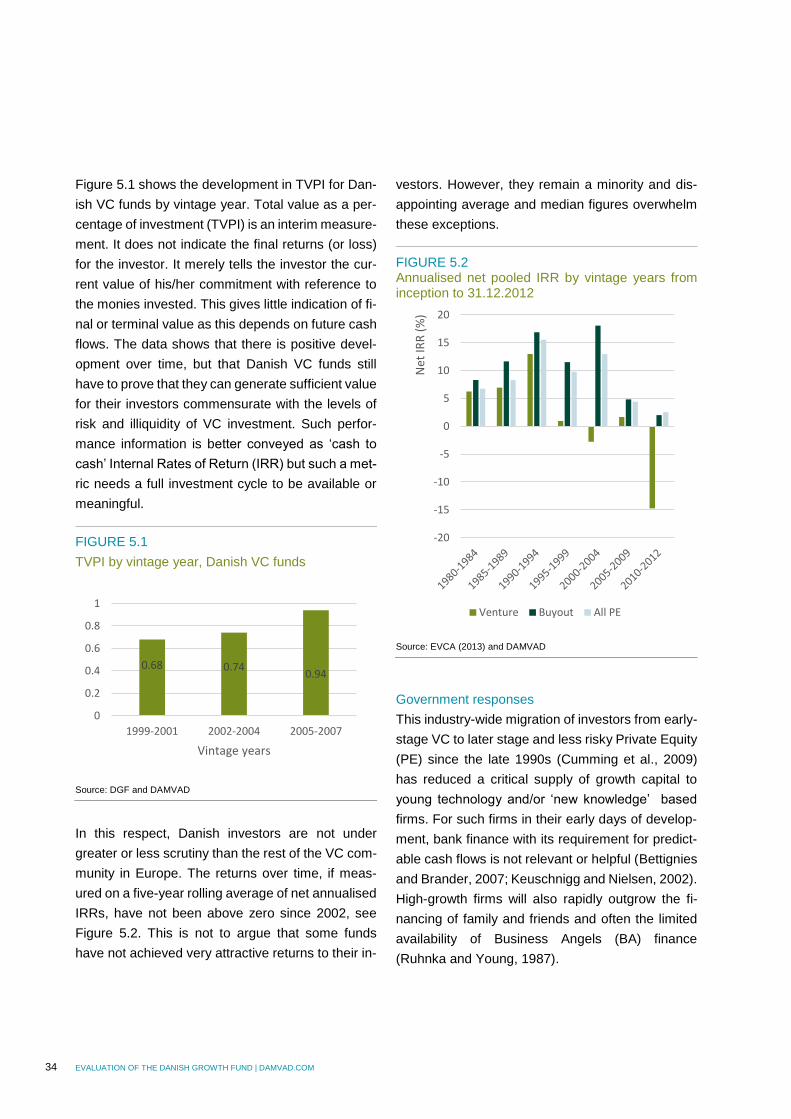
34 EVALUATION OF THE DANISH GROWTH FUND | DAMVAD.COM
Figure 5.1 shows the development in TVPI for Dan-
ish VC funds by vintage year. Total value as a per-
centage of investment (TVPI) is an interim measure-
ment. It does not indicate the final returns (or loss)
for the investor. It merely tells the investor the cur-
rent value of his/her commitment with reference to
the monies invested. This gives little indication of fi-
nal or terminal value as this depends on future cash
flows. The data shows that there is positive devel-
opment over time, but that Danish VC funds still
have to prove that they can generate sufficient value
for their investors commensurate with the levels of
risk and illiquidity of VC investment. Such perfor-
mance information is better conveyed as ‘cash to
cash’ Internal Rates of Return (IRR) but such a met-
ric needs a full investment cycle to be available or
meaningful.
FIGURE 5.1
TVPI by vintage year, Danish VC funds
Source: DGF and DAMVAD
In this respect, Danish investors are not under
greater or less scrutiny than the rest of the VC com-
munity in Europe. The returns over time, if meas-
ured on a five-year rolling average of net annualised
IRRs, have not been above zero since 2002, see
Figure 5.2. This is not to argue that some funds
have not achieved very attractive returns to their in-
vestors. However, they remain a minority and dis-
appointing average and median figures overwhelm
these exceptions.
FIGURE 5.2 Annualised net pooled IRR by vintage years from inception to 31.12.2012
Source: EVCA (2013) and DAMVAD
Government responses
This industry-wide migration of investors from early-
stage VC to later stage and less risky Private Equity
(PE) since the late 1990s (Cumming et al., 2009)
has reduced a critical supply of growth capital to
young technology and/or ‘new knowledge’ based
firms. For such firms in their early days of develop-
ment, bank finance with its requirement for predict-
able cash flows is not relevant or helpful (Bettignies
and Brander, 2007; Keuschnigg and Nielsen, 2002).
High-growth firms will also rapidly outgrow the fi-
nancing of family and friends and often the limited
availability of Business Angels (BA) finance
(Ruhnka and Young, 1987).
0.68 0.740.94
0
0.2
0.4
0.6
0.8
1
1999-2001 2002-2004 2005-2007
Vintage years
-20
-15
-10
-5
0
5
10
15
20
Net
IRR
(%
)
Venture Buyout All PE
EVALUATION OF THE DANISH GROWTH FUND | DAMVAD.COM 35
Governments with a strong commitment to eco-
nomic growth via R&D investment facilitating
greater enterprise and innovation activity are faced
with a direct choice. They must find means to en-
sure that early-stage VC finance remains available
to high-potential, young firms or risk a reduction in
the new commercialisation opportunities stemming
from national investments in science and technol-
ogy. In a world of international scoreboards in inno-
vation, enterprise, etc., few advanced economies
wish to see VC disappear from their borders to the
detriment of their highest potential firms (Wilson and
Silva, 2013). They are likely to lose their best firms
to countries with a more benign environment for
start-ups and early growth firms.9
These concerns have seen the government’s role
as a provider of VC grow rapidly to the extent that
the government is now the biggest single investor in
early-stage VC funds across Europe (EVCA, 2013).
These actions are not designed to permanently re-
place private VC firms by public investment. Rather,
the actions of the government and the support they
give the sector via specialist funding agencies are
there to ‘pump prime’ the supply of VC by both shar-
ing risk and incentivising investors to re-examine
and re-enter this sector of the equity markets. How-
ever, this aspiration to temporarily pump-prime or
act as a catalyst in the VC market before withdraw-
ing in favour of private actors may be an ambition
rather than a commitment in the absence of private
market substitution of the state’s commitment
(Luukkonen et al., 2013).
How does government engage in VC activity
Government has to determine the nature and de-
gree of its intervention in the VC sector. It has to 9 One Australian policymaker observed meeting young Australian compa-
nies that had started in the USA rather than Australia because of its closer links to both customers and resources. Many French entrepreneurs have
decide on the type of involvement it wishes to make
in the actual entrepreneurial process or VC cycle of
enterprise investment, nurturing and exit.
Essentially, on an inverse scale of commitment, it
can become directly involved as a venture capitalist
by undertaking direct investments. Conversely, it
can take one step back and recruit one or more ven-
ture managers, usually structured in a general part-
nership (GP), to invest public money in young firms
on its behalf. In effect, the government becomes a
limited partner (LP) in one or more funds managed
by its commercial agents or general partners (GPs).
The third common option is for the government to
promote a Fund of Funds (FoF) structure whereby
a range of investors are sought to create a large
fund that itself invests in several VC funds, which in
turn invest in portfolio companies. DGF engages in
all three activities at present.
The pros and cons of each level of intervention can
be summarised as follows:
Direct Investment requires government to re-
cruit or train government employees or contrac-
tors in the appropriate skill-sets of early-stage
VC investment. Government is unlikely to be
able to offer the autonomy and personal re-
wards demanded by the most successful VC
practitioners in the long term. Indeed, through
its own programmes, the government will occa-
sionally help to train new VC managers who,
once they have the reputation of ownership of
an attractive track record, may leave to set up
their own VC funds.10 The international trend
has been away from government directly run-
ning a VC activity. Critics have argued that this
migrated to London in recent years given the disparity in policies support-
ing new enterprise in France and the UK. 10 This training of new VC managers was an explicitly planned outcome of Australia’s IIF and the UK’s ECF programmes.
36 EVALUATION OF THE DANISH GROWTH FUND | DAMVAD.COM
activity does not lie within government’s remit or
competencies, and investment should be dele-
gated to commercially motivated investment
professionals acting as agents of the state.
However there is a strong tradition of direct en-
gagement in the Nordic countries and this in-
cludes direct VC activity. In the academic re-
search literature, there is quite a lot of hostility
to direct investment by government. The main
concerns are the levels of investment compe-
tencies available and the non-commercial goals
often imposed on ’nominally’ profit-oriented,
public VC funds. Many of these goals are social
and can result in VC funds being placed in inap-
propriate areas (i.e. little attractive deal flow
available), given conflicting goals (i.e. both so-
cial returns to the community and commercial
returns to the investors), and run by managers
with a public service background strongly out of
kilter with the context of severely competitive,
equity markets. However, both direct and indi-
rect, government supported VC programmes
can suffer from agency and moral hazard prob-
lems. All such structure require strong and in-
formed oversight, rigorously defined, and ap-
plied evaluation criteria.
Publicly-supported VC funds, where the govern-
ment provides a significant proportion of the
funds under management, recognise the need
to contract professional investors to realise the
government’s policy goals. The government is
not the sole investor but normally requires the
VC managers (GP) to also attract other institu-
tional investors (LPs) to the fund. The ability of
the GP to attract other investors to realise the
cumulative finance necessary to launch the
11 The UK’s Regional VC Fund was unsuccessful in part because of the negative influence of regional specificity on the quality of deal flow.
fund becomes a condition of competence im-
posed by government on its agent. This struc-
ture does not have government civil servants
acting as venture capitalists. However, govern-
ment has to structure its funds and the related
incentives in a manner attractive to professional
VC investors. In structuring such funds and their
incentives, governments have had to learn in-
dustry standards. Early fund structures were of-
ten poorly designed and managed at a direct
cost to government – and potential firm cli-
ents.11 Again, less experienced GPs are likely
to have more incentive to accept government
co-financing than GPs with an already estab-
lished reputation and track record. The GPs’
ability to attract investors will condition the size
of funds it seeks to raise. This in turn will influ-
ence the number and type of LPs that may wish
to be involved with the fund.
Fund of funds allow government to take a posi-
tion as an LP in a range of individual VC funds.
It allows government to leverage highly each
dollar of government commitment. It can both
diversify its investments as well as creating a
range of VC funds with specific goals, e.g. co-
investing with business angels, supporting
women entrepreneurs etc. Investment manag-
ers like the large exposure of private LPs as this
can limit government’s opportunity to use the
fund for social rather than commercial ends.
However, this private interest may also con-
strain the opportunity of government to focus
the FoF direct to the problem. The FoF structure
also allows very large financial institutions, such
as pension funds, sovereign funds or insurance
companies, to be involved in the asset class
without taking a large percentage of the funds
EVALUATION OF THE DANISH GROWTH FUND | DAMVAD.COM 37
raised in one VC fund. Institutional investors
need sufficient fund committed to have an effect
on the performance of their total portfolio. But at
the same time, they rarely wish to have an ex-
posure greater than 10% in any one fund. A FoF
structure allows them to achieve both goals.
From the government’s perspective, FoF struc-
tures give policy makers considerable flexibility
in engaging in entrepreneurial finance while not
directly intervening in market activities or firm
level investment decisions.
5.2 Ten indicators of ‘good practice’ in a
public-private ‘hybrid’ VC fund
Governments, international agencies such as the
OECD, The World Bank and the European Commis-
sion, and academic and industry researchers have
over time built up a substantial body of empirical and
theoretical knowledge on the practice and perfor-
mance of venture capital. Research has also ad-
dressed the various roles that government may ef-
fectively play in supporting entrepreneurial and in-
novative actions. The following list of ‘good practice
is compiled on the basis of a review of the academic
literature.12 Statements of good practice have also
been tested and examined in conversations with
leading industry practitioners across a number of
countries. Economists have uniformly articulated
the importance of the influence of information asym-
metries in the VC process and its consequences in
adverse selection (Akerlof, 1970). An uneven distri-
bution of skills, knowledge and experience can al-
low agency costs and moral hazard to occur and to
be material problems (Arrow, 1974; Jensen and
Meckling, 1976; Stiglitz and Weiss, 1981). Practi-
tioners expressed such concerns more in terms of
12 Academics including Josh Lerner Marco Da Rin, Karen Wilson, Marc Cowling, Ronald Gilson, James Brander, Gary Bruton, Markku Maula,
governance and performance given their executive
interests.
The development of the 10 indicators (see table 5.1)
seeks to address the nature of public investment in
VC and to explore the means by which government
may sensibly and effectively engage on some basis
of equality with its commercially motivated VC in-
dustry agents. These indicators may likewise be
similarly useful in looking at the practices and future
options of DGF and its Danish Growth Fund activi-
ties. NB. The list (below) of ten indicators does NOT
imply a ranking.
Erkko Autio, Ari Hyytinen, Thomas Hellman, Douglas Cummings and Christian Keuschnigg.
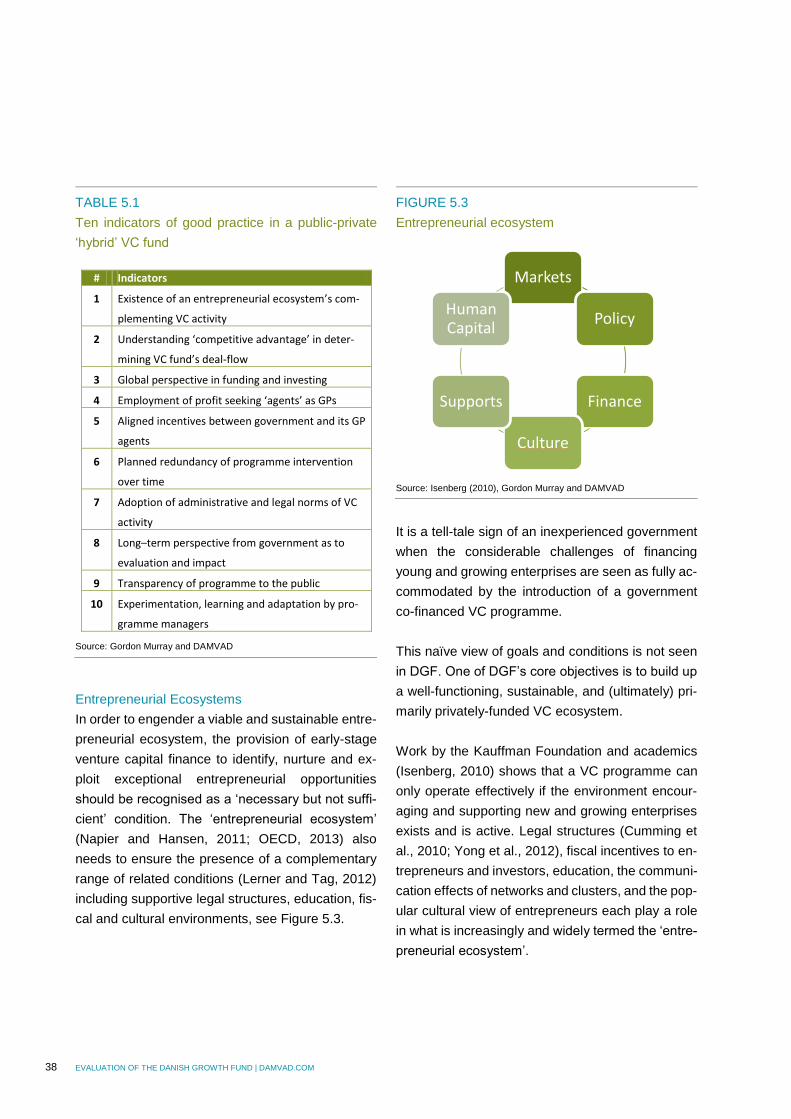
38 EVALUATION OF THE DANISH GROWTH FUND | DAMVAD.COM
TABLE 5.1
Ten indicators of good practice in a public-private
‘hybrid’ VC fund
# Indicators
1 Existence of an entrepreneurial ecosystem’s com-
plementing VC activity
2 Understanding ‘competitive advantage’ in deter-
mining VC fund’s deal-flow
3 Global perspective in funding and investing
4 Employment of profit seeking ‘agents’ as GPs
5 Aligned incentives between government and its GP
agents
6 Planned redundancy of programme intervention
over time
7 Adoption of administrative and legal norms of VC
activity
8 Long–term perspective from government as to
evaluation and impact
9 Transparency of programme to the public
10 Experimentation, learning and adaptation by pro-
gramme managers
Source: Gordon Murray and DAMVAD
Entrepreneurial Ecosystems
In order to engender a viable and sustainable entre-
preneurial ecosystem, the provision of early-stage
venture capital finance to identify, nurture and ex-
ploit exceptional entrepreneurial opportunities
should be recognised as a ‘necessary but not suffi-
cient’ condition. The ‘entrepreneurial ecosystem’
(Napier and Hansen, 2011; OECD, 2013) also
needs to ensure the presence of a complementary
range of related conditions (Lerner and Tag, 2012)
including supportive legal structures, education, fis-
cal and cultural environments, see Figure 5.3.
FIGURE 5.3
Entrepreneurial ecosystem
Source: Isenberg (2010), Gordon Murray and DAMVAD
It is a tell-tale sign of an inexperienced government
when the considerable challenges of financing
young and growing enterprises are seen as fully ac-
commodated by the introduction of a government
co-financed VC programme.
This naïve view of goals and conditions is not seen
in DGF. One of DGF’s core objectives is to build up
a well-functioning, sustainable, and (ultimately) pri-
marily privately-funded VC ecosystem.
Work by the Kauffman Foundation and academics
(Isenberg, 2010) shows that a VC programme can
only operate effectively if the environment encour-
aging and supporting new and growing enterprises
exists and is active. Legal structures (Cumming et
al., 2010; Yong et al., 2012), fiscal incentives to en-
trepreneurs and investors, education, the communi-
cation effects of networks and clusters, and the pop-
ular cultural view of entrepreneurs each play a role
in what is increasingly and widely termed the ‘entre-
preneurial ecosystem’.
Markets
Policy
Finance
Culture
Supports
Human Capital
EVALUATION OF THE DANISH GROWTH FUND | DAMVAD.COM 39
While the OECD’s 2013 country report acknowl-
edges the excellence of public administration in
Denmark, and the Innovation Union Scoreboard
2013 classifies Denmark as an ‘innovation leader’,
the linkage between research and the creation of
marketable products from such research is cited as
a weak point in relation to its direct competitors
(OECD 2013). This identified gap between the re-
search laboratory and the market supports the rele-
vance of DGF’s remit.
It is perhaps fair to note that while the component
parts of an Entrepreneurial Ecosystem certainly ex-
ist in Denmark, their effectiveness and impact could
be improved. While formal financial provision is
high, informal finance in the form of Business An-
gels is low. The OECD also notes that “the supply
of entrepreneurial skills and capabilities remains a
barrier.” Denmark in 2013 ranked 25th among
OECD countries in terms of its self-perception of en-
trepreneurial capabilities. (OECD, 2014, p.73).
Understanding ‘Competitive Advantage’
Venture capital can be defined as the identification
and realisation of exceptional (i.e. world class) busi-
nesses nurtured and grown from their young enter-
prise roots. VC is also strongly associated with new
knowledge/technologies and novel scientific appli-
cations applied to goods and services with interna-
tional, if not global, market appeal. In summary, VC
selection is about excellence and meritocracy. Usu-
ally the best managers and the best technologies
win in competitive markets. Accordingly, the VC pro-
gramme needs to identify critical and internationally
competitive clusters of resources of innovation and
intellectual human capital present in and/or acces-
sible to the target economy. Such inputs form the
basis of exceptional business opportunities and ul-
timately the creation of excellent new enterprises. In
essence, the existence of a high quality deal flow is
pivotal in the success of any (and every) VC pro-
gramme.
In the language of business schools, and supported
by the work of Harvard’s Michael Porter (1990), na-
tions, like businesses, need a ‘sustainable competi-
tive advantage’. Finance and technology are two of
the most globally mobile factors, and the worldwide
search for opportunities for capital or technology at-
tests to this fact.
In this respect, it is fruitful to ask the question as to
‘why Denmark should have a venture capital indus-
try?’. This question can be rephrased as: what
goods and services does – or could – Denmark pro-
duce to nurture world-class enterprises from its uni-
versities, laboratories and workplaces. The point to
be made is that successful VC industries have to
date been based on economies that have been able
to transmute a continued stream of innovative ideas
into highly valuable and competitive businesses. An
accomplished science base entrenched in compa-
nies and academia has been instrumental in the VC
successes of the US, Israel, the UK and other west-
ern economies. It is difficult to envisage the next
generation of Apples, Googles, Skype, Facebook or
the advance of the human genome and other medi-
cal applications being based on ‘average’ techno-
logical competencies. The sectors, services and
technologies in which Denmark will necessarily
have to choose to compete is not a trivial question.
Given the global mobility of capital, the reason for
investors to be attracted to Denmark cannot remain
assumed or unspoken. The policy ambition of a via-
ble long-term VC industry itself implies a belief in the
existence of deep resources of world-class technol-
ogy(ies), intellectual property and/or other forms of
exceptional knowledge or expertise resident in an
elite cadre of Danish enterprises. There needs to be
a consensus as to the identity, nature and value of
these exceptional resources, and thus opportunities
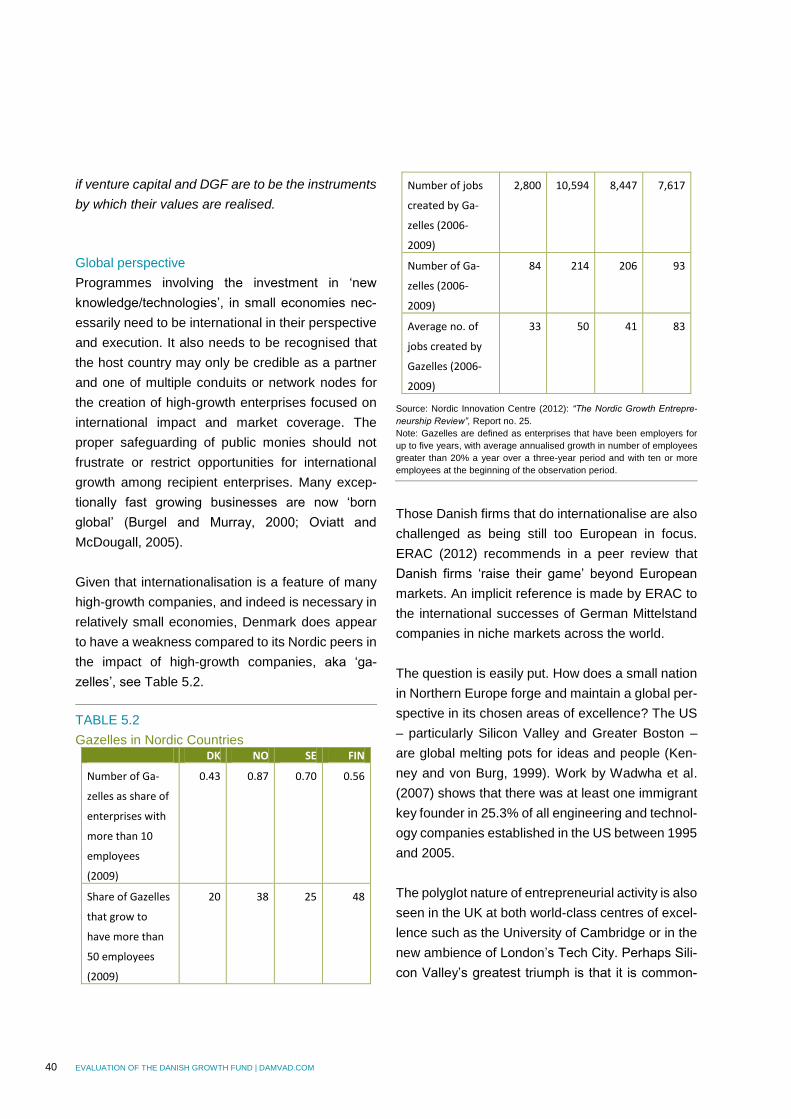
40 EVALUATION OF THE DANISH GROWTH FUND | DAMVAD.COM
if venture capital and DGF are to be the instruments
by which their values are realised.
Global perspective
Programmes involving the investment in ‘new
knowledge/technologies’, in small economies nec-
essarily need to be international in their perspective
and execution. It also needs to be recognised that
the host country may only be credible as a partner
and one of multiple conduits or network nodes for
the creation of high-growth enterprises focused on
international impact and market coverage. The
proper safeguarding of public monies should not
frustrate or restrict opportunities for international
growth among recipient enterprises. Many excep-
tionally fast growing businesses are now ‘born
global’ (Burgel and Murray, 2000; Oviatt and
McDougall, 2005).
Given that internationalisation is a feature of many
high-growth companies, and indeed is necessary in
relatively small economies, Denmark does appear
to have a weakness compared to its Nordic peers in
the impact of high-growth companies, aka ‘ga-
zelles’, see Table 5.2.
TABLE 5.2
Gazelles in Nordic Countries DK NO SE FIN
Number of Ga-
zelles as share of
enterprises with
more than 10
employees
(2009)
0.43 0.87 0.70 0.56
Share of Gazelles
that grow to
have more than
50 employees
(2009)
20 38 25 48
Number of jobs
created by Ga-
zelles (2006-
2009)
2,800 10,594 8,447 7,617
Number of Ga-
zelles (2006-
2009)
84 214 206 93
Average no. of
jobs created by
Gazelles (2006-
2009)
33 50 41 83
Source: Nordic Innovation Centre (2012): “The Nordic Growth Entrepre-
neurship Review”, Report no. 25.
Note: Gazelles are defined as enterprises that have been employers for
up to five years, with average annualised growth in number of employees
greater than 20% a year over a three-year period and with ten or more
employees at the beginning of the observation period.
Those Danish firms that do internationalise are also
challenged as being still too European in focus.
ERAC (2012) recommends in a peer review that
Danish firms ‘raise their game’ beyond European
markets. An implicit reference is made by ERAC to
the international successes of German Mittelstand
companies in niche markets across the world.
The question is easily put. How does a small nation
in Northern Europe forge and maintain a global per-
spective in its chosen areas of excellence? The US
– particularly Silicon Valley and Greater Boston –
are global melting pots for ideas and people (Ken-
ney and von Burg, 1999). Work by Wadwha et al.
(2007) shows that there was at least one immigrant
key founder in 25.3% of all engineering and technol-
ogy companies established in the US between 1995
and 2005.
The polyglot nature of entrepreneurial activity is also
seen in the UK at both world-class centres of excel-
lence such as the University of Cambridge or in the
new ambience of London’s Tech City. Perhaps Sili-
con Valley’s greatest triumph is that it is common-
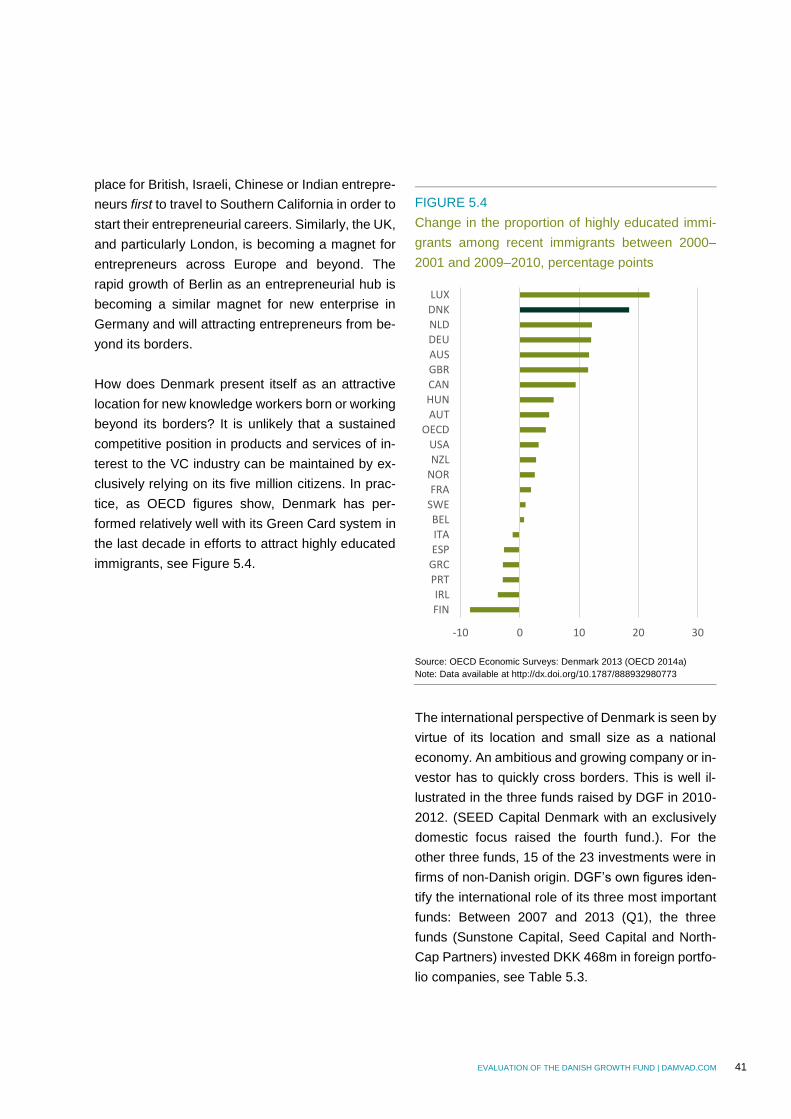
EVALUATION OF THE DANISH GROWTH FUND | DAMVAD.COM 41
place for British, Israeli, Chinese or Indian entrepre-
neurs first to travel to Southern California in order to
start their entrepreneurial careers. Similarly, the UK,
and particularly London, is becoming a magnet for
entrepreneurs across Europe and beyond. The
rapid growth of Berlin as an entrepreneurial hub is
becoming a similar magnet for new enterprise in
Germany and will attracting entrepreneurs from be-
yond its borders.
How does Denmark present itself as an attractive
location for new knowledge workers born or working
beyond its borders? It is unlikely that a sustained
competitive position in products and services of in-
terest to the VC industry can be maintained by ex-
clusively relying on its five million citizens. In prac-
tice, as OECD figures show, Denmark has per-
formed relatively well with its Green Card system in
the last decade in efforts to attract highly educated
immigrants, see Figure 5.4.
FIGURE 5.4
Change in the proportion of highly educated immi-
grants among recent immigrants between 2000–
2001 and 2009–2010, percentage points
Source: OECD Economic Surveys: Denmark 2013 (OECD 2014a)
Note: Data available at http://dx.doi.org/10.1787/888932980773
The international perspective of Denmark is seen by
virtue of its location and small size as a national
economy. An ambitious and growing company or in-
vestor has to quickly cross borders. This is well il-
lustrated in the three funds raised by DGF in 2010-
2012. (SEED Capital Denmark with an exclusively
domestic focus raised the fourth fund.). For the
other three funds, 15 of the 23 investments were in
firms of non-Danish origin. DGF’s own figures iden-
tify the international role of its three most important
funds: Between 2007 and 2013 (Q1), the three
funds (Sunstone Capital, Seed Capital and North-
Cap Partners) invested DKK 468m in foreign portfo-
lio companies, see Table 5.3.
-10 0 10 20 30
FIN
IRL
PRT
GRC
ESP
ITA
BELSWE
FRA
NOR
NZL
USA
OECD
AUT
HUN
CAN
GBR
AUS
DEUNLD
DNK
LUX
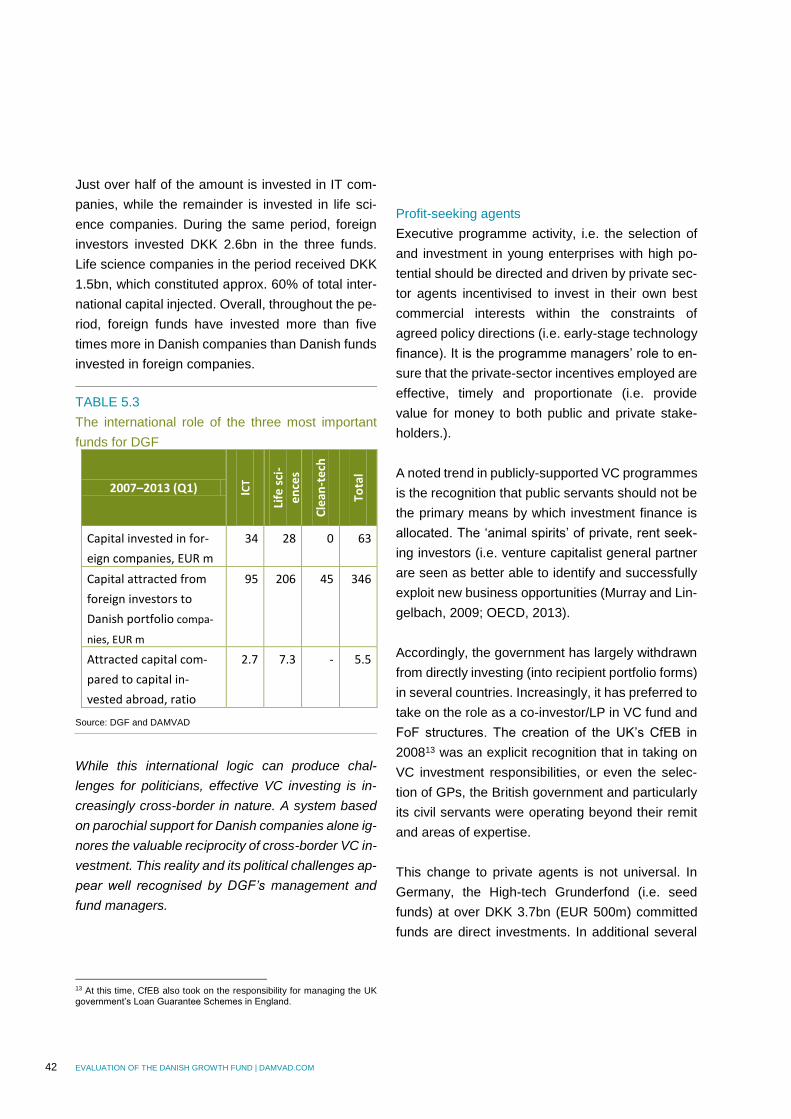
42 EVALUATION OF THE DANISH GROWTH FUND | DAMVAD.COM
Just over half of the amount is invested in IT com-
panies, while the remainder is invested in life sci-
ence companies. During the same period, foreign
investors invested DKK 2.6bn in the three funds.
Life science companies in the period received DKK
1.5bn, which constituted approx. 60% of total inter-
national capital injected. Overall, throughout the pe-
riod, foreign funds have invested more than five
times more in Danish companies than Danish funds
invested in foreign companies.
TABLE 5.3
The international role of the three most important
funds for DGF
2007–2013 (Q1) ICT
Life
sci
-
en
ces
Cle
an-t
ech
Tota
l
Capital invested in for-
eign companies, EUR m
34 28 0 63
Capital attracted from
foreign investors to
Danish portfolio compa-
nies, EUR m
95 206 45 346
Attracted capital com-
pared to capital in-
vested abroad, ratio
2.7 7.3 - 5.5
Source: DGF and DAMVAD
While this international logic can produce chal-
lenges for politicians, effective VC investing is in-
creasingly cross-border in nature. A system based
on parochial support for Danish companies alone ig-
nores the valuable reciprocity of cross-border VC in-
vestment. This reality and its political challenges ap-
pear well recognised by DGF’s management and
fund managers.
13 At this time, CfEB also took on the responsibility for managing the UK government’s Loan Guarantee Schemes in England.
Profit-seeking agents
Executive programme activity, i.e. the selection of
and investment in young enterprises with high po-
tential should be directed and driven by private sec-
tor agents incentivised to invest in their own best
commercial interests within the constraints of
agreed policy directions (i.e. early-stage technology
finance). It is the programme managers’ role to en-
sure that the private-sector incentives employed are
effective, timely and proportionate (i.e. provide
value for money to both public and private stake-
holders.).
A noted trend in publicly-supported VC programmes
is the recognition that public servants should not be
the primary means by which investment finance is
allocated. The ‘animal spirits’ of private, rent seek-
ing investors (i.e. venture capitalist general partner
are seen as better able to identify and successfully
exploit new business opportunities (Murray and Lin-
gelbach, 2009; OECD, 2013).
Accordingly, the government has largely withdrawn
from directly investing (into recipient portfolio forms)
in several countries. Increasingly, it has preferred to
take on the role as a co-investor/LP in VC fund and
FoF structures. The creation of the UK’s CfEB in
200813 was an explicit recognition that in taking on
VC investment responsibilities, or even the selec-
tion of GPs, the British government and particularly
its civil servants were operating beyond their remit
and areas of expertise.
This change to private agents is not universal. In
Germany, the High-tech Grunderfond (i.e. seed
funds) at over DKK 3.7bn (EUR 500m) committed
funds are direct investments. In additional several
EVALUATION OF THE DANISH GROWTH FUND | DAMVAD.COM 43
states also offer programmes directly managed by
state government employees.14
This view of a limited role for government employ-
ees also supported the growing importance of FoF
structures in the substantial UK public supported VC
activity. For those activities that assume a role for
publicly-funded programmes, we would expect that
the persons involved in such programmes would
also be incentivised in a manner equivalent to pri-
vate VC agents, i.e. a direct participation in the
‘carry’, i.e. the share of net capital gain created by
the investment. Such results-based rewards exist
for investment staff in, for example, HTGF, CfEB
Finnish Industry Investment as well as in DGF.
These examples illustrate and stress the need for
aligned incentives for all participants in the VC pro-
cess, including entrepreneurs, venture capitalists
and (direct and indirect) investors. The need for
alignment also lends some support for the pari
passu model and the refocusing of DGF towards in-
direct investments through FoF structures run by
private entities.
DGF’s increasing and now predominant use of indi-
rect investment via private agents follows common
government practice. The continued but limited use
of direct investing via DGF Ventures is the one con-
tradiction to this overall organisation trend.
Aligned Incentives
The combined social and economic returns to gov-
ernment of a successful investment programme are
likely to be greater than the financial returns cap-
tured exclusively by private investors. These inves-
tors cannot capture or monopolise the valuable ex-
ternalities or spillover effects that can occur with 14 I am indebted to Alexander von Frankenburg, CEO of HTG, for these observations on Germany.
major innovations. Therefore, they are likely to pro-
vide or support a lesser supply of new goods and
services than government would see as socially op-
timal. Accordingly, it is appropriate that programmes
can structure incentives that design preferential re-
turns to private investors to ensure their continued
interest and engagement, i.e. asymmetric rewards.
The crafting and implementation of incentives to at-
tract all parties to engage in early-stage VC activity
is central to a well-designed programme (Jä-
äskeläinen, Maula and Murray, 2007). There are no
absolute rules, and a wide spectrum of opinions is
held regarding the role of incentives to both inves-
tors (LPs) and VC fund managers (GPs).
At one end of this spectrum is the view that all deal-
ings should be pari passu. That is, all investors are
treated equally in all aspects of capital commitment
and profit distribution. There are no greater (or
lesser) incentives for private as opposed to public
investors. For those holding this view, the preferen-
tial incentivising of private investors introduces a
flaw into any programme. Such beneficiaries are
likely to act in part because of the additional or bo-
nus incentives offered regardless of the underlying
quality of the firms in which they are asked to invest.
Here, preferential or asymmetric investments are
believed to bias an investment decision which
should be made exclusively on the economic merits
and business potential of the portfolio company.
The contrary view put forward by its advocates is
that the difficulties of early-stage investing are le-
gion. Accordingly, it may be entirely rational for pri-
vate investors not to undertake any seed or early
stage VC activity. Indeed, several VC firms specifi-
cally note that they will not do start-up investment or
44 EVALUATION OF THE DANISH GROWTH FUND | DAMVAD.COM
make initial investment under a certain size. These
boundaries usually preclude most early-stage
deals.15 The paucity of seed, start-up and early-
stage VC activity across Europe and beyond over
the last ten years supports their concerns.
Supporters of skewed rewards argue that govern-
ment has a legitimate role in improving incentives to
private investors by adjusting the distribution of re-
wards from successful investments asymmetrically
to reward private investors. Such a preference rec-
ognises that the government gains additional spillo-
vers and externalities (Jaffe, 1989), such that the
social and economic returns to an enterprise invest-
ment may be significantly larger than the private re-
turns that LPs are able to capture (CBER, 2010;
Griliches, 1992). The fact that spillovers are im-
portant lends support to the case that the govern-
ment can preferentially reward the private sector
while still providing sufficiently attractive social and
economic returns to the government investor.
Those in favour of pari passu challenge the above
and state that asymmetric rewards are in danger of
producing ‘soft’ and therefore unreliable investors.
The asymmetries also allow investment managers
not to have to strive as hard as when such incen-
tives are not present. It is argued that the managers,
like the investors, become beguiled and seduced by
unearned benefits. A frequently cited example is of
government-supported VC funds that allow the
managers (GPs) to earn an attractive living from the
fee income earned in managing the fund regardless
of the success or failure of the enterprises fi-
nanced.16 Their argument is that anything that
makes a programme investment different (i.e. eas-
ier) than such an investment without government 15 See the members’ register in the documentation of the British Venture Capital Association and other country-based VC associations. 16 This criticism has been made of SBICs, and several VC programmes associated with regional funding.
help will not help nurture and ‘battle-harden’ an in-
dustry that will eventually have to succeed compet-
itively on its own merits and without government
support.
Both pari passu and asymmetric rewards have their
place depending on the circumstances and the con-
text. HTGF managers in Germany support the pari
passu model. They do not wish to appear to be dif-
ferent from the private VC investors who are their
partners. In contrast, the policy architects of the
VIGO programme17 in Finland see the need for an
asymmetry of benefits as central to their ability to
intervene in the seed market and to promote the
funding by private investors of very risky new-tech-
nology enterprises. They stress that the rewards of
asymmetry are only realised when a real profit is
generated.
Dutch seed and pre-seed VC schemes structure a
capped return to the state and a bias in favour of the
private investor. However, if the investment goes on
to make excellent returns, the third stage of the
funding commitments seeks to move the rewards
back towards a pari passu structure. However, in
practice, asymmetry of distribution is the normal
outcome.
CfEL managers in the UK like the clarity of pari
passu but also recognise that the state’s capping of
its own returns (i.e. a form of asymmetry) has a pow-
erful leverage effect on the returns of private inves-
tors. Although an insufficient sample, it is interesting
to observe that those managers recruited from the
private sector appeared to be more keen on a pari
passu model which stressed that government-as-
sisted funds should work exactly like private agents.
17 Vigo is an accelerator programme for start-up companies. Vigo supports high-quality, internationally focused companies by connecting promising start-ups with experienced entrepreneurs and funding. Finnvera is part of the steering group for Vigo.
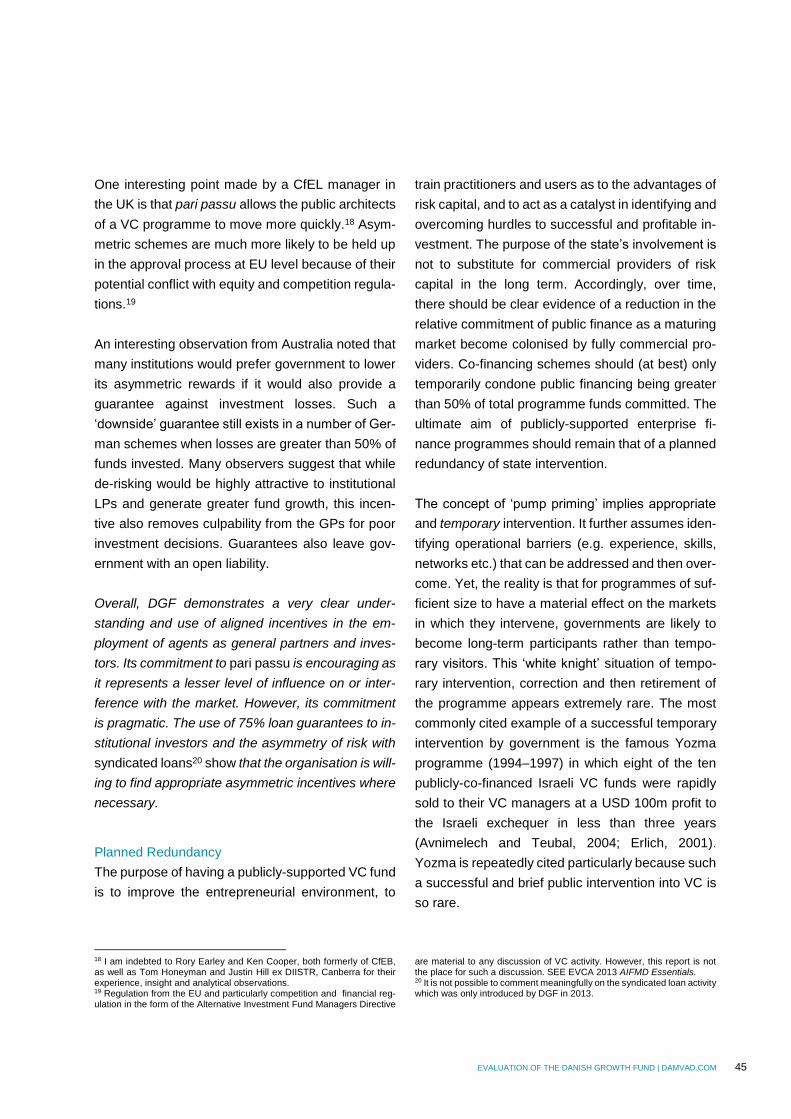
EVALUATION OF THE DANISH GROWTH FUND | DAMVAD.COM 45
One interesting point made by a CfEL manager in
the UK is that pari passu allows the public architects
of a VC programme to move more quickly.18 Asym-
metric schemes are much more likely to be held up
in the approval process at EU level because of their
potential conflict with equity and competition regula-
tions.19
An interesting observation from Australia noted that
many institutions would prefer government to lower
its asymmetric rewards if it would also provide a
guarantee against investment losses. Such a
‘downside’ guarantee still exists in a number of Ger-
man schemes when losses are greater than 50% of
funds invested. Many observers suggest that while
de-risking would be highly attractive to institutional
LPs and generate greater fund growth, this incen-
tive also removes culpability from the GPs for poor
investment decisions. Guarantees also leave gov-
ernment with an open liability.
Overall, DGF demonstrates a very clear under-
standing and use of aligned incentives in the em-
ployment of agents as general partners and inves-
tors. Its commitment to pari passu is encouraging as
it represents a lesser level of influence on or inter-
ference with the market. However, its commitment
is pragmatic. The use of 75% loan guarantees to in-
stitutional investors and the asymmetry of risk with
syndicated loans20 show that the organisation is will-
ing to find appropriate asymmetric incentives where
necessary.
Planned Redundancy
The purpose of having a publicly-supported VC fund
is to improve the entrepreneurial environment, to
18 I am indebted to Rory Earley and Ken Cooper, both formerly of CfEB, as well as Tom Honeyman and Justin Hill ex DIISTR, Canberra for their experience, insight and analytical observations. 19 Regulation from the EU and particularly competition and financial reg-ulation in the form of the Alternative Investment Fund Managers Directive
train practitioners and users as to the advantages of
risk capital, and to act as a catalyst in identifying and
overcoming hurdles to successful and profitable in-
vestment. The purpose of the state’s involvement is
not to substitute for commercial providers of risk
capital in the long term. Accordingly, over time,
there should be clear evidence of a reduction in the
relative commitment of public finance as a maturing
market become colonised by fully commercial pro-
viders. Co-financing schemes should (at best) only
temporarily condone public financing being greater
than 50% of total programme funds committed. The
ultimate aim of publicly-supported enterprise fi-
nance programmes should remain that of a planned
redundancy of state intervention.
The concept of ‘pump priming’ implies appropriate
and temporary intervention. It further assumes iden-
tifying operational barriers (e.g. experience, skills,
networks etc.) that can be addressed and then over-
come. Yet, the reality is that for programmes of suf-
ficient size to have a material effect on the markets
in which they intervene, governments are likely to
become long-term participants rather than tempo-
rary visitors. This ‘white knight’ situation of tempo-
rary intervention, correction and then retirement of
the programme appears extremely rare. The most
commonly cited example of a successful temporary
intervention by government is the famous Yozma
programme (1994–1997) in which eight of the ten
publicly-co-financed Israeli VC funds were rapidly
sold to their VC managers at a USD 100m profit to
the Israeli exchequer in less than three years
(Avnimelech and Teubal, 2004; Erlich, 2001).
Yozma is repeatedly cited particularly because such
a successful and brief public intervention into VC is
so rare.
are material to any discussion of VC activity. However, this report is not the place for such a discussion. SEE EVCA 2013 AIFMD Essentials. 20 It is not possible to comment meaningfully on the syndicated loan activity which was only introduced by DGF in 2013.
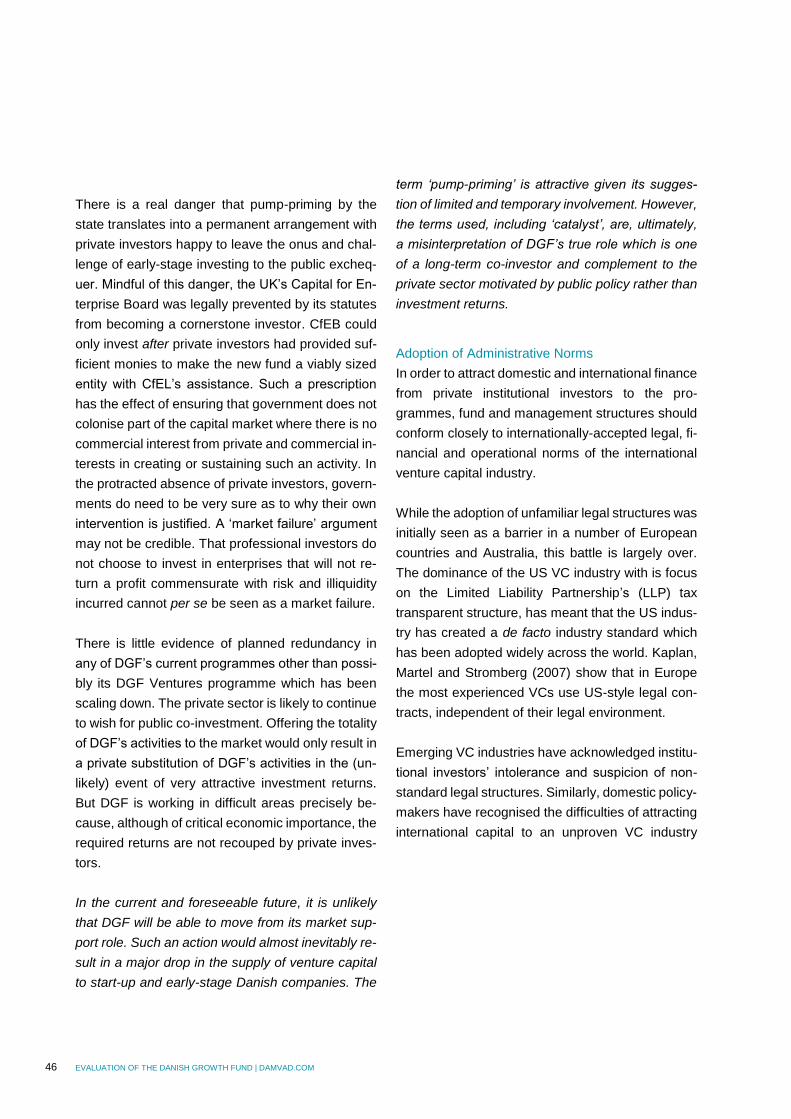
46 EVALUATION OF THE DANISH GROWTH FUND | DAMVAD.COM
There is a real danger that pump-priming by the
state translates into a permanent arrangement with
private investors happy to leave the onus and chal-
lenge of early-stage investing to the public excheq-
uer. Mindful of this danger, the UK’s Capital for En-
terprise Board was legally prevented by its statutes
from becoming a cornerstone investor. CfEB could
only invest after private investors had provided suf-
ficient monies to make the new fund a viably sized
entity with CfEL’s assistance. Such a prescription
has the effect of ensuring that government does not
colonise part of the capital market where there is no
commercial interest from private and commercial in-
terests in creating or sustaining such an activity. In
the protracted absence of private investors, govern-
ments do need to be very sure as to why their own
intervention is justified. A ‘market failure’ argument
may not be credible. That professional investors do
not choose to invest in enterprises that will not re-
turn a profit commensurate with risk and illiquidity
incurred cannot per se be seen as a market failure.
There is little evidence of planned redundancy in
any of DGF’s current programmes other than possi-
bly its DGF Ventures programme which has been
scaling down. The private sector is likely to continue
to wish for public co-investment. Offering the totality
of DGF’s activities to the market would only result in
a private substitution of DGF’s activities in the (un-
likely) event of very attractive investment returns.
But DGF is working in difficult areas precisely be-
cause, although of critical economic importance, the
required returns are not recouped by private inves-
tors.
In the current and foreseeable future, it is unlikely
that DGF will be able to move from its market sup-
port role. Such an action would almost inevitably re-
sult in a major drop in the supply of venture capital
to start-up and early-stage Danish companies. The
term ‘pump-priming’ is attractive given its sugges-
tion of limited and temporary involvement. However,
the terms used, including ‘catalyst’, are, ultimately,
a misinterpretation of DGF’s true role which is one
of a long-term co-investor and complement to the
private sector motivated by public policy rather than
investment returns.
Adoption of Administrative Norms
In order to attract domestic and international finance
from private institutional investors to the pro-
grammes, fund and management structures should
conform closely to internationally-accepted legal, fi-
nancial and operational norms of the international
venture capital industry.
While the adoption of unfamiliar legal structures was
initially seen as a barrier in a number of European
countries and Australia, this battle is largely over.
The dominance of the US VC industry with is focus
on the Limited Liability Partnership’s (LLP) tax
transparent structure, has meant that the US indus-
try has created a de facto industry standard which
has been adopted widely across the world. Kaplan,
Martel and Stromberg (2007) show that in Europe
the most experienced VCs use US-style legal con-
tracts, independent of their legal environment.
Emerging VC industries have acknowledged institu-
tional investors’ intolerance and suspicion of non-
standard legal structures. Similarly, domestic policy-
makers have recognised the difficulties of attracting
international capital to an unproven VC industry
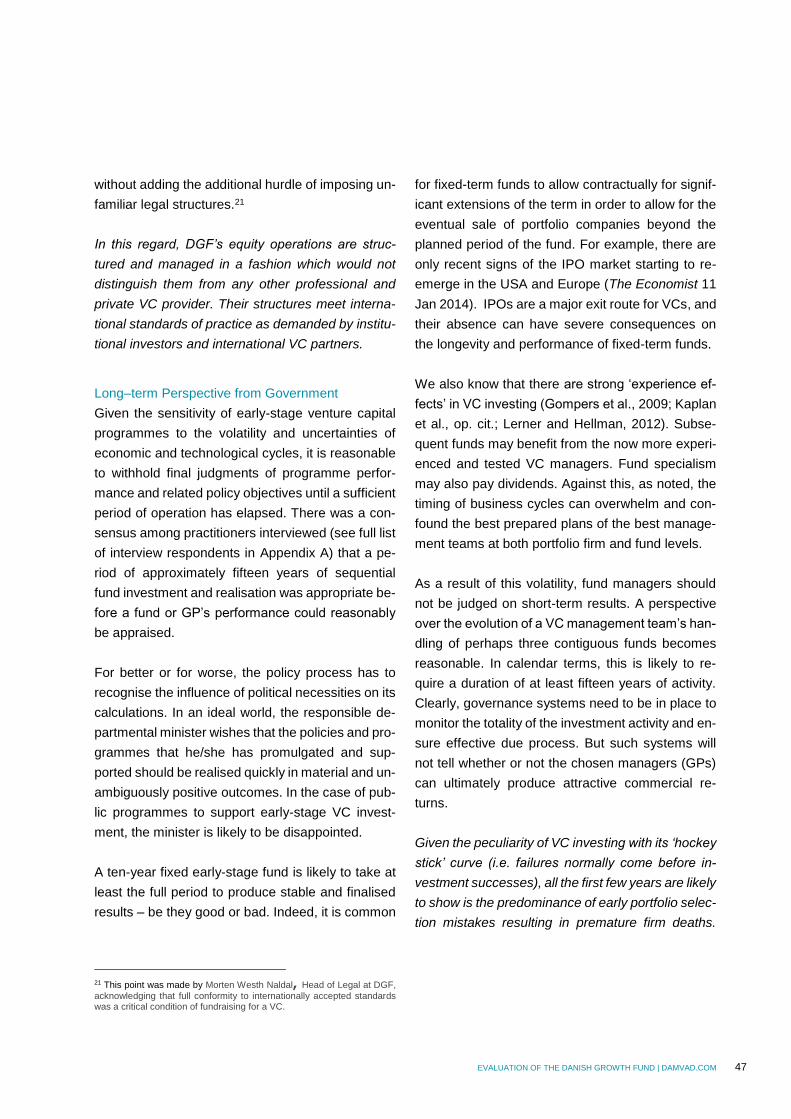
EVALUATION OF THE DANISH GROWTH FUND | DAMVAD.COM 47
without adding the additional hurdle of imposing un-
familiar legal structures.21
In this regard, DGF’s equity operations are struc-
tured and managed in a fashion which would not
distinguish them from any other professional and
private VC provider. Their structures meet interna-
tional standards of practice as demanded by institu-
tional investors and international VC partners.
Long–term Perspective from Government
Given the sensitivity of early-stage venture capital
programmes to the volatility and uncertainties of
economic and technological cycles, it is reasonable
to withhold final judgments of programme perfor-
mance and related policy objectives until a sufficient
period of operation has elapsed. There was a con-
sensus among practitioners interviewed (see full list
of interview respondents in Appendix A) that a pe-
riod of approximately fifteen years of sequential
fund investment and realisation was appropriate be-
fore a fund or GP’s performance could reasonably
be appraised.
For better or for worse, the policy process has to
recognise the influence of political necessities on its
calculations. In an ideal world, the responsible de-
partmental minister wishes that the policies and pro-
grammes that he/she has promulgated and sup-
ported should be realised quickly in material and un-
ambiguously positive outcomes. In the case of pub-
lic programmes to support early-stage VC invest-
ment, the minister is likely to be disappointed.
A ten-year fixed early-stage fund is likely to take at
least the full period to produce stable and finalised
results – be they good or bad. Indeed, it is common
21 This point was made by Morten Westh Naldal, Head of Legal at DGF,
acknowledging that full conformity to internationally accepted standards was a critical condition of fundraising for a VC.
for fixed-term funds to allow contractually for signif-
icant extensions of the term in order to allow for the
eventual sale of portfolio companies beyond the
planned period of the fund. For example, there are
only recent signs of the IPO market starting to re-
emerge in the USA and Europe (The Economist 11
Jan 2014). IPOs are a major exit route for VCs, and
their absence can have severe consequences on
the longevity and performance of fixed-term funds.
We also know that there are strong ‘experience ef-
fects’ in VC investing (Gompers et al., 2009; Kaplan
et al., op. cit.; Lerner and Hellman, 2012). Subse-
quent funds may benefit from the now more experi-
enced and tested VC managers. Fund specialism
may also pay dividends. Against this, as noted, the
timing of business cycles can overwhelm and con-
found the best prepared plans of the best manage-
ment teams at both portfolio firm and fund levels.
As a result of this volatility, fund managers should
not be judged on short-term results. A perspective
over the evolution of a VC management team’s han-
dling of perhaps three contiguous funds becomes
reasonable. In calendar terms, this is likely to re-
quire a duration of at least fifteen years of activity.
Clearly, governance systems need to be in place to
monitor the totality of the investment activity and en-
sure effective due process. But such systems will
not tell whether or not the chosen managers (GPs)
can ultimately produce attractive commercial re-
turns.
Given the peculiarity of VC investing with its ‘hockey
stick’ curve (i.e. failures normally come before in-
vestment successes), all the first few years are likely
to show is the predominance of early portfolio selec-
tion mistakes resulting in premature firm deaths.
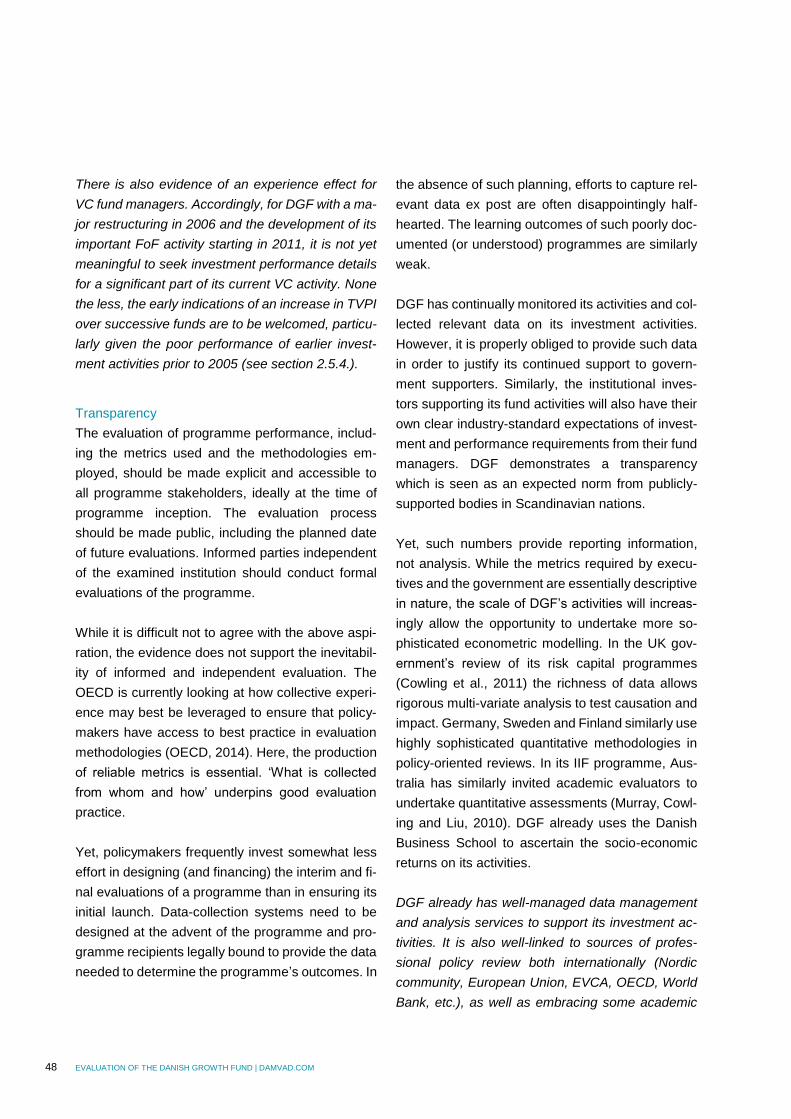
48 EVALUATION OF THE DANISH GROWTH FUND | DAMVAD.COM
There is also evidence of an experience effect for
VC fund managers. Accordingly, for DGF with a ma-
jor restructuring in 2006 and the development of its
important FoF activity starting in 2011, it is not yet
meaningful to seek investment performance details
for a significant part of its current VC activity. None
the less, the early indications of an increase in TVPI
over successive funds are to be welcomed, particu-
larly given the poor performance of earlier invest-
ment activities prior to 2005 (see section 2.5.4.).
Transparency
The evaluation of programme performance, includ-
ing the metrics used and the methodologies em-
ployed, should be made explicit and accessible to
all programme stakeholders, ideally at the time of
programme inception. The evaluation process
should be made public, including the planned date
of future evaluations. Informed parties independent
of the examined institution should conduct formal
evaluations of the programme.
While it is difficult not to agree with the above aspi-
ration, the evidence does not support the inevitabil-
ity of informed and independent evaluation. The
OECD is currently looking at how collective experi-
ence may best be leveraged to ensure that policy-
makers have access to best practice in evaluation
methodologies (OECD, 2014). Here, the production
of reliable metrics is essential. ‘What is collected
from whom and how’ underpins good evaluation
practice.
Yet, policymakers frequently invest somewhat less
effort in designing (and financing) the interim and fi-
nal evaluations of a programme than in ensuring its
initial launch. Data-collection systems need to be
designed at the advent of the programme and pro-
gramme recipients legally bound to provide the data
needed to determine the programme’s outcomes. In
the absence of such planning, efforts to capture rel-
evant data ex post are often disappointingly half-
hearted. The learning outcomes of such poorly doc-
umented (or understood) programmes are similarly
weak.
DGF has continually monitored its activities and col-
lected relevant data on its investment activities.
However, it is properly obliged to provide such data
in order to justify its continued support to govern-
ment supporters. Similarly, the institutional inves-
tors supporting its fund activities will also have their
own clear industry-standard expectations of invest-
ment and performance requirements from their fund
managers. DGF demonstrates a transparency
which is seen as an expected norm from publicly-
supported bodies in Scandinavian nations.
Yet, such numbers provide reporting information,
not analysis. While the metrics required by execu-
tives and the government are essentially descriptive
in nature, the scale of DGF’s activities will increas-
ingly allow the opportunity to undertake more so-
phisticated econometric modelling. In the UK gov-
ernment’s review of its risk capital programmes
(Cowling et al., 2011) the richness of data allows
rigorous multi-variate analysis to test causation and
impact. Germany, Sweden and Finland similarly use
highly sophisticated quantitative methodologies in
policy-oriented reviews. In its IIF programme, Aus-
tralia has similarly invited academic evaluators to
undertake quantitative assessments (Murray, Cowl-
ing and Liu, 2010). DGF already uses the Danish
Business School to ascertain the socio-economic
returns on its activities.
DGF already has well-managed data management
and analysis services to support its investment ac-
tivities. It is also well-linked to sources of profes-
sional policy review both internationally (Nordic
community, European Union, EVCA, OECD, World
Bank, etc.), as well as embracing some academic
EVALUATION OF THE DANISH GROWTH FUND | DAMVAD.COM 49
collaborations. Over time, DGF will probably in-
creasingly wish to undertake a detailed quantitative
performance review to ascertain investment and
policy impacts and effectiveness at the level of the
firm and the fund. (It may also wish to look at the
use of randomised trail methodologies which are in-
creasingly being employed to improve the accuracy
of empirical findings.) This is an area where Nordic
countries have the potential to be exemplars in the
methodologies of rigorously appraised public policy
action.
Experimentation, Learning and Adaptation
Successful programme execution should be charac-
terised by continued learning, experimentation and
adaptation. Programme managers should be able to
demonstrate that the resultant programmes are sig-
nificantly informed by a deep familiarity, including
strengths and weaknesses of design and execution,
with equivalent programmes adopted by other na-
tional and international (public and private) enter-
prise finance agencies.
There is an increasingly substantial, body of
knowledge of publicly-supported VC fund activity,
both from practitioners and academics, available
across the advanced economies of western coun-
tries. Most countries of Western Europe have some
form of VC programme with the state acting as a
sponsor and/or investor. The European Commis-
sion places considerable emphasis on the role of
VC in economic development within the European
Union. The FoF programme of the European Invest-
ment Fund is probably the largest scheme of its kind
in the world. Yet, most VC programmes remain
strongly parochial in their structure and implemen-
tation. Contiguous country programmes may have
an influence, but foreign programmes are frequently
poorly understood and too readily seen as inappro-
priate within specific cultures or context.
Thus, there is a need for DGF to be oriented to-
wards similar government institutions in other coun-
tries to learn from their experiences – both good and
bad – and to adapt to these. Based on the interviews
(see Appendix A), DGF appears to be active in the
European VC community and actively participates
in OECD work on the subject. Thus, DGF is in a po-
sition to access new knowledge in the field from
both within and outside the Nordic community.
In the context of DGF, there is evidence of experi-
mentation, learning and adaptation. The wholesale
changes since 2006 in fund type, structure and fo-
cus support this assertion. The spinoff of Sunstone
as an autonomous set of funds indicates a boldness
to address market realities. Similarly, the removal of
smaller funds and the separation of DGF activity
from regional-investment pressures indicate a level
of professionalism and political courage. More re-
cently, the advent of the syndicated loans to VC
portfolio firms in 2011 is an experiment that directly
addresses funding issues in the early-stage enter-
prise where VC’s equity capital is constrained.
Table 5.4 below summarises the ten indicators com-
pared to the peer countries of our study. It should
be stressed that such a rating is highly subjective. It
is used to stimulate reflection and discussion rather
than to be taken as an absolute statement. It would
be useful to conduct this exercise among the man-
agement of DGF itself.
TABLE 5.4
The 10 indicators compared to the peer countries
# Indicators
Subjective rat-ing against se-
lected European peers
1 Existence of an entrepreneurial ecosystem complementing VC activity
2
2 Understanding ‘competitive ad-vantage’ in determining VC fund’s deal-flow
2

50 EVALUATION OF THE DANISH GROWTH FUND | DAMVAD.COM
3 Global perspective in funding and investing
3
4 Employment of profit seeking ‘agents’ as GPs
3
5 Aligned incentives between gov-ernment and its GP agents
4
6 Planned redundancy of pro-gramme intervention over time
2
7 Adoption of administrative and legal norms of VC activity
4
8 Long-term perspective from gov-ernment as to evaluation and impact
3
9 Transparency of programme to the public
4
10 Experimentation, learning and adaptation by programme man-agers
4
Source: Gordon Murray and DAMVAD
Note: 1 = much worse than; 3=same as; 5; much better than
5.3 The Evaluation of Publicly-supported VC
Activity
The popularity of government involvement in early-
stage VC activity cannot yet be measured by a sim-
ilar number of robust evaluations of the outcomes of
such policy initiatives in entrepreneurial finance.
The OECD (2013) and the Swedish Agency for
Growth Policy Analysis (2009) have each looked in
some detail at the variable supply and quality of
evaluative materials. An implicit assumption of such
criticisms is that it is difficult to promote cross-pro-
gramme or country learning if the analyses and
methodologies available are not robust. The ideal
system might be a general agreement on the nature
and purpose of an evaluation prior to the com-
mencement of the programme.
Such an ex-ante agreement would include the data
to be collected and a broad design of the methodol-
ogies and analyses to be used. Interim and final (ex-
post) evaluations would use, refine and augment
the earlier methodologies and analyses. The actual
evaluators would be selected on the basis of both
their expertise and their independence of any inter-
est in the programme or its outcomes. Such an ideal
and timely process is rarely the norm. Most evalua-
tions of public programmes are likely to be internally
conducted with considerable restrictions on their
use or dissemination. Public audits of government
programmes do not necessarily resolve this prob-
lem of independent evaluation.
It cannot be assumed that the government or its of-
ficers will invariably understand VC sufficiently to
conduct rigorous evaluations. Like many financial
instruments, VC is a complex process. Information
asymmetries also exist between government and its
VC agents. Further, the long-term nature of VC in-
vestment raises particular issues of timing and con-
text. LPs, including government, will be asked to
commit finances for a fixed period of often ten years
or more. For some complex technology investments
with a necessarily long lifecycle of development and
testing, as in biotech and medical products, ten
years may not be a sufficiently extended horizon for
the accurate assessment of economic outcomes.
This extended periodicity raises important issues.
Evaluations should not be left until the policy or pro-
gramme is finished. Interim evaluations are neces-
sary in any proper process of public governance.
Countries with limited experience of VC pro-
grammes particularly might need to conduct early
interim evaluations. Such evaluations have to deal
with the problem of partial information. Cowling and
Murray (OECD, 2013) looking at UK evaluations,
have noted the sensitivity of programme outcomes
to the timing of the assessment. A commercial or
technological breakthrough as well as changes in
the wider economic environment are likely to rapidly
change a firm or fund’s economic prospects.
The extended period of VC investing and harvesting
raises further problems and particularly that of the
EVALUATION OF THE DANISH GROWTH FUND | DAMVAD.COM 51
influence of the economic cycle. Like all market ac-
tivity, VC can be reduced to buying low and selling
high. With short-term economic cycles occurring
every 8 to 12 years, the exact time at which invest-
ments were made can dwarf other selection or per-
formance effects. VC partners and investors enter-
ing the US or UK market in 1996–1998 rarely failed
to make money in a major technology boom. The
same investors starting second or follow-on funds in
2000 and 2001 saw stock markets and company
exit valuations collapse while entrepreneurs still
maintained unreasonably high expectations for
young company evaluations. The successful ‘vin-
tage years’ of the mid to late 1990s for VC funds
were replaced with disastrous negative investors’
returns for funds raised only two or three years later.
The latter funds were often raised by the same man-
agers and invested in the same sectors as the for-
merly successful funds.
Thus, timing – the vintage year in which the pro-
gramme starts – can have a profound effect on VC
fund returns. Accordingly, it is rarely sufficient to as-
sess a GP’s skills or a programme’s effectiveness
by referring to one fund or a short period of activity.
5.4 Changes in DGF’s VC Activities
In the context of enterprise finance and particularly
risk capital, Denmark is little different from its Nordic
and (Northern) European peers. Since the begin-
ning of the second millennium (2001), DGF has in-
creasingly been an active participant in the provi-
sion of VC to Danish firms with the potential for ex-
ceptional growth both domestically and internation-
ally.22 It has followed a process of policy learning
also seen across other advanced Western econo-
22 As a rule of thumb, such growth firms will represent approximately 5% of all firms started in any one period (NESTA, 2009).
mies with a strong interest in VC and enterprise fi-
nance (Tykvova et al., 2012). Namely, the state has
changed its role from that of a direct investor in
new/young enterprises to a more indirect responsi-
bility as a major public co-financier of VC funds.
Thus, the state has increasingly removed itself from
the executive position of a general partner allocating
funds to promising companies. Professional inves-
tors with a clearly commercial objective have taken
this position of investment or fund manager. They
are incentivised by the state to take on this agent
role in recognition of the considerable challenges of
successful and profitable investment at the early
stages of the VC cycle.
Accordingly, government acting as a co-investor or
‘special’ limited partner (LP) has largely superseded
government activity as a direct investor. In this latter
model, exclusively adopted in, for example, the UK
or Australia, the state has no commercial input but
leaves this decision making to its elected private
sector agent acting as the general partners (GP) of
a VC fund in which the state is also an investor (LP).
DGF retains a direct VC activity as do government
sponsored investors in Sweden (Industifonds) and
Finland (FII). However, in each country this channel
of investment has increasingly been reduced in fa-
vour of commercial GP agents via VC funds or VC
Fund of Funds.
Changes in activity over time
The changes in DGF since 2001 show an increasing
awareness and reaction to the difficulties that char-
acterised the first decade post 2000. Starting with
the implosion of the ‘technology bubble’ in the
spring of 2000, which savagely reduced the attrac-
tiveness and volume of early-stage VC investing
and moving to the deepest global recession since
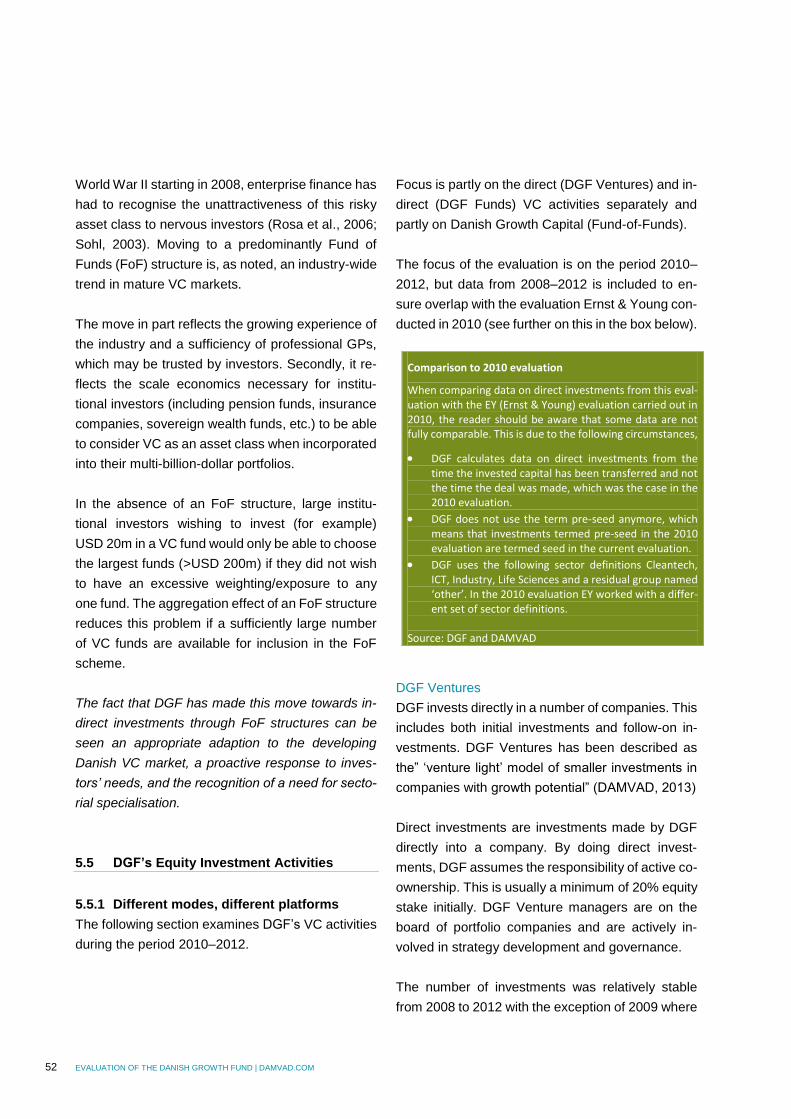
52 EVALUATION OF THE DANISH GROWTH FUND | DAMVAD.COM
World War II starting in 2008, enterprise finance has
had to recognise the unattractiveness of this risky
asset class to nervous investors (Rosa et al., 2006;
Sohl, 2003). Moving to a predominantly Fund of
Funds (FoF) structure is, as noted, an industry-wide
trend in mature VC markets.
The move in part reflects the growing experience of
the industry and a sufficiency of professional GPs,
which may be trusted by investors. Secondly, it re-
flects the scale economics necessary for institu-
tional investors (including pension funds, insurance
companies, sovereign wealth funds, etc.) to be able
to consider VC as an asset class when incorporated
into their multi-billion-dollar portfolios.
In the absence of an FoF structure, large institu-
tional investors wishing to invest (for example)
USD 20m in a VC fund would only be able to choose
the largest funds (>USD 200m) if they did not wish
to have an excessive weighting/exposure to any
one fund. The aggregation effect of an FoF structure
reduces this problem if a sufficiently large number
of VC funds are available for inclusion in the FoF
scheme.
The fact that DGF has made this move towards in-
direct investments through FoF structures can be
seen an appropriate adaption to the developing
Danish VC market, a proactive response to inves-
tors’ needs, and the recognition of a need for secto-
rial specialisation.
5.5 DGF’s Equity Investment Activities
5.5.1 Different modes, different platforms
The following section examines DGF’s VC activities
during the period 2010–2012.
Focus is partly on the direct (DGF Ventures) and in-
direct (DGF Funds) VC activities separately and
partly on Danish Growth Capital (Fund-of-Funds).
The focus of the evaluation is on the period 2010–
2012, but data from 2008–2012 is included to en-
sure overlap with the evaluation Ernst & Young con-
ducted in 2010 (see further on this in the box below).
Comparison to 2010 evaluation
When comparing data on direct investments from this eval-uation with the EY (Ernst & Young) evaluation carried out in 2010, the reader should be aware that some data are not fully comparable. This is due to the following circumstances,
DGF calculates data on direct investments from the time the invested capital has been transferred and not the time the deal was made, which was the case in the 2010 evaluation.
DGF does not use the term pre-seed anymore, which means that investments termed pre-seed in the 2010 evaluation are termed seed in the current evaluation.
DGF uses the following sector definitions Cleantech, ICT, Industry, Life Sciences and a residual group named ‘other’. In the 2010 evaluation EY worked with a differ-ent set of sector definitions.
Source: DGF and DAMVAD
DGF Ventures
DGF invests directly in a number of companies. This
includes both initial investments and follow-on in-
vestments. DGF Ventures has been described as
the” ‘venture light’ model of smaller investments in
companies with growth potential” (DAMVAD, 2013)
Direct investments are investments made by DGF
directly into a company. By doing direct invest-
ments, DGF assumes the responsibility of active co-
ownership. This is usually a minimum of 20% equity
stake initially. DGF Venture managers are on the
board of portfolio companies and are actively in-
volved in strategy development and governance.
The number of investments was relatively stable
from 2008 to 2012 with the exception of 2009 where
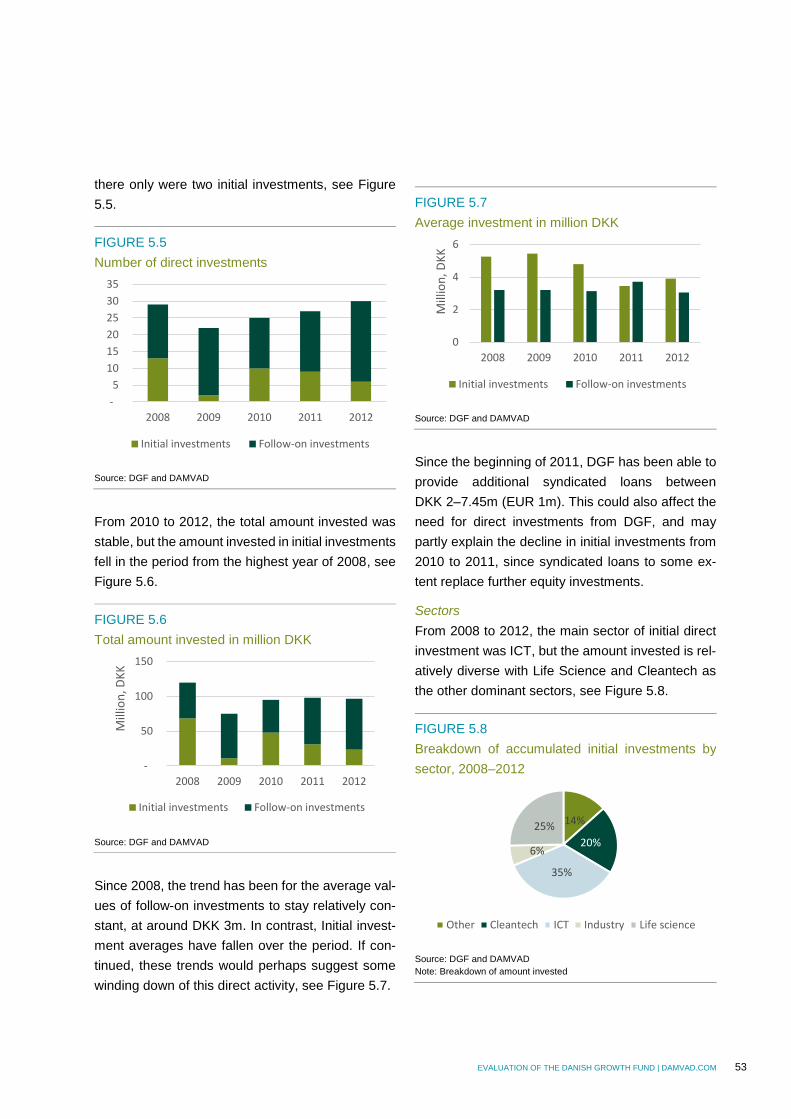
EVALUATION OF THE DANISH GROWTH FUND | DAMVAD.COM 53
there only were two initial investments, see Figure
5.5.
FIGURE 5.5
Number of direct investments
Source: DGF and DAMVAD
From 2010 to 2012, the total amount invested was
stable, but the amount invested in initial investments
fell in the period from the highest year of 2008, see
Figure 5.6.
FIGURE 5.6
Total amount invested in million DKK
Source: DGF and DAMVAD
Since 2008, the trend has been for the average val-
ues of follow-on investments to stay relatively con-
stant, at around DKK 3m. In contrast, Initial invest-
ment averages have fallen over the period. If con-
tinued, these trends would perhaps suggest some
winding down of this direct activity, see Figure 5.7.
FIGURE 5.7
Average investment in million DKK
Source: DGF and DAMVAD
Since the beginning of 2011, DGF has been able to
provide additional syndicated loans between
DKK 2–7.45m (EUR 1m). This could also affect the
need for direct investments from DGF, and may
partly explain the decline in initial investments from
2010 to 2011, since syndicated loans to some ex-
tent replace further equity investments.
Sectors
From 2008 to 2012, the main sector of initial direct
investment was ICT, but the amount invested is rel-
atively diverse with Life Science and Cleantech as
the other dominant sectors, see Figure 5.8.
FIGURE 5.8
Breakdown of accumulated initial investments by
sector, 2008–2012
Source: DGF and DAMVAD
Note: Breakdown of amount invested
-
5
10
15
20
25
30
35
2008 2009 2010 2011 2012
Initial investments Follow-on investments
-
50
100
150
2008 2009 2010 2011 2012
Mill
ion
, DK
K
Initial investments Follow-on investments
0
2
4
6
2008 2009 2010 2011 2012
Mill
ion
, DK
K
Initial investments Follow-on investments
14%
20%
35%
6%
25%
Other Cleantech ICT Industry Life science
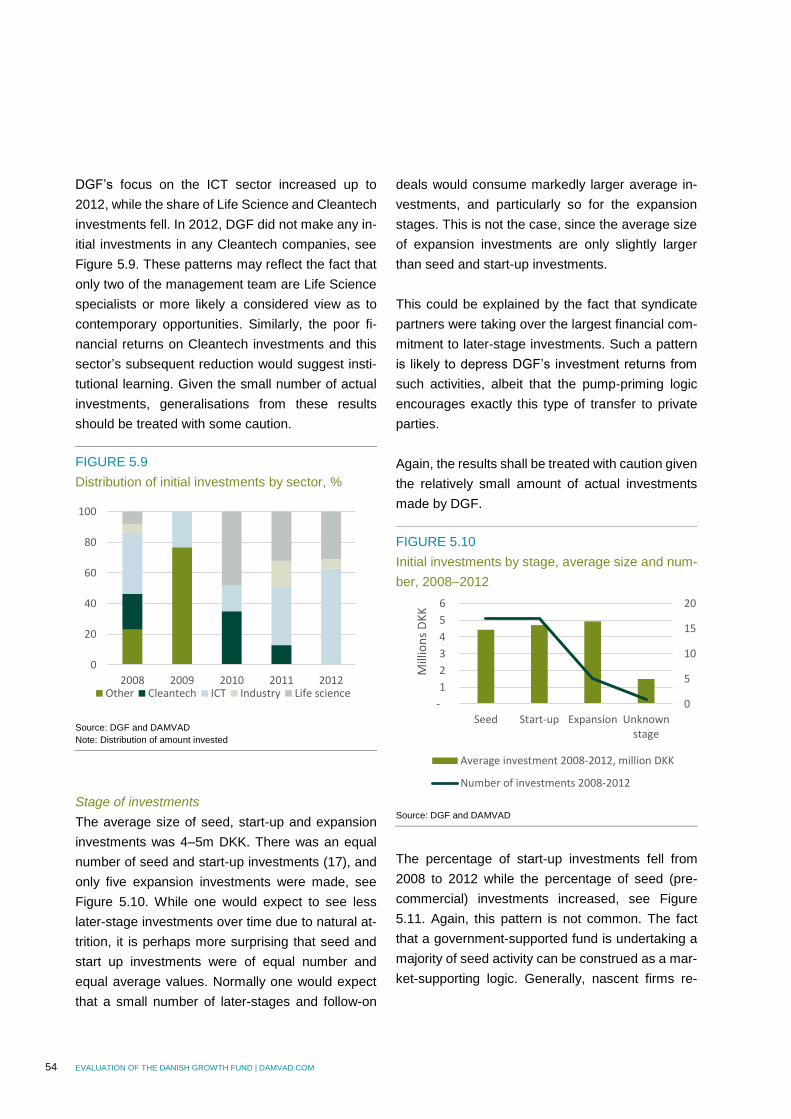
54 EVALUATION OF THE DANISH GROWTH FUND | DAMVAD.COM
DGF’s focus on the ICT sector increased up to
2012, while the share of Life Science and Cleantech
investments fell. In 2012, DGF did not make any in-
itial investments in any Cleantech companies, see
Figure 5.9. These patterns may reflect the fact that
only two of the management team are Life Science
specialists or more likely a considered view as to
contemporary opportunities. Similarly, the poor fi-
nancial returns on Cleantech investments and this
sector’s subsequent reduction would suggest insti-
tutional learning. Given the small number of actual
investments, generalisations from these results
should be treated with some caution.
FIGURE 5.9
Distribution of initial investments by sector, %
Source: DGF and DAMVAD
Note: Distribution of amount invested
Stage of investments
The average size of seed, start-up and expansion
investments was 4–5m DKK. There was an equal
number of seed and start-up investments (17), and
only five expansion investments were made, see
Figure 5.10. While one would expect to see less
later-stage investments over time due to natural at-
trition, it is perhaps more surprising that seed and
start up investments were of equal number and
equal average values. Normally one would expect
that a small number of later-stages and follow-on
deals would consume markedly larger average in-
vestments, and particularly so for the expansion
stages. This is not the case, since the average size
of expansion investments are only slightly larger
than seed and start-up investments.
This could be explained by the fact that syndicate
partners were taking over the largest financial com-
mitment to later-stage investments. Such a pattern
is likely to depress DGF’s investment returns from
such activities, albeit that the pump-priming logic
encourages exactly this type of transfer to private
parties.
Again, the results shall be treated with caution given
the relatively small amount of actual investments
made by DGF.
FIGURE 5.10
Initial investments by stage, average size and num-
ber, 2008–2012
Source: DGF and DAMVAD
The percentage of start-up investments fell from
2008 to 2012 while the percentage of seed (pre-
commercial) investments increased, see Figure
5.11. Again, this pattern is not common. The fact
that a government-supported fund is undertaking a
majority of seed activity can be construed as a mar-
ket-supporting logic. Generally, nascent firms re-
0
20
40
60
80
100
2008 2009 2010 2011 2012Other Cleantech ICT Industry Life science
0
5
10
15
20
-
1
2
3
4
5
6
Seed Start-up Expansion Unknownstage
Mill
ion
s D
KK
Average investment 2008-2012, million DKK
Number of investments 2008-2012
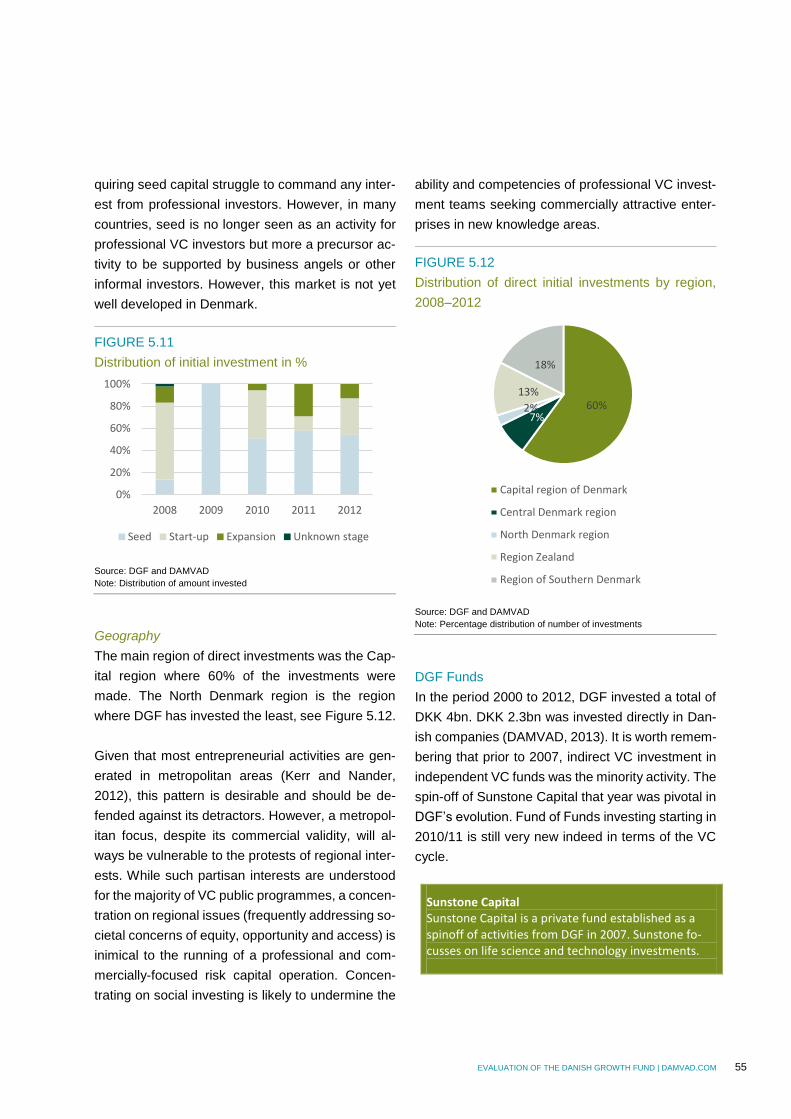
EVALUATION OF THE DANISH GROWTH FUND | DAMVAD.COM 55
quiring seed capital struggle to command any inter-
est from professional investors. However, in many
countries, seed is no longer seen as an activity for
professional VC investors but more a precursor ac-
tivity to be supported by business angels or other
informal investors. However, this market is not yet
well developed in Denmark.
FIGURE 5.11
Distribution of initial investment in %
Source: DGF and DAMVAD
Note: Distribution of amount invested
Geography
The main region of direct investments was the Cap-
ital region where 60% of the investments were
made. The North Denmark region is the region
where DGF has invested the least, see Figure 5.12.
Given that most entrepreneurial activities are gen-
erated in metropolitan areas (Kerr and Nander,
2012), this pattern is desirable and should be de-
fended against its detractors. However, a metropol-
itan focus, despite its commercial validity, will al-
ways be vulnerable to the protests of regional inter-
ests. While such partisan interests are understood
for the majority of VC public programmes, a concen-
tration on regional issues (frequently addressing so-
cietal concerns of equity, opportunity and access) is
inimical to the running of a professional and com-
mercially-focused risk capital operation. Concen-
trating on social investing is likely to undermine the
ability and competencies of professional VC invest-
ment teams seeking commercially attractive enter-
prises in new knowledge areas.
FIGURE 5.12
Distribution of direct initial investments by region,
2008–2012
Source: DGF and DAMVAD
Note: Percentage distribution of number of investments
DGF Funds
In the period 2000 to 2012, DGF invested a total of
DKK 4bn. DKK 2.3bn was invested directly in Dan-
ish companies (DAMVAD, 2013). It is worth remem-
bering that prior to 2007, indirect VC investment in
independent VC funds was the minority activity. The
spin-off of Sunstone Capital that year was pivotal in
DGF’s evolution. Fund of Funds investing starting in
2010/11 is still very new indeed in terms of the VC
cycle.
Sunstone Capital Sunstone Capital is a private fund established as a spinoff of activities from DGF in 2007. Sunstone fo-cusses on life science and technology investments.
0%
20%
40%
60%
80%
100%
2008 2009 2010 2011 2012
Seed Start-up Expansion Unknown stage
60%7%
2%
13%
18%
Capital region of Denmark
Central Denmark region
North Denmark region
Region Zealand
Region of Southern Denmark

56 EVALUATION OF THE DANISH GROWTH FUND | DAMVAD.COM
Since Sunstone was spun-off in 2007, it has raised four additional funds. Sunstone administers six funds: three life science funds and three technology funds.
The investors in Sunstone are predominantly Nordic and international institutional investors: European In-vestment Fund, Industriens Pension, Sampension, ATP, Nordea Liv og Pension, DGF, and DGC. Source: www.sunstone.eu and DGF
As at September 2013, DGF Funds had a portfolio
of 24 funds. Its total commitment to these funds is
DKK 4.8bn. The funds have collectively raised more
than DKK 11.5bn and invested in more than 269
companies (DGF, 2013).
In recent years, DGF has focussed the bulk of its
investments on indirect investments through funds
run by professional managers (general partners).
Here, DGF takes on the role of a limited partner in
these partnerships together with the other institu-
tional investors. The fact that government is often
the largest investor does not convey any special or
preferential partnership rights. The form of indirect
investing has become the most popular mode of op-
eration in publicly co-financed VC programmes
across the developed world.
Distribution of indirect investments DGF’s share of total Danish investments varies
across funds. In some funds, DGF is the primary in-
vestor, while DGF is a minority investor in others.
The total amount of initial indirect investments has
been declining since 2008. The 2009 level of invest-
ment was extraordinarily low as were direct invest-
ments, See figure 5.13.
FIGURE 5.13
Distribution of indirect initial Danish investments,
million DKK
Source: DGF and DAMVAD
Most initial indirect investments are made to com-
panies in the seed phase and start-up phase. The
seed phase is where the average investment value
is the lowest, just above DKK 1m. Start-up invest-
ments are twice as big as the seed investments,
while expansion investments are much bigger, see
Figure 5.14.
FIGURE 5.14
Initial Danish investments by stages, average size
and numbers, 2008-2012
Source: DGF and DAMVAD
-
20
40
60
80
100
2008 2009 2010 2011 2012
Mill
ion
DK
KVækstfonden share Non-Vækstfonden share
-
5
10
15
20
25
- 1 2 3 4 5 6 7
Nu
mb
er o
f in
vest
men
ts
Mill
ion
DK
K
Average investment, million DKK
Number of investments
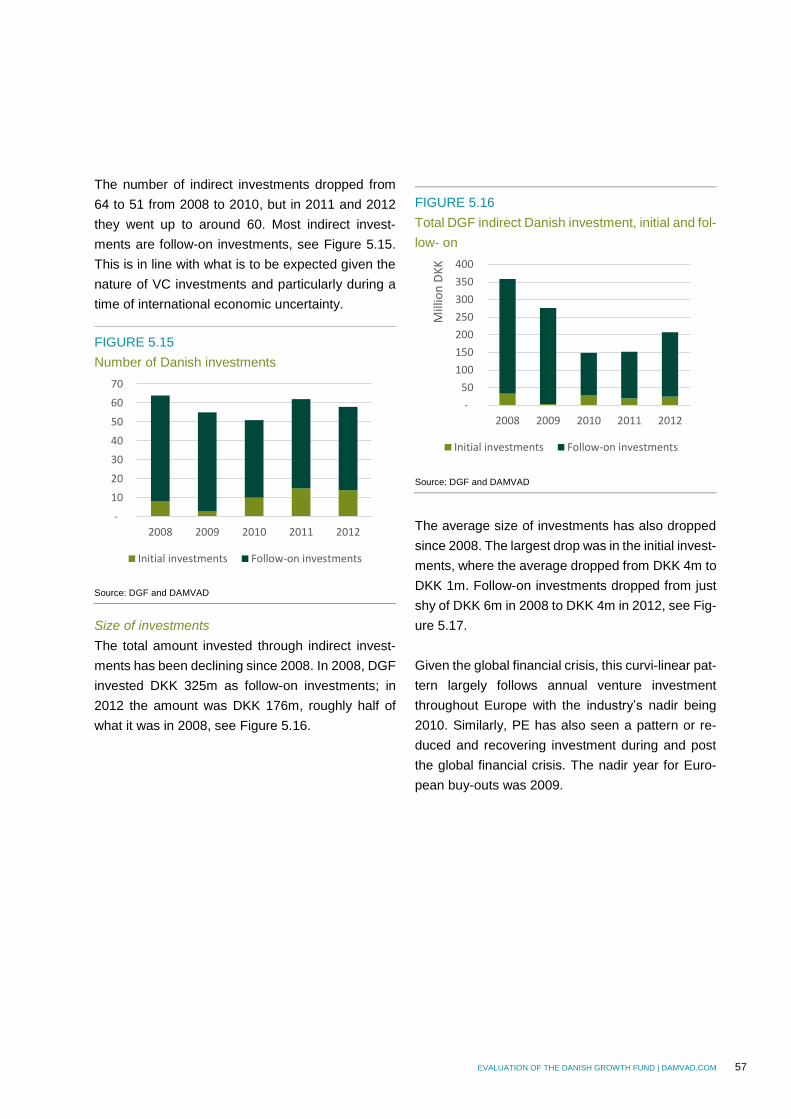
EVALUATION OF THE DANISH GROWTH FUND | DAMVAD.COM 57
The number of indirect investments dropped from
64 to 51 from 2008 to 2010, but in 2011 and 2012
they went up to around 60. Most indirect invest-
ments are follow-on investments, see Figure 5.15.
This is in line with what is to be expected given the
nature of VC investments and particularly during a
time of international economic uncertainty.
FIGURE 5.15
Number of Danish investments
Source: DGF and DAMVAD
Size of investments
The total amount invested through indirect invest-
ments has been declining since 2008. In 2008, DGF
invested DKK 325m as follow-on investments; in
2012 the amount was DKK 176m, roughly half of
what it was in 2008, see Figure 5.16.
FIGURE 5.16
Total DGF indirect Danish investment, initial and fol-
low- on
Source: DGF and DAMVAD
The average size of investments has also dropped
since 2008. The largest drop was in the initial invest-
ments, where the average dropped from DKK 4m to
DKK 1m. Follow-on investments dropped from just
shy of DKK 6m in 2008 to DKK 4m in 2012, see Fig-
ure 5.17.
Given the global financial crisis, this curvi-linear pat-
tern largely follows annual venture investment
throughout Europe with the industry’s nadir being
2010. Similarly, PE has also seen a pattern or re-
duced and recovering investment during and post
the global financial crisis. The nadir year for Euro-
pean buy-outs was 2009.
-
10
20
30
40
50
60
70
2008 2009 2010 2011 2012
Initial investments Follow-on investments
-
50
100
150
200
250
300
350
400
2008 2009 2010 2011 2012
Mill
ion
DK
KInitial investments Follow-on investments
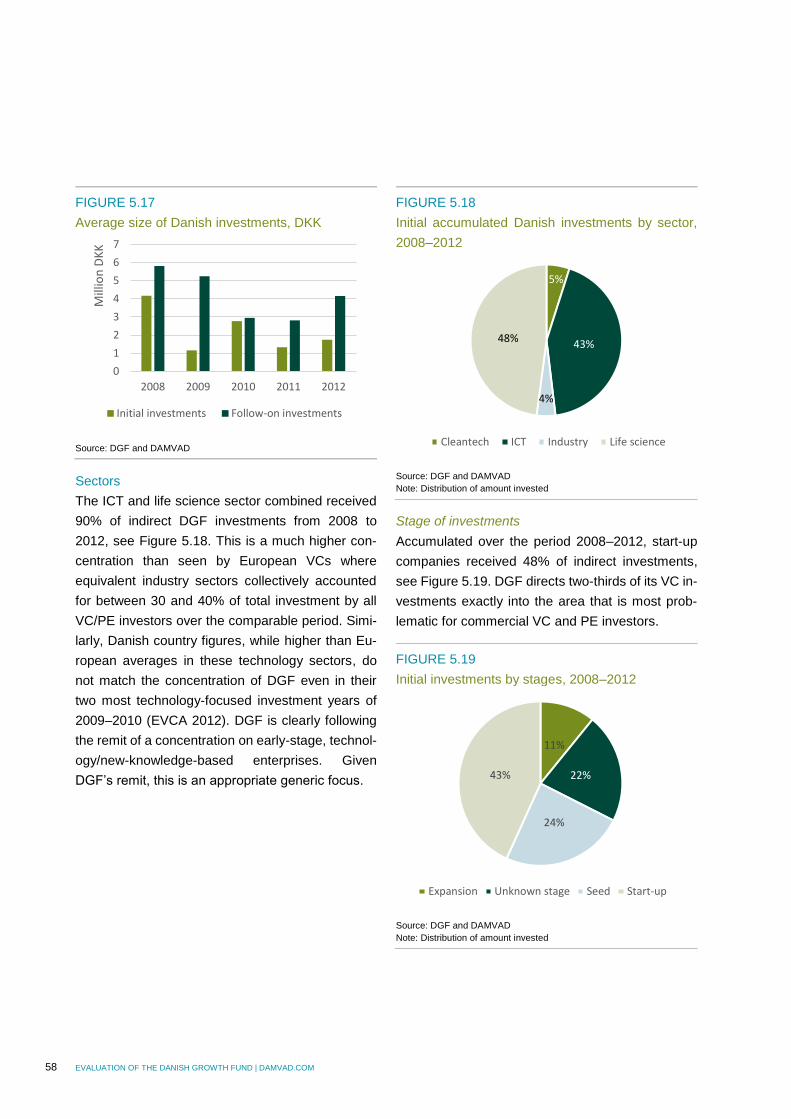
58 EVALUATION OF THE DANISH GROWTH FUND | DAMVAD.COM
FIGURE 5.17
Average size of Danish investments, DKK
Source: DGF and DAMVAD
Sectors
The ICT and life science sector combined received
90% of indirect DGF investments from 2008 to
2012, see Figure 5.18. This is a much higher con-
centration than seen by European VCs where
equivalent industry sectors collectively accounted
for between 30 and 40% of total investment by all
VC/PE investors over the comparable period. Simi-
larly, Danish country figures, while higher than Eu-
ropean averages in these technology sectors, do
not match the concentration of DGF even in their
two most technology-focused investment years of
2009–2010 (EVCA 2012). DGF is clearly following
the remit of a concentration on early-stage, technol-
ogy/new-knowledge-based enterprises. Given
DGF’s remit, this is an appropriate generic focus.
FIGURE 5.18
Initial accumulated Danish investments by sector,
2008–2012
Source: DGF and DAMVAD
Note: Distribution of amount invested
Stage of investments
Accumulated over the period 2008–2012, start-up
companies received 48% of indirect investments,
see Figure 5.19. DGF directs two-thirds of its VC in-
vestments exactly into the area that is most prob-
lematic for commercial VC and PE investors.
FIGURE 5.19
Initial investments by stages, 2008–2012
Source: DGF and DAMVAD
Note: Distribution of amount invested
0
1
2
3
4
5
6
7
2008 2009 2010 2011 2012
Mill
ion
DK
K
Initial investments Follow-on investments
5%
43%
4%
48%
Cleantech ICT Industry Life science
11%
22%
24%
43%
Expansion Unknown stage Seed Start-up
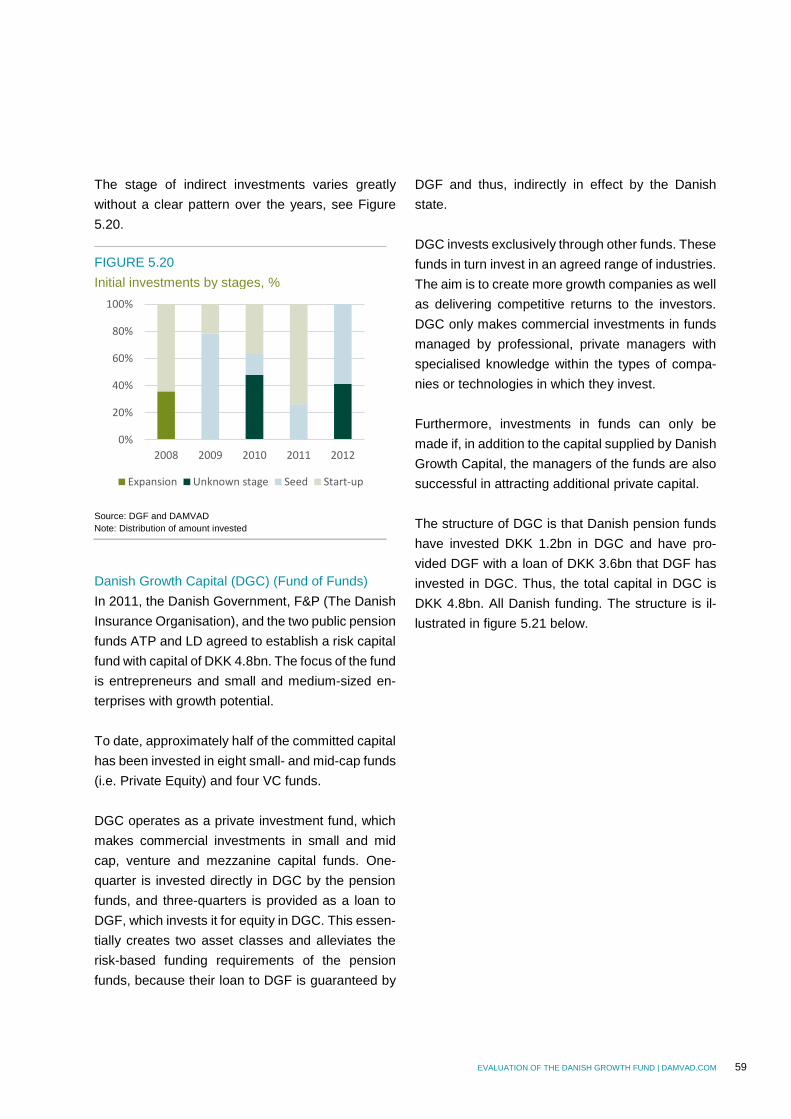
EVALUATION OF THE DANISH GROWTH FUND | DAMVAD.COM 59
The stage of indirect investments varies greatly
without a clear pattern over the years, see Figure
5.20.
FIGURE 5.20
Initial investments by stages, %
Source: DGF and DAMVAD
Note: Distribution of amount invested
Danish Growth Capital (DGC) (Fund of Funds)
In 2011, the Danish Government, F&P (The Danish
Insurance Organisation), and the two public pension
funds ATP and LD agreed to establish a risk capital
fund with capital of DKK 4.8bn. The focus of the fund
is entrepreneurs and small and medium-sized en-
terprises with growth potential.
To date, approximately half of the committed capital
has been invested in eight small- and mid-cap funds
(i.e. Private Equity) and four VC funds.
DGC operates as a private investment fund, which
makes commercial investments in small and mid
cap, venture and mezzanine capital funds. One-
quarter is invested directly in DGC by the pension
funds, and three-quarters is provided as a loan to
DGF, which invests it for equity in DGC. This essen-
tially creates two asset classes and alleviates the
risk-based funding requirements of the pension
funds, because their loan to DGF is guaranteed by
DGF and thus, indirectly in effect by the Danish
state.
DGC invests exclusively through other funds. These
funds in turn invest in an agreed range of industries.
The aim is to create more growth companies as well
as delivering competitive returns to the investors.
DGC only makes commercial investments in funds
managed by professional, private managers with
specialised knowledge within the types of compa-
nies or technologies in which they invest.
Furthermore, investments in funds can only be
made if, in addition to the capital supplied by Danish
Growth Capital, the managers of the funds are also
successful in attracting additional private capital.
The structure of DGC is that Danish pension funds
have invested DKK 1.2bn in DGC and have pro-
vided DGF with a loan of DKK 3.6bn that DGF has
invested in DGC. Thus, the total capital in DGC is
DKK 4.8bn. All Danish funding. The structure is il-
lustrated in figure 5.21 below.
0%
20%
40%
60%
80%
100%
2008 2009 2010 2011 2012
Expansion Unknown stage Seed Start-up
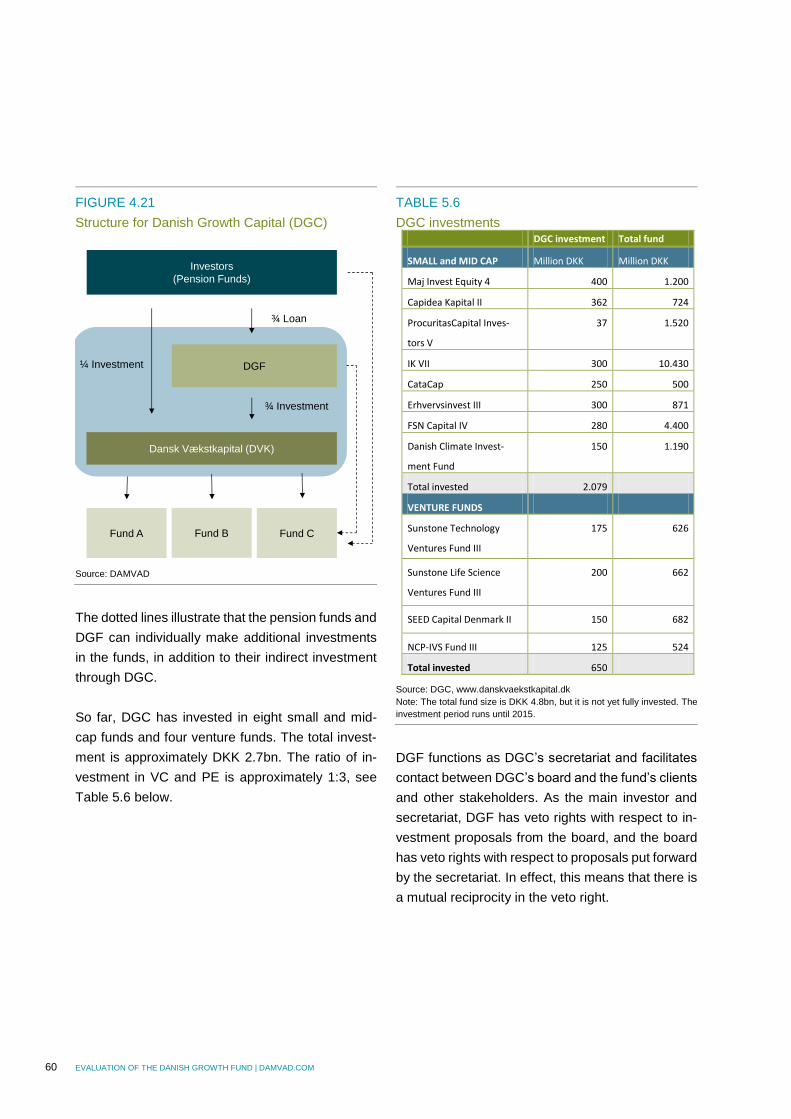
60 EVALUATION OF THE DANISH GROWTH FUND | DAMVAD.COM
FIGURE 4.21
Structure for Danish Growth Capital (DGC)
Source: DAMVAD
The dotted lines illustrate that the pension funds and
DGF can individually make additional investments
in the funds, in addition to their indirect investment
through DGC.
So far, DGC has invested in eight small and mid-
cap funds and four venture funds. The total invest-
ment is approximately DKK 2.7bn. The ratio of in-
vestment in VC and PE is approximately 1:3, see
Table 5.6 below.
TABLE 5.6
DGC investments DGC investment Total fund
SMALL and MID CAP Million DKK Million DKK
Maj Invest Equity 4 400 1.200
Capidea Kapital II 362 724
ProcuritasCapital Inves-
tors V
37 1.520
IK VII 300 10.430
CataCap 250 500
Erhvervsinvest III 300 871
FSN Capital IV 280 4.400
Danish Climate Invest-
ment Fund
150 1.190
Total invested 2.079
VENTURE FUNDS
Sunstone Technology
Ventures Fund III
175 626
Sunstone Life Science
Ventures Fund III
200 662
SEED Capital Denmark II 150 682
NCP-IVS Fund III 125 524
Total invested 650
Source: DGC, www.danskvaekstkapital.dk
Note: The total fund size is DKK 4.8bn, but it is not yet fully invested. The
investment period runs until 2015.
DGF functions as DGC’s secretariat and facilitates
contact between DGC’s board and the fund’s clients
and other stakeholders. As the main investor and
secretariat, DGF has veto rights with respect to in-
vestment proposals from the board, and the board
has veto rights with respect to proposals put forward
by the secretariat. In effect, this means that there is
a mutual reciprocity in the veto right.
Dansk Vækstkapital (DVK)
DGF
Fund A Fund B Fund C
Investors
(Pension Funds)
¾ Loan
¼ Investment
¾ Investment
EVALUATION OF THE DANISH GROWTH FUND | DAMVAD.COM 61
5.6 DGF’s activities in an international con-
text
To assess DGF’s activities, it is necessary to see
them in an international context. No two countries
choose the same approach for the promotion of a
venture-capital market. However, there is a consen-
sus in the European countries that the early-stage
venture capital market faces particular difficulties
that can warrant government intervention.
The US venture industry, which is often a primary
source of reference, largely operates at arm’s length
from government. Its commercially most successful
funds are privately financed. No European countries
have a venture capital market that matches the US
in terms of size, upper-quartile investment returns
or the global success of its best portfolio companies.
However, by contrast, the European Private Equity
sectors of the risk capital market are comparable to
the US in terms of the levels of deal activity and the
returns generated for LPs.
In this context, it is important to emphasise that not
all areas of the US have good access to venture fi-
nancing. There is a very high concentration in Sili-
con Valley, Greater Boston and a few other ‘clus-
ters’ of intense innovative activity (e.g. New York,
the North Carolina Triangle, Seattle, etc.). In addi-
tion, it is an industry that has evolved over the past
50+ years and is thus far more mature than the ma-
jority of European VC industries. It has also flour-
ished in the world’s largest and historically most in-
novative economy. One should therefore be cau-
tious in comparing national VC industries without a
clear understanding of the difficulties of identifying
direct causal links for policy intervention. Lessons
can be learned but context is everything if imple-
mentation is to be effective.
Another important point is that the notion of a na-
tional venture market is in fact often a misrepresen-
tation of reality. Venture funds are increasingly in-
ternational in focus, both in terms of investment tar-
gets and funding sources. This represents a chal-
lenge to sovereign funds which, for political rea-
sons, may have a narrow national focus in their in-
vestment strategies.
This evaluation compares the Danish venture capi-
tal market to a number of comparable Northern Eu-
ropean countries, which are economically and polit-
ically similar to Denmark compared to the results
achieved in other countries.
This is done in order to study the development of
the Danish venture market and the role of DGF in
creating a sustainable VC market and culture in
Denmark.
5.6.1 Reference countries and programmes
DGF’s activities are analysed in reference to the to-
tal Danish venture market, which is compared to a
sample of institutions in similar countries (see Table
5.7. below). These are all high-income north Euro-
pean countries. They can thus be assumed some-
what economically comparable in terms of both per-
formance, policy development and focus.
TABLE 5.7
Countries in benchmarked relevant organisations Country Institution
Germany High-Tech Gründerfonds
ERP-EIF Dachfonds
KfW Mittelstandsbank
Sweden Industrifonden
Almi
Norway Investinor
Finland Finnerva
Finnish Industry Invest-
ments (FII)
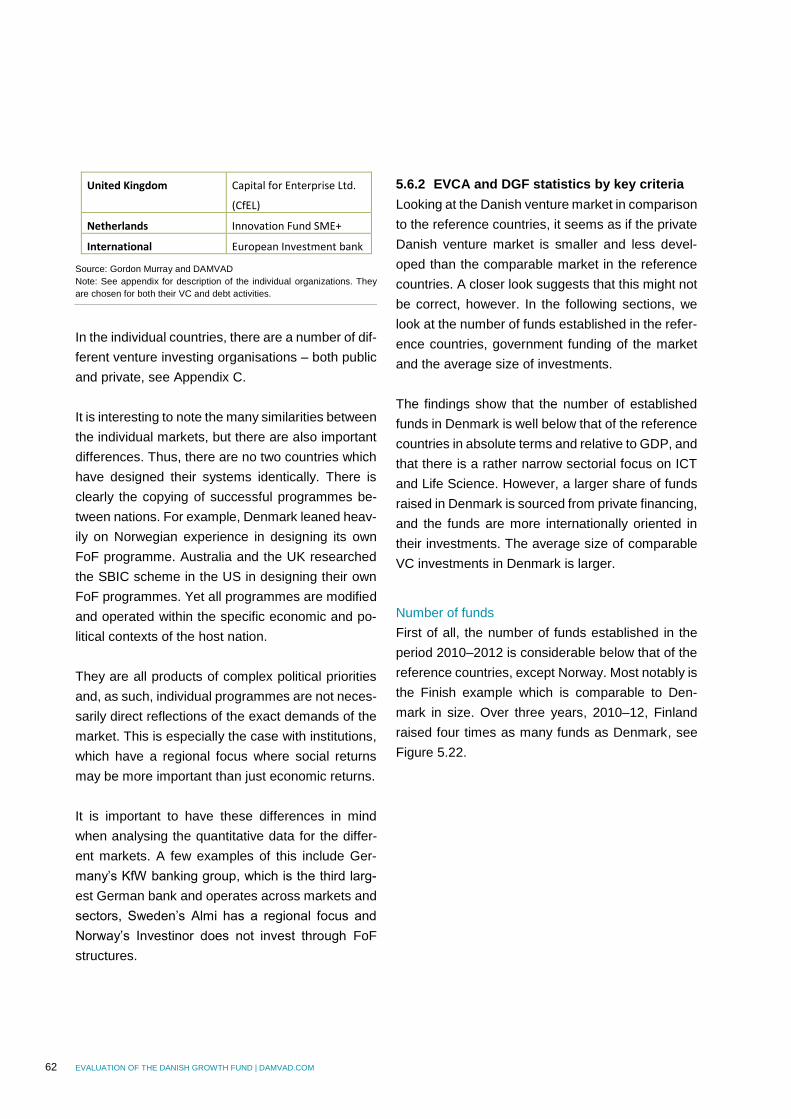
62 EVALUATION OF THE DANISH GROWTH FUND | DAMVAD.COM
United Kingdom Capital for Enterprise Ltd.
(CfEL)
Netherlands Innovation Fund SME+
International European Investment bank
Source: Gordon Murray and DAMVAD
Note: See appendix for description of the individual organizations. They
are chosen for both their VC and debt activities.
In the individual countries, there are a number of dif-
ferent venture investing organisations – both public
and private, see Appendix C.
It is interesting to note the many similarities between
the individual markets, but there are also important
differences. Thus, there are no two countries which
have designed their systems identically. There is
clearly the copying of successful programmes be-
tween nations. For example, Denmark leaned heav-
ily on Norwegian experience in designing its own
FoF programme. Australia and the UK researched
the SBIC scheme in the US in designing their own
FoF programmes. Yet all programmes are modified
and operated within the specific economic and po-
litical contexts of the host nation.
They are all products of complex political priorities
and, as such, individual programmes are not neces-
sarily direct reflections of the exact demands of the
market. This is especially the case with institutions,
which have a regional focus where social returns
may be more important than just economic returns.
It is important to have these differences in mind
when analysing the quantitative data for the differ-
ent markets. A few examples of this include Ger-
many’s KfW banking group, which is the third larg-
est German bank and operates across markets and
sectors, Sweden’s Almi has a regional focus and
Norway’s Investinor does not invest through FoF
structures.
5.6.2 EVCA and DGF statistics by key criteria
Looking at the Danish venture market in comparison
to the reference countries, it seems as if the private
Danish venture market is smaller and less devel-
oped than the comparable market in the reference
countries. A closer look suggests that this might not
be correct, however. In the following sections, we
look at the number of funds established in the refer-
ence countries, government funding of the market
and the average size of investments.
The findings show that the number of established
funds in Denmark is well below that of the reference
countries in absolute terms and relative to GDP, and
that there is a rather narrow sectorial focus on ICT
and Life Science. However, a larger share of funds
raised in Denmark is sourced from private financing,
and the funds are more internationally oriented in
their investments. The average size of comparable
VC investments in Denmark is larger.
Number of funds
First of all, the number of funds established in the
period 2010–2012 is considerable below that of the
reference countries, except Norway. Most notably is
the Finish example which is comparable to Den-
mark in size. Over three years, 2010–12, Finland
raised four times as many funds as Denmark, see
Figure 5.22.

EVALUATION OF THE DANISH GROWTH FUND | DAMVAD.COM 63
FIGURE 5.22
Number of funds established, 2010–2012
Source: EVCA Yearbook 2013
UK is by far the country where most new funds were
established in the period. But only a relatively small
share are VC-funds. A large part are buy-out and
generalist funds which are able to attract more pri-
vate capital due to their later-stage market focus
and the superior investment performance of PE
funds.
The number of funds is particularly interesting in this
context because specialisation is important in order
for the funds to be successful. Thus a smaller num-
ber of funds can either result in less specialisation
or in a narrower sectorial focus, as in Danish invest-
ments.
DGF helped raised four new funds in 2010–2012
which are primarily focussed on Life Science and
ICT (see table 5.8). The table shows the four funds
and their specialisation. An interesting point is that
none of the four funds is managed by new GPs.
They are respectively second and third funds of in-
cumbent management teams. Backing experienced
managers is preferable to funding new manage-
ment teams with each new round of finance. Aus-
tralia made this mistake initially with its IIF pro-
gramme. Successful first-round GPs could not bid
for follow-on rounds of finance which went to new
management teams running new VC funds. The re-
sult was that better GPs, now excluded from gov-
ernment finance, moved up market to larger PE type
investments. Their experience and skills were lost
to the VC industry. And, in a relatively small econ-
omy, Australia found it difficult to replace these VCs
with comparably skilled new teams. Constraints in
the supply of human capital put the programme at
risk.
The incidence of managers raising multiple funds is
therefore encouraging. Empirical evidence sug-
gests that more experienced managers are better
able to meet investors’ expectations. These manag-
ers are also more likely increasingly to be sector
specialists. This again is seen as desirable (Lerner
and Hellman, 2012).
TABLE 5.8
VC Funds raised in 2010–2012 Fund Specialization
Sunstone Life Science Ventures Fund
III K/S
Life Science
Sunstone Technology Ventures Fund
III K/S
ICT
NCP-IVS Fund III K/S ICT
SEED Capital II K/S ICT, Life Science
and Cleantech
Source: DGF
A limited number of qualified fund management
teams can result in a relatively low number of funds
established in the period.
0
20
40
60
80
100
120
140
160
Early-stage Later stage venture
Balanced Growth capital
Buyout Mezzanine
Generalist
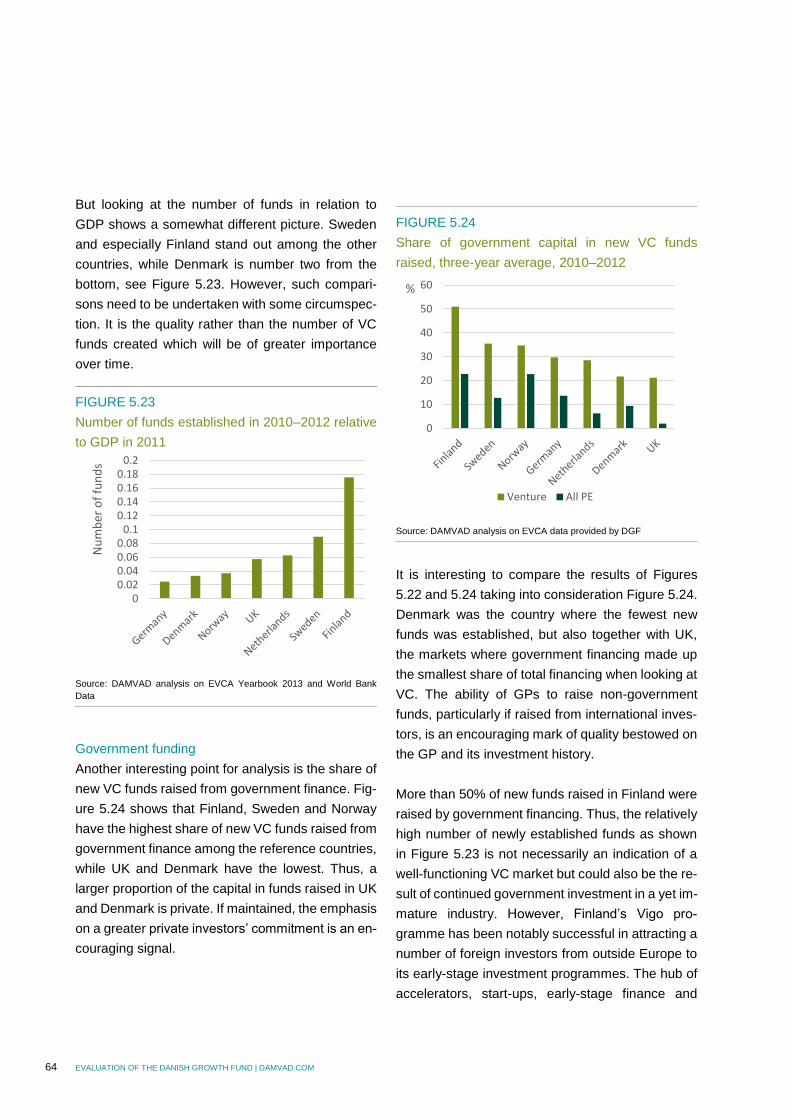
64 EVALUATION OF THE DANISH GROWTH FUND | DAMVAD.COM
But looking at the number of funds in relation to
GDP shows a somewhat different picture. Sweden
and especially Finland stand out among the other
countries, while Denmark is number two from the
bottom, see Figure 5.23. However, such compari-
sons need to be undertaken with some circumspec-
tion. It is the quality rather than the number of VC
funds created which will be of greater importance
over time.
FIGURE 5.23
Number of funds established in 2010–2012 relative
to GDP in 2011
Source: DAMVAD analysis on EVCA Yearbook 2013 and World Bank
Data
Government funding
Another interesting point for analysis is the share of
new VC funds raised from government finance. Fig-
ure 5.24 shows that Finland, Sweden and Norway
have the highest share of new VC funds raised from
government finance among the reference countries,
while UK and Denmark have the lowest. Thus, a
larger proportion of the capital in funds raised in UK
and Denmark is private. If maintained, the emphasis
on a greater private investors’ commitment is an en-
couraging signal.
FIGURE 5.24
Share of government capital in new VC funds
raised, three-year average, 2010–2012
Source: DAMVAD analysis on EVCA data provided by DGF
It is interesting to compare the results of Figures
5.22 and 5.24 taking into consideration Figure 5.24.
Denmark was the country where the fewest new
funds was established, but also together with UK,
the markets where government financing made up
the smallest share of total financing when looking at
VC. The ability of GPs to raise non-government
funds, particularly if raised from international inves-
tors, is an encouraging mark of quality bestowed on
the GP and its investment history.
More than 50% of new funds raised in Finland were
raised by government financing. Thus, the relatively
high number of newly established funds as shown
in Figure 5.23 is not necessarily an indication of a
well-functioning VC market but could also be the re-
sult of continued government investment in a yet im-
mature industry. However, Finland’s Vigo pro-
gramme has been notably successful in attracting a
number of foreign investors from outside Europe to
its early-stage investment programmes. The hub of
accelerators, start-ups, early-stage finance and
00.020.040.060.08
0.10.120.140.160.18
0.2
Nu
mb
er o
f fu
nd
s
0
10
20
30
40
50
60%
Venture All PE
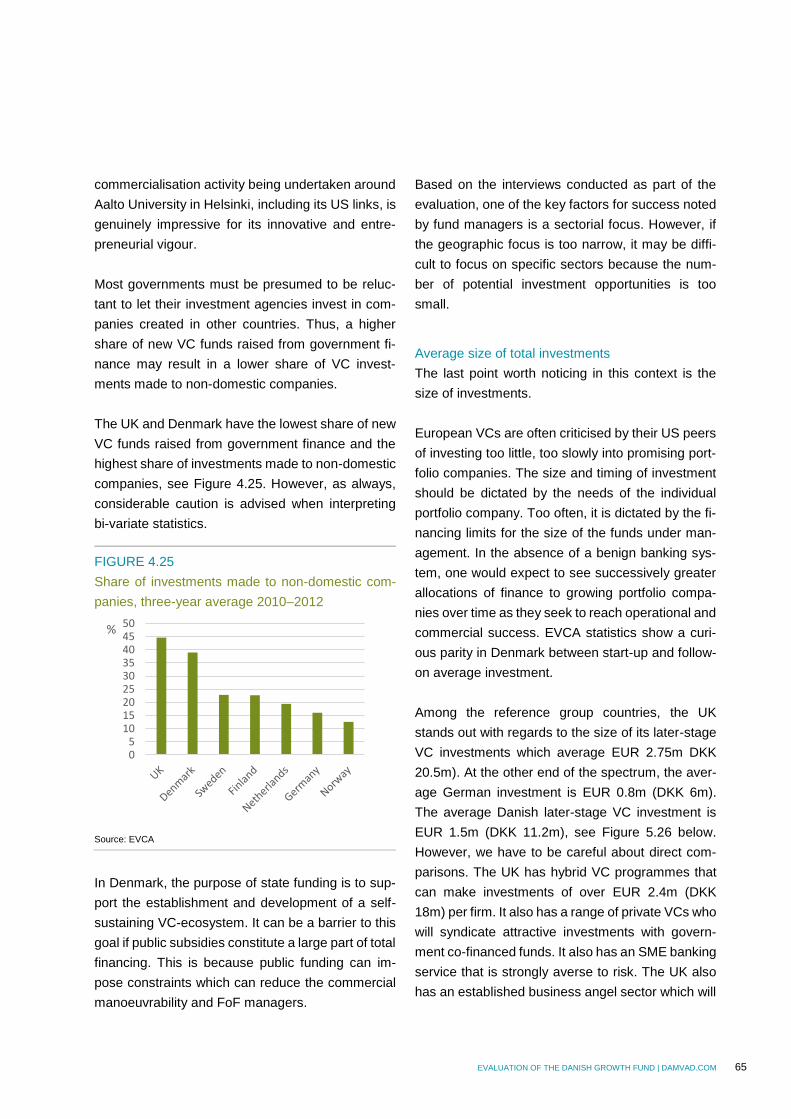
EVALUATION OF THE DANISH GROWTH FUND | DAMVAD.COM 65
commercialisation activity being undertaken around
Aalto University in Helsinki, including its US links, is
genuinely impressive for its innovative and entre-
preneurial vigour.
Most governments must be presumed to be reluc-
tant to let their investment agencies invest in com-
panies created in other countries. Thus, a higher
share of new VC funds raised from government fi-
nance may result in a lower share of VC invest-
ments made to non-domestic companies.
The UK and Denmark have the lowest share of new
VC funds raised from government finance and the
highest share of investments made to non-domestic
companies, see Figure 4.25. However, as always,
considerable caution is advised when interpreting
bi-variate statistics.
FIGURE 4.25
Share of investments made to non-domestic com-
panies, three-year average 2010–2012
Source: EVCA
In Denmark, the purpose of state funding is to sup-
port the establishment and development of a self-
sustaining VC-ecosystem. It can be a barrier to this
goal if public subsidies constitute a large part of total
financing. This is because public funding can im-
pose constraints which can reduce the commercial
manoeuvrability and FoF managers.
Based on the interviews conducted as part of the
evaluation, one of the key factors for success noted
by fund managers is a sectorial focus. However, if
the geographic focus is too narrow, it may be diffi-
cult to focus on specific sectors because the num-
ber of potential investment opportunities is too
small.
Average size of total investments
The last point worth noticing in this context is the
size of investments.
European VCs are often criticised by their US peers
of investing too little, too slowly into promising port-
folio companies. The size and timing of investment
should be dictated by the needs of the individual
portfolio company. Too often, it is dictated by the fi-
nancing limits for the size of the funds under man-
agement. In the absence of a benign banking sys-
tem, one would expect to see successively greater
allocations of finance to growing portfolio compa-
nies over time as they seek to reach operational and
commercial success. EVCA statistics show a curi-
ous parity in Denmark between start-up and follow-
on average investment.
Among the reference group countries, the UK
stands out with regards to the size of its later-stage
VC investments which average EUR 2.75m DKK
20.5m). At the other end of the spectrum, the aver-
age German investment is EUR 0.8m (DKK 6m).
The average Danish later-stage VC investment is
EUR 1.5m (DKK 11.2m), see Figure 5.26 below.
However, we have to be careful about direct com-
parisons. The UK has hybrid VC programmes that
can make investments of over EUR 2.4m (DKK
18m) per firm. It also has a range of private VCs who
will syndicate attractive investments with govern-
ment co-financed funds. It also has an SME banking
service that is strongly averse to risk. The UK also
has an established business angel sector which will
05
101520253035404550%
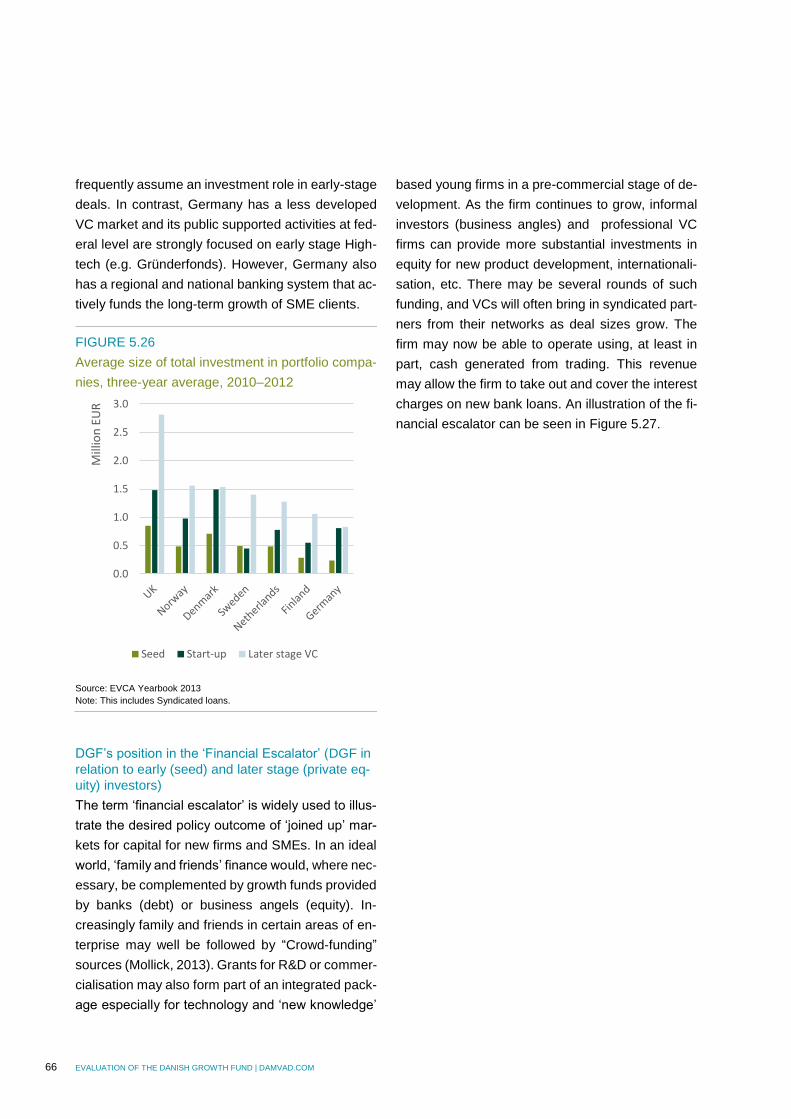
66 EVALUATION OF THE DANISH GROWTH FUND | DAMVAD.COM
frequently assume an investment role in early-stage
deals. In contrast, Germany has a less developed
VC market and its public supported activities at fed-
eral level are strongly focused on early stage High-
tech (e.g. Gründerfonds). However, Germany also
has a regional and national banking system that ac-
tively funds the long-term growth of SME clients.
FIGURE 5.26
Average size of total investment in portfolio compa-
nies, three-year average, 2010–2012
Source: EVCA Yearbook 2013
Note: This includes Syndicated loans.
DGF’s position in the ‘Financial Escalator’ (DGF in
relation to early (seed) and later stage (private eq-
uity) investors)
The term ‘financial escalator’ is widely used to illus-
trate the desired policy outcome of ‘joined up’ mar-
kets for capital for new firms and SMEs. In an ideal
world, ‘family and friends’ finance would, where nec-
essary, be complemented by growth funds provided
by banks (debt) or business angels (equity). In-
creasingly family and friends in certain areas of en-
terprise may well be followed by “Crowd-funding”
sources (Mollick, 2013). Grants for R&D or commer-
cialisation may also form part of an integrated pack-
age especially for technology and ‘new knowledge’
based young firms in a pre-commercial stage of de-
velopment. As the firm continues to grow, informal
investors (business angles) and professional VC
firms can provide more substantial investments in
equity for new product development, internationali-
sation, etc. There may be several rounds of such
funding, and VCs will often bring in syndicated part-
ners from their networks as deal sizes grow. The
firm may now be able to operate using, at least in
part, cash generated from trading. This revenue
may allow the firm to take out and cover the interest
charges on new bank loans. An illustration of the fi-
nancial escalator can be seen in Figure 5.27.
0.0
0.5
1.0
1.5
2.0
2.5
3.0
Mill
ion
EU
R
Seed Start-up Later stage VC
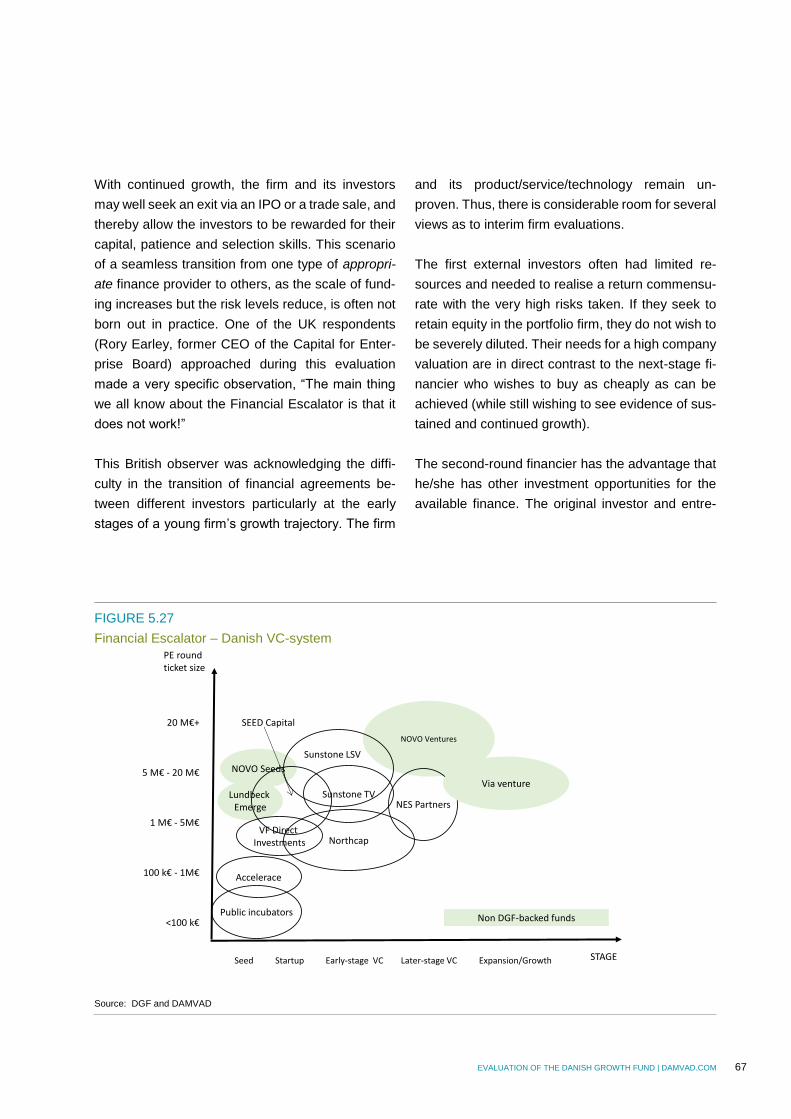
EVALUATION OF THE DANISH GROWTH FUND | DAMVAD.COM 67
With continued growth, the firm and its investors
may well seek an exit via an IPO or a trade sale, and
thereby allow the investors to be rewarded for their
capital, patience and selection skills. This scenario
of a seamless transition from one type of appropri-
ate finance provider to others, as the scale of fund-
ing increases but the risk levels reduce, is often not
born out in practice. One of the UK respondents
(Rory Earley, former CEO of the Capital for Enter-
prise Board) approached during this evaluation
made a very specific observation, “The main thing
we all know about the Financial Escalator is that it
does not work!”
This British observer was acknowledging the diffi-
culty in the transition of financial agreements be-
tween different investors particularly at the early
stages of a young firm’s growth trajectory. The firm
and its product/service/technology remain un-
proven. Thus, there is considerable room for several
views as to interim firm evaluations.
The first external investors often had limited re-
sources and needed to realise a return commensu-
rate with the very high risks taken. If they seek to
retain equity in the portfolio firm, they do not wish to
be severely diluted. Their needs for a high company
valuation are in direct contrast to the next-stage fi-
nancier who wishes to buy as cheaply as can be
achieved (while still wishing to see evidence of sus-
tained and continued growth).
The second-round financier has the advantage that
he/she has other investment opportunities for the
available finance. The original investor and entre-
FIGURE 5.27
Financial Escalator – Danish VC-system
Source: DGF and DAMVAD
NOVO Seeds
Lundbeck Emerge
NOVO Ventures
20 M€+
5 M€ - 20 M€
1 M€ - 5M€
100 k€ - 1M€
<100 k€
Seed Startup Early-stage VC Later-stage VC Expansion/Growth
Northcap
NES Partners
Accelerace
Sunstone TV
Sunstone LSV
Via venture
VF Direct Investments
SEED Capital
Non DGF-backed fundsPublic incubators
PE roundticket size
STAGE
68 EVALUATION OF THE DANISH GROWTH FUND | DAMVAD.COM
preneur are already committed to an illiquid invest-
ment and remain vulnerable until follow-on finance
is secured. Conflict is built into what remains too of-
ten a ‘zero sum game’ structure. Issues of appropri-
ate valuations between financial stages can be
problematic between seed and start-up funders, in-
cubators and professional investors and business
angels and venture capitalists. All practitioner re-
spondents noted this area of conflict. The US VC
industry has sought to resolve this problem by hav-
ing its VC funds invest across the board from seed
to pre IPO financings from the same fund (Dimov
and Murray, 2008). Such a spread of activity across
the whole firm-development cycle requires large
funds. Many of the US’s most prestigious and suc-
cessful VC firms can measure individual fund rais-
ing in multiples of hundreds of millions of dollars.
Europe has a much more problematic tradition of
having small specialist VC funds that focus on a sin-
gle or narrow stage(s) of financing within the funding
escalator. These small funds bear all the dispropor-
tionate costs and vulnerabilities of their size (Murray
and Marriot, 1998).23 In this particular issue of fund
size, DGF is to be congratulated on its efforts to sig-
nificantly increase the size of supported funds and
to resist the requests for DGF co-financing of small
regional funds of questionable viability.
Given the dominance and scale of DGF within the
Danish market for entrepreneurial finance, the Dan-
ish policy approach has resulted in a Danish public
financing escalator that has in part internalised the
transition between funding rounds. Funds sup-
ported by DGF are generally large enough to do
multiple financing rounds of their portfolios. The
more established GPs (i.e. Sunstone) are also es-
tablished enough to organise their own syndication
23 However, one UK VC industry respondent noted a recent contrary US trend in the growth in seed funds as a means of new entrants accessing the VC industry.
finance opportunities with other investors, both na-
tionally and internationally. The split in selection of
VC funds supported by both the two indirect equity
activities of DGF (DGF Funds Group and Danish
Growth Capital) allows for funds to be available for
early stage and growth stage investments. These
multiple direct and indirect investing channels mean
that DGF may well invest in a single business at dif-
ferent stages of its growth via different funds. A port-
folio firm can receive direct DGF investment and co-
financing or follow-on investment via DGF sup-
ported funds or from funds-of-funds.
The above figure supports this matrix of investment
channels. Both DGF-supported and independent
funds span the market for equity finance across all
venture growth stages and size of investment up to
DKK 150m (EUR 20m). It is only in the <DKK 7.5m
(EUR 1m) level that the provision is reduced to two
funds. Incidentally this is also the area where Busi-
ness Angels are most likely to operate.
Linkages to quality deal flow (relations to other
Danish enterprise programmes (Incubator Environ-
ments)
If a Funding Escalator perspective is used, the seed
investment activities of the six (soon to be merged
into four) incubators primarily funded24 via the state
through the Incubator Environments programme
should reasonably assume that follow-on finance is
or will be made available via DGF. In reality, DGF is
neither structured as a seed investor nor is capable
of making a majority of investment decisions directly
because of its growing indirect activities.
This decision-making activity is increasingly dele-
gated to private GPs within the supported funds.
These managers will draw their own conclusions as
24 The Ministry of Education and Research allocates about 80% of the pro-gramme’s funding to very young firms.
EVALUATION OF THE DANISH GROWTH FUND | DAMVAD.COM 69
to which deal flow is and should be funded. At this
early-stage activity, it is common for investors to re-
ject >95% of the proposals received. One incubator
manager mused that he would expect DGF to take
more risks as a public investor than they do in prac-
tice. However, because DGF has an ambition to de-
velop into an ‘evergreen’ funding arrangement, it
cannot afford to accept any more risk that it needs
to assume.25 DGF’s agent GPs are mandated to
make an attractive investment return on their fund
activities. This does not necessarily encompass act-
ing as an exit opportunity for Danish incubators.
A second problem with deal flow into DGF from the
public incubator programme is that presents an op-
portunity for the misalignment of interests and in-
centives of the two organisations. The incubator
programme is constrained in the amount of funding
it can place in any one portfolio firm. If such a firm is
growing rapidly and/or needs substantial funds to
realise its planned growth, government support is
limited to a maximum of DKK 3.5m.26 The longer the
incubator can delay going for additional funds from
a follow-on investor, the longer a severe dilution in
its part-ownership of the portfolio can be avoided. In
an ideal situation, the now older and more experi-
enced portfolio company is stronger and will thus at-
tract a greater valuation on which the new financing
is calculated. However, while to the advantage of
the initial (incubator) investor, delay may be at the
direct expense of the portfolio firm in volatile, rap-
idly-evolving markets.
US investors are much more successful in rapidly
growing the most successful firms in the VC’s port-
folio.27 This is also borne out in the superior US in-
vestment performance compared to European VC 25 Innovation Investment Fund in Australia mandates a proportion of in-vestment returns to the government from supported funds to be directed to the maintenance of an evergreen fund structure.
funds, even though there has been a convergence
of performance between the two regions in recent
years.US and European figures show that young
US companies are more likely to die. However, they
are also more likely to grow exceptionally (Bravo-
Biosca, 2012). Because of these loosely aligned in-
centives with DGF, the incubator’s investment man-
ager can face a ‘moral hazard’. Actions that may
benefit the incubator commercially in the short-run
as an equity investor may do serious long-term
harm to the portfolio company. At worst, the com-
pany’s optimal growth and development opportuni-
ties may have been arrested because of delayed
funding in markets and technologies that are ex-
tremely dynamic.
Articulating this conflict is not to argue that DGF
should take over incubator investing activities. DGF
is not presently designed or organised for such a re-
sponsibility. However, despite these above caveats,
the linkages between DGF and Innovative Environ-
ments do appear to be robust. Figures for 2012
show that DGF Ventures is accepting incubator
companies (via the Innovation Environments pro-
gramme). Over one-third (36%) of Ventures’ total
deal flow and 21% of total deal flow over the period
2007–2011 came from this source. These linkages
with Ventures have increased markedly in the last
two years, see Table 5.9.
26 There is some flexibility for further public funding (DKK 2.5m) if the in-cubator can raise further private funds in excess of 60% of additional mon-ies raised. 27 The lead investor is likely to continue to fund successive rounds, thereby avoiding pricing conflicts between investors.
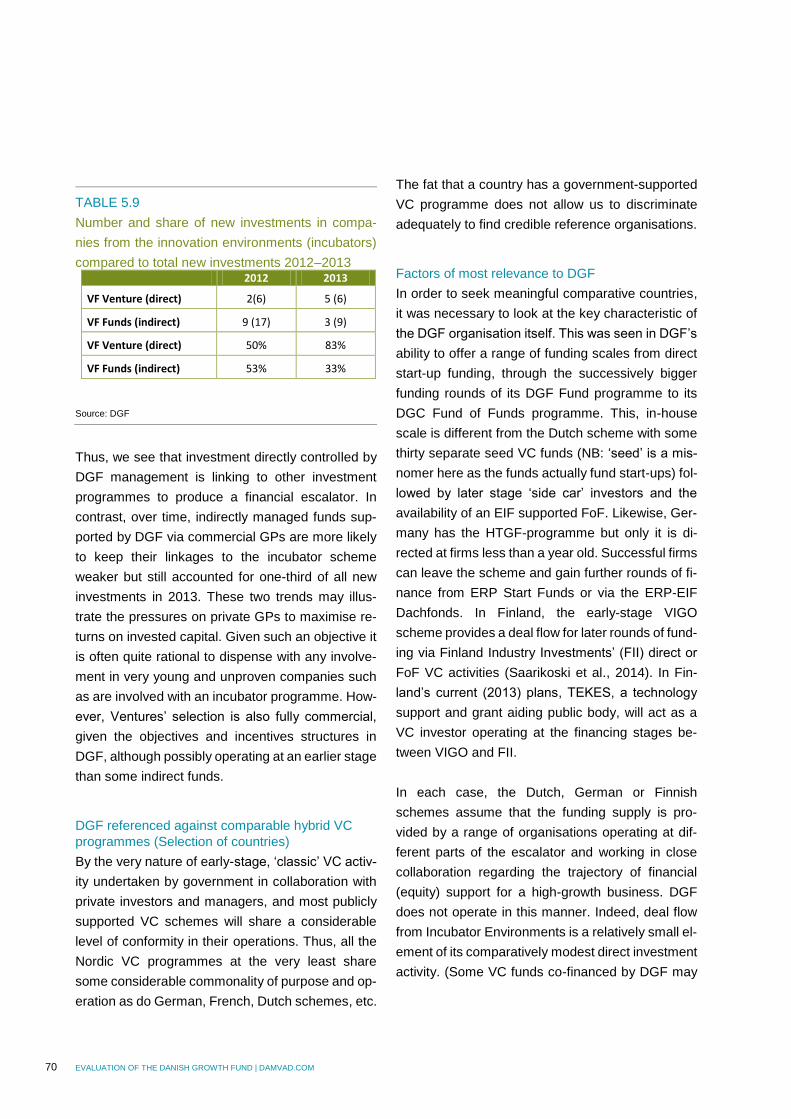
70 EVALUATION OF THE DANISH GROWTH FUND | DAMVAD.COM
TABLE 5.9
Number and share of new investments in compa-
nies from the innovation environments (incubators)
compared to total new investments 2012–2013 2012 2013
VF Venture (direct) 2(6) 5 (6)
VF Funds (indirect) 9 (17) 3 (9)
VF Venture (direct) 50% 83%
VF Funds (indirect) 53% 33%
Source: DGF
Thus, we see that investment directly controlled by
DGF management is linking to other investment
programmes to produce a financial escalator. In
contrast, over time, indirectly managed funds sup-
ported by DGF via commercial GPs are more likely
to keep their linkages to the incubator scheme
weaker but still accounted for one-third of all new
investments in 2013. These two trends may illus-
trate the pressures on private GPs to maximise re-
turns on invested capital. Given such an objective it
is often quite rational to dispense with any involve-
ment in very young and unproven companies such
as are involved with an incubator programme. How-
ever, Ventures’ selection is also fully commercial,
given the objectives and incentives structures in
DGF, although possibly operating at an earlier stage
than some indirect funds.
DGF referenced against comparable hybrid VC
programmes (Selection of countries)
By the very nature of early-stage, ‘classic’ VC activ-
ity undertaken by government in collaboration with
private investors and managers, and most publicly
supported VC schemes will share a considerable
level of conformity in their operations. Thus, all the
Nordic VC programmes at the very least share
some considerable commonality of purpose and op-
eration as do German, French, Dutch schemes, etc.
The fat that a country has a government-supported
VC programme does not allow us to discriminate
adequately to find credible reference organisations.
Factors of most relevance to DGF
In order to seek meaningful comparative countries,
it was necessary to look at the key characteristic of
the DGF organisation itself. This was seen in DGF’s
ability to offer a range of funding scales from direct
start-up funding, through the successively bigger
funding rounds of its DGF Fund programme to its
DGC Fund of Funds programme. This, in-house
scale is different from the Dutch scheme with some
thirty separate seed VC funds (NB: ‘seed’ is a mis-
nomer here as the funds actually fund start-ups) fol-
lowed by later stage ‘side car’ investors and the
availability of an EIF supported FoF. Likewise, Ger-
many has the HTGF-programme but only it is di-
rected at firms less than a year old. Successful firms
can leave the scheme and gain further rounds of fi-
nance from ERP Start Funds or via the ERP-EIF
Dachfonds. In Finland, the early-stage VIGO
scheme provides a deal flow for later rounds of fund-
ing via Finland Industry Investments’ (FII) direct or
FoF VC activities (Saarikoski et al., 2014). In Fin-
land’s current (2013) plans, TEKES, a technology
support and grant aiding public body, will act as a
VC investor operating at the financing stages be-
tween VIGO and FII.
In each case, the Dutch, German or Finnish
schemes assume that the funding supply is pro-
vided by a range of organisations operating at dif-
ferent parts of the escalator and working in close
collaboration regarding the trajectory of financial
(equity) support for a high-growth business. DGF
does not operate in this manner. Indeed, deal flow
from Incubator Environments is a relatively small el-
ement of its comparatively modest direct investment
activity. (Some VC funds co-financed by DGF may
EVALUATION OF THE DANISH GROWTH FUND | DAMVAD.COM 71
also invest in firms coming out of the six incubators
but again the numbers are small.)
Perhaps surprisingly, one of the most appropriate
programmes against which DGF might measure it-
self is the Australian Commonwealth’s Innovation
Investment Fund. This FoF was set up in 1997 and
now is in its third round. IIF has invested DKK 1.1bn
(AUD 221m) matched with DKK 1.7bn (AUD 354m)
of private investment finance.
The Innovation Investment Fund Round 3 objec-
tives28 are to:
develop fund managers with experience in the
early-stage VC industry
by addressing capital constraints and manage-
ment constraints, encourage the development
of new companies that are commercialising
R&D
establish, in the medium term, a ‘revolving’ or
self-funding scheme
develop a self-sustaining, early-stage VC indus-
try in Australia.
As written, these objective accord closely with the
policy ambitions of DGF. Unlike DGF, the IIF pro-
gramme does not operate on a pari passu basis.
However, the government in successive tranches
has reduced its contribution to total funding in order
to reduce the asymmetry of costs and benefits as
the Australian VC industry gained greater experi-
ence and external investor interest. An econometric
evaluation of IIF – of the impact of receiving IIF eq-
uity via the participating funds on the performance
of portfolio companies – was undertaken in 2009. In
28 http://www.ausindustry.gov.au/programs/venture-capi-
tal/iif/Pages/IIF-FactSheets.aspx
a matched sample study of over 300 portfolio com-
panies, it concluded that IIF-supported firms are
more likely to be start-ups in technology-based sec-
tors, to attract multiple financing rounds, and to exit
by either IPO or liquidation. There was no evidence
that IIF funds 'crowd out' private VC providers (Mur-
ray and Cowling 2011; Treasury and DIISRTE,
2013).
5.7 Five questions of policy relevance
5.7.1 Have DGF’s activities advanced the de-
velopment of the Danish VC market?
Based on the interviews conducted in the project
and the data made available by public and private
sources, it is possible to form a view as to whether
DGF has played a crucial role in the development of
the Danish VC market. Several respondents argue
that, since DGF had available capital in times when
it was difficult for private investors to raise capital,
DGF has been pivotal in the development of the
Danish venture market.
The trend towards FoF activity is encouraging. This
has helped to attract private investors for the funds
and partly to develop competencies in the various
management teams who manage the funds which
are supported by DGF.
Several respondents see it as an advantage if DGF
invests in a fund, since its presence can help to at-
tract private investors. DGF is thus clearly acting as
a cornerstone investor in the development of Danish
VC funds. DGF continues to play a significant role
in actively developing the Danish VC market.
72 EVALUATION OF THE DANISH GROWTH FUND | DAMVAD.COM
Respondents emphasised however, that there is
still a need for DGF to remain an active investor in
the Danish VC market because the market is not yet
at a stage where it is mature enough to be self-sus-
taining. Firstly, this situation is believed to be due to
a lack of private capital and secondly, there the fact
that there are still too few competent investors and
fund managers to constitute an efficient market.
5.7.2 Are pari passu investment terms the opti-
mal structure?
The term ‘pari-passu’ refers to loans, bonds or clas-
ses of shares that have equal rights of payment, or
equal seniority.
DGF has laid a considerable emphasis on the fact
that it uses a pari passu arrangement for the distri-
bution of any net capital gains made on its funds’
investments between all limited partners (LPs). Pari
passu can be seen as a symmetrical distribution of
surplus or interest income to all interested parties.
All parties are treated exactly the same regarding
both costs and returns in proportion to their invest-
ment commitment. The alternative is to use an
asymmetric mode of distribution (temporarily or per-
manently) to encourage or reward one investor
group at the expense of other investors. In this latter
case, it is usually the private LPs who benefit, to the
detriment or cost of the public or ‘special’ govern-
ment LP. This private preference is very often made
despite the government LP frequently being the
largest single investor in a co-financed fund. For ex-
ample, individual Enterprise Capital Funds in the UK
can be based on a maximum two-thirds investment
by government.
Pari passu is advantageous precisely because of its
fairness between all parties. No party is given incen-
tives (or constraints) different from any other inves-
tor. This arrangement makes the assumption that all
parties are equally interested or committed to mak-
ing the investment. This assumption might be en-
tirely credible for a large MBO financing; the pre-
IPO investment round of a ‘hot’ technology stock; or
some other situation where the major concern of the
professional financiers is gaining access to an at-
tractive investment opportunity.
However, in the case of encouraging LPs to invest
in seed, start-up or other early-stage venture capital
opportunities, the prime concern of investors is not
will they will be able to subscribe to or otherwise ac-
cess the available shares. Indeed, most LPs are ex-
tremely sceptical about being involved in VC given
the poor historic VC returns and particularly to tech-
nology-based VC funds over several years. Without
some form of additional incentive, it is very unlikely
that all but a very few elite (and largely US) general
partnerships would attract any institutional LP inter-
est at all.
In the case of DGC, the private pension funds have
been attracted by the interest rate paid by DGF on
the loan which is above that received on a govern-
ment bond with comparable risk.
Venture capitalists investing in regions outside of
the world’s premier technology clusters, particularly
if the general partnerships did not have unchal-
lengeable records of successful fund performances,
would find little interest from institutional investors in
the fund raisings on offer. Newly formed general
partnerships without any demonstrable track record
of successful investment would in contemporary
times have a negligible chance of raising a new fund
in established European markets. The only likely ex-
ception would be VC managers who have become
early entrants into a ‘hot’ (i.e. fashionable) novel
sector or technology presently enjoying popularity
among investors and pundits.
It is in this common situation for early-stage VC fund
managers of investor indifference or suspicion that
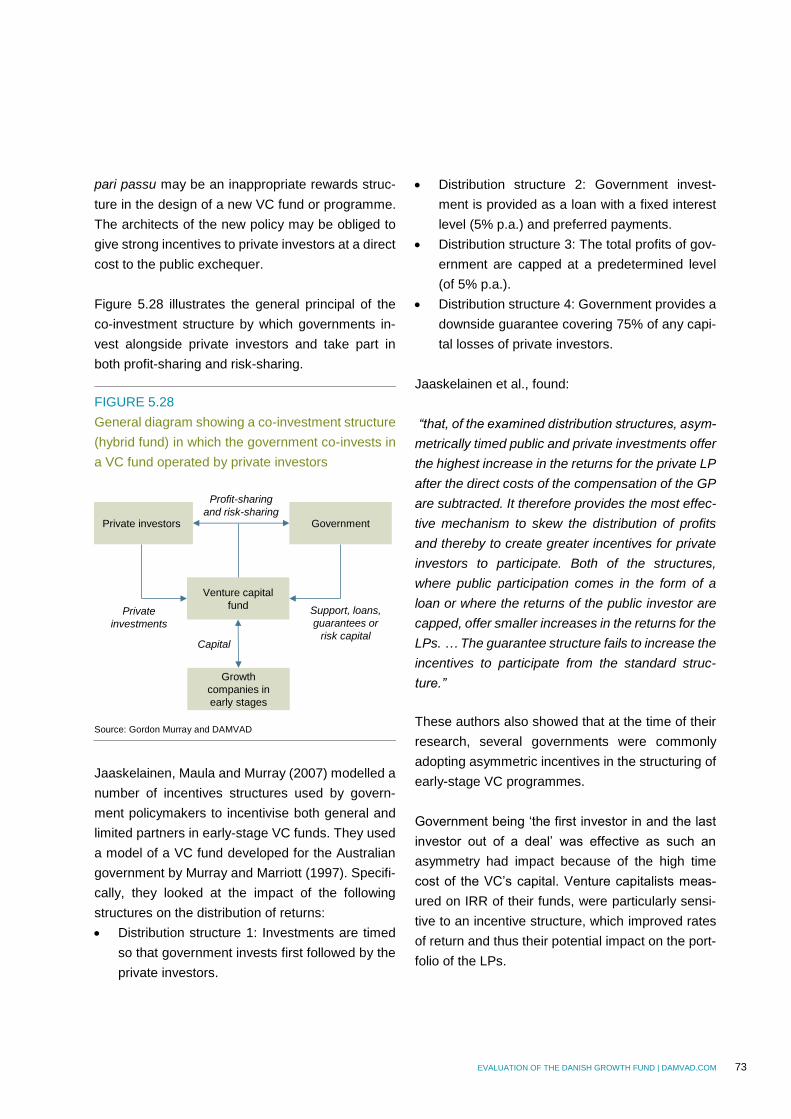
EVALUATION OF THE DANISH GROWTH FUND | DAMVAD.COM 73
pari passu may be an inappropriate rewards struc-
ture in the design of a new VC fund or programme.
The architects of the new policy may be obliged to
give strong incentives to private investors at a direct
cost to the public exchequer.
Figure 5.28 illustrates the general principal of the
co-investment structure by which governments in-
vest alongside private investors and take part in
both profit-sharing and risk-sharing.
FIGURE 5.28
General diagram showing a co-investment structure
(hybrid fund) in which the government co-invests in
a VC fund operated by private investors
Source: Gordon Murray and DAMVAD
Jaaskelainen, Maula and Murray (2007) modelled a
number of incentives structures used by govern-
ment policymakers to incentivise both general and
limited partners in early-stage VC funds. They used
a model of a VC fund developed for the Australian
government by Murray and Marriott (1997). Specifi-
cally, they looked at the impact of the following
structures on the distribution of returns:
Distribution structure 1: Investments are timed
so that government invests first followed by the
private investors.
Distribution structure 2: Government invest-
ment is provided as a loan with a fixed interest
level (5% p.a.) and preferred payments.
Distribution structure 3: The total profits of gov-
ernment are capped at a predetermined level
(of 5% p.a.).
Distribution structure 4: Government provides a
downside guarantee covering 75% of any capi-
tal losses of private investors.
Jaaskelainen et al., found:
“that, of the examined distribution structures, asym-
metrically timed public and private investments offer
the highest increase in the returns for the private LP
after the direct costs of the compensation of the GP
are subtracted. It therefore provides the most effec-
tive mechanism to skew the distribution of profits
and thereby to create greater incentives for private
investors to participate. Both of the structures,
where public participation comes in the form of a
loan or where the returns of the public investor are
capped, offer smaller increases in the returns for the
LPs. … The guarantee structure fails to increase the
incentives to participate from the standard struc-
ture.”
These authors also showed that at the time of their
research, several governments were commonly
adopting asymmetric incentives in the structuring of
early-stage VC programmes.
Government being ‘the first investor in and the last
investor out of a deal’ was effective as such an
asymmetry had impact because of the high time
cost of the VC’s capital. Venture capitalists meas-
ured on IRR of their funds, were particularly sensi-
tive to an incentive structure, which improved rates
of return and thus their potential impact on the port-
folio of the LPs.
Private investors Government
Venture capital
fund
Growth
companies in
early stages
Private
investments
Support, loans,
guarantees or
risk capitalCapital
Profit-sharing
and risk-sharing
74 EVALUATION OF THE DANISH GROWTH FUND | DAMVAD.COM
The point being made is that asymmetric incentive
structures may be a necessary cost in order to influ-
ence the decisions of institutional investors. They
are part of an armoury adopted by government in
order to encourage investors to undertake actions
consistent with government’s policy priorities. The
incentives are a ‘zero sum game’. Government re-
linquishes some of its rights to investment returns
(as an LP) in order that the other LPs and the GP
may take a greater share of any surplus than their
committed capital would warrant on a pro-rata ba-
sis. By a process of experimentation, government
can calculate what costs it has to incur in order to
encourage LP activity in early-stage venture capital.
Thus, asymmetric investment is no better or any
worse than a pari passu structure. It is merely differ-
ent and can be used to add incentives beyond those
available via an equal sharing of investment returns.
It is noteworthy to add that the arrangement of
asymmetry is not fixed. The US, UK and Australian
governments have each changed their incentive ar-
rangements to fit the circumstances pertaining at
the time of the VC programme or fund launch. In the
case of both the UK’s ECF programme and the Aus-
tralian Innovation Investment Fund, different
tranches of the programmes over time have been
introduced with increasingly less asymmetric bene-
fits for private LPs at the expense of the govern-
ment.
However, pari passu arrangements can confer other
benefits. A structure that treats all parties equally is
simple and quick to set up. Importantly, it is signals
a confidence in the quality of its investments by the
state’s unwillingness to give additional advantage to
private parties. In addition, as already noted by a UK
CfEB correspondent, the simplicity and parity of the
structure may achieve regulatory approval more
quickly through the European Commission’s ratifi-
cation of member state exemptions.
5.7.3 Should governments engage in ‘direct’
venture capital investment activity?
Industrial policy as conducted by governments is
undertaken on the assumption that judgements
have to be made regarding the preferential alloca-
tion of scarce capital and other resources. These
assumptions necessarily have to accept the reality
of partial information and imperfect or incomplete
analysis. Thus, policy prescription and executive ac-
tion will always involve both uncertainty and risk,
which may lead to adverse selection. Many observ-
ers often take a sceptical view of this foresight ac-
tivity of government becoming an early commercial
investor in new industries or technologies.
Governments do not have a history of unblemished
success in an activity which is often somewhat dis-
missively described as “picking winners” (Hakim,
1989). Indeed, the term is most often employed to
mean its exact opposite, i.e. the government “pick-
ing losers”. Given the pre-eminent importance cur-
rently accorded to market-based or market-in-
formed decision making in liberal economies, direct
involvement and responsibility for commercial activ-
ity by a government department or delegate organi-
sation will invariably have to be justified.
In the context of venture capital, the balance of opin-
ion has moved to a position that government should
not directly be involved in the investment decision
(Brander et al., 2010; Lerner, 2010; Murray and Lin-
gelbach, 2010; OECD, 2013). Rather, government’s
investment (and thus policy) goals may be more
likely realised if the state assumes a more indirect
role. Namely, government should promote the com-
petitively selection of a skilled, experienced investor
(the VC managing or general partnership) to act as
the agent of government. In electing to use an
agent, government also mandates the selected in-
vestment manager to attract additional private capi-
tal to the fund in which government is likely to be a
EVALUATION OF THE DANISH GROWTH FUND | DAMVAD.COM 75
major contributor but will not wish to be the sole in-
vestor. The direct model has become less popular
over time particularly in countries with a long history
of commercial VC and PE activity. For example, the
UK and US national governments no longer have
any direct VC programmes. Their presence has
similarly been scaled down in a range of countries
including Germany, Finland, Sweden and the Neth-
erlands in favour of collaboration and co-investment
with private VC fund managers.29 The support of the
European Investment Fund for FoF arrangements
at national level has helped to increase this trend.
To academic sceptics of direct publicly-managed
VC investments (Brander et al., 2008; Lerner,
2009), this activity can only be justified if it is de-
signed to be a ‘catalyst’ or ‘pump-primer’ for subse-
quent private investment activity by professional,
rent?? seeking investors acting as the general part-
ners of one or more VC funds. Direct investment
therefore is only sanctioned as a temporary activity.
Of particular concern to academic and many indus-
try observers is that direct activity with its public in-
vestors’ preferential access to ‘soft’ government
money will have an unfair advantage to private in-
vestment managers. The latter have to go to com-
petitive capital markets and will need to pay the full
cost to private investors of the risk associated with
VC investment. In extremis, if the support given to
direct public investors is too generous, commercial
investment managers will either be crowded out of
the market or chose not to enter the market given
the absence of a level playing field regarding access
to and the price of risk capital. Cumming and Mac-
Intosh (2006) examined a Canadian tax-driven ven-
ture capital vehicle known as the "Labour Spon-
sored Venture Capital Corporation" and found that 29 Sweden in particular has been an active direct player in the VC market since the introduction of Foretagskapital in the mid-1970s and successor
crowding out did occur to the extent that the total
supply of VC in Canada was reduced by this pro-
gramme.
In reality, in the absence of extreme examples of
clumsy government intervention, the crowding out
argument is difficult to demonstrate in practice over
a protracted period (since 2000–2001) when the
supply of early-stage VC has been erratic and fre-
quently highly constrained to the majority of young
firm applicants. The very poor returns for VC inves-
tors have similarly reduced the supply of risk capital
in both Europe and North America over the period.
But while such circumstances may give a powerful
argument for a public response, it does not neces-
sarily provide a case for direct investment.
If the assumption is made that the best investors of
risk capital funds will be professional investors with
experience and a track record of success in this in-
vestment activity, then the case for a direct invest-
ment programme can only be made if such private
investors either do not exist or are not prepared to
work as agents in collaboration with a government
supported VC programme to specifically address
the financing of early stage VC activity.
Given that the social rate of return on VC invest-
ments are frequently greater than the commercial
rate of return, (Griliches, 1992), there may well be
occasions where government can – and should –
continue to invest directly in VC when private agents
demur. CEBR (2010) estimated this spill-over as be-
tween 10–50% for DGF’s investments in innovative
young firms. However, such activity contradicts gov-
ernments’ espoused statements of being best seen
as catalysts or pump primers. In reality, for most ad-
vanced western economies, government would
programmes in Industrifonden and the Sixth National Pension Plan (Swe-dish Agency for Growth Policy Analysis, 2010, p.38).
76 EVALUATION OF THE DANISH GROWTH FUND | DAMVAD.COM
wish to delegate the role of VC activity (i.e. both fund
raising and investment) to private capital and its
agents as soon as can be practicably managed.
With a world-wide VC and PE industry measured in
hundreds of billions of dollars, government has far
too many demands on its exchequer to wish to as-
sume a role which appears to be able to be carried
out most effectively in the benchmark country of the
US (and to a lesser extent, the UK) by private indi-
viduals and commercial institutions.
A further argument can be made for direct invest-
ment as part of a portfolio of predominantly indirect
VC-related activities by a government. Essentially,
this argument is based on the government’s need
for market intelligence in the chosen area of inter-
vention, i.e. the early-stage VC market. In order to
invest effectively in partnerships with private rent-
seeking agents, the government needs to be deeply
familiar with the nature of the business including its
risks, profitability, industry terms of trade, etc. This
agency argument implies that government is un-
likely to get unbiased information from its commer-
cial partners. To get an independent view and to re-
move information asymmetries, it has to ‘learn by
doing’. That is, government has to become a ven-
ture capitalist itself.
Undoubtedly, VC agents have vested interests that
would or could influence their negotiations with a
government partner or principal. Fee income, capi-
tal gain (“the carry”) and the modus operandi of the
fund each have to be negotiated. It is highly likely
that inexperienced governments (as well as inexpe-
rienced institutional investors) have occasionally
been overly generous in their arrangements with pri- 30 UK venture capitalist on the Enterprise Capital Funds programme, in the initial negotiations with government, wished to have a majority of the real-ised capital gain from the fund’s VC investments while requiring the gov-ernment investor to take the majority of any losses incurred. The British
vate VC agents.30 Yet there is a considerable incen-
tive for all investors to learn quickly. In the last four-
teen years of the current century, analytical data
and information on VC and PE have grown expo-
nentially. Independent bodies such as the OECD,
the World Bank, the European Commission and the
European Investment Fund, as well as several pro-
fessional data providers and consultancies to the
global financial industry, have provided a flow of in-
formation and analyses of direct relevance to the in-
terests of all parties involved in the VC cycle. The
OECD has been particularly noteworthy as an edu-
cator of policymakers in the areas of entrepreneurial
and innovation finance. Accordingly, the market in-
telligence or ‘learning curve’ rationale for having a
direct VC activity is less credible that it would have
been in the early 2000s.
There may be associated intelligence arguments for
a government interested in assessing the future
market potential of, for example, ‘Cleantech’ or ex-
citing ‘new materials’ in the nanotechnology field.
The argument here revolves around designing ef-
fective innovation systems, the role of the science
base and the (possible) need for public support.
However, such intelligence or investor signals on
long-run commercial value is exactly what an effi-
cient market is supposed to provide. The idea that
government bypasses such a source of information
for its own private trials (via a direct VC activity) is
in danger of supporting the notion that governments
should be ‘second guessing’ markets-makers by an
alternative reliance on their own preferred channels.
A further possible argument for direct government
investment is that agents are likely to ‘drift’ towards
larger and later-stage deals over time given the
government refused to underwrite losses as a condition of its reduced share of any capital gains. Australia in its IIF programme followed this UK practice.
EVALUATION OF THE DANISH GROWTH FUND | DAMVAD.COM 77
commercial attraction of such moves. A govern-
ment-based investor is less vulnerable to such pres-
sures given that management’s incentives for com-
mercial success are usually less valuable to public
servants than their privately employed peers.
5.7.4 Should DGF continue to have a direct VC
activity?
DGF Venture is the direct VC activity within DGF. It
has a current portfolio of some 30 companies that
have received first and/or follow on investment. Fi-
nance is spread across four industry segments: ICT,
Medtech, Cleantech, and industrial technology. It in-
vests at the early stage of VC in seed, start-up or
young growth businesses and provides equity fi-
nance of between DKK 5–25m. It is looking for exit
possibilities of a value of about DKK 3–400m. It is a
‘hands on’ early-stage investor and will demand an
equity stake as well as a position on the board of
any portfolio company that it supports. Its senior in-
vestor team have predominantly forged industrial
careers with a strong emphasis on new-technology-
based firms. Staff are financially incentivised via a
share in the capital multiple of successfully exited
firms in their portfolio. In short, DGF Ventures ap-
pears to operate exactly like an early-stage VC gen-
eral partnership except that its staff is employed by
DGF.
If VF Ventures is a VC general partnership, in func-
tion if not in legal status, the question arises why it
should remain within DGF? Related questions that
might be asked include:
Does it operate in a market space that is not
tackled by other VC firms in Denmark?
Would its portfolio of firms have been able to
raise finance without the existence of VF Ven-
tures?
Would the board of DGF be less informed or un-
able to obtain robust information without the
presence of a highly experienced team of early-
stage VC investors on their payroll?
Does the access of DGF Ventures to DGF’s fi-
nancial resources reduce the opportunity of
other private funds seeking or raising finance
via DGF?
Is this investment activity cost effective in both
scale and impact?
While a number of the above questions are counter-
factual, sufficient time and investment activity has
passed for DGF to come to a view on the ‘pros and
cons’ of have a continued direct VC investment ac-
tivity.
Figures from DGF show investment activity for the
last three years (see Figure 5.29). DGF Venture ac-
tivity engenders interest from non-government co-
investors. This private activity increases over time
with the public investor taking a larger and earlier
risk in portfolio companies. On average, govern-
ment exposure to the portfolio firms remain slightly
over 50% excluding other DGF backed investors.
The reduction in VF Venture’s total investment ex-
posure over the three year period would support the
logic of a pump-priming or catalytic function for di-
rect public investors.
However, as has been shown previously, direct in-
vestment by DGF Ventures is more likely than inde-
pendent GPs to link and follow-on invest in Danish
incubators, thereby supporting a financial escalator
logic. However, DGF’s own analysis shows that
GPs have become less risk averse since the reces-
sion. The share of companies less than two years
old in DGF’s total portfolio has increased from 62%
in 2008–2009 to 71% in 2012. Similarly, the number
of very young portfolio companies with turnovers of
DKK 0–2m at the time of the investment rose from
25% in 2008–2009 to 88% in 2012. While DGF di-
rect ventures may be encouraging, this trend of in-
vesting at the earliest stages (and where the equity
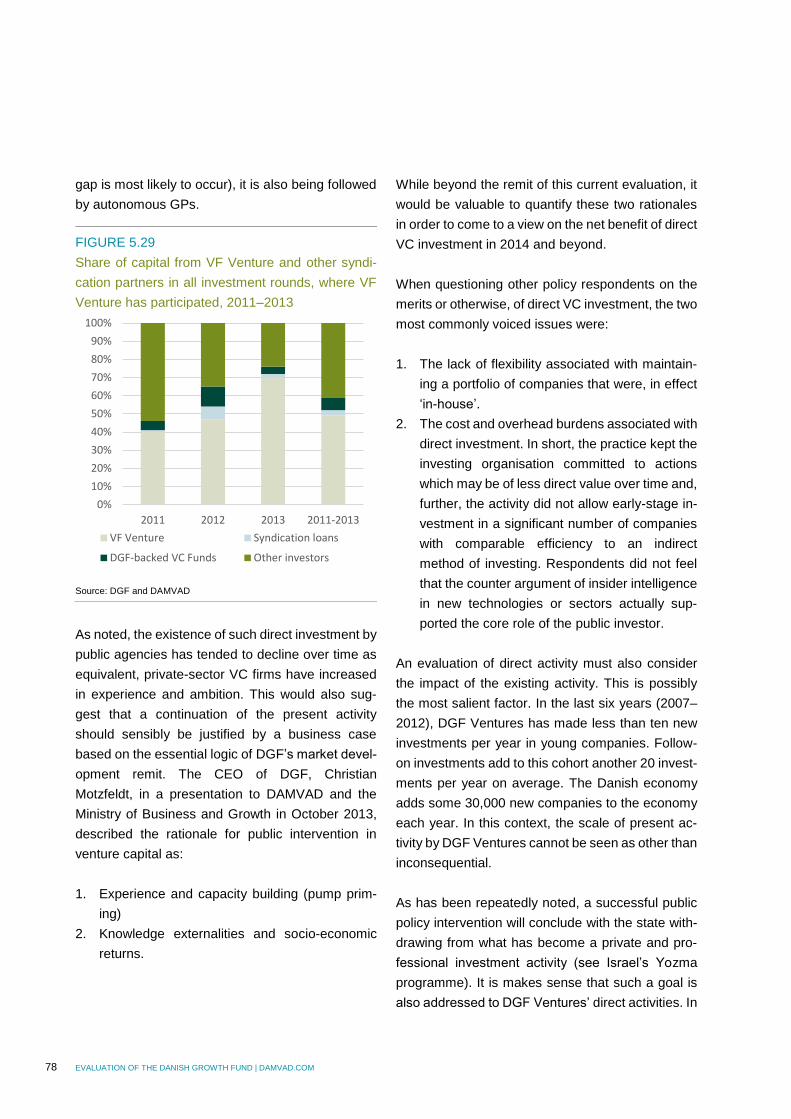
78 EVALUATION OF THE DANISH GROWTH FUND | DAMVAD.COM
gap is most likely to occur), it is also being followed
by autonomous GPs.
FIGURE 5.29
Share of capital from VF Venture and other syndi-
cation partners in all investment rounds, where VF
Venture has participated, 2011–2013
Source: DGF and DAMVAD
As noted, the existence of such direct investment by
public agencies has tended to decline over time as
equivalent, private-sector VC firms have increased
in experience and ambition. This would also sug-
gest that a continuation of the present activity
should sensibly be justified by a business case
based on the essential logic of DGF’s market devel-
opment remit. The CEO of DGF, Christian
Motzfeldt, in a presentation to DAMVAD and the
Ministry of Business and Growth in October 2013,
described the rationale for public intervention in
venture capital as:
1. Experience and capacity building (pump prim-
ing)
2. Knowledge externalities and socio-economic
returns.
While beyond the remit of this current evaluation, it
would be valuable to quantify these two rationales
in order to come to a view on the net benefit of direct
VC investment in 2014 and beyond.
When questioning other policy respondents on the
merits or otherwise, of direct VC investment, the two
most commonly voiced issues were:
1. The lack of flexibility associated with maintain-
ing a portfolio of companies that were, in effect
‘in-house’.
2. The cost and overhead burdens associated with
direct investment. In short, the practice kept the
investing organisation committed to actions
which may be of less direct value over time and,
further, the activity did not allow early-stage in-
vestment in a significant number of companies
with comparable efficiency to an indirect
method of investing. Respondents did not feel
that the counter argument of insider intelligence
in new technologies or sectors actually sup-
ported the core role of the public investor.
An evaluation of direct activity must also consider
the impact of the existing activity. This is possibly
the most salient factor. In the last six years (2007–
2012), DGF Ventures has made less than ten new
investments per year in young companies. Follow-
on investments add to this cohort another 20 invest-
ments per year on average. The Danish economy
adds some 30,000 new companies to the economy
each year. In this context, the scale of present ac-
tivity by DGF Ventures cannot be seen as other than
inconsequential.
As has been repeatedly noted, a successful public
policy intervention will conclude with the state with-
drawing from what has become a private and pro-
fessional investment activity (see Israel’s Yozma
programme). It is makes sense that such a goal is
also addressed to DGF Ventures’ direct activities. In
0%
10%
20%
30%
40%
50%
60%
70%
80%
90%
100%
2011 2012 2013 2011-2013
VF Venture Syndication loans
DGF-backed VC Funds Other investors
EVALUATION OF THE DANISH GROWTH FUND | DAMVAD.COM 79
the absence of competing arguments supporting a
robust economic argument for retention, an increas-
ingly persuasive case for the spin-off into the private
sector of direct VC investment activity may reason-
ably be made.
If the Danish government wishes to continue to en-
gage in direct VC activity, then the scale of activity
needs to increase very significantly indeed. The cur-
rent structure is not large enough to reap any signif-
icant economies of scale or scope. Any resources
directed to such an outcome will need to be com-
pared to alternative uses. Thus, for example, it may
well be sensible to make a direct contrast to an en-
larged and supported Business Angel activity.
5.7.5 Do DGF’s activities encourage private VC
activity?
It is an evident truth that the Danish state has, via
DGF’s efforts, directed substantial investment fi-
nance into seed, start-up and early stage growth ac-
tivities in the Danish VC market in recent years, see
Figures 2.14 and 2.15.
This money has obviously been advantageous for
recipient firms seeking capital for growth. It is a
more difficult question when the advantage for insti-
tutional investors is discussed. Historical activity of
DGF prior to its reorganisation in 2010 is not likely
to result in an attractive return for its investors. Most
aggregated investments in firms by DGF will con-
tinue to have TVPIs of less than one. There have
been no huge wins that turn the economics of the
portfolio on its head.
DGF is only sensibly appraised by its policy ambi-
tions. In the long run these must include the ability
of the Danish VC industry to generate attractive re-
turns that in turn encourage the commitment of un-
subsidised finance from private (and ideally interna-
tional) institutional investors. It is not yet possible to
determine the outcomes from current VC fund sup-
port. DGF is on its third round of fund investments
as is the Sunstone general partnership. Increas-
ingly, the majority of DGF’s activity will be via FoF
structures.
As these autonomous funds develop, their GPs and
investors will have to determine the nature of their
own deal flows including their involvement in seed
and start-up activity. If they follow a pattern recog-
nised in the more mature VC industries of the US
and the UK, VC fund managers are unlikely to wish
to undertake early-stage funding. Rather, their deal
flow is likely to move towards the first round of
growth capital after the original idea and enterprise
has been tested with grants and heavily subsidised,
early-stage risk capital support. We do not see a
change from the present trend in which seed, start-
up and other early-stage activity remain dependent
on continued government subsidy.
While public involvement is likely to remain en-
trenched in the earliest stages of risk capital, the
case for continued public support of later-stage
growth funds remains less compelling. The distribu-
tion of funds between PE and VC in DGF’s FoF ac-
tivities is 3:1. In effect, for every one kroner going to
an early-stage company, later-stage investors are
getting three kroner of funds supported by the state.
The state has borne the lion’s share of risk for the
youngest ventures. Alternatively, it remains the
proper responsibility of the professional VC industry
to generate attractive returns in competitively struc-
tured markets for private equity transactions.
If the above roles between the state and the private
sector are agreed, then the question of the role of
DGF can be answered. DGF has a complementary
role in the encouragement of private VC activity to
the extent that it removes itself and its public finance
from investment stages that should not continue to
enjoy public subsidy.
80 EVALUATION OF THE DANISH GROWTH FUND | DAMVAD.COM
5.8 The scarcity of ‘Business Angels’
In the USA, in 2012, BAs invested DKK 125bn (USD
23bn) in 67,000 investments. The formal VC indus-
try invested DKK 147bn (USD 27bn) in 3,858 ven-
tures in the same year (Centre for Venture Re-
search, 2013; NVCA, 2013). In Europe, DKK 37bn
(€5bn) was invested by BA networks in 2,913 enter-
prises in 2012. The formal VC industry in Europe
also invested DKK 26.9bn (€3.6bn) in 2012 (EVCA,
2013; EBAN, 2014). In both regions, BAs operating
both as individual and group investors invested
monies broadly equivalent to the formal VC indus-
tries. Given reporting difficulties, these aggregate
numbers are likely to underestimate the totality of
informal investing in both regions.
It is notoriously difficult to get independently vali-
dated, performance figures on BA activity. Private
individuals are able to invest as they wish and are
not obliged to give detailed information to govern-
ment. Indeed, many private investors are very reluc-
tant to provide any such information. The only ac-
cess to data is where the private investors also avail
themselves of government co-funding programmes
and/or the tax incentives specifically set up for early-
stage investment activity. However, some VC asso-
ciations recognise the importance of convincing
government of the value of BA. The British Venture
Capital Association has supported several analyses
of BA activity as has the UK Business Angels Asso-
ciation as both parties recognise the complemen-
tary investment interests of VCs and BAs.
The Danish experience is in contrast to several
other schemes in Europe. A 2012 evaluation of EU
member state’s BA activities (CSES, 2012) omits to
mention any Danish activities. According to Chris-
tensen (2011) the fledgling Danish business angel
network was “squeezed between political pres-
sures, impatience and lack of understanding of the
broader benefits of an angel network.” OECD
(2014) estimates that in 2009 only 7% of Danish
growth entrepreneurs had successfully accessed
BA finance. We found little information on BA in
Denmark compared to other European countries.
For example, CSES (2012) estimates German ac-
tivity to be around 5,000–10,000 individual informal
investors with a total investment activity of
DKK 1,493–2,239m (€200–300m) per annum. 10–
20% of the BAs (1,000–1,400) and 25–50% of the
investments are made from Business Angels organ-
ised in BANs. Similarly, the German HTGF program
has a very strong contingent of BA investors who
contributed some DKK 265m (€35.5m) in 2012. This
compares to financing of DKK 166m (€22.2m) from
the German VC industry.
The UK government via the Enterprise Capital Fund
programme has set up a specific BA Co-investment
Fund of DKK 900m (£100m). This initiative is di-
rected at an activity which at the height of the reces-
sion in 2009 still invested DKK 384m (£42.3m) in
238 businesses (BIS 2009). The participation of the
co-fund has seen financing rounds triple to an aver-
age size of DKK 12,25m (£1.35m). Commentators
have argued that the BA Co-fund has allowed BAs
angels to take the place of VC firms which have va-
cated the early-stage investment space (Deloitte
and BBAA, 2013).
In the Netherlands, around half of the 30 seed funds
created, and with total funds under management of
DKK 1,716m (€230m), are composed of BA inves-
tors. Likewise, Vigo has a range of Finnish and in-
ternational investors including high network individ-
uals from both within and outside Finland acting as
business angels to promising high-tech young firms
based in Finland.
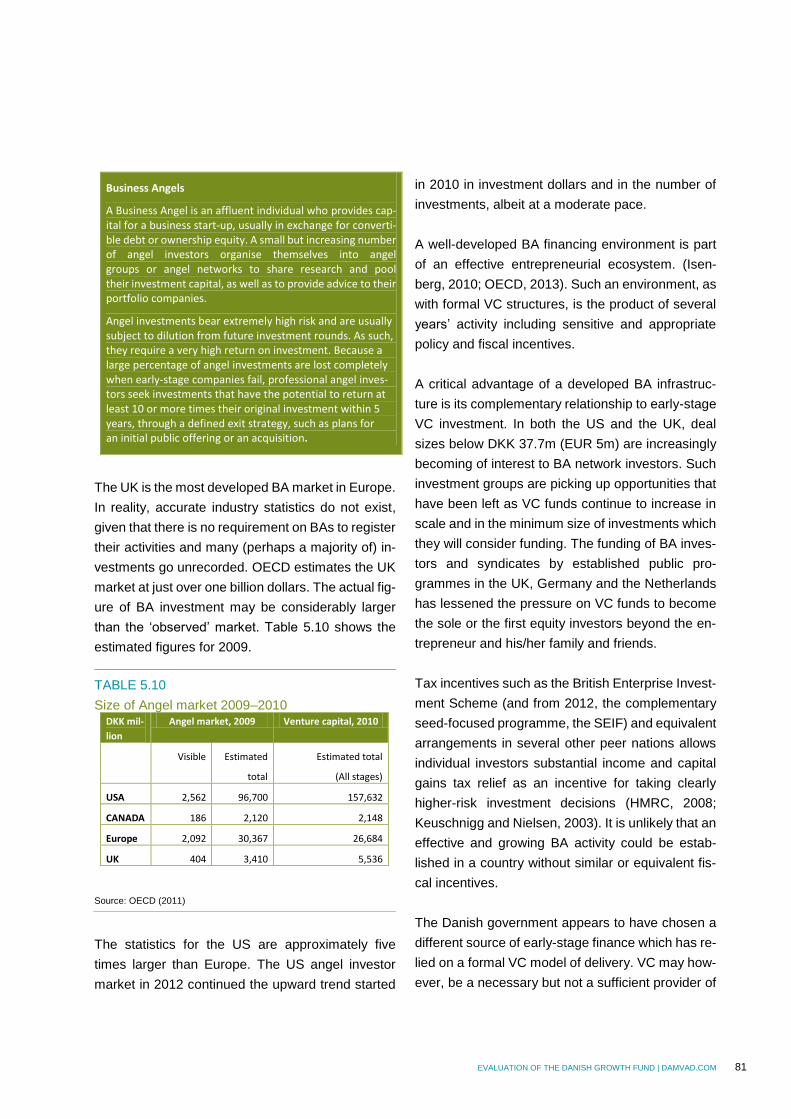
EVALUATION OF THE DANISH GROWTH FUND | DAMVAD.COM 81
Business Angels
A Business Angel is an affluent individual who provides cap-ital for a business start-up, usually in exchange for converti-ble debt or ownership equity. A small but increasing number of angel investors organise themselves into angel groups or angel networks to share research and pool their investment capital, as well as to provide advice to their portfolio companies.
Angel investments bear extremely high risk and are usually subject to dilution from future investment rounds. As such, they require a very high return on investment. Because a large percentage of angel investments are lost completely when early-stage companies fail, professional angel inves-tors seek investments that have the potential to return at least 10 or more times their original investment within 5 years, through a defined exit strategy, such as plans for an initial public offering or an acquisition.
.
The UK is the most developed BA market in Europe.
In reality, accurate industry statistics do not exist,
given that there is no requirement on BAs to register
their activities and many (perhaps a majority of) in-
vestments go unrecorded. OECD estimates the UK
market at just over one billion dollars. The actual fig-
ure of BA investment may be considerably larger
than the ‘observed’ market. Table 5.10 shows the
estimated figures for 2009.
TABLE 5.10
Size of Angel market 2009–2010 DKK mil-
lion
Angel market, 2009 Venture capital, 2010
Visible Estimated
total
Estimated total
(All stages)
USA 2,562 96,700 157,632
CANADA 186 2,120 2,148
Europe 2,092 30,367 26,684
UK 404 3,410 5,536
Source: OECD (2011)
The statistics for the US are approximately five
times larger than Europe. The US angel investor
market in 2012 continued the upward trend started
in 2010 in investment dollars and in the number of
investments, albeit at a moderate pace.
A well-developed BA financing environment is part
of an effective entrepreneurial ecosystem. (Isen-
berg, 2010; OECD, 2013). Such an environment, as
with formal VC structures, is the product of several
years’ activity including sensitive and appropriate
policy and fiscal incentives.
A critical advantage of a developed BA infrastruc-
ture is its complementary relationship to early-stage
VC investment. In both the US and the UK, deal
sizes below DKK 37.7m (EUR 5m) are increasingly
becoming of interest to BA network investors. Such
investment groups are picking up opportunities that
have been left as VC funds continue to increase in
scale and in the minimum size of investments which
they will consider funding. The funding of BA inves-
tors and syndicates by established public pro-
grammes in the UK, Germany and the Netherlands
has lessened the pressure on VC funds to become
the sole or the first equity investors beyond the en-
trepreneur and his/her family and friends.
Tax incentives such as the British Enterprise Invest-
ment Scheme (and from 2012, the complementary
seed-focused programme, the SEIF) and equivalent
arrangements in several other peer nations allows
individual investors substantial income and capital
gains tax relief as an incentive for taking clearly
higher-risk investment decisions (HMRC, 2008;
Keuschnigg and Nielsen, 2003). It is unlikely that an
effective and growing BA activity could be estab-
lished in a country without similar or equivalent fis-
cal incentives.
The Danish government appears to have chosen a
different source of early-stage finance which has re-
lied on a formal VC model of delivery. VC may how-
ever, be a necessary but not a sufficient provider of

82 EVALUATION OF THE DANISH GROWTH FUND | DAMVAD.COM
early-stage risk capital for young businesses. Ac-
cordingly, given the importance of personal compe-
tencies, networks and a well-functioning VC-eco-
system, there may be some merit for the Danish
government in re-visiting the logic and feasibility of
a formalised Danish BA financing activity as part of
its portfolio of risk capital measures.
The fact that a BA programme has been tried in the
past and was found not to be successful is not a
sufficient reason to ignore BA as one possible part
of a future entrepreneurial ecosystem.31 Circum-
stances and market environments change which
may encourage (or discourage) more individuals to
invest either in their own or BA syndicates.
While not the subject of this report, it is important to
mention ‘crowd-funding’ when referring to the infor-
mal investment area (see Financial Conduct
Agency, 2014; Mollick, 2013; NESTA, 2012; Pier-
rakins and Collins, 2013). Crowd-funding in particu-
lar, as it applies to the provision of loans and equity
to new or growing businesses, needs to be consid-
ered by policymakers. In the UK, the growth in these
two areas of entrepreneurial finance appears to be
growing rapidly (see Table 5.11 below). It is an ac-
tivity addressing early-stage and entrepreneurial fi-
nance. Given its newness and its linkages to social
media, this activity remains deeply unfamiliar to
most policymakers. The default position is to look at
protecting the naive or gullible consumer. This is the
stance taken by the Financial Conduct Agency in
determining the degree of governance crowd-fund-
ing services require to ensure that the public is pro-
tected.
However, as Barack Obama noted in announcing
the ‘Jumpstart Our Business Start-ups’ (JOBS Act) 31 The hugely successful Yosma program in Israel was started two years after an earlier policy experiment with VC in Israel had failed.
in May 2012, the bill which includes provisions for
crowd-funding could be a ‘game changer’. It is un-
likely that crowd-funding will be restricted to the
USA or the UK. The Danish government will also
need to consider both its potential and its threats. In
this respect, DGF is likely to have a level of exper-
tise that would make its opinion material and rele-
vant to such a discussion. TABLE 5.11 UK Statistics on Crowd-funding
Type of Crowd-funding
2012 million
2013 million
% Annual change
Securities-based DKK 35 DKK 250 618%
Loan-based DKK 1.690 DKK 4.300 154%
Source: UK statistics on crowd-funding (FCA, 2014)
The fact that most of Denmark’s peer countries in
this evaluation continue to encourage growth in BA
activity suggest this may be an area to re-examine.
BA activity in mature markets both complements
venture capital and, at the earliest stages of enter-
prise finance, is increasingly an effective substitute.
However, any changes to promote BA activity must
also recognise the particular importance of fiscal in-
centives for individual investors.
Similarly, Denmark, in looking at informal investing,
will invariably have to address the potential for
crowd-funding as part of an entrepreneurial finance
escalator. In both cases, DGF’s expertise and mar-
ket knowledge as a practitioner gives it an important
role in policy foresight.
EVALUATION OF THE DANISH GROWTH FUND | DAMVAD.COM 83
5.9 DGF as a convenient government ‘plat-
form’ – comparisons to CfEB
The CfEB has managed seven programmes with a
direct equity focus (Cowling et al., 2011). With the
UK government directly supporting a new bank to
offer support to SMEs beyond that seen as forth-
coming from the UK’s major clearing banks, the
CfEB has metamorphosed into a major part of the
foundations for the new British Business Bank to be
operational in 2014. Importantly, its major extant VC
programme, the Enterprise Capital Funds, will be
subsumed within the new bank. Since the difficulties
consequent on the Global Financial Crisis (GFC),
the UK has put in place a number of support and
guarantee schemes to ensure more bank debt be-
ing made available to SMEs. These schemes were
managed by CFEB.
Twin activities, twin cultures
The senior management of CfEB were asked if the
placing of two very disparate activities – debt financ-
ing and equity financing – within one organisation
could be seen as problematic. The operations of
providing a greater supply of bank debt to SMEs
compared to seeking new (high tech) capital invest-
ment opportunities via a VC programme are driven
by different cultures, logics and systems.
Given that the British Business Bank will not be fully
operational until possibly the end of 2014, it is not
possible to give a full answer to any concerns. How-
ever, it was acknowledged that the new CEO is and
will have to remain very mindful of the two different
(and possibly conflicting) operations that define the
new bank. Similarly, it is believed that DGF will also
have to monitor closely the consequences and im-
pact of its increasing debt role on what has been
historically an equity operation. Venture capital ap-
pears to be a form of economic investment activity,
which benefits from focus and specialisation.
In the UK, where VC was pioneered early than the
rest of Europe, banks were quick to set up in-house
VC operations in the 1980s. With no major excep-
tions, these equity operations were eventually sold
off (sometimes to the bank’s VC managers via a
buy-out). Clashes of culture between the two organ-
isational activities were often cited as a contributory
cause for this division. In addition the Basel II & III
banking regulations have increasingly made the
cost of equity provision too onerous for the retail
banks. Capital adequacy demands occasioned by a
VC operation were constraining their core debt busi-
nesses.
We are not emphatically stating that there is a
schism in DGF. What we are signalling is that there
is the potential for a conflict of cultures between debt
and equity-based organisations, at least in theory.
Risk capital including VC and PE appears to be an
activity best carried out by specialist and highly fo-
cused organisations. DGF is a ‘convenient’ public
platform on which to place a range of policy respon-
sibilities. We raise the point that a diversity of objec-
tives may reduce the effectiveness of specialist op-
erations.
Being Danish in global markets for finance and
technology
Being both ‘local and global’ is a tough goal even for
an advanced economy. It is particularly challenging
for a small country like Denmark with a population
of only 5.6m (World Bank, 2012). Yet, the markets
for risk capital and technology are both global in
scale and meritocratic in nature. External linkages
to the leading markets for capital and technology
are imperative as VC investors seek to identify and
support the best firms regardless of geography. It
should be noted that scale, while assisting, does not
resolve the problem of global linkages. The CEO of
HTG noted that it was difficult to get US interest in
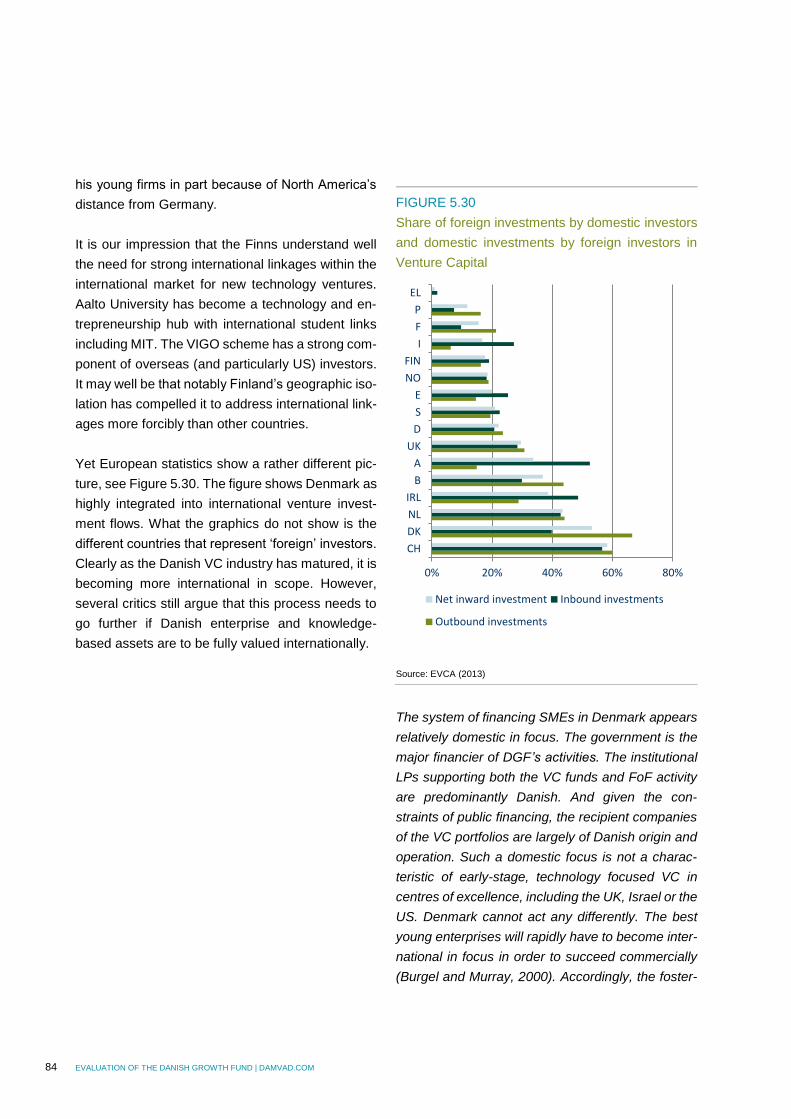
84 EVALUATION OF THE DANISH GROWTH FUND | DAMVAD.COM
his young firms in part because of North America’s
distance from Germany.
It is our impression that the Finns understand well
the need for strong international linkages within the
international market for new technology ventures.
Aalto University has become a technology and en-
trepreneurship hub with international student links
including MIT. The VIGO scheme has a strong com-
ponent of overseas (and particularly US) investors.
It may well be that notably Finland’s geographic iso-
lation has compelled it to address international link-
ages more forcibly than other countries.
Yet European statistics show a rather different pic-
ture, see Figure 5.30. The figure shows Denmark as
highly integrated into international venture invest-
ment flows. What the graphics do not show is the
different countries that represent ‘foreign’ investors.
Clearly as the Danish VC industry has matured, it is
becoming more international in scope. However,
several critics still argue that this process needs to
go further if Danish enterprise and knowledge-
based assets are to be fully valued internationally.
FIGURE 5.30
Share of foreign investments by domestic investors
and domestic investments by foreign investors in
Venture Capital
Source: EVCA (2013)
The system of financing SMEs in Denmark appears
relatively domestic in focus. The government is the
major financier of DGF’s activities. The institutional
LPs supporting both the VC funds and FoF activity
are predominantly Danish. And given the con-
straints of public financing, the recipient companies
of the VC portfolios are largely of Danish origin and
operation. Such a domestic focus is not a charac-
teristic of early-stage, technology focused VC in
centres of excellence, including the UK, Israel or the
US. Denmark cannot act any differently. The best
young enterprises will rapidly have to become inter-
national in focus in order to succeed commercially
(Burgel and Murray, 2000). Accordingly, the foster-
0% 20% 40% 60% 80%
CH
DK
NL
IRL
B
A
UK
D
S
E
NO
FIN
I
F
P
EL
Net inward investment Inbound investments
Outbound investments

EVALUATION OF THE DANISH GROWTH FUND | DAMVAD.COM 85
ing of high levels of reciprocal, cross-border invest-
ment activity, particularly within sectors and technol-
ogies where Denmark can demonstrate exceptional
skills, is a critical condition for the successful devel-
opment of a VC industry.
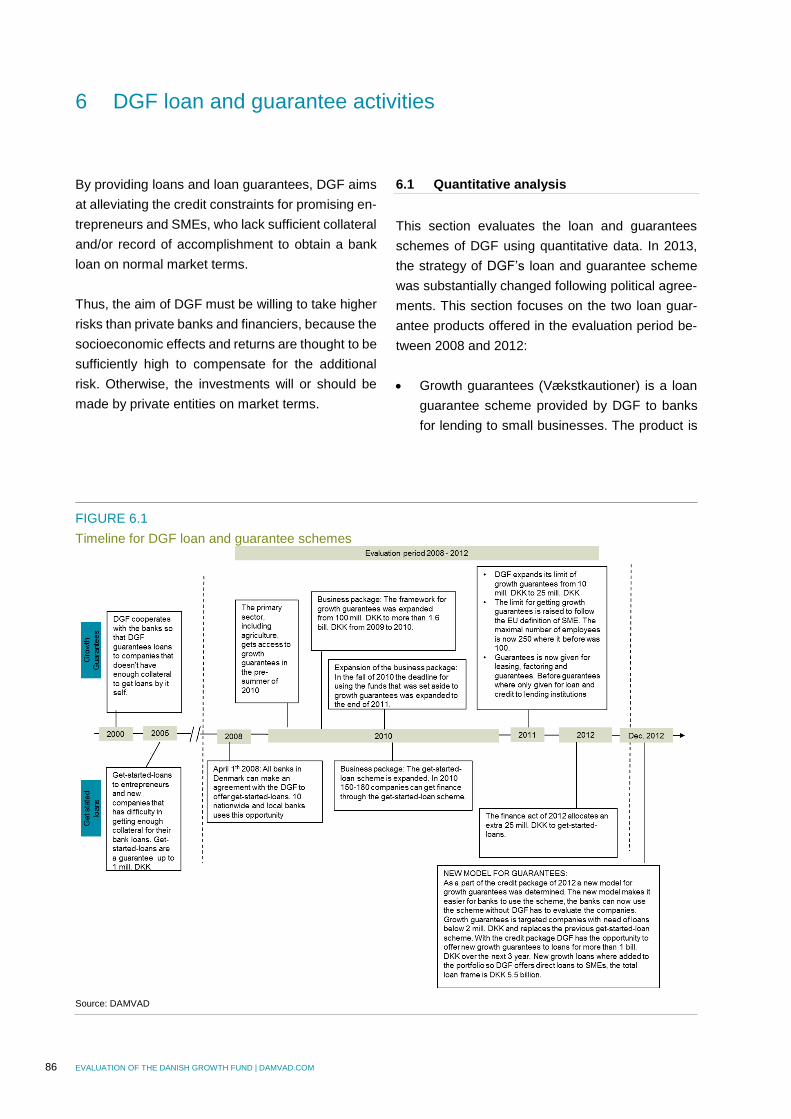
86 EVALUATION OF THE DANISH GROWTH FUND | DAMVAD.COM
By providing loans and loan guarantees, DGF aims
at alleviating the credit constraints for promising en-
trepreneurs and SMEs, who lack sufficient collateral
and/or record of accomplishment to obtain a bank
loan on normal market terms.
Thus, the aim of DGF must be willing to take higher
risks than private banks and financiers, because the
socioeconomic effects and returns are thought to be
sufficiently high to compensate for the additional
risk. Otherwise, the investments will or should be
made by private entities on market terms.
6.1 Quantitative analysis
This section evaluates the loan and guarantees
schemes of DGF using quantitative data. In 2013,
the strategy of DGF’s loan and guarantee scheme
was substantially changed following political agree-
ments. This section focuses on the two loan guar-
antee products offered in the evaluation period be-
tween 2008 and 2012:
Growth guarantees (Vækstkautioner) is a loan
guarantee scheme provided by DGF to banks
for lending to small businesses. The product is
6 DGF loan and guarantee activities
FIGURE 6.1
Timeline for DGF loan and guarantee schemes
Source: DAMVAD
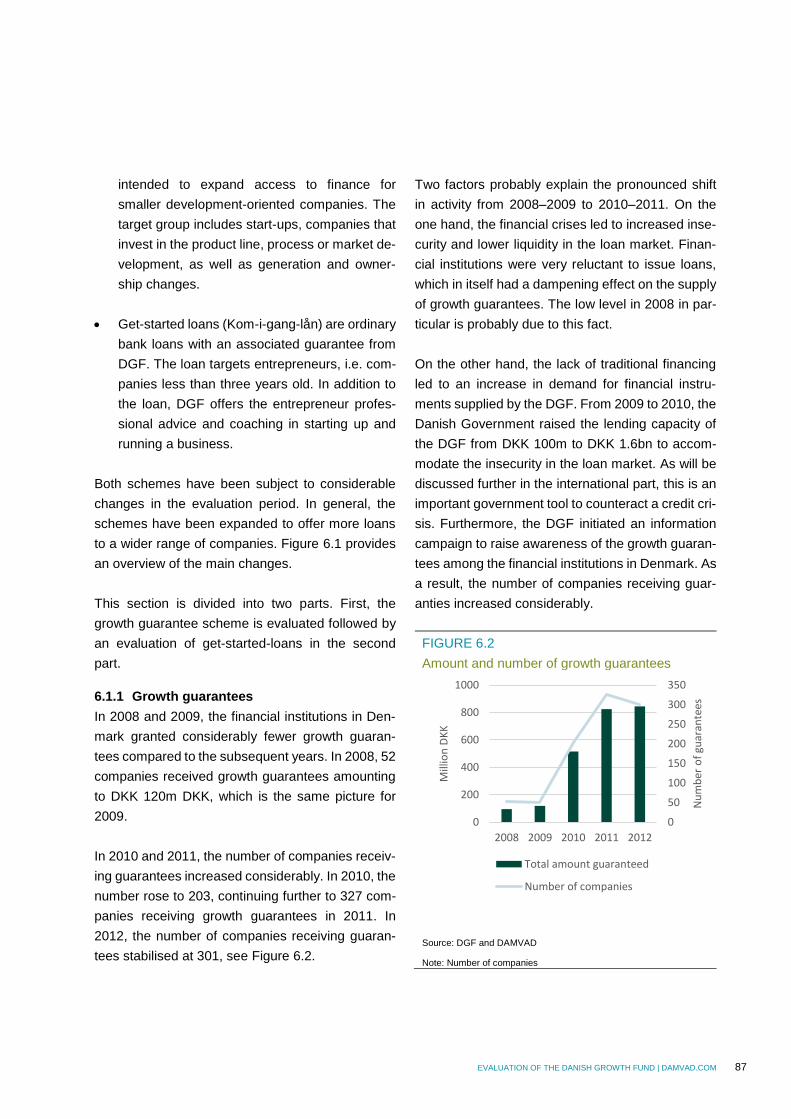
EVALUATION OF THE DANISH GROWTH FUND | DAMVAD.COM 87
intended to expand access to finance for
smaller development-oriented companies. The
target group includes start-ups, companies that
invest in the product line, process or market de-
velopment, as well as generation and owner-
ship changes.
Get-started loans (Kom-i-gang-lån) are ordinary
bank loans with an associated guarantee from
DGF. The loan targets entrepreneurs, i.e. com-
panies less than three years old. In addition to
the loan, DGF offers the entrepreneur profes-
sional advice and coaching in starting up and
running a business.
Both schemes have been subject to considerable
changes in the evaluation period. In general, the
schemes have been expanded to offer more loans
to a wider range of companies. Figure 6.1 provides
an overview of the main changes.
This section is divided into two parts. First, the
growth guarantee scheme is evaluated followed by
an evaluation of get-started-loans in the second
part.
6.1.1 Growth guarantees
In 2008 and 2009, the financial institutions in Den-
mark granted considerably fewer growth guaran-
tees compared to the subsequent years. In 2008, 52
companies received growth guarantees amounting
to DKK 120m DKK, which is the same picture for
2009.
In 2010 and 2011, the number of companies receiv-
ing guarantees increased considerably. In 2010, the
number rose to 203, continuing further to 327 com-
panies receiving growth guarantees in 2011. In
2012, the number of companies receiving guaran-
tees stabilised at 301, see Figure 6.2.
Two factors probably explain the pronounced shift
in activity from 2008–2009 to 2010–2011. On the
one hand, the financial crises led to increased inse-
curity and lower liquidity in the loan market. Finan-
cial institutions were very reluctant to issue loans,
which in itself had a dampening effect on the supply
of growth guarantees. The low level in 2008 in par-
ticular is probably due to this fact.
On the other hand, the lack of traditional financing
led to an increase in demand for financial instru-
ments supplied by the DGF. From 2009 to 2010, the
Danish Government raised the lending capacity of
the DGF from DKK 100m to DKK 1.6bn to accom-
modate the insecurity in the loan market. As will be
discussed further in the international part, this is an
important government tool to counteract a credit cri-
sis. Furthermore, the DGF initiated an information
campaign to raise awareness of the growth guaran-
tees among the financial institutions in Denmark. As
a result, the number of companies receiving guar-
anties increased considerably.
FIGURE 6.2
Amount and number of growth guarantees
Source: DGF and DAMVAD
Note: Number of companies
0
50
100
150
200
250
300
350
0
200
400
600
800
1000
2008 2009 2010 2011 2012
Nu
mb
er o
f gu
aran
tees
Mill
ion
DK
K
Total amount guaranteed
Number of companies
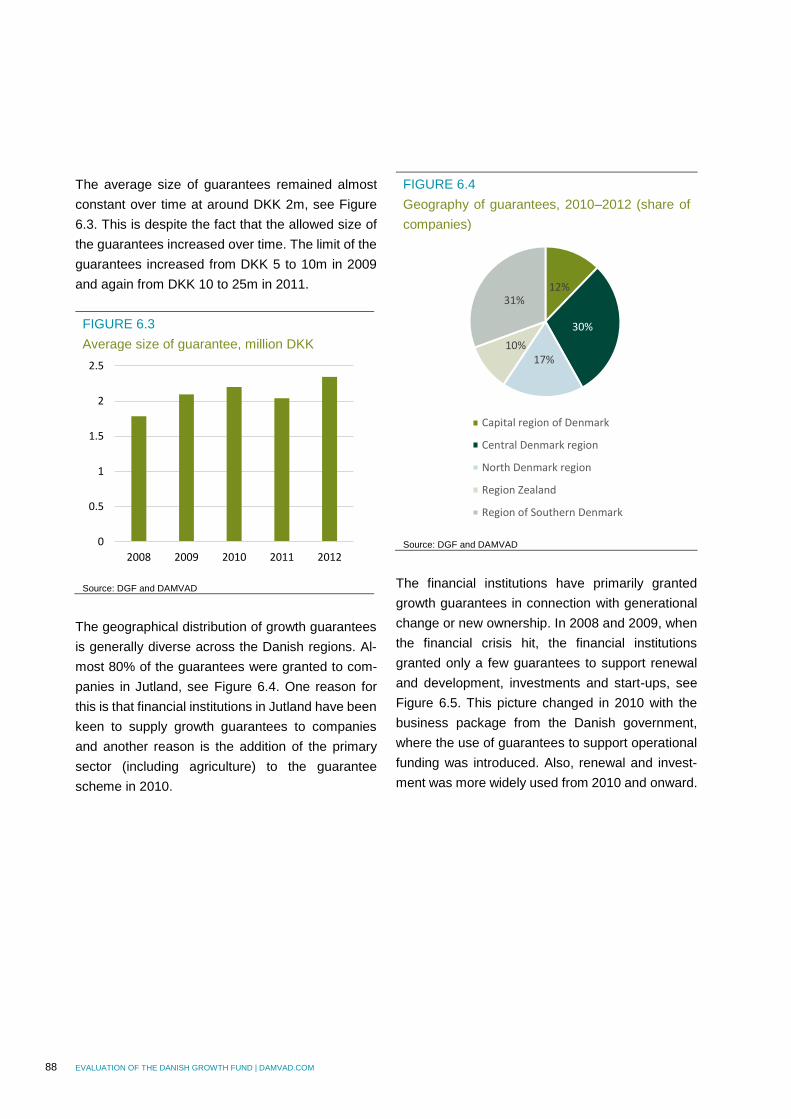
88 EVALUATION OF THE DANISH GROWTH FUND | DAMVAD.COM
The average size of guarantees remained almost
constant over time at around DKK 2m, see Figure
6.3. This is despite the fact that the allowed size of
the guarantees increased over time. The limit of the
guarantees increased from DKK 5 to 10m in 2009
and again from DKK 10 to 25m in 2011.
FIGURE 6.3
Average size of guarantee, million DKK
Source: DGF and DAMVAD
The geographical distribution of growth guarantees
is generally diverse across the Danish regions. Al-
most 80% of the guarantees were granted to com-
panies in Jutland, see Figure 6.4. One reason for
this is that financial institutions in Jutland have been
keen to supply growth guarantees to companies
and another reason is the addition of the primary
sector (including agriculture) to the guarantee
scheme in 2010.
FIGURE 6.4
Geography of guarantees, 2010–2012 (share of
companies)
Source: DGF and DAMVAD
The financial institutions have primarily granted
growth guarantees in connection with generational
change or new ownership. In 2008 and 2009, when
the financial crisis hit, the financial institutions
granted only a few guarantees to support renewal
and development, investments and start-ups, see
Figure 6.5. This picture changed in 2010 with the
business package from the Danish government,
where the use of guarantees to support operational
funding was introduced. Also, renewal and invest-
ment was more widely used from 2010 and onward.
0
0.5
1
1.5
2
2.5
2008 2009 2010 2011 2012
12%
30%
17%10%
31%
Capital region of Denmark
Central Denmark region
North Denmark region
Region Zealand
Region of Southern Denmark
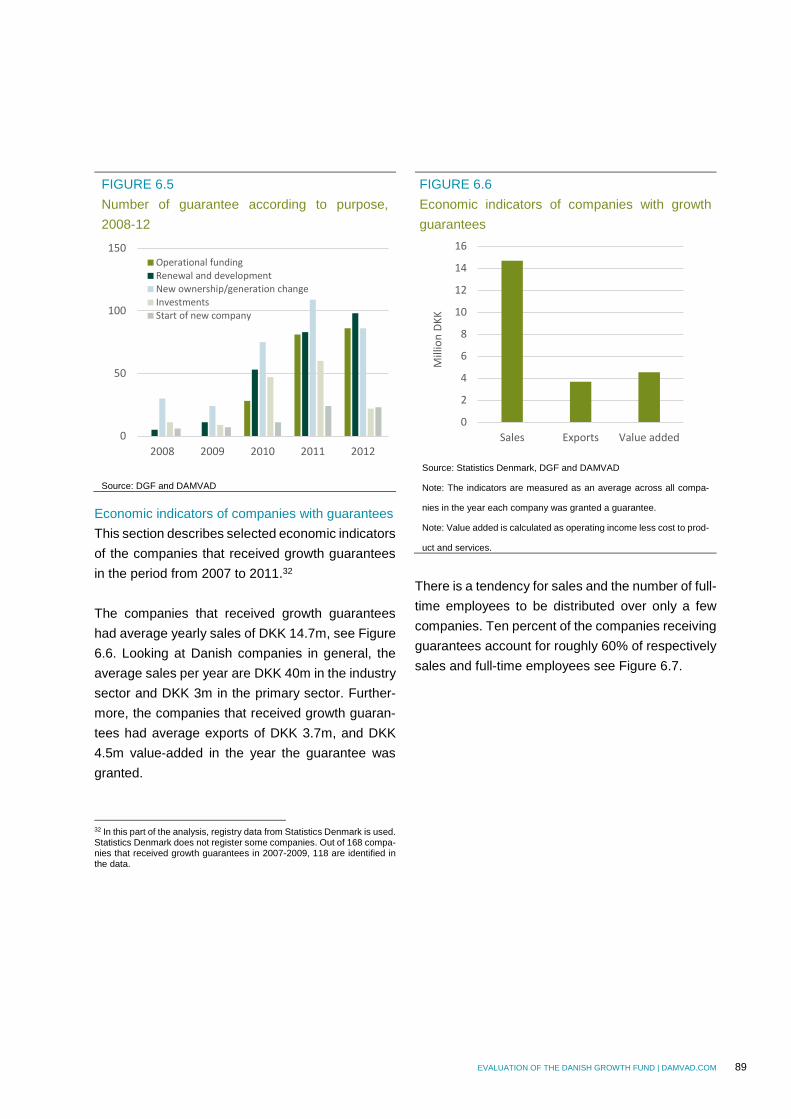
EVALUATION OF THE DANISH GROWTH FUND | DAMVAD.COM 89
FIGURE 6.5
Number of guarantee according to purpose,
2008-12
Source: DGF and DAMVAD
Economic indicators of companies with guarantees
This section describes selected economic indicators
of the companies that received growth guarantees
in the period from 2007 to 2011.32
The companies that received growth guarantees
had average yearly sales of DKK 14.7m, see Figure
6.6. Looking at Danish companies in general, the
average sales per year are DKK 40m in the industry
sector and DKK 3m in the primary sector. Further-
more, the companies that received growth guaran-
tees had average exports of DKK 3.7m, and DKK
4.5m value-added in the year the guarantee was
granted. 32 In this part of the analysis, registry data from Statistics Denmark is used. Statistics Denmark does not register some companies. Out of 168 compa-nies that received growth guarantees in 2007-2009, 118 are identified in the data.
FIGURE 6.6
Economic indicators of companies with growth
guarantees
Source: Statistics Denmark, DGF and DAMVAD
Note: The indicators are measured as an average across all compa-
nies in the year each company was granted a guarantee.
Note: Value added is calculated as operating income less cost to prod-
uct and services.
There is a tendency for sales and the number of full-
time employees to be distributed over only a few
companies. Ten percent of the companies receiving
guarantees account for roughly 60% of respectively
sales and full-time employees see Figure 6.7.
0
50
100
150
2008 2009 2010 2011 2012
Operational fundingRenewal and developmentNew ownership/generation changeInvestmentsStart of new company
0
2
4
6
8
10
12
14
16
Sales Exports Value addedM
illio
n D
KK
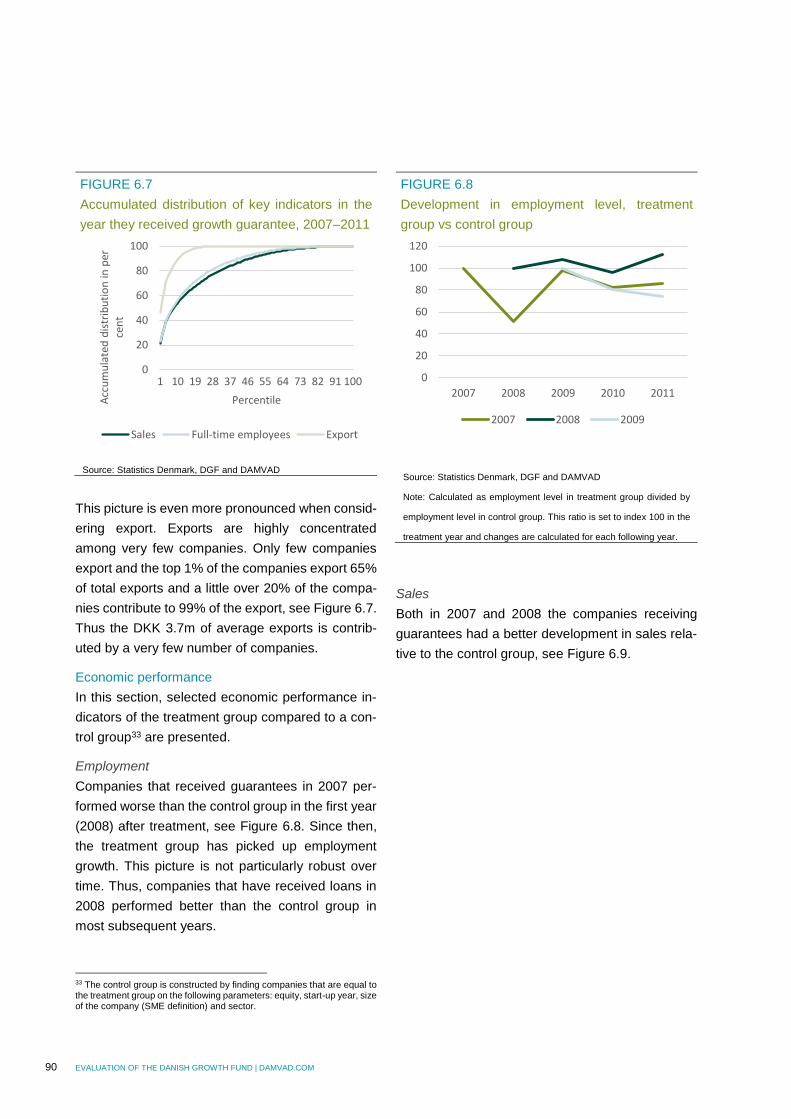
90 EVALUATION OF THE DANISH GROWTH FUND | DAMVAD.COM
FIGURE 6.7
Accumulated distribution of key indicators in the
year they received growth guarantee, 2007–2011
Source: Statistics Denmark, DGF and DAMVAD
This picture is even more pronounced when consid-
ering export. Exports are highly concentrated
among very few companies. Only few companies
export and the top 1% of the companies export 65%
of total exports and a little over 20% of the compa-
nies contribute to 99% of the export, see Figure 6.7.
Thus the DKK 3.7m of average exports is contrib-
uted by a very few number of companies.
Economic performance
In this section, selected economic performance in-
dicators of the treatment group compared to a con-
trol group33 are presented.
Employment
Companies that received guarantees in 2007 per-
formed worse than the control group in the first year
(2008) after treatment, see Figure 6.8. Since then,
the treatment group has picked up employment
growth. This picture is not particularly robust over
time. Thus, companies that have received loans in
2008 performed better than the control group in
most subsequent years. 33 The control group is constructed by finding companies that are equal to the treatment group on the following parameters: equity, start-up year, size of the company (SME definition) and sector.
FIGURE 6.8
Development in employment level, treatment
group vs control group
Source: Statistics Denmark, DGF and DAMVAD
Note: Calculated as employment level in treatment group divided by
employment level in control group. This ratio is set to index 100 in the
treatment year and changes are calculated for each following year.
Sales
Both in 2007 and 2008 the companies receiving
guarantees had a better development in sales rela-
tive to the control group, see Figure 6.9.
0
20
40
60
80
100
1 10 19 28 37 46 55 64 73 82 91 100
Acc
um
ula
ted
dis
trib
uti
on
in p
er
cen
t
Percentile
Sales Full-time employees Export
0
20
40
60
80
100
120
2007 2008 2009 2010 2011
2007 2008 2009
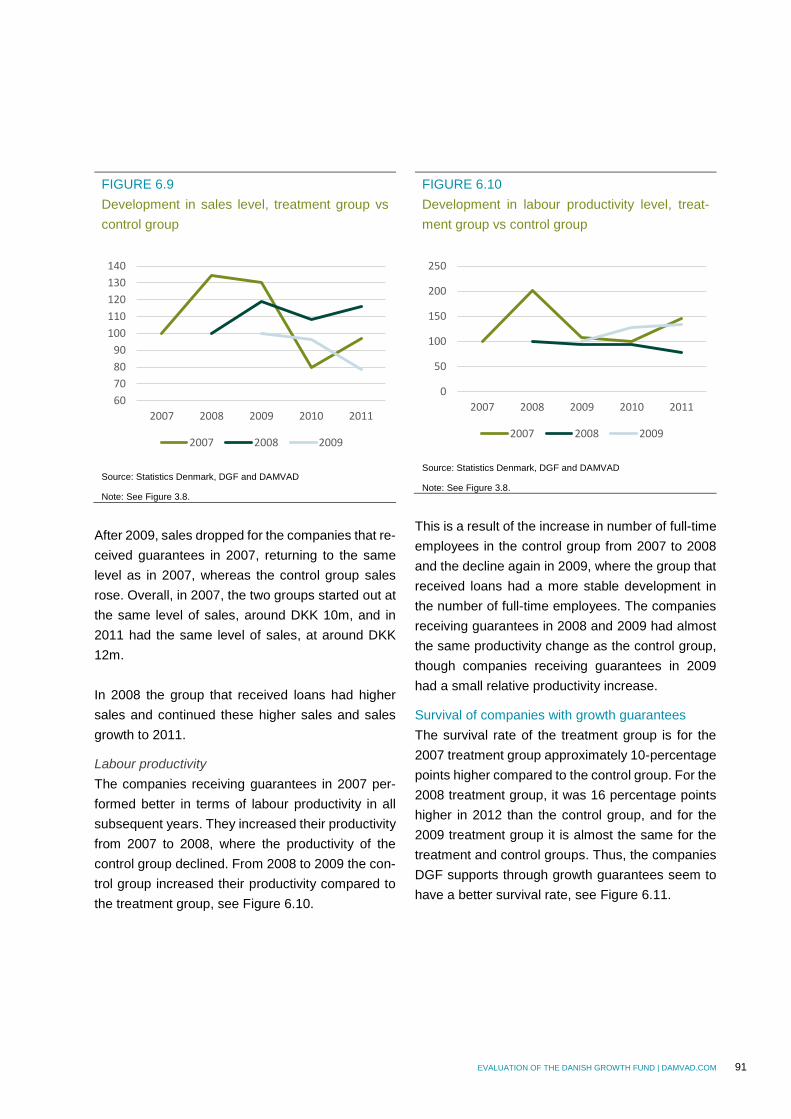
EVALUATION OF THE DANISH GROWTH FUND | DAMVAD.COM 91
FIGURE 6.9
Development in sales level, treatment group vs
control group
Source: Statistics Denmark, DGF and DAMVAD
Note: See Figure 3.8.
After 2009, sales dropped for the companies that re-
ceived guarantees in 2007, returning to the same
level as in 2007, whereas the control group sales
rose. Overall, in 2007, the two groups started out at
the same level of sales, around DKK 10m, and in
2011 had the same level of sales, at around DKK
12m.
In 2008 the group that received loans had higher
sales and continued these higher sales and sales
growth to 2011.
Labour productivity
The companies receiving guarantees in 2007 per-
formed better in terms of labour productivity in all
subsequent years. They increased their productivity
from 2007 to 2008, where the productivity of the
control group declined. From 2008 to 2009 the con-
trol group increased their productivity compared to
the treatment group, see Figure 6.10.
FIGURE 6.10
Development in labour productivity level, treat-
ment group vs control group
Source: Statistics Denmark, DGF and DAMVAD
Note: See Figure 3.8.
This is a result of the increase in number of full-time
employees in the control group from 2007 to 2008
and the decline again in 2009, where the group that
received loans had a more stable development in
the number of full-time employees. The companies
receiving guarantees in 2008 and 2009 had almost
the same productivity change as the control group,
though companies receiving guarantees in 2009
had a small relative productivity increase.
Survival of companies with growth guarantees
The survival rate of the treatment group is for the
2007 treatment group approximately 10-percentage
points higher compared to the control group. For the
2008 treatment group, it was 16 percentage points
higher in 2012 than the control group, and for the
2009 treatment group it is almost the same for the
treatment and control groups. Thus, the companies
DGF supports through growth guarantees seem to
have a better survival rate, see Figure 6.11.
60
70
80
90
100
110
120
130
140
2007 2008 2009 2010 2011
2007 2008 2009
0
50
100
150
200
250
2007 2008 2009 2010 2011
2007 2008 2009
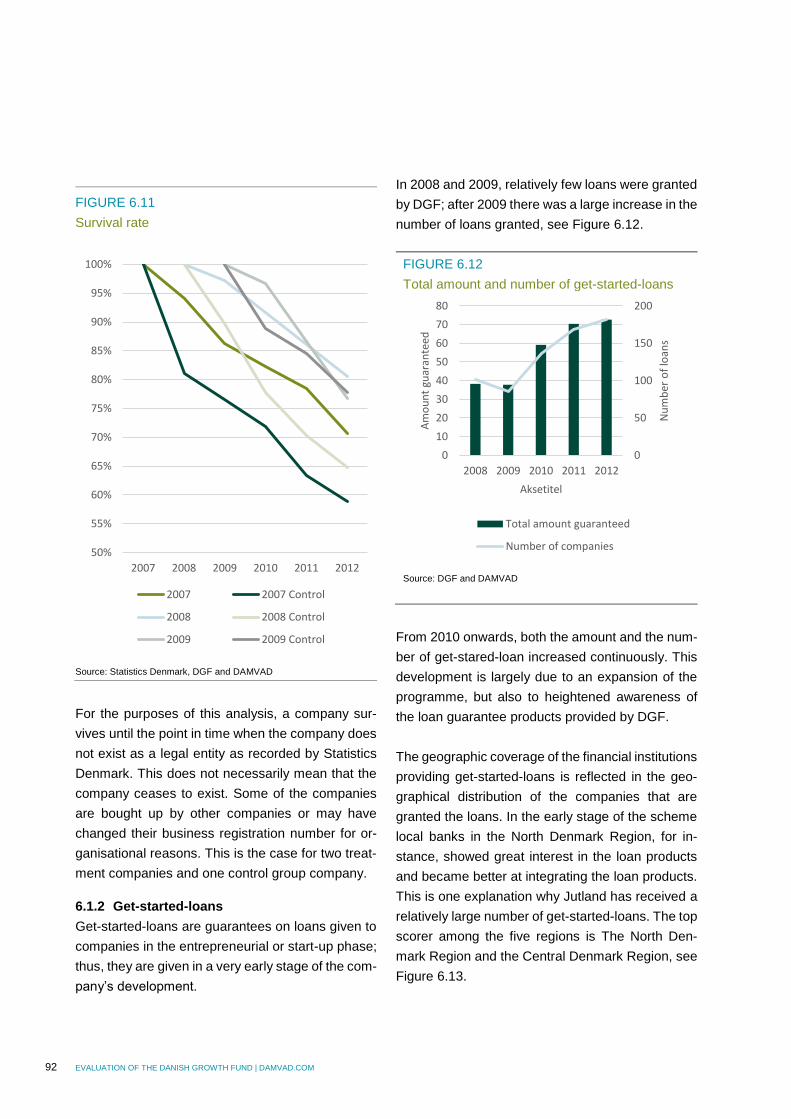
92 EVALUATION OF THE DANISH GROWTH FUND | DAMVAD.COM
FIGURE 6.11
Survival rate
Source: Statistics Denmark, DGF and DAMVAD
For the purposes of this analysis, a company sur-
vives until the point in time when the company does
not exist as a legal entity as recorded by Statistics
Denmark. This does not necessarily mean that the
company ceases to exist. Some of the companies
are bought up by other companies or may have
changed their business registration number for or-
ganisational reasons. This is the case for two treat-
ment companies and one control group company.
6.1.2 Get-started-loans
Get-started-loans are guarantees on loans given to
companies in the entrepreneurial or start-up phase;
thus, they are given in a very early stage of the com-
pany’s development.
In 2008 and 2009, relatively few loans were granted
by DGF; after 2009 there was a large increase in the
number of loans granted, see Figure 6.12.
FIGURE 6.12
Total amount and number of get-started-loans
Source: DGF and DAMVAD
From 2010 onwards, both the amount and the num-
ber of get-stared-loan increased continuously. This
development is largely due to an expansion of the
programme, but also to heightened awareness of
the loan guarantee products provided by DGF.
The geographic coverage of the financial institutions
providing get-started-loans is reflected in the geo-
graphical distribution of the companies that are
granted the loans. In the early stage of the scheme
local banks in the North Denmark Region, for in-
stance, showed great interest in the loan products
and became better at integrating the loan products.
This is one explanation why Jutland has received a
relatively large number of get-started-loans. The top
scorer among the five regions is The North Den-
mark Region and the Central Denmark Region, see
Figure 6.13.
50%
55%
60%
65%
70%
75%
80%
85%
90%
95%
100%
2007 2008 2009 2010 2011 2012
2007 2007 Control
2008 2008 Control
2009 2009 Control
0
50
100
150
200
0
10
20
30
40
50
60
70
80
2008 2009 2010 2011 2012
Nu
mb
er o
f lo
ans
Am
ou
nt
guar
ante
ed
Aksetitel
Total amount guaranteed
Number of companies
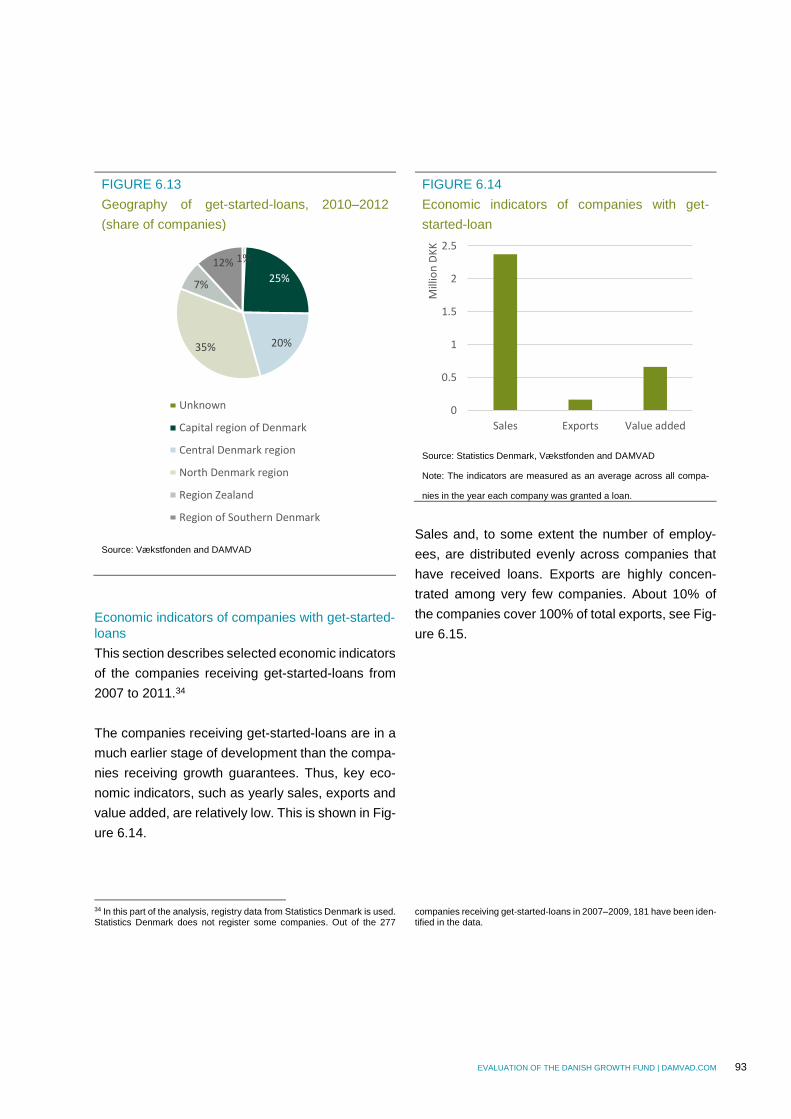
EVALUATION OF THE DANISH GROWTH FUND | DAMVAD.COM 93
FIGURE 6.13
Geography of get-started-loans, 2010–2012
(share of companies)
Source: Vækstfonden and DAMVAD
Economic indicators of companies with get-started-
loans
This section describes selected economic indicators
of the companies receiving get-started-loans from
2007 to 2011.34
The companies receiving get-started-loans are in a
much earlier stage of development than the compa-
nies receiving growth guarantees. Thus, key eco-
nomic indicators, such as yearly sales, exports and
value added, are relatively low. This is shown in Fig-
ure 6.14.
34 In this part of the analysis, registry data from Statistics Denmark is used. Statistics Denmark does not register some companies. Out of the 277
FIGURE 6.14
Economic indicators of companies with get-
started-loan
Source: Statistics Denmark, Vækstfonden and DAMVAD
Note: The indicators are measured as an average across all compa-
nies in the year each company was granted a loan.
Sales and, to some extent the number of employ-
ees, are distributed evenly across companies that
have received loans. Exports are highly concen-
trated among very few companies. About 10% of
the companies cover 100% of total exports, see Fig-
ure 6.15.
companies receiving get-started-loans in 2007–2009, 181 have been iden-tified in the data.
1%
25%
20%35%
7%
12%
Unknown
Capital region of Denmark
Central Denmark region
North Denmark region
Region Zealand
Region of Southern Denmark
0
0.5
1
1.5
2
2.5
Sales Exports Value addedM
illio
n D
KK
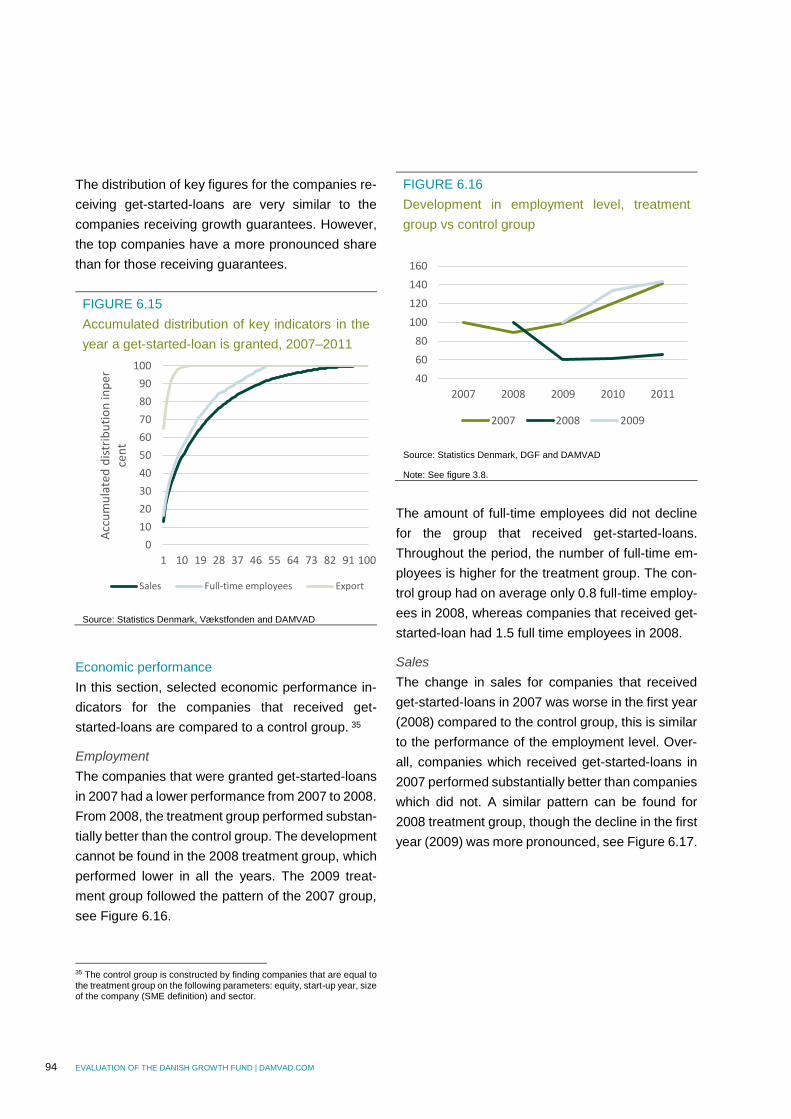
94 EVALUATION OF THE DANISH GROWTH FUND | DAMVAD.COM
The distribution of key figures for the companies re-
ceiving get-started-loans are very similar to the
companies receiving growth guarantees. However,
the top companies have a more pronounced share
than for those receiving guarantees.
FIGURE 6.15
Accumulated distribution of key indicators in the
year a get-started-loan is granted, 2007–2011
Source: Statistics Denmark, Vækstfonden and DAMVAD
Economic performance
In this section, selected economic performance in-
dicators for the companies that received get-
started-loans are compared to a control group. 35
Employment
The companies that were granted get-started-loans
in 2007 had a lower performance from 2007 to 2008.
From 2008, the treatment group performed substan-
tially better than the control group. The development
cannot be found in the 2008 treatment group, which
performed lower in all the years. The 2009 treat-
ment group followed the pattern of the 2007 group,
see Figure 6.16. 35 The control group is constructed by finding companies that are equal to the treatment group on the following parameters: equity, start-up year, size of the company (SME definition) and sector.
FIGURE 6.16
Development in employment level, treatment
group vs control group
Source: Statistics Denmark, DGF and DAMVAD
Note: See figure 3.8.
The amount of full-time employees did not decline
for the group that received get-started-loans.
Throughout the period, the number of full-time em-
ployees is higher for the treatment group. The con-
trol group had on average only 0.8 full-time employ-
ees in 2008, whereas companies that received get-
started-loan had 1.5 full time employees in 2008.
Sales
The change in sales for companies that received
get-started-loans in 2007 was worse in the first year
(2008) compared to the control group, this is similar
to the performance of the employment level. Over-
all, companies which received get-started-loans in
2007 performed substantially better than companies
which did not. A similar pattern can be found for
2008 treatment group, though the decline in the first
year (2009) was more pronounced, see Figure 6.17.
0
10
20
30
40
50
60
70
80
90
100
1 10 19 28 37 46 55 64 73 82 91 100
Acc
um
ula
ted
dis
trib
uti
on
inp
er
cen
t
Sales Full-time employees Export
40
60
80
100
120
140
160
2007 2008 2009 2010 2011
2007 2008 2009
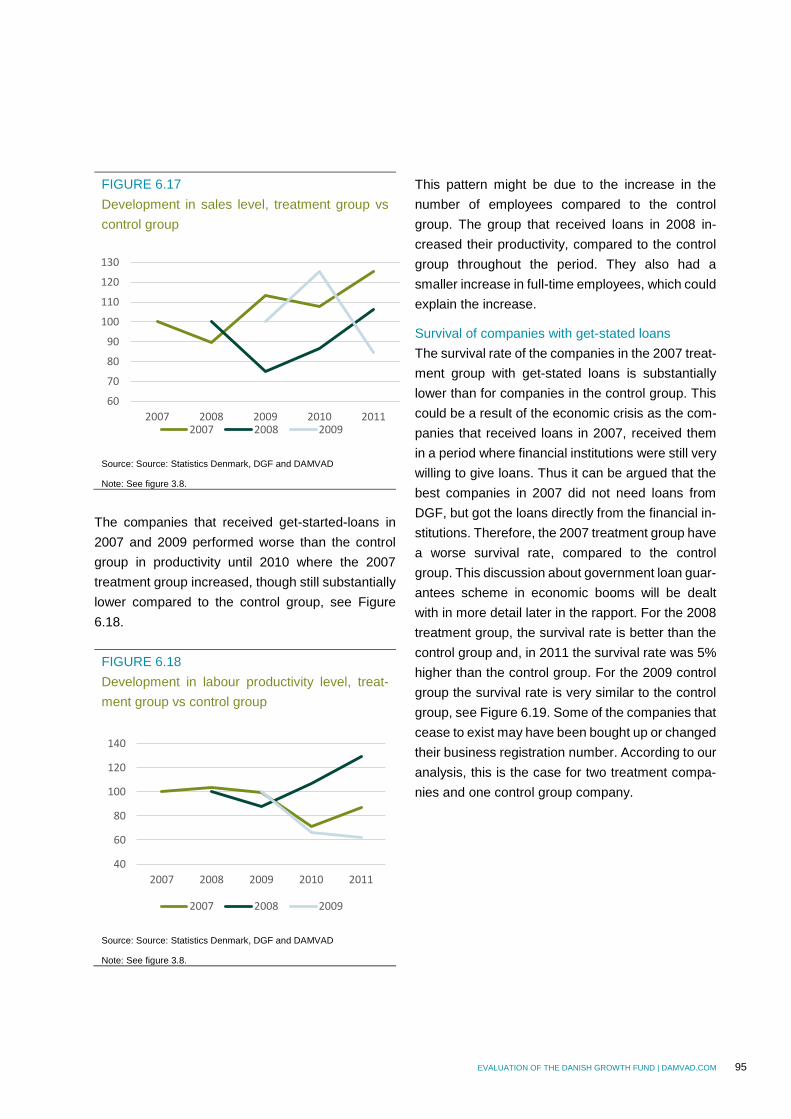
EVALUATION OF THE DANISH GROWTH FUND | DAMVAD.COM 95
FIGURE 6.17
Development in sales level, treatment group vs
control group
Source: Source: Statistics Denmark, DGF and DAMVAD
Note: See figure 3.8.
The companies that received get-started-loans in
2007 and 2009 performed worse than the control
group in productivity until 2010 where the 2007
treatment group increased, though still substantially
lower compared to the control group, see Figure
6.18.
FIGURE 6.18
Development in labour productivity level, treat-
ment group vs control group
Source: Source: Statistics Denmark, DGF and DAMVAD
Note: See figure 3.8.
This pattern might be due to the increase in the
number of employees compared to the control
group. The group that received loans in 2008 in-
creased their productivity, compared to the control
group throughout the period. They also had a
smaller increase in full-time employees, which could
explain the increase.
Survival of companies with get-stated loans
The survival rate of the companies in the 2007 treat-
ment group with get-stated loans is substantially
lower than for companies in the control group. This
could be a result of the economic crisis as the com-
panies that received loans in 2007, received them
in a period where financial institutions were still very
willing to give loans. Thus it can be argued that the
best companies in 2007 did not need loans from
DGF, but got the loans directly from the financial in-
stitutions. Therefore, the 2007 treatment group have
a worse survival rate, compared to the control
group. This discussion about government loan guar-
antees scheme in economic booms will be dealt
with in more detail later in the rapport. For the 2008
treatment group, the survival rate is better than the
control group and, in 2011 the survival rate was 5%
higher than the control group. For the 2009 control
group the survival rate is very similar to the control
group, see Figure 6.19. Some of the companies that
cease to exist may have been bought up or changed
their business registration number. According to our
analysis, this is the case for two treatment compa-
nies and one control group company.
60
70
80
90
100
110
120
130
2007 2008 2009 2010 20112007 2008 2009
40
60
80
100
120
140
2007 2008 2009 2010 2011
2007 2008 2009
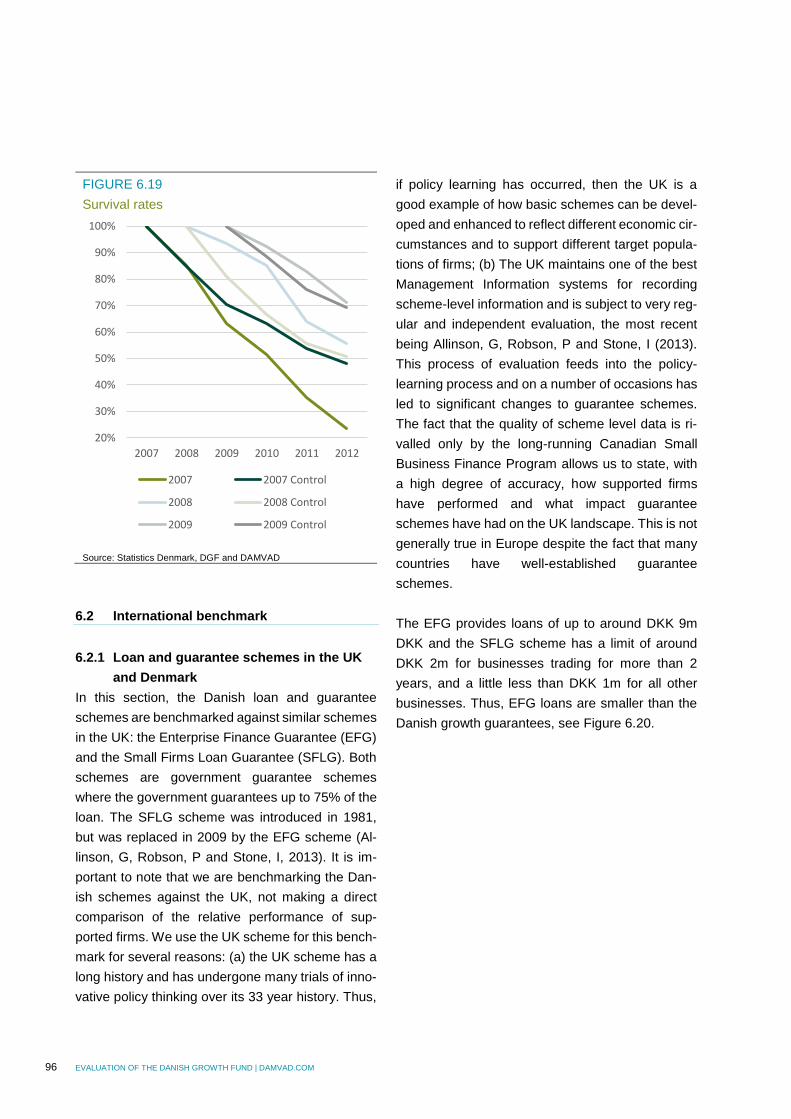
96 EVALUATION OF THE DANISH GROWTH FUND | DAMVAD.COM
FIGURE 6.19
Survival rates
Source: Statistics Denmark, DGF and DAMVAD
6.2 International benchmark
6.2.1 Loan and guarantee schemes in the UK
and Denmark
In this section, the Danish loan and guarantee
schemes are benchmarked against similar schemes
in the UK: the Enterprise Finance Guarantee (EFG)
and the Small Firms Loan Guarantee (SFLG). Both
schemes are government guarantee schemes
where the government guarantees up to 75% of the
loan. The SFLG scheme was introduced in 1981,
but was replaced in 2009 by the EFG scheme (Al-
linson, G, Robson, P and Stone, I, 2013). It is im-
portant to note that we are benchmarking the Dan-
ish schemes against the UK, not making a direct
comparison of the relative performance of sup-
ported firms. We use the UK scheme for this bench-
mark for several reasons: (a) the UK scheme has a
long history and has undergone many trials of inno-
vative policy thinking over its 33 year history. Thus,
if policy learning has occurred, then the UK is a
good example of how basic schemes can be devel-
oped and enhanced to reflect different economic cir-
cumstances and to support different target popula-
tions of firms; (b) The UK maintains one of the best
Management Information systems for recording
scheme-level information and is subject to very reg-
ular and independent evaluation, the most recent
being Allinson, G, Robson, P and Stone, I (2013).
This process of evaluation feeds into the policy-
learning process and on a number of occasions has
led to significant changes to guarantee schemes.
The fact that the quality of scheme level data is ri-
valled only by the long-running Canadian Small
Business Finance Program allows us to state, with
a high degree of accuracy, how supported firms
have performed and what impact guarantee
schemes have had on the UK landscape. This is not
generally true in Europe despite the fact that many
countries have well-established guarantee
schemes.
The EFG provides loans of up to around DKK 9m
DKK and the SFLG scheme has a limit of around
DKK 2m for businesses trading for more than 2
years, and a little less than DKK 1m for all other
businesses. Thus, EFG loans are smaller than the
Danish growth guarantees, see Figure 6.20.
20%
30%
40%
50%
60%
70%
80%
90%
100%
2007 2008 2009 2010 2011 2012
2007 2007 Control
2008 2008 Control
2009 2009 Control

EVALUATION OF THE DANISH GROWTH FUND | DAMVAD.COM 97
FIGURE 6.20
Size of investments,%
Source: DGF, Enterprise Finance Guarantee (EFG) scheme: economic
evaluation and DAMVAD
It is important to notice that in the economic devel-
opment in the two countries and in the years the
companies are treated general economic develop-
ment plays a significant role in how the companies
develop. Figure 6.21 illustrates the GDP growth
rates of the two countries.
FIGURE 6.21
Real GDP growth rates,%
Source: Eurostat
The development in GDP has been close to the
same in UK and Denmark though the drop in GDP
began a year earlier in Denmark compared to the
UK, and from 2011 to 2012 the Danish growth rate
was negative and the UK GDP growth rate dropped,
but without becoming negative growth as in Den-
mark.
6.2.2 Comparison of companies in schemes
When comparing the Danish and the UK companies
it is important to note the size of the companies in
the year they received treatment. When looking at
sales and employment the companies in the EFG
scheme are larger compared to the Danish compa-
nies, see table 6.1.
When comparing the value added at the time of
treatment, the companies in the EFG resemble the
Danish companies. For the SLFG scheme the sales
of the UK and the Danish companies are close to
the same, though the companies in the SLFG
scheme have more employees than their Danish
counterparts.
0.0
5.0
10.0
15.0
20.0
25.0
30.0
35.0
40.0
per
cen
t
Value of schemes measured in GBP
EFG Growth guarantee
-8
-6
-4
-2
0
2
4
6
2003 2004 2005 2006 2007 2008 2009 2010 2011 2012
DK UK
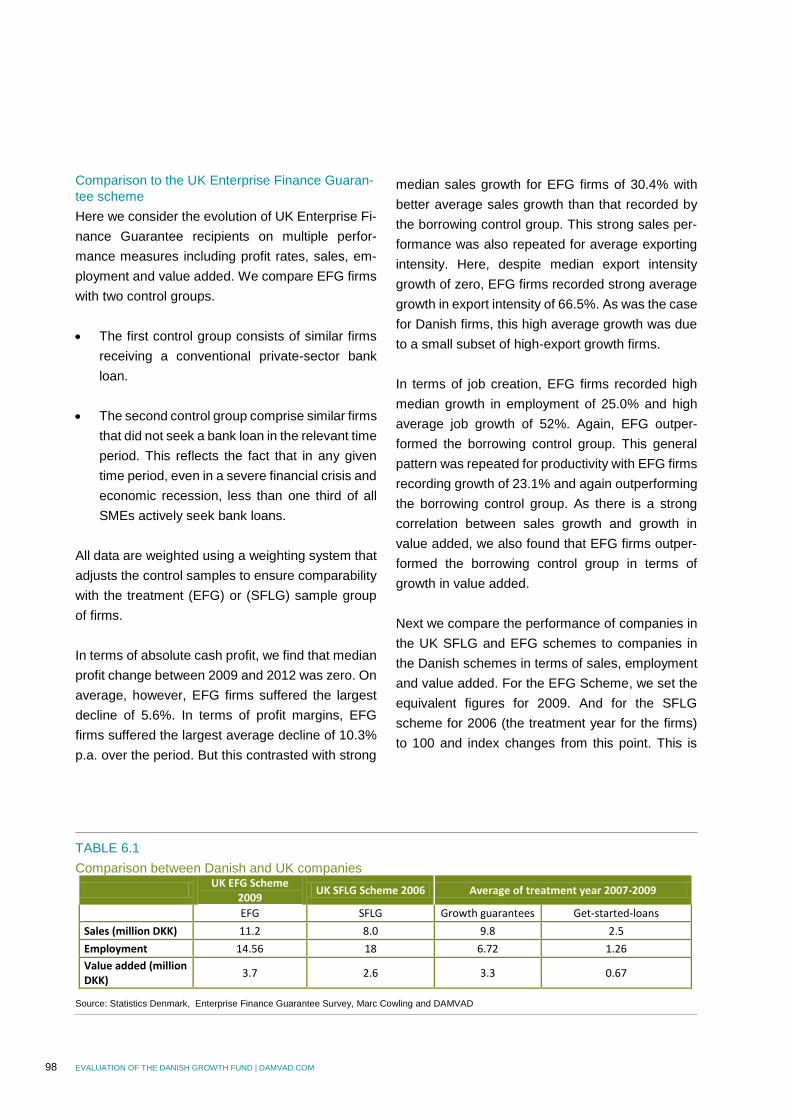
98 EVALUATION OF THE DANISH GROWTH FUND | DAMVAD.COM
Comparison to the UK Enterprise Finance Guaran-
tee scheme
Here we consider the evolution of UK Enterprise Fi-
nance Guarantee recipients on multiple perfor-
mance measures including profit rates, sales, em-
ployment and value added. We compare EFG firms
with two control groups.
The first control group consists of similar firms
receiving a conventional private-sector bank
loan.
The second control group comprise similar firms
that did not seek a bank loan in the relevant time
period. This reflects the fact that in any given
time period, even in a severe financial crisis and
economic recession, less than one third of all
SMEs actively seek bank loans.
All data are weighted using a weighting system that
adjusts the control samples to ensure comparability
with the treatment (EFG) or (SFLG) sample group
of firms.
In terms of absolute cash profit, we find that median
profit change between 2009 and 2012 was zero. On
average, however, EFG firms suffered the largest
decline of 5.6%. In terms of profit margins, EFG
firms suffered the largest average decline of 10.3%
p.a. over the period. But this contrasted with strong
median sales growth for EFG firms of 30.4% with
better average sales growth than that recorded by
the borrowing control group. This strong sales per-
formance was also repeated for average exporting
intensity. Here, despite median export intensity
growth of zero, EFG firms recorded strong average
growth in export intensity of 66.5%. As was the case
for Danish firms, this high average growth was due
to a small subset of high-export growth firms.
In terms of job creation, EFG firms recorded high
median growth in employment of 25.0% and high
average job growth of 52%. Again, EFG outper-
formed the borrowing control group. This general
pattern was repeated for productivity with EFG firms
recording growth of 23.1% and again outperforming
the borrowing control group. As there is a strong
correlation between sales growth and growth in
value added, we also found that EFG firms outper-
formed the borrowing control group in terms of
growth in value added.
Next we compare the performance of companies in
the UK SFLG and EFG schemes to companies in
the Danish schemes in terms of sales, employment
and value added. For the EFG Scheme, we set the
equivalent figures for 2009. And for the SFLG
scheme for 2006 (the treatment year for the firms)
to 100 and index changes from this point. This is
TABLE 6.1
Comparison between Danish and UK companies
UK EFG Scheme
2009 UK SFLG Scheme 2006 Average of treatment year 2007-2009
EFG SFLG Growth guarantees Get-started-loans
Sales (million DKK) 11.2 8.0 9.8 2.5
Employment 14.56 18 6.72 1.26
Value added (million DKK)
3.7 2.6 3.3 0.67
Source: Statistics Denmark, Enterprise Finance Guarantee Survey, Marc Cowling and DAMVAD
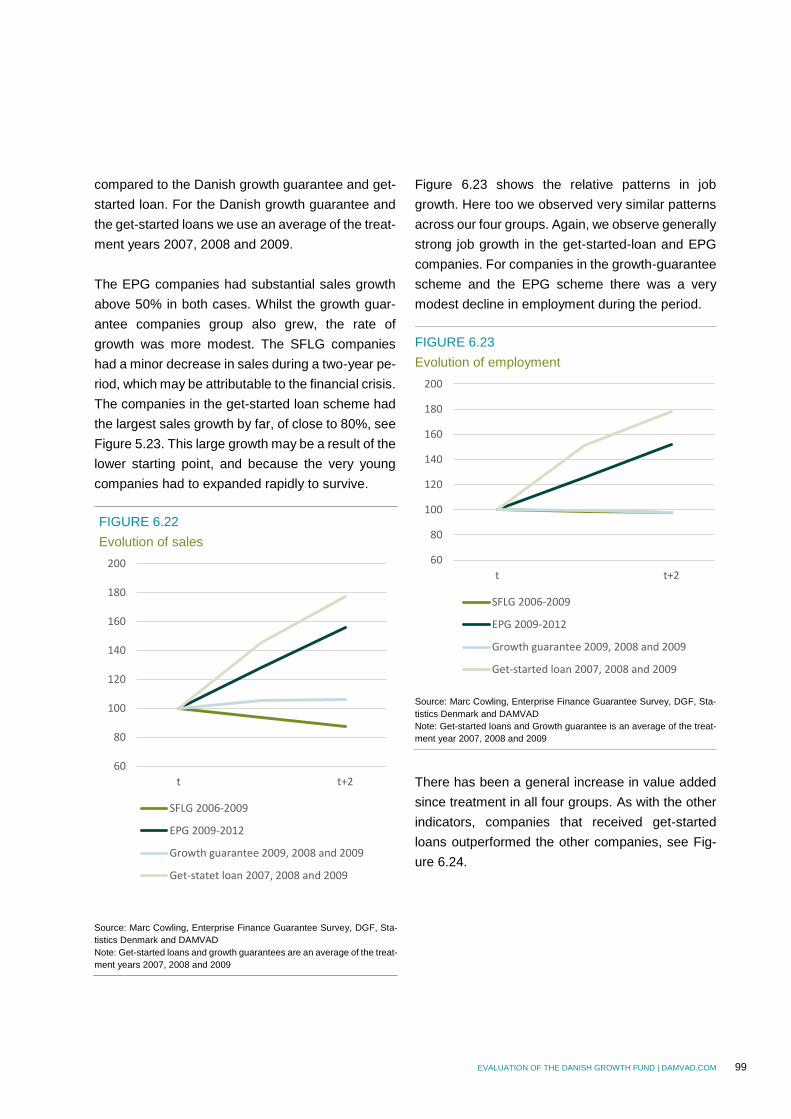
EVALUATION OF THE DANISH GROWTH FUND | DAMVAD.COM 99
compared to the Danish growth guarantee and get-
started loan. For the Danish growth guarantee and
the get-started loans we use an average of the treat-
ment years 2007, 2008 and 2009.
The EPG companies had substantial sales growth
above 50% in both cases. Whilst the growth guar-
antee companies group also grew, the rate of
growth was more modest. The SFLG companies
had a minor decrease in sales during a two-year pe-
riod, which may be attributable to the financial crisis.
The companies in the get-started loan scheme had
the largest sales growth by far, of close to 80%, see
Figure 5.23. This large growth may be a result of the
lower starting point, and because the very young
companies had to expanded rapidly to survive.
FIGURE 6.22
Evolution of sales
Source: Marc Cowling, Enterprise Finance Guarantee Survey, DGF, Sta-
tistics Denmark and DAMVAD
Note: Get-started loans and growth guarantees are an average of the treat-
ment years 2007, 2008 and 2009
Figure 6.23 shows the relative patterns in job
growth. Here too we observed very similar patterns
across our four groups. Again, we observe generally
strong job growth in the get-started-loan and EPG
companies. For companies in the growth-guarantee
scheme and the EPG scheme there was a very
modest decline in employment during the period.
FIGURE 6.23
Evolution of employment
Source: Marc Cowling, Enterprise Finance Guarantee Survey, DGF, Sta-
tistics Denmark and DAMVAD
Note: Get-started loans and Growth guarantee is an average of the treat-
ment year 2007, 2008 and 2009
There has been a general increase in value added
since treatment in all four groups. As with the other
indicators, companies that received get-started
loans outperformed the other companies, see Fig-
ure 6.24.
60
80
100
120
140
160
180
200
t t+2
SFLG 2006-2009
EPG 2009-2012
Growth guarantee 2009, 2008 and 2009
Get-statet loan 2007, 2008 and 2009
60
80
100
120
140
160
180
200
t t+2
SFLG 2006-2009
EPG 2009-2012
Growth guarantee 2009, 2008 and 2009
Get-started loan 2007, 2008 and 2009
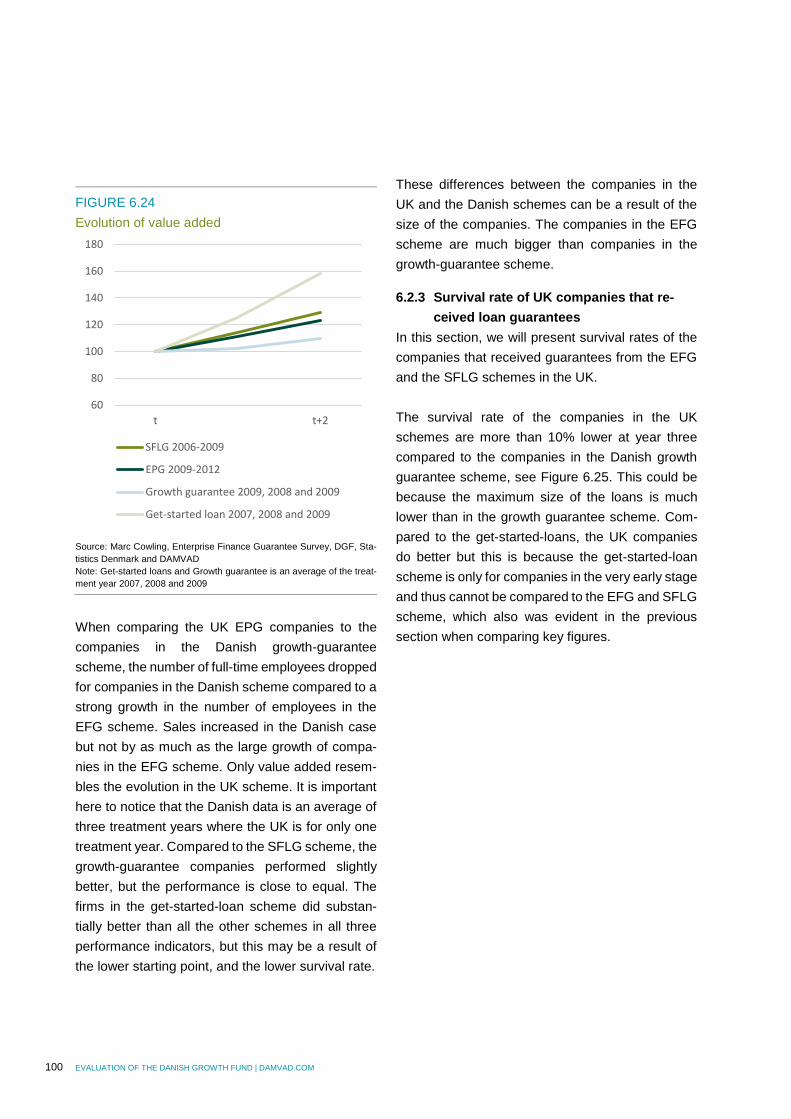
100 EVALUATION OF THE DANISH GROWTH FUND | DAMVAD.COM
FIGURE 6.24
Evolution of value added
Source: Marc Cowling, Enterprise Finance Guarantee Survey, DGF, Sta-
tistics Denmark and DAMVAD
Note: Get-started loans and Growth guarantee is an average of the treat-
ment year 2007, 2008 and 2009
When comparing the UK EPG companies to the
companies in the Danish growth-guarantee
scheme, the number of full-time employees dropped
for companies in the Danish scheme compared to a
strong growth in the number of employees in the
EFG scheme. Sales increased in the Danish case
but not by as much as the large growth of compa-
nies in the EFG scheme. Only value added resem-
bles the evolution in the UK scheme. It is important
here to notice that the Danish data is an average of
three treatment years where the UK is for only one
treatment year. Compared to the SFLG scheme, the
growth-guarantee companies performed slightly
better, but the performance is close to equal. The
firms in the get-started-loan scheme did substan-
tially better than all the other schemes in all three
performance indicators, but this may be a result of
the lower starting point, and the lower survival rate.
These differences between the companies in the
UK and the Danish schemes can be a result of the
size of the companies. The companies in the EFG
scheme are much bigger than companies in the
growth-guarantee scheme.
6.2.3 Survival rate of UK companies that re-
ceived loan guarantees
In this section, we will present survival rates of the
companies that received guarantees from the EFG
and the SFLG schemes in the UK.
The survival rate of the companies in the UK
schemes are more than 10% lower at year three
compared to the companies in the Danish growth
guarantee scheme, see Figure 6.25. This could be
because the maximum size of the loans is much
lower than in the growth guarantee scheme. Com-
pared to the get-started-loans, the UK companies
do better but this is because the get-started-loan
scheme is only for companies in the very early stage
and thus cannot be compared to the EFG and SFLG
scheme, which also was evident in the previous
section when comparing key figures.
60
80
100
120
140
160
180
t t+2
SFLG 2006-2009
EPG 2009-2012
Growth guarantee 2009, 2008 and 2009
Get-started loan 2007, 2008 and 2009
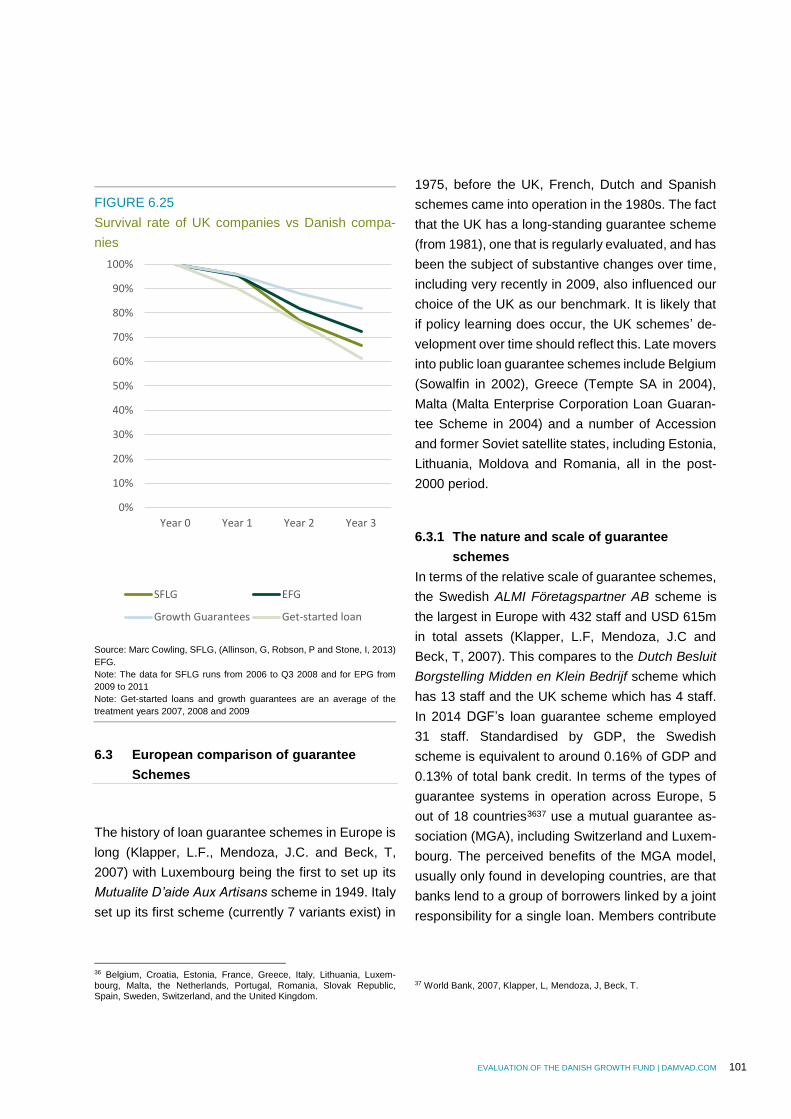
EVALUATION OF THE DANISH GROWTH FUND | DAMVAD.COM 101
FIGURE 6.25
Survival rate of UK companies vs Danish compa-
nies
Source: Marc Cowling, SFLG, (Allinson, G, Robson, P and Stone, I, 2013)
EFG.
Note: The data for SFLG runs from 2006 to Q3 2008 and for EPG from
2009 to 2011
Note: Get-started loans and growth guarantees are an average of the
treatment years 2007, 2008 and 2009
6.3 European comparison of guarantee
Schemes
The history of loan guarantee schemes in Europe is
long (Klapper, L.F., Mendoza, J.C. and Beck, T,
2007) with Luxembourg being the first to set up its
Mutualite D’aide Aux Artisans scheme in 1949. Italy
set up its first scheme (currently 7 variants exist) in
36 Belgium, Croatia, Estonia, France, Greece, Italy, Lithuania, Luxem-bourg, Malta, the Netherlands, Portugal, Romania, Slovak Republic, Spain, Sweden, Switzerland, and the United Kingdom.
1975, before the UK, French, Dutch and Spanish
schemes came into operation in the 1980s. The fact
that the UK has a long-standing guarantee scheme
(from 1981), one that is regularly evaluated, and has
been the subject of substantive changes over time,
including very recently in 2009, also influenced our
choice of the UK as our benchmark. It is likely that
if policy learning does occur, the UK schemes’ de-
velopment over time should reflect this. Late movers
into public loan guarantee schemes include Belgium
(Sowalfin in 2002), Greece (Tempte SA in 2004),
Malta (Malta Enterprise Corporation Loan Guaran-
tee Scheme in 2004) and a number of Accession
and former Soviet satellite states, including Estonia,
Lithuania, Moldova and Romania, all in the post-
2000 period.
6.3.1 The nature and scale of guarantee
schemes
In terms of the relative scale of guarantee schemes,
the Swedish ALMI Företagspartner AB scheme is
the largest in Europe with 432 staff and USD 615m
in total assets (Klapper, L.F, Mendoza, J.C and
Beck, T, 2007). This compares to the Dutch Besluit
Borgstelling Midden en Klein Bedrijf scheme which
has 13 staff and the UK scheme which has 4 staff.
In 2014 DGF’s loan guarantee scheme employed
31 staff. Standardised by GDP, the Swedish
scheme is equivalent to around 0.16% of GDP and
0.13% of total bank credit. In terms of the types of
guarantee systems in operation across Europe, 5
out of 18 countries3637 use a mutual guarantee as-
sociation (MGA), including Switzerland and Luxem-
bourg. The perceived benefits of the MGA model,
usually only found in developing countries, are that
banks lend to a group of borrowers linked by a joint
responsibility for a single loan. Members contribute
37 World Bank, 2007, Klapper, L, Mendoza, J, Beck, T.
0%
10%
20%
30%
40%
50%
60%
70%
80%
90%
100%
Year 0 Year 1 Year 2 Year 3
SFLG EFG
Growth Guarantees Get-started loan
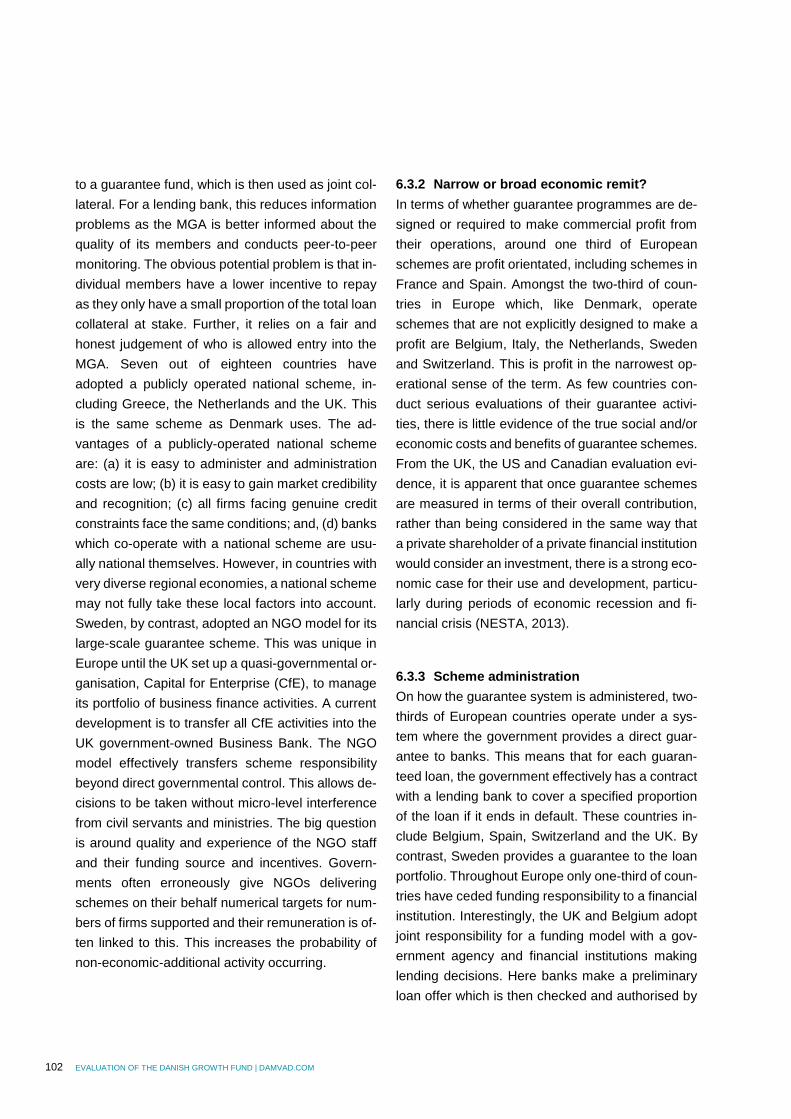
102 EVALUATION OF THE DANISH GROWTH FUND | DAMVAD.COM
to a guarantee fund, which is then used as joint col-
lateral. For a lending bank, this reduces information
problems as the MGA is better informed about the
quality of its members and conducts peer-to-peer
monitoring. The obvious potential problem is that in-
dividual members have a lower incentive to repay
as they only have a small proportion of the total loan
collateral at stake. Further, it relies on a fair and
honest judgement of who is allowed entry into the
MGA. Seven out of eighteen countries have
adopted a publicly operated national scheme, in-
cluding Greece, the Netherlands and the UK. This
is the same scheme as Denmark uses. The ad-
vantages of a publicly-operated national scheme
are: (a) it is easy to administer and administration
costs are low; (b) it is easy to gain market credibility
and recognition; (c) all firms facing genuine credit
constraints face the same conditions; and, (d) banks
which co-operate with a national scheme are usu-
ally national themselves. However, in countries with
very diverse regional economies, a national scheme
may not fully take these local factors into account.
Sweden, by contrast, adopted an NGO model for its
large-scale guarantee scheme. This was unique in
Europe until the UK set up a quasi-governmental or-
ganisation, Capital for Enterprise (CfE), to manage
its portfolio of business finance activities. A current
development is to transfer all CfE activities into the
UK government-owned Business Bank. The NGO
model effectively transfers scheme responsibility
beyond direct governmental control. This allows de-
cisions to be taken without micro-level interference
from civil servants and ministries. The big question
is around quality and experience of the NGO staff
and their funding source and incentives. Govern-
ments often erroneously give NGOs delivering
schemes on their behalf numerical targets for num-
bers of firms supported and their remuneration is of-
ten linked to this. This increases the probability of
non-economic-additional activity occurring.
6.3.2 Narrow or broad economic remit?
In terms of whether guarantee programmes are de-
signed or required to make commercial profit from
their operations, around one third of European
schemes are profit orientated, including schemes in
France and Spain. Amongst the two-third of coun-
tries in Europe which, like Denmark, operate
schemes that are not explicitly designed to make a
profit are Belgium, Italy, the Netherlands, Sweden
and Switzerland. This is profit in the narrowest op-
erational sense of the term. As few countries con-
duct serious evaluations of their guarantee activi-
ties, there is little evidence of the true social and/or
economic costs and benefits of guarantee schemes.
From the UK, the US and Canadian evaluation evi-
dence, it is apparent that once guarantee schemes
are measured in terms of their overall contribution,
rather than being considered in the same way that
a private shareholder of a private financial institution
would consider an investment, there is a strong eco-
nomic case for their use and development, particu-
larly during periods of economic recession and fi-
nancial crisis (NESTA, 2013).
6.3.3 Scheme administration
On how the guarantee system is administered, two-
thirds of European countries operate under a sys-
tem where the government provides a direct guar-
antee to banks. This means that for each guaran-
teed loan, the government effectively has a contract
with a lending bank to cover a specified proportion
of the loan if it ends in default. These countries in-
clude Belgium, Spain, Switzerland and the UK. By
contrast, Sweden provides a guarantee to the loan
portfolio. Throughout Europe only one-third of coun-
tries have ceded funding responsibility to a financial
institution. Interestingly, the UK and Belgium adopt
joint responsibility for a funding model with a gov-
ernment agency and financial institutions making
lending decisions. Here banks make a preliminary
loan offer which is then checked and authorised by
EVALUATION OF THE DANISH GROWTH FUND | DAMVAD.COM 103
government. This contrasts with Belgium and the
Netherlands where financial institutions have com-
plete responsibility for managing and delivering their
schemes and Sweden where responsibility lies
solely with a non-government agency. The Swedish
guarantee scheme is the responsibility of ALMI
Företagspartner AB, which is owned by the Swedish
government and is the parent company of a group
of 21 subsidiaries, which are 51% owned by the par-
ent company. Other owners are county councils, re-
gional authorities and municipal cooperative bodies.
Another financial institution is required to be in-
volved in addition to ALMI. However, in exceptional
cases ALMI may finance the whole amount on its
own. The target group of ALMI is 35 companies with
up to 250 employees and there is no upper loan limit
for Almi’s financial support.
In Sweden and the Netherlands, ownership of guar-
antee schemes lies with a government agency,
whilst in the UK model ownership is shared between
government and financial institutions. That is to say,
that government and private sector financial institu-
tions work in partnership to administer the scheme
and review potential problems and areas for devel-
opment. Managerial responsibility in Netherlands
and the UK lies with a government agency, but in
Sweden it rests with an NGO, Almi Företagspartner
AB.
6.3.4 Risk assessment
Only three out of the 18 European countries (Esto-
nia, Lithuania and Malta) operating guarantee
schemes allow a government agency to make the
credit risk assessment (or four including Denmark).
In the Netherlands and the UK this operation is
given to financial institutions and in Sweden to an
NGO. Monitoring in Netherlands and the UK is also
ceded to financial institutions and in France,
Greece, Portugal and Spain to their respective cen-
tral banks. Again, Sweden uses an NGO to monitor
the operation of its scheme. The same mode in each
case is used for debt recovery in the event of a loan
ending in default.
6.3.5 Scheme restrictions and eligibility
In terms of eligibility restrictions, only two countries
in Europe, Luxembourg and Croatia, restrict specific
scheme access to only new businesses, although
Luxembourg operates another scheme which is
solely restricted to existing businesses. The benefits
and costs of restricting loans to established busi-
ness are: (a) failure rates are likely to be lower; (b)
the absolute scale of economic benefits is likely to
be higher; but, (c) the potential for non-additional
lending will also be higher so the net economic ben-
efits after removing deadweight could be low. This
is the same as with the DGF where the get-started-
loan scheme is restricted to new companies and the
growth guarantees are a general guarantee to all
companies. For the most part, guarantee schemes
across Europe are open to new and existing busi-
nesses. In terms of the maximum size of firm al-
lowed to access a guarantee, Sweden, Belgium, It-
aly and France set their size limit at 250 employees
(the EU Medium Size Firm Limit). The Netherlands
sets its upper limit much lower at 100 employees. In
Denmark it was 100 employees prior to 2011, when
it was changed to 250 employees. Size restrictions
tend to focus schemes on those firms most likely to
face binding credit constraints thus deadweight from
non-additional lending are likely to be lower. Sector
restrictions were in place in the Netherlands and the
UK, although subsequent changes in the UK re-
moved these restrictions with the exception of illegal
or immoral activities. In Denmark the primary sector
did not have access to growth guarantees prior to
2010. Geography, by contrast, is not a focus or a
restriction for guarantee programmes in Europe.
Historically, in the UK, there was a special set of
104 EVALUATION OF THE DANISH GROWTH FUND | DAMVAD.COM
conditions for inner city (i.e. deprived area) guaran-
tees which were more favourable than the general
guarantee scheme. This distinction is not used now.
6.3.6 Scheme terms
On the level of guarantee available, the Moldovan
GARANTIVEST scheme has the lowest guarantee
in Europe at 50% of loan value and the Slovak Re-
public the second lowest guarantee at 65 % of the
loan value. France and Greece have guarantees set
at 70% and the UK, Belgium, Estonia, Malta and
Denmark a guarantee of 75%. The highest rate of
guarantee in Europe is 80% as is Italy. Regarding
the maximum term for which the guarantee is avail-
able, the Swedish scheme has a short term at a
maximum of 6 years. This compares to 10 years in
Belgium, Greece and Denmark, 12 years in the
Netherlands and 15 years in Spain. Training and ad-
vice are available to lenders in 39% of European
countries, including Greece, Italy, Netherlands, the
UK and Denmark with the get-started-loan scheme.
In Italy, Spain and Sweden training and advice are
also available to borrowers. In two-thirds of coun-
tries, a fixed fee is paid per loan issued, including
Belgium, Netherlands, the UK and Denmark, but not
Sweden, where a fee is charged which relates to
loan risk. Further, in the Netherlands the fee is also
related to the maturity of the loan. The actual fee
levels vary considerably across countries with a 1%
fee in Belgium, 2% in the UK, and a very high rate
of 7.9% in Sweden. In Denmark the fee is 2% for the
growth guarantee and 3% for get-started loans.
Fees have little or no impact on firm level outcomes,
but do make a contribution to the administration
costs of schemes.
6.3.7 Additionality of lending
Additionality is a key issue for loan guarantee
schemes and for the extent to which loans issued
under guarantee fundamentally determine the true
extent of credit rationing in the market for SME fi-
nance. The average share of loans issued under
government-backed guarantees for which the bor-
rowing firm would have been unable to borrow with-
out the guarantee (genuine rationing) is 62%, which
was higher than the 50% reported for the Nether-
lands scheme (Klapper, L.F, Mendoza, J.C and
Beck, T, 2007). In the UK, evaluation studies sug-
gest a figure of between 70% and 80% (KPMG,
1999; Cowling, 2010; Allinson et al., 2013). There-
fore, loan guarantees, by international standards
seem to have very important additionality in support
of SME finance.
6.3.8 Default
Generally, the Swedish scheme is one of the largest
in Europe in terms of loans issued under guarantee,
but the rejection rate for guarantees is around
23.8%. Further, the average amount under guaran-
tee at USD 58,000 is one fifth of the USD 301,200
reported for the Netherlands scheme which has an
average cost of default of 33.1% of loan value for
defaulting loans (USD 99,700). Default rates are
high on the UK scheme at around 3% (under SFLG)
and 27.4% (under EFG). They are relatively low for
the Belgian and Netherlands schemes at 12.8% and
13.7% respectively (Klapper, L.F, Mendoza, J.C
and Beck, T, 2007). In Denmark the default rate of
the new guarantees issued in 2010 was 13.2%.
6.3.9 Who accesses guarantees?
In terms of what types of firms access guarantee
schemes, there is a degree of consistency in terms
of the guarantee being accessed primarily by micro
(1–9 employee) sized firms. This was true for 58 %
of firms on the UK scheme, 58.1% on the Belgian
schemes and 57.9% on the Swedish scheme. In
most countries manufacturing firms disproportion-
ately accessed guaranteed loans. This was the
case for 48.8% of loans under guarantee in the
EVALUATION OF THE DANISH GROWTH FUND | DAMVAD.COM 105
Netherlands, 36.0% in the UK and 29.7% in Bel-
gium. The implications are that schemes, regard-
less of the upper size limit of firms allowed access
to them, focus on the size class of firms most likely
to face binding credit constraints. Thus the potential
for economic value added is higher.
6.3.10 Summary
Guarantee schemes have been a feature of Euro-
pean public-policy interventions in capital markets
for several decades. Each country has its particular
variants, and some countries have more than one
scheme, but there are some common features
across Europe. Perhaps the most common feature
is that access to guarantee schemes is fairly open
in terms of the types of firms that can apply for a
guaranteed loan, with the notable exception of a
firm size limit. This latter point simply reflects the
well-understood belief that SMEs face more difficul-
ties when seeking to raise external debt than large
firms.
There are important differences in the scale of guar-
antee scheme operations, and the Swedish scheme
is very large compared to its economy. It is also very
well-resourced in terms of its administration capac-
ity which partly reflects the guarantee model which
is quasi-public sector. This contrasts with other
countries such as the Netherlands and the UK who
use a public-private guarantee model under which
lending is essentially devolved to private-sector fi-
nancial institutions, as indeed it is in the US and
Canada, and oversight rests with a government
agency. Importantly, the countries that use private-
sector financial institutions to deliver loans incentiv-
ise good behaviour by capping the overall loss rate,
typically at 12–13% of the total loan portfolio. Delin-
quent financial institutions are penalised in terms of
covering additional losses and are withdrawn from
the list of approved lenders typically.
General terms such as guarantee levels and inter-
est rate premium are fairly consistent across major
countries, including Denmark, at 75% and 1–2%
over the conventional lending rate. Sweden, by con-
trast, adopts a full-risk pricing model and has the
highest average interest rate premiums. This sug-
gests that they are making loans at a point above
which the bank loan supply curve is backward bend-
ing, even for guaranteed loans. This simply means
that lenders cut off the supply of loans at high inter-
est rates as they take the view that any investment
capable of generating enough cash-flow to repay
such a high interest rate is too risky. It also implies
that borrower firms must have investment projects
that are capable of generating high returns or have
high default rates. Despite this, there remains ex-
cess demand for guaranteed loans in Sweden
which would imply that their risk assessment model
is choking off the highest risk loan applications. The
pricing model is interesting as the recent UK EFG
evaluation suggested that relatively small upward
shifts in the borrowing cost would deter a significant
proportion of firms from taking out a guaranteed
loan.
What is also apparent across countries is that, de-
spite fairly wide access conditions in terms of what
types of firms can access guaranteed loans, the re-
ality is that they are issued disproportionately to; (a)
manufacturing firms, (b) micro firms, and (c)
younger firms. This suggests that the potential for
economic value added is high as all manufacturers
tend to have a higher exporting potential and make
investments in capital with productivity enhancing
potential. Further, younger, and to a lesser degree
smaller, firms tend to grow faster, and create more
jobs and value added per DKK of investment.
106 EVALUATION OF THE DANISH GROWTH FUND | DAMVAD.COM
6.3.11 Guarantees as a response to economic
crisis
Interestingly, in response to the financial crisis
which began in 2008, and led to the deep economic
recession, the UK response was to replace the long-
standing SFLG scheme with the EFG scheme which
gave much larger firms access to guaranteed loans.
An additional, and short-lived scheme Transitional
Loan Fund, was also brought into operation to sup-
port lending to established SMEs experiencing
short-run, cash-flow, problems. The scale of this
change from SFLG to EFG in the UK was significant
with a previous upper limit of approximately DKK
235m in sales to a new limit of approximately DKK
385m. In parallel, the maximum loan amount rose to
approximately DKK 9m.This change was replicated
in the US with the Recovery and Reinvest Act of
2009, and the Recovery Act 2012 and Jumpstart
Our Business Start-ups Act of April 2012. In each
case the SBA 7A Loan Program was widened in
terms of its scope and in the original 2009 Act the
loan maximum rose from approximately DKK 11m
to DKK 27m. It was also replicated in Canada
through the Economic Action Plan of 2012. In Can-
ada, the Canadian Small Business Finance Pro-
gram increased its maximum loan size from approx-
imately DKK 1.5m to DKK 2m and allowed firms with
up to approximately DKK 29m in sales access to the
guarantee program. In Denmark the growth guaran-
tee scheme was expanded in 2009 and again in
2011 to accommodate the new economic condi-
tions. The maximum loan amount rose from DKK
5m to DKK 10m in 2010 and again from DKK 10m
to DKK 25m in 2011. Guarantee schemes are the
primary, and most appropriate, policy instrument for
responding to economic downturns and periods
when credit markets are reducing funds available
for lending to businesses. In the four major guaran-
tee schemes in the world (Canada, the US, Japan
and the UK) guarantee schemes were extended to
support lending to the widening pool of businesses
unable to access credit. This feature was replicated
in Denmark.
6.3.12 Learning from the UK guarantee schemes
development
Here we present some key highlights of UK policy
development in the context of its guarantee
schemes and draw conclusions about policy learn-
ing and how that could be usefully considered by
Denmark in terms of developing its’ own guarantee
programmes. Table 6.2 highlights key historical
milestones over the last 35 years in the UK.

EVALUATION OF THE DANISH GROWTH FUND | DAMVAD.COM 107
TABLE 6.2
Key UK Milestones in the guarantee scheme Year Milestone
1979 Wilson Committee of Enquiry into Small Firms recommends guarantee scheme to support small business lending
1981 SFLG scheme started as a 3 year pilot:
Guarantee 80%
Interest premium 3.0%
1984 Scheme changes:
Guarantee 70%
Interest premium 5.0%
1985 Take-up and default modelling (Cowling and Mitchell,2005) for Ministry
Scheme changes:
Guarantee 70%
Interest premium 2.5%
1987 Scheme changes:
Inner City Pilot scheme introduced
NERA Evaluation
1988 Department of Employment Evaluation
1992 PIEDA Evaluation
1993 Scheme changes:
New firms get 70% guarantee
Established firms get 85% guarantee
Fixed rate loans 0.5% interest premium
Variable rate loans 1.5% interest premium
1994 Counselling scheme pilot introduced linking loans to advice
1996 Scheme changes:
Inner city loan special terms removed
Catering firms excluded
Maximum loan term extended to 10 years
Counselling scheme pilot Evaluation
1999 KPMG Evaluation
2000 Competition Commission Enquiry into Banking Competitiveness:
Shift in policy focus towards equity based interventions
2001 Temporary lifting of sector restrictions for SMEs in areas affected by Foot and Mouth outbreak
2003 Scheme changes:
Sector restrictions removed
2004 Graham Review of Loan Guarantee Scheme
2005 Scheme changes:
5 year rule introduced which restricted access to firms under the age of 5 years
2008 Cowling et al (2008) Early Stage Assessment of Graham Review changes
2009 Scheme changes:
5 year rule removed
EFG introduced and replaces SFLG
EFG allows access to larger guaranteed loans for larger sized firms
Transitional Loan Fund came into operation to support lending for working capital to established SMEs
2010 Final SFLG Evaluation (Cowling, 2010)
Transitional Loan Fund Evaluation (Cowling and Oakley, 2010)
2013 EFG Evaluation (Allinson et al., 2013)
Source: Marc Cowling, 2014
108 EVALUATION OF THE DANISH GROWTH FUND | DAMVAD.COM
The UK scheme was a direct policy response to a
government committee of enquiry into small busi-
ness financing in 1979. This was the third such
large-scale enquiry into small businesses in the UK,
the earliest dating back to 1935. Governmental en-
quiries are far reaching in the UK and draw upon
wide-ranging evidence from academics, firm repre-
sentative groups, financiers, business owners, gov-
ernment departments, employee representatives,
and the general public. Each enquiry has a team of
civil servants who support the main committee lead
(in this case Wilson) and collate all the evidence,
both oral and submitted. Recommendations arising
from such enquiries are only made where substan-
tial evidence supports the recommendation. When,
and if, recommendations are made, the appropriate
Ministry then considers options and viability. The
fact that guarantee schemes had existed in Canada
and the US for decades supported the UK case for
a similar policy intervention.
Figure 6.26 illustrates how different policy changes
have affected the number of loans over time. The
Small Firms Loan Guarantee Scheme was intro-
duced on a three-year pilot basis in 1981 with a
guarantee level of 80% and an interest premium
(over and above the bank lending rate) of 3%. After
the pilot was extended in 1994, the level of guaran-
tee was reduced to 70% (making it less attractive to
banks) and the interest premium was raised to 5%
(making it less attractive to small firms). These
changes quite literally nearly killed the scheme off
in its infancy. This highlighted how sensitive guar-
antee schemes are to the core parameters over
which the government has control, the level of guar-
antee and the government premium. Subsequent
developments proved time and time again that this
is still the case.
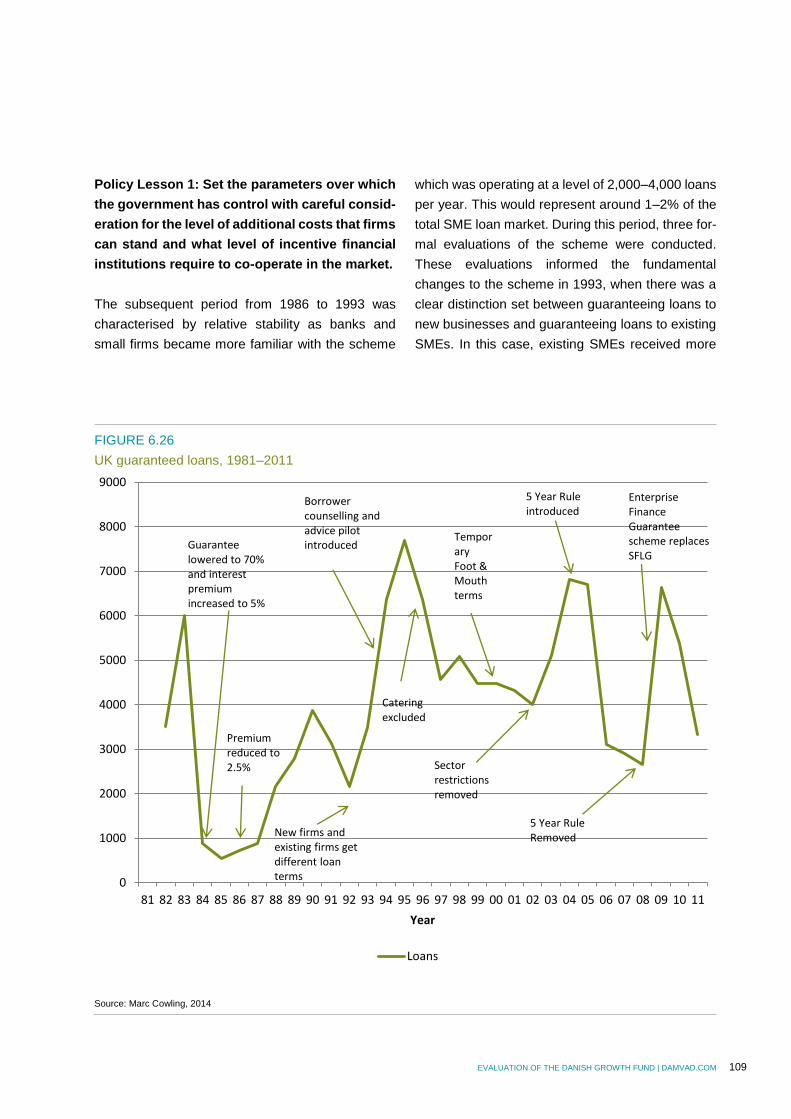
EVALUATION OF THE DANISH GROWTH FUND | DAMVAD.COM 109
Policy Lesson 1: Set the parameters over which
the government has control with careful consid-
eration for the level of additional costs that firms
can stand and what level of incentive financial
institutions require to co-operate in the market.
The subsequent period from 1986 to 1993 was
characterised by relative stability as banks and
small firms became more familiar with the scheme
which was operating at a level of 2,000–4,000 loans
per year. This would represent around 1–2% of the
total SME loan market. During this period, three for-
mal evaluations of the scheme were conducted.
These evaluations informed the fundamental
changes to the scheme in 1993, when there was a
clear distinction set between guaranteeing loans to
new businesses and guaranteeing loans to existing
SMEs. In this case, existing SMEs received more
FIGURE 6.26
UK guaranteed loans, 1981–2011
Source: Marc Cowling, 2014
0
1000
2000
3000
4000
5000
6000
7000
8000
9000
81 82 83 84 85 86 87 88 89 90 91 92 93 94 95 96 97 98 99 00 01 02 03 04 05 06 07 08 09 10 11
Year
Loans
Guarantee lowered to 70% and interest premium increased to 5%
New firms andexisting firms get different loan terms
Premium reduced to 2.5%
Catering excluded
Temporary Foot &Mouth terms
Sector restrictions removed
5 Year Ruleintroduced
5 Year RuleRemoved
EnterpriseFinanceGuarantee scheme replaces SFLG
Borrowercounselling and advice pilot introduced
110 EVALUATION OF THE DANISH GROWTH FUND | DAMVAD.COM
favourable guarantee terms than new businesses.
This was a clear, and arguably fairer, representation
of their relative risk of loan default. A differentiation
was also made in terms of fixed and variable rate
guaranteed loans.
Policy Lesson 2: The core scheme parameters
are easily understood, easy to change, and ca-
pable of being adjusted to specific groups/types
of SMEs and entrepreneurs.
Perhaps the most interesting change, given the
huge body of academic evidence linking human
capital to superior business performance, was the
Counselling Pilot scheme which ran from 1994 to
1997 and was available in a number of “test” re-
gions. This scheme linked guaranteed lending to
advice and support from business development ad-
visors. The 1999 formal KPMG evaluation econo-
metrically tested for its effects and found it to have
a significant benefit to recipient firms (and directly to
government through lower default rates). The re-
moval of this pilot, and indeed the lack of its geo-
graphic expansion, was perhaps the single most im-
portant policy mistake or missed opportunity in the
history of the SFLG.
Policy Lesson 3: When trying out interesting
variants or additions to a core scheme, evaluate
and assess their impacts during their opera-
tions and extend and expand them if they appear
useful or stop them/shut them down if they ap-
pear unhelpful.
This general lesson has been clearly demonstrated
in trials and errors subsequently made on the UK
scheme and the speed at which they have been cor-
rected. For example, the service sector exclusions
put in place in 1996 were repealed in 2003 after fur-
ther investigation found that the growth in demand
for services meant that displacement issues were
relatively minor. Equally, the 5 Year Rule was in-
tended to focus the scheme on the youngest of firms
which were more likely to be subject to problems
based on a lack of track record information. It was
also partly driven by the political desire to reduce
potential liabilities of guaranteed lending by reduc-
ing the cash volume of loans under guarantee.
Again, after a collapse in scheme lending, and fur-
ther evidence from a formal early stage assessment
that banks and entrepreneurs felt this restriction too
prohibitive, this rule was removed in 2009.
Policy Lesson 4: Learn lessons, adapt to
changes in the environment, and use the flexi-
bility of guarantee schemes to tackle temporary
objectives where appropriate
The temporary widening of the scheme to allow
businesses in regions affected by the outbreak of
foot-and-mouth disease was an example of how
policymakers used an existing policy instrument to
support businesses in temporary difficulty in 2000.
Equally, and perhaps more significantly, the re-
placement of the SFLG after a 28-year life with the
Enterprise Finance Guarantee scheme reflected
policy thinking at a long-term strategic level and at
a short-term level to support bank lending in the
credit crisis.
Policy Lesson 5: Set up data management sys-
tems capable of monitoring scheme lending and
conduct assessments and formal (independent)
evaluations on a regular basis. Use this evi-
dence base to inform policy development.
A great strength of the Canadian and UK schemes
has been the willingness of both governments to
conduct formal evaluations and early assessment
when significant scheme changes have been made.
This has not been the case in any other countries,
and policy development has either not occurred to
the extent that we have outlined in the UK, or has
EVALUATION OF THE DANISH GROWTH FUND | DAMVAD.COM 111
been made with no evidence base. From its initia-
tion in 1981, the UK government has maintained a
Management Information system which has sup-
ported in-house analysis and reporting, formal inde-
pendent evaluations, and a large body of academic
analysis. Arguably, the availability of scheme data
has created a virtuous circle of recommendations
for policy development, adjustments to the scheme,
review, and further adjustments and developments.
6.4 Guarantee schemes and the Danish con-
text
The underlying rationale for DGF guarantee
scheme intervention in the market, that of support-
ing the flow of loan capital to SMEs with viable fund-
ing opportunities but without sufficient collateral
and/or track record, is consistent with the vast ma-
jority of comparable international guarantee pro-
grammes. The development of DGF’s guarantee
scheme activities over time has some unique fea-
tures and some that have been mirrored across Eu-
rope and in the US, Canada and Japan. Perhaps
the most interesting historical aspect is that the DGF
Growth Guarantee scheme, set up in 2000, pre-
ceded the Get Started scheme by five years. This
suggests that the policy focus was quite different in
the formative years of DGF guarantee activity and
was clearly intended to support potential high-
growth SMEs, particularly those that were investing
in innovative and developmental activities. This is a
fairly small subset of the population of firms in any
economy at a given point in time. This target pool of
constrained borrowers would be much larger in size
than most SME policy interventions focused on debt
markets would support and would not typically be
the types of firms who lack a track record. We might
assume that the vast majority of Growth Guarantee
loans would be addressing the issue of insufficient
collateral. The initial size restriction for access to
Growth Guarantee loans was 100 employees which
indicates that policymakers made an assumption
that larger SMEs (i.e. those with more than 100 em-
ployees) were unlikely to face collateral constraints
when borrowing from banks.
The get-started loan scheme, initiated in 2005, had
a clear focus in terms of its target population of firms
less than three years old and supported lending up
to a modest DKK 1m which would be sufficient for
the majority of young firms. It is an interesting policy
question why the original Growth Guarantee
scheme was not simply widened to support lending
to young firms. This would possibly have led to
economies of scale at DGF and built on the five
years of experience and human capital of adminis-
tering the Growth Guarantee. This aside, the ra-
tionale for policy intervention in the form of loan
guarantees is much clearer in the case of the Get
Started scheme as young firms clearly lack track
record and also face potential collateral constraints
as they have not had sufficient time to build up their
asset base through trading and investment. As
young firms are more likely to face binding credit
constraints, this addition to DGF’s guarantee
scheme portfolio had the potential to see a huge ex-
pansion in guaranteed lending by number of loans
and by cash volumes supported. It also increased
the probability of DGF’s guarantee activities being
finance additional, thus reducing potential
deadweight. An innovative addition to the Get
Started loan scheme was the provision of advice
and coaching to supported entrepreneurs. This mir-
rored the UK counselling pilot which was found to
have a positive impact on outcomes. It also sug-
gests that policy thinking understood that young
firms and early stage entrepreneurs need to raise
their human capital in order to manage productive
investments.
A unique and interesting feature of DGF’s guaran-
tee activities is the fact that DGF conducted its own
due diligence on potential borrower firms. The vast
majority of guarantee schemes throughout the world
112 EVALUATION OF THE DANISH GROWTH FUND | DAMVAD.COM
effectively hand over due diligence to private sector
financial institutions (or in some cases NGOs, as is
the case in Sweden) as a standard requirement that
private sector financiers conduct lending appraisals
in the same way they would any other small busi-
ness proposition. In fact, in the UK, firms are not al-
lowed to approach a bank for a government guaran-
teed loan explicitly. The procedure is to submit a for-
mal lending proposition to a private bank which then
conducts its appraisals in the normal way. Only
when the proposition passes the serviceability (gen-
erating enough cash-flow to service the capital and
interest payments) and credible business-plan
tests, is the issue of collateral raised. At this point, if
the firm cannot meet the bank’s collateral require-
ments (which are normally higher for young firms
with little track record), the offer of a government
guaranteed loan is discussed. DGF began to do in-
house risk assessment as a result of poor perfor-
mance on the guarantees when the private lending
sector alone made the due diligence. This choice
has proven to be very effective in minimising the de-
fault rate on loans but have increased the adminis-
trative cost substantially.
Even with a guarantee scheme in place, banks will
always be less willing to make loans than govern-
ments. This situation arises because governments
have a wider remit than banks, which simply want to
lend money to people and firms with a high proba-
bility of repayment. In this sense, banks are only in-
terested in firm growth if it increases the probability
of repayment. Governments have a wider interest in
economic growth and job creation and are thus able
to consider a broader set of outcomes than simple
ability to repay a loan.
This leads to another interesting question around
how governments, and particularly its audit or treas-
ury departments, measure the success or otherwise
of their guarantee schemes. Taking a narrow, com-
mercial, view seems nonsensical as would any re-
quirement for a guarantee programme to be self-fi-
nancing through premium income revenues cover-
ing guarantees paid out in default. The major ad-
vantage of government is that it can take a longer-
term view than private shareholder-driven financial
institutions and that it has a broader economic wel-
fare remit. If the UK, US or Canadian schemes were
measured purely on a narrow commercial basis in
terms of premium income covering default losses
then no scheme in the world would stand up to scru-
tiny.
Taking a broader, and longer-term, view than the
market requires a clear statement about what a
guarantee scheme is intended to achieve (i.e. job,
productivity, sales and export growth) and then for-
mally evaluating outcomes against stated objectives
as they do consistently and on a regular basis in the
UK and Canada. In reality, governments ‘manage’
their guarantee exposure within acceptable limits
which are often defined politically. In the UK, and
other countries, individual financial institution de-
fault loss rates are capped, thus incentivising banks
not to over-lend to non-viable businesses.
Perhaps the clearest indication of policy learning
from DGF occurred in the period 2010–2012. Here
changes to DGF’s guarantee activities reflected
longer-term strategic aims and the need to inter-
vene to support firms suffering from the immediate
effects of the financial crisis and economic down-
turn. In 2010 a key change was to allow SMEs to
use guaranteed loans to support cash-flows and
weakening balance sheets as private-sector finan-
ciers reduced the scale of funds available for lend-
ing and withdrew or scaled down overdraft facilities
to existing borrowers. This, again, reflected govern-
ments desire to help otherwise viable SMEs man-
age their cash flows through a tough economic pe-
riod and represents an efficient use of government
money. It remains the case that in the normal course
EVALUATION OF THE DANISH GROWTH FUND | DAMVAD.COM 113
of events, few SMEs cease trading and most con-
tinue on a slow growth trajectory ad infinitum. To
support these objectives, more cash was made
available to guarantee lending.
The second interesting change during this period
occurred in 2011 when the maximum firm size re-
striction was raised from 100 employees up to the
EU’s SME definition of 249 employees. Whilst nu-
merically this change affects quite a small number
of firms, the nature of their activities may generate
significant positive economic benefits, particularly
through manufacturing exports and general produc-
tivity gains. It also brings DGF guarantee activities
broadly in line with other European countries. 2011
also saw a more general expansion of guaranteed
funding available from government and a broaden-
ing of sectors allowed access to guaranteed loans.
The final changes in 2012 saw a raising of the pre-
vious young firm maximum loan limit to DKK 2m
from DKK 1m. It is likely that this change will have a
relatively modest impact on future take-up as aver-
age loan scale for this type of firm is well below this
level. Again, this mirrors changes to all the major
guarantee schemes in the world. But the most sig-
nificant changes were the removal of the require-
ment for DGF to evaluate lending propositions and
the merging of both guarantee schemes under one
umbrella guarantee scheme. An interesting adjunct
to these guarantee scheme changes was the deci-
sion to become involved in direct lending to young
firms. This is completely at odds with policy devel-
opments over the last 30 years in most countries
where public-sector organisations have sought to
build strategic and delivery partnerships with expe-
rienced private-sector financial institutions. Indeed,
the main focus of direct lending schemes is in the
developing world.
To summarise, DGF guarantee scheme develop-
ment has had a relatively short, but interesting, his-
tory and to some degree a unique one starting as it
did with effectively a high-growth potential, innova-
tion-focused scheme largely intended for existing
SMEs. The subsequent addition of a young-firm-fo-
cused guarantee scheme brought DGF’s guarantee
activities into line with most countries. There is clear
evidence of policy learning over time and the Danish
government has used the guarantee schemes as a
vehicle to address wider economic contexts, partic-
ularly the financial crisis and subsequent economic
downturn through extending the funds available for
guarantees. The advice and coaching offer is an in-
novative and useful complementary addition to the
financial support available for younger firms.
In terms of guarantee scheme models, the DGF
model is one of the most closely involved in physical
market operations. In this sense it is closer to the
Japanese model than the UK, Canadian, US mod-
els and the general model adopted in most Euro-
pean countries in which the governmental role is
more of a monitoring, legal and evaluation role. The
hands-off model has obvious benefits in terms of al-
lowing experienced lenders to make commercial de-
cisions without being burdened by bureaucratic re-
quirements. Safeguards in the form of capped
losses and exclusion from scheme lending have to
be built in to this kind of guarantee model to ensure
good behaviour on the part of financial institutions.
But a potential negative aspect of this type of hands-
off model is that government policy is secondary to
bank lending policy. Sweden, by contrast, adopted
an intermediate type of guarantee model, which has
a high level of input from a large NGO. The obvious
concern about this type of guarantee model is the
experience and quality of the NGO staff in the ad-
ministration of guaranteed lending schemes. But the
use of an NGO intermediary can have significant
benefits as it can operate at arms’ length from poli-
ticians and focus on administering a guarantee
scheme that delivers long-term benefits without
short-term political concerns. But, if it is effectively a
114 EVALUATION OF THE DANISH GROWTH FUND | DAMVAD.COM
quasi-public sector organisation, then many of the
potential benefits of this model are potentially lost.
6.4.1 Comparative scheme costs
Here we provide international benchmarks of three
large-scale guarantee programmes in the UK and
Canada. The schemes considered are: the UK
Small Firms Loan Guarantee Scheme (SFLG); its
successor, the Enterprise Finance Guarantee
Scheme; and the Canadian Small Business Finance
Scheme. These countries’ schemes were chosen
as they have the longest running schemes in the
world.
On many parameters and measures DGF guaran-
tee schemes appear broadly in line with more es-
tablished country schemes. Default costs, propor-
tional to size of scheme and guarantee activities,
are DKK 39m from a portfolio of 234 guaranteed
loans amounting to DKK 686m of guaranteed lend-
ing, and a default rate of 13.2% The latter is lower
than UK levels of loan default. Premium income is
relatively high at DKK 31m, and this reduces net
scheme costs to a relatively low figure of DKK 22m.
In contrast, the UK schemes generate quite low lev-
els of premium income. Cash lending volumes are
also relatively high in Denmark at approximately
DKK 686m highlighting the large average size of
loan. If default is expressed in terms of the costs per
DKK lent, the figure of 5.6% for Denmark is lower
than UK and Canadian international benchmarks,
as is the figure of DKK 92,388 for average net cost
to government per guaranteed loan, see table 6.3.
The one area where Denmark appears out of line
with the UK and Canada is in terms of absolute and
relative costs of scheme administration. Operating
costs of approximately DKK 14m to deliver 234
loans represents an average administration cost of
approximately DKK 58,000 per loan guaranteed. In
comparison, the UK team of four staff administer
3,100 loans at an average administration cost of ap-
proximately DKK 995. There are clear explanations
for why this might occur. Firstly, until 2012 DGF per-
formed an internal evaluation on every loan pro-
posal put before it. This was a hugely costly and
time consuming task. In addition, there are substan-
tial fixed costs of operating a guarantee scheme and
in the case of Denmark, this fixed cost element is
only spread over 234 loans compared to thousands
in the UK and Canada. Overall, it might be expected
that per loan administration costs will fall substan-
tially as fewer lending evaluations are performed
and more loans are made. The average net cost as
amount guaranteed is lower compared to the UK
and Canadian schemes. Furthermore this cost anal-
ysis is performed on the 2010 loan portfolio which
was the year DGF increased its loan capacity sub-
stantially and thus hired more staff. This effect of the
increased loan has a delay in the number of loans
given so that the administrative cost in year 2010
can have been substantially higher per loan com-
pared to other years. The one counter-balancing ef-
fect is the start of the direct lending scheme. If this
scheme attracts large numbers of funding proposals
then the cost impact may be significant.
Default costs are a very large part of the total
scheme costs. In contrast, administration costs of
operating a loan guarantee scheme are relatively
small and vary from approximately DKK 995 per
loan issued for the UK EFG up to approximately
DKK 3.535 per loan issued for its predecessor the
UK SFLG. The largest share of these total admin-
istration costs are direct salaries and wages. As the
fixed cost element of the administration is high, it
would be anticipated that the Danish schemes
would have a higher average administration cost
per loan as the total volume of loans issued are
1/20th that of the Canadian scheme. In terms of the
total cost of defaulting loans and called in guaran-
tees, expressed as a proportion of the total value of
loan issued, DGFs scheme generates the lowest
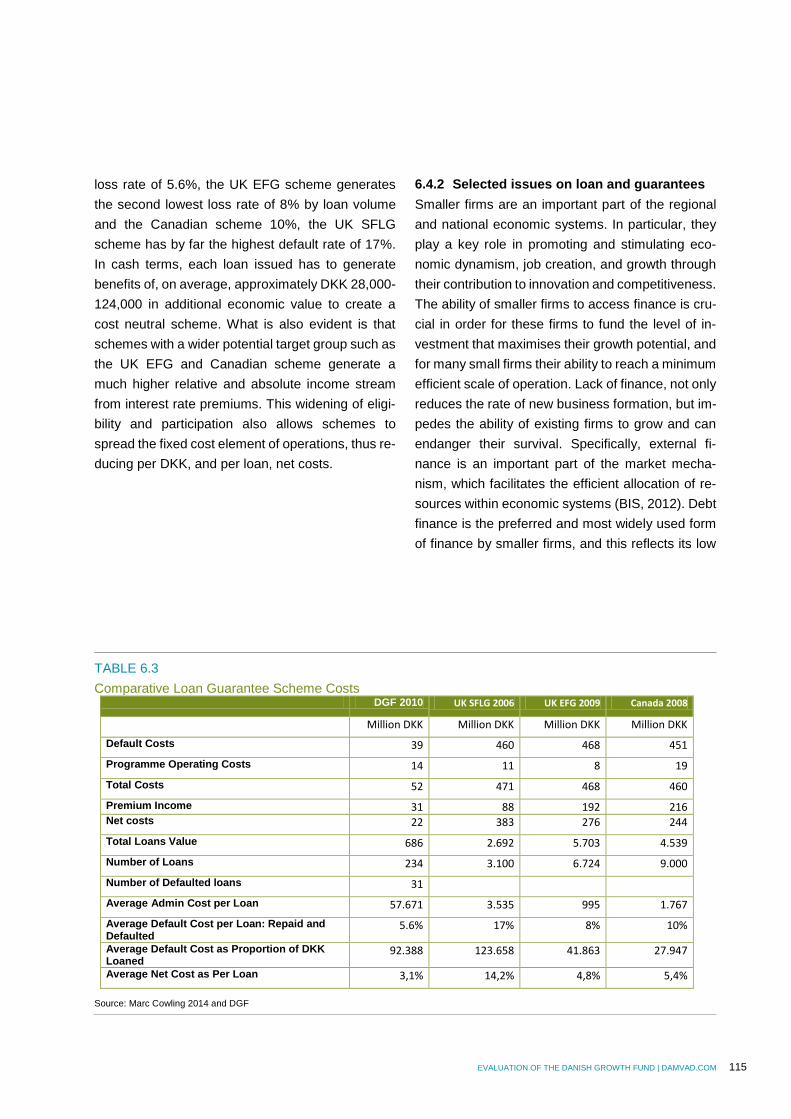
EVALUATION OF THE DANISH GROWTH FUND | DAMVAD.COM 115
loss rate of 5.6%, the UK EFG scheme generates
the second lowest loss rate of 8% by loan volume
and the Canadian scheme 10%, the UK SFLG
scheme has by far the highest default rate of 17%.
In cash terms, each loan issued has to generate
benefits of, on average, approximately DKK 28,000-
124,000 in additional economic value to create a
cost neutral scheme. What is also evident is that
schemes with a wider potential target group such as
the UK EFG and Canadian scheme generate a
much higher relative and absolute income stream
from interest rate premiums. This widening of eligi-
bility and participation also allows schemes to
spread the fixed cost element of operations, thus re-
ducing per DKK, and per loan, net costs.
6.4.2 Selected issues on loan and guarantees
Smaller firms are an important part of the regional
and national economic systems. In particular, they
play a key role in promoting and stimulating eco-
nomic dynamism, job creation, and growth through
their contribution to innovation and competitiveness.
The ability of smaller firms to access finance is cru-
cial in order for these firms to fund the level of in-
vestment that maximises their growth potential, and
for many small firms their ability to reach a minimum
efficient scale of operation. Lack of finance, not only
reduces the rate of new business formation, but im-
pedes the ability of existing firms to grow and can
endanger their survival. Specifically, external fi-
nance is an important part of the market mecha-
nism, which facilitates the efficient allocation of re-
sources within economic systems (BIS, 2012). Debt
finance is the preferred and most widely used form
of finance by smaller firms, and this reflects its low
TABLE 6.3
Comparative Loan Guarantee Scheme Costs DGF 2010 UK SFLG 2006 UK EFG 2009 Canada 2008
Million DKK Million DKK Million DKK Million DKK
Default Costs 39 460 468 451
Programme Operating Costs 14 11 8 19
Total Costs 52 471 468 460
Premium Income 31 88 192 216
Net costs 22 383 276 244
Total Loans Value 686 2.692 5.703 4.539
Number of Loans 234 3.100 6.724 9.000
Number of Defaulted loans 31
Average Admin Cost per Loan 57.671 3.535 995 1.767
Average Default Cost per Loan: Repaid and Defaulted
5.6% 17% 8% 10%
Average Default Cost as Proportion of DKK Loaned
92.388 123.658 41.863 27.947
Average Net Cost as Per Loan 3,1% 14,2% 4,8% 5,4%
Source: Marc Cowling 2014 and DGF
116 EVALUATION OF THE DANISH GROWTH FUND | DAMVAD.COM
cost, the relatively low risk of failure or non-repay-
ment of the majority of smaller firms, and also a de-
sire by most entrepreneurs to maintain control of
their businesses.
Pros and cons of publicly-funded schemes aimed at
enhancing the access to debt financing
Small firm financing obstacles have almost twice the
effect on annual growth than large firm financing ob-
stacles (Beck and Demirguc-Kunt, 2008). If default
increases as constrained firms become uncon-
strained via the loan guarantee, then under certain
conditions, banks are better off without a scheme.
This occurs as loan guarantees raise the equilibrium
price (via the government interest rate premium)
and volume (number of loans and the total value of
loans) traded in the market. This can lead to a situ-
ation where banks are lending at levels above their
profit maximising level (Cressy, 1996; Devinney,
1986; Cowling, 2010). Thus the price for private
loans becomes higher as a result of government in-
tervention. This may, in turn, lead to fewer loans,
more defaults, and presumably fewer entrepreneurs
because of the higher cost of loans will lessen de-
mand. However, the empirical evidence tends to
suggest that small firms have a relatively steep de-
mand curve for loans and only reduce their demand
at relatively high levels of interest rates. But in gen-
eral, if entrepreneurs and small firms are unfairly ra-
tioned due to lack of collateral where their projects
are of comparable quality to those that get funded
by the market, then there is a clear role for govern-
ment intervention to correct this market failure.
The fact that not all potential entrepreneurs and/or
small businesses get access to loans is a necessity,
but not a sufficient condition, for justifying public in-
tervention in credit markets,38 which often is not un-
derstood by entrepreneurs or policymakers. Since 38 This is true if need is assessed on purely economic grounds, although these constraints may be relaxed if schemes pursue an explicit social agenda.
part of the remit of governments is to improve the
social and economic welfare of their citizens, policy
intervention can often be justified by taking into ac-
count socio-economic objectives. For example,
banks and investors are not explicitly interested in
job creation and local economic development per
se, unless it leads directly to more deal flow, higher
repayment rates or more profit. Whereas in a public
policy cost-benefit analysis, more jobs not only re-
duces social welfare payments (a cost saving to the
state) but new employees pay taxes and stimulate
consumption, government has a broader scope of
what constitutes a successful loan guarantee
scheme. To justify the introduction or continuation
of a loan guarantee scheme, it must be the case that
small firms cannot gain access to (proportionally) as
much credit, or credit on equally favourable terms,
as larger firms of equal risk.
If banks only compete on collateral (assuming com-
petition drives down a common loan rate), an in-
crease in collateral requirements drives the safest
entrepreneurs out of the market as banks, incor-
rectly, assume that only good borrowers will risk
their assets. But it is questionable whether entrepre-
neurial talent is the prerogative of the wealthy or
more broadly distributed throughout the population
as a whole. Without reasonable access to financing,
many talented entrepreneurs may be forced to ac-
cept waged employment and contribute less to the
economic system. Innovation and business devel-
opment will become a luxury reserved for the
wealthy, and the economy as a whole will suffer
(Hanson, 1983). Efficiency requires that talent, not
wealth, should determine who becomes an entre-
preneur (Cowling et al., 2003). Here it is important
for the government to address this problem and to
EVALUATION OF THE DANISH GROWTH FUND | DAMVAD.COM 117
ensure good entrepreneurs access to loans or col-
lateral in form of loan guarantees.
‘Even if government lending programs ini-
tially make losses and seem inefficient,
they can have long-run general equilibrium
effects in the credit market that improve ef-
ficiency.’39
Colombo and Grilli (2007) argue that even those
firms which successfully obtained a bank loan were
constrained by the amount offered, causing them to
be unable to reach an efficient scale of production.
Therefore, even though firms can get bank loans, a
government loan guarantee scheme has a purpose
of helping companies to get enough capital to en-
sure the most efficient scale of production and thus
increase the financial additionality and reduce the
deadweight loss that results from a lack of financing.
What about the alternative of direct lending by gov-
ernment agencies? Historically, this has been an
important means of channelling small amounts of
capital to entrepreneurs and small firms. But direct
lending (or in the extreme, non-repayable grants)
requires that government agents are capable of
evaluating funding proposals, conducting due dili-
gence, and assessing market risk. The sunk costs
associated with creating an agency, staffing it with
experienced financiers, and supporting the IT re-
quired are large. It also raises important issues
around entrepreneurs’ perceptions of what direct
government funding is compared to a private bank
loan in terms of moral hazard (switching to riskier
projects) and the requirement to repay. Equally, the
direct investment model raises political questions
around whether the government is prepared to take
legal action against its own citizens in the event of
default. 39 Ghatak et al. (2002): CREDIT RATIONING, WEALTH INEQUALITY,
However, the UK government, in a direct response
to the financial crisis of September 2008, set up
such a lending vehicle called the Transitional Loan
Fund. The scheme was a direct lending scheme de-
livered through the UK Regional Development
Agencies which made direct loans to existing SMEs
with cash-flow problems. The scheme was only
available for a 12-month period before it was closed
and was explicitly a rapid and temporary govern-
ment response to the issue that many established
and viable SMEs might go out of business as private
banks cut off their credit facilities. The Regional De-
velopment Agencies adopted a more traditional
lending approach and hired former bank staff to ad-
minister it. Lending decisions were made on a more
personal basis with face-to-face discussions be-
tween the lending officer and entrepreneur sup-
ported by financial accounts data and forecasts.
Loans were relatively short-term, for cash-flow pur-
poses, and attracted a high rate of interest. A formal
evaluation (Cowling and Oakley, 2010) concluded
that “this study has broadly confirmed both the ra-
tionale for and effectiveness of the Transitional
Loan Funds. The evidence suggests that Transi-
tional Loan Funds are meeting a real need and
providing clear benefits for many businesses. Tran-
sitional Loan Funds, by advancing working capital
to cash constrained SMEs, improve SMEs’ ability to
survive the economic downturn, and build capabili-
ties to help them grow as the economy emerges
from recession.” Thus, it is apparent that direct lend-
ing, under certain conditions, particularly using ex-
perienced professional financiers, can (a) alleviate
credit rationing, and (b) generate positive returns to
government.
AND ALLOCATION OF TALENT p. 20
118 EVALUATION OF THE DANISH GROWTH FUND | DAMVAD.COM
The specifics of DGF’s schemes
In an international context/comparison, it is interest-
ing to look at possible conclusions which may be
drawn on the specifics of the schemes; i.e., the pric-
ing, guarantee coverage, relationship with the
banks/financial institution, nature of the risk (e.g.,
subordination).
An analysis of the Canadian Small Business Fi-
nancing programme (CDBF) made by Riding et al.
(2006) finds that 81 percent of their loan guarantee
sample (of 10,000 loan guarantees) would have
been turned down for a conventional loan. The au-
thors found that these guarantees contributed to an
additional 22,000 full-time jobs in Canada each
year. Thus, according to this paper, the CSBF had
a large positive impact on employment and thus the
Canadian economy as a whole.
Cowling (2007; 2008; 2010), Cowling and Siepel
(2013) and Cowling and Mitchell (2003) have ana-
lysed the UK Small Firms Loan Guarantee (SFLG)
scheme. They find that default increases with the
banks’ cost of capital (the loan rate) but not with the
government premium. This latter effect is clear evi-
dence of market failure as banks have incorrectly
assumed that raising the cost of capital would in-
crease default. In addition, default was also found to
increase in periods of macroeconomic growth, sug-
gesting that in economic upturns the marginal SFLG
borrower is of lower quality as banks relax their
lending criteria. This shows that during economic
downturn, when banks’ lending is constrained by
their capital base, is when governments should in-
crease their support of entrepreneurs, because in
periods of economic growth, banks will supply suffi-
cient capital to good entrepreneurs.
Cowling and Siepel (2013) examined whether the
UK Small Firms Loan Guarantee Scheme (SFLG)
provides value-for-money to the UK taxpayer. Their
findings suggest that entrepreneurial firms which
are able to access new finance through SFLG
achieve superior performance in the form of im-
proved sales, job creation and exports and that this
justifies public intervention in private credit markets.
All other factors being equal, not having any collat-
eral reduces a firms’ maximum borrowing by half.
This is supportive of the role of SFLG in allowing
certain types of small firm’s access to bank funding
under commitment from the government.
From the evaluation evidence presented, it is rea-
sonable to conclude that the majority of studies
found that schemes improved access to debt fi-
nance. However, at the extreme, loan guarantee
schemes can have negative economic conse-
quences as in the case of the Japanese “Special
Credit Guarantee Programme for Financial Stability”
(SGC) where the guarantees were 100% of the
loans. The companies that received the 100% guar-
antee did not have the incentive to investment them
in the safest investment, but instead invested them
in high-risk, high-return investments because they
could not lose any money.
Whilst the broad body of evidence is far from con-
clusive, it does appear that in certain circumstances
interventions of this type can create additional eco-
nomic benefits including local economic growth, in-
novation, technology adoption, exports and jobs.
And it appears to be the case that there will always
be a small pool of borrowers who, due to information
problems, will find it hard to access bank funding,
thus providing some justification for this type of pol-
icy intervention.
The evidence is broadly supportive of the use of fi-
nancial engineering instruments to correct for (lack
of) collateral issues in debt markets and to a lesser
degree lack of a track record. Loan guarantee
schemes have the advantage of being simple to de-
sign and administer and typically require that invest-
ment appraisal is conducted on a commercial basis
EVALUATION OF THE DANISH GROWTH FUND | DAMVAD.COM 119
thus minimising deadweight. Instruments of this
type are most effective when the entrepreneurial
population, and entrepreneurial talent, is more
widely distributed than wealth throughout the gen-
eral population. This gives loan guarantee schemes
the potential to have disproportionately high and
positive effects in countries and regions where (a)
collateral based lending is the norm, and (b) a sig-
nificant proportion of the entrepreneurial population
is not asset rich. As a tool for promoting local eco-
nomic development, loan guarantee schemes have
been shown to be a relatively successful means of
public-policy intervention. Their use is more widely
relevant in the current global financial crisis where
the financial constraints of banks are very high.
When designing a new scheme, or adjusting an ex-
isting one, policymakers need to consider before-
hand both bank sensitivity to the guarantee level
and firms’ sensitivity to the interest premium in par-
ticular. If the premium is too high, the total volume
of loans will fall, thus making the scheme irrelevant
and making the fixed cost of operation and manage-
ment too high compared to the gains. If the guaran-
tee level is too high, the cost to government of firms’
defaulting on the loans will be too high, and thus
their incentive to use the money to high-risk, high-
reward investments will be increased as in the pre-
viously mentioned case from Japan. Evidence from
the UK Enterprise Finance Guarantee evaluation
suggests that firms are sensitive to interest rate
margins above 5% over base which represents an
effective price ceiling for guaranteed loans. Above
this 5% ceiling, 85% of total issued loans would not
have been taken up by the SMEs who received
them.
Most schemes operated in developed countries
would be in the 70–80% guarantee and 2–3% inter-
est premium range historically. This should ensure
that only good quality lending propositions are
funded as the bank bears enough risk to conduct
due diligence. This ensures that loans which are
made have a higher probability of being additional
than those that would have been made. The DGF
scheme follows these general guidelines with guar-
antees of 75% and a premium of 3% when the loan
is obtained on get-started loans. for Growth Guar-
antee loans the premium is 2% when the loan is
optioned and 1.25 % a year.
Loan guarantee schemes benefit from being simple
to create and operationalise and also from being
widely understood by all actors in the debt market.
This helps avoid the problem of many complex gov-
ernment programmes, which are only understood
and accessed by those with the high level of aware-
ness, skills, knowledge and resources to clear all
the necessary hurdles and deal with the complexi-
ties of application. This is generally why smaller
firms do not bid for government contracts and why
in many cases scheme deadweight can often be
high. It is therefore important for DGF to have a sim-
ple structure of the loan guarantee scheme so en-
trepreneurs easily know how to get the guarantees
and what they cost.
A clear advantage of a government-backed loan
guarantee programme is that the government can
take a longer (and broader) view in terms of the tim-
ing and nature of its investments. Economic evalu-
ations of government-supported financial pro-
grammes suggest that the full economic benefits of
new investments can take up to six years to fully ac-
cumulate. This is important as the costs of many
schemes are incurred early on in the investment
process, and in particular 80% of defaulting loans
do so within 2 years of the loan being made. A fail-
ure to accommodate these facts can result in eval-
uations being conducted too early in the investment
cycle and erroneous (and negative) conclusions be-
ing drawn. This is known as the J-curve effect where
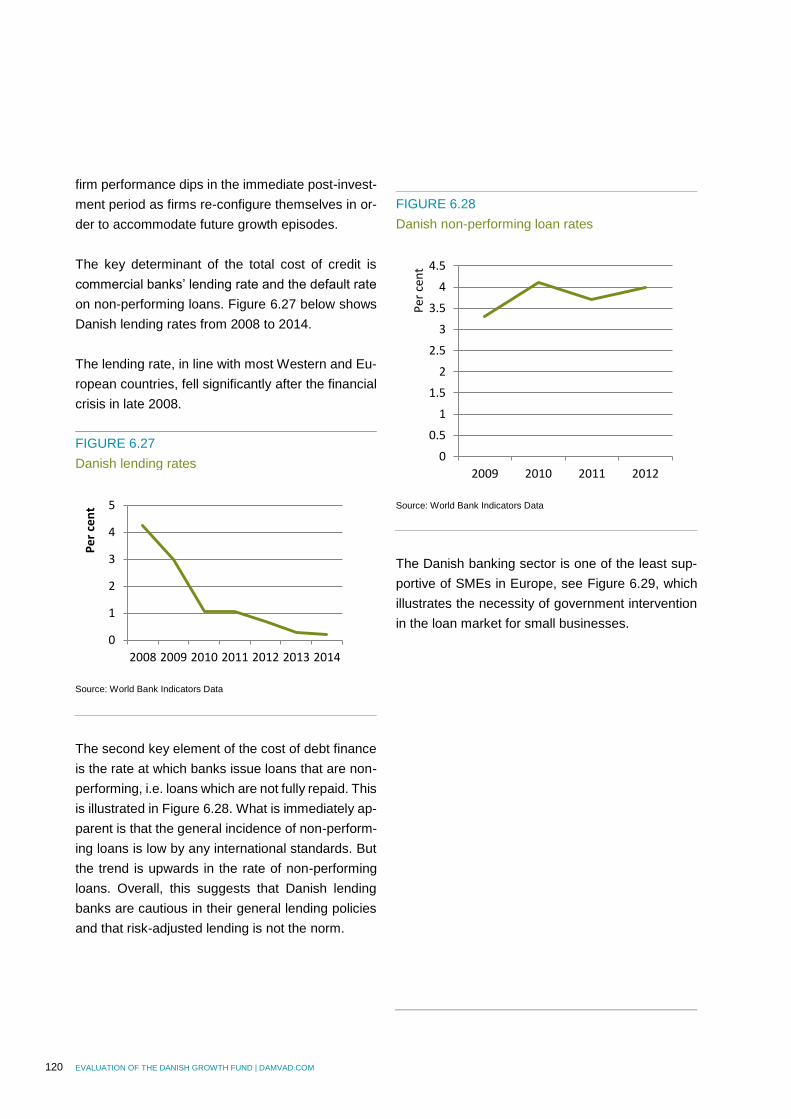
120 EVALUATION OF THE DANISH GROWTH FUND | DAMVAD.COM
firm performance dips in the immediate post-invest-
ment period as firms re-configure themselves in or-
der to accommodate future growth episodes.
The key determinant of the total cost of credit is
commercial banks’ lending rate and the default rate
on non-performing loans. Figure 6.27 below shows
Danish lending rates from 2008 to 2014.
The lending rate, in line with most Western and Eu-
ropean countries, fell significantly after the financial
crisis in late 2008.
FIGURE 6.27
Danish lending rates
Source: World Bank Indicators Data
The second key element of the cost of debt finance
is the rate at which banks issue loans that are non-
performing, i.e. loans which are not fully repaid. This
is illustrated in Figure 6.28. What is immediately ap-
parent is that the general incidence of non-perform-
ing loans is low by any international standards. But
the trend is upwards in the rate of non-performing
loans. Overall, this suggests that Danish lending
banks are cautious in their general lending policies
and that risk-adjusted lending is not the norm.
FIGURE 6.28
Danish non-performing loan rates
Source: World Bank Indicators Data
The Danish banking sector is one of the least sup-
portive of SMEs in Europe, see Figure 6.29, which
illustrates the necessity of government intervention
in the loan market for small businesses.
0
1
2
3
4
5
2008 2009 2010 2011 2012 2013 2014
Pe
r ce
nt
0
0.5
1
1.5
2
2.5
3
3.5
4
4.5
2009 2010 2011 2012
Per
cen
t
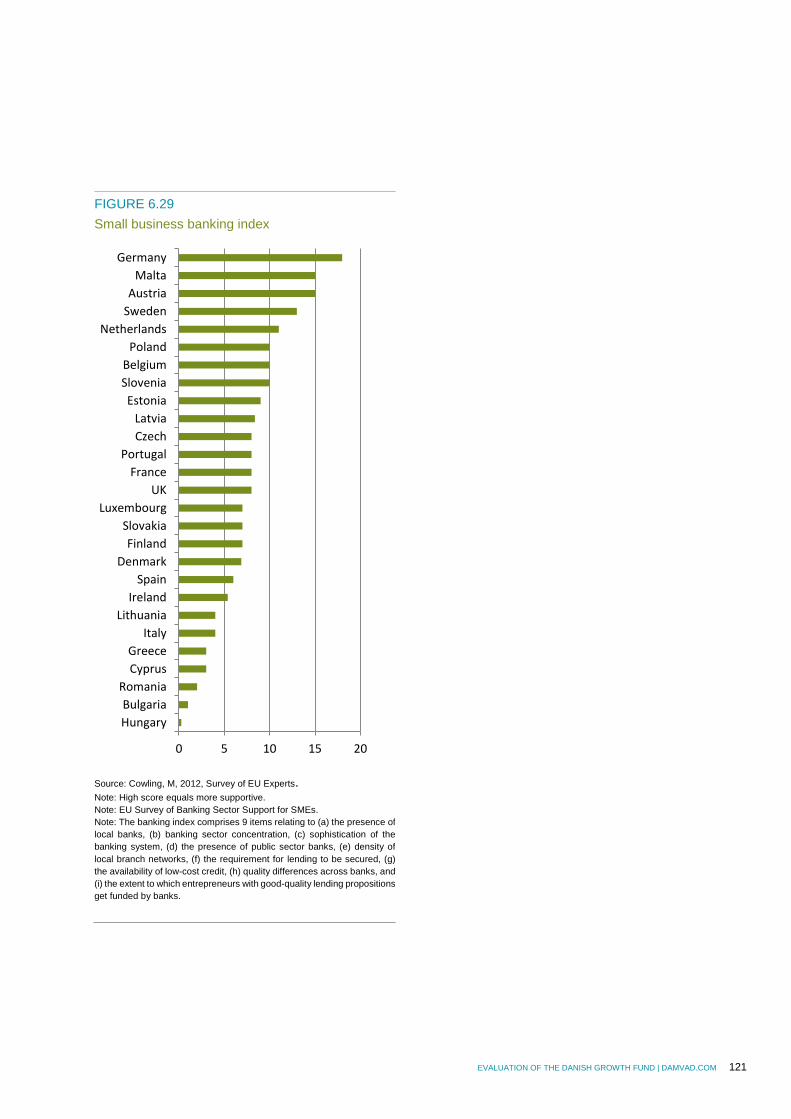
EVALUATION OF THE DANISH GROWTH FUND | DAMVAD.COM 121
FIGURE 6.29
Small business banking index
Source: Cowling, M, 2012, Survey of EU Experts. Note: High score equals more supportive.
Note: EU Survey of Banking Sector Support for SMEs.
Note: The banking index comprises 9 items relating to (a) the presence of
local banks, (b) banking sector concentration, (c) sophistication of the
banking system, (d) the presence of public sector banks, (e) density of
local branch networks, (f) the requirement for lending to be secured, (g)
the availability of low-cost credit, (h) quality differences across banks, and
(i) the extent to which entrepreneurs with good-quality lending propositions
get funded by banks.
0 5 10 15 20
Hungary
Bulgaria
Romania
Cyprus
Greece
Italy
Lithuania
Ireland
Spain
Denmark
Finland
Slovakia
Luxembourg
UK
France
Portugal
Czech
Latvia
Estonia
Slovenia
Belgium
Poland
Netherlands
Sweden
Austria
Malta
Germany
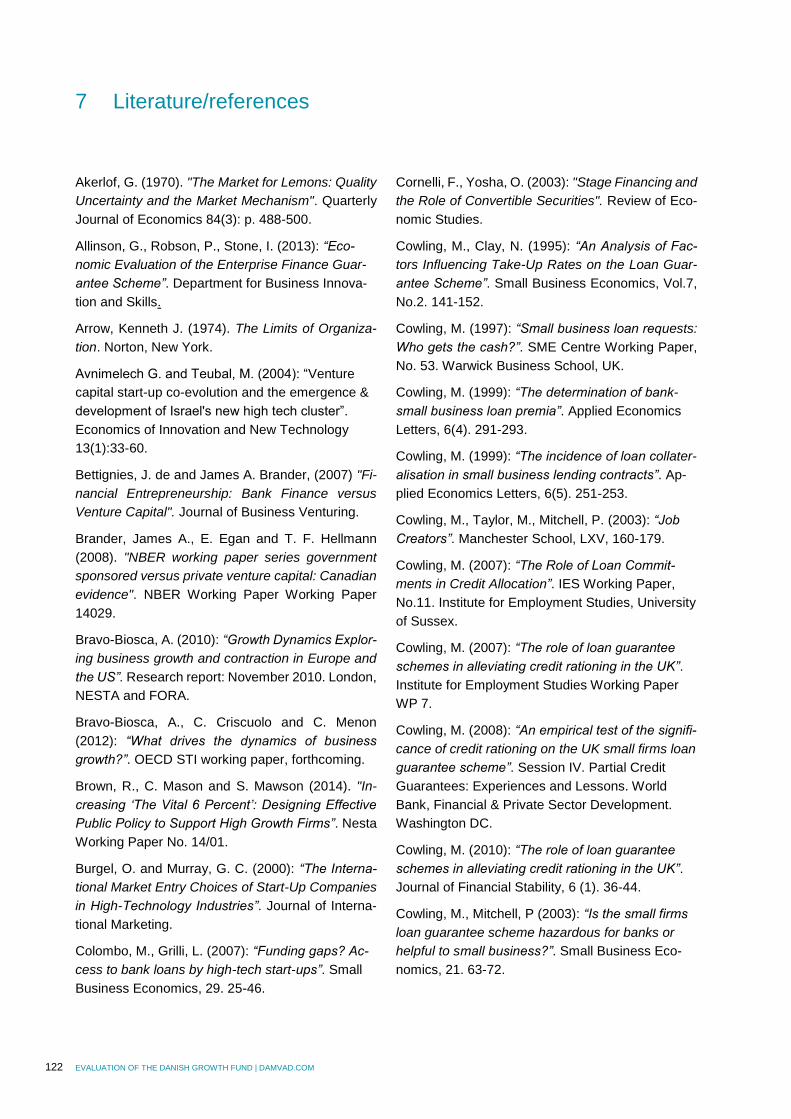
122 EVALUATION OF THE DANISH GROWTH FUND | DAMVAD.COM
Akerlof, G. (1970). "The Market for Lemons: Quality
Uncertainty and the Market Mechanism". Quarterly
Journal of Economics 84(3): p. 488-500.
Allinson, G., Robson, P., Stone, I. (2013): “Eco-
nomic Evaluation of the Enterprise Finance Guar-
antee Scheme”. Department for Business Innova-
tion and Skills.
Arrow, Kenneth J. (1974). The Limits of Organiza-
tion. Norton, New York.
Avnimelech G. and Teubal, M. (2004): “Venture
capital start-up co-evolution and the emergence &
development of Israel's new high tech cluster”.
Economics of Innovation and New Technology
13(1):33-60.
Bettignies, J. de and James A. Brander, (2007) "Fi-
nancial Entrepreneurship: Bank Finance versus
Venture Capital". Journal of Business Venturing.
Brander, James A., E. Egan and T. F. Hellmann
(2008). "NBER working paper series government
sponsored versus private venture capital: Canadian
evidence". NBER Working Paper Working Paper
14029.
Bravo-Biosca, A. (2010): “Growth Dynamics Explor-
ing business growth and contraction in Europe and
the US”. Research report: November 2010. London,
NESTA and FORA.
Bravo-Biosca, A., C. Criscuolo and C. Menon
(2012): “What drives the dynamics of business
growth?”. OECD STI working paper, forthcoming.
Brown, R., C. Mason and S. Mawson (2014). "In-
creasing ‘The Vital 6 Percent’: Designing Effective
Public Policy to Support High Growth Firms”. Nesta
Working Paper No. 14/01.
Burgel, O. and Murray, G. C. (2000): “The Interna-
tional Market Entry Choices of Start-Up Companies
in High-Technology Industries”. Journal of Interna-
tional Marketing.
Colombo, M., Grilli, L. (2007): “Funding gaps? Ac-
cess to bank loans by high-tech start-ups”. Small
Business Economics, 29. 25-46.
Cornelli, F., Yosha, O. (2003): "Stage Financing and
the Role of Convertible Securities". Review of Eco-
nomic Studies.
Cowling, M., Clay, N. (1995): “An Analysis of Fac-
tors Influencing Take-Up Rates on the Loan Guar-
antee Scheme”. Small Business Economics, Vol.7,
No.2. 141-152.
Cowling, M. (1997): “Small business loan requests:
Who gets the cash?”. SME Centre Working Paper,
No. 53. Warwick Business School, UK.
Cowling, M. (1999): “The determination of bank-
small business loan premia”. Applied Economics
Letters, 6(4). 291-293.
Cowling, M. (1999): “The incidence of loan collater-
alisation in small business lending contracts”. Ap-
plied Economics Letters, 6(5). 251-253.
Cowling, M., Taylor, M., Mitchell, P. (2003): “Job
Creators”. Manchester School, LXV, 160-179.
Cowling, M. (2007): “The Role of Loan Commit-
ments in Credit Allocation”. IES Working Paper,
No.11. Institute for Employment Studies, University
of Sussex.
Cowling, M. (2007): “The role of loan guarantee
schemes in alleviating credit rationing in the UK”.
Institute for Employment Studies Working Paper
WP 7.
Cowling, M. (2008): “An empirical test of the signifi-
cance of credit rationing on the UK small firms loan
guarantee scheme”. Session IV. Partial Credit
Guarantees: Experiences and Lessons. World
Bank, Financial & Private Sector Development.
Washington DC.
Cowling, M. (2010): “The role of loan guarantee
schemes in alleviating credit rationing in the UK”.
Journal of Financial Stability, 6 (1). 36-44.
Cowling, M., Mitchell, P (2003): “Is the small firms
loan guarantee scheme hazardous for banks or
helpful to small business?”. Small Business Eco-
nomics, 21. 63-72.
7 Literature/references
EVALUATION OF THE DANISH GROWTH FUND | DAMVAD.COM 123
Cowling, M., Oakley, J. (2010): “Economic Evalua-
tion of the Transitional Loan Fund”. Department for
Business Innovation and Skills. UK.
Cowling, M. (2010): “Economic Evaluation of the
Small Firms Loan Guarantee Scheme”. Department
for Business Innovation and Skills. UK.
Cowling, M., Siepel, J. (2013): “Loan Guarantee
Schemes: Helpful or a Waste of Scarce Re-
sources?”. Technovation, 33. 265-275.
ttp://dx.doi.org/10.1016/j.technovation.2012.11.002
Cowling, M., C. Baden-Fuller, C. M. Mason, M. Hop-
kins and G. C. Murray (2009). "From Funding Gaps
to Thin Markets: UK Government Support for Early-
Stage Venture Capital". SSRN eLibrary.
Cowling, M., P. Bates , N. Jagger and G. Murray
(2008): “Study of the impact of the Enterprise In-
vestment Scheme (EIS) and Venture Capital Trusts
(VCTs) on company performance”. HM Revenue &
Customs Research Report 44.
Cowling, M., L. Weixi, G. Murray, J. Seiple and P.
Nightingale (2011). “BIS EQUITY SCHEMES
EVALUATION. B. o. B. I. a. Skills”. London, UK.
Craig, B., Jackson III, W., Thomson, J. (2007):
“Small firm finance, credit rationing, and the impact
of SBA guaranteed lending on local economic
growth”. Journal of Small Business Management,
45 (1). 116-132.
Craig, B., Jackson III, W., Thomson, J. (2005):
“SBA loan guarantees and local economic growth”.
Federal Reserve Bank of Cleveland Working Pa-
per, 05-03.
Craig, B., Jackson III, W., Thomson, J. (2006):
“Small firm credit market discrimination, SBA guar-
anteed lending, and local market economic perfor-
mance”. Federal Reserve Bank of Cleveland Work-
ing Paper, 06-13.
Craig, B., Jackson III, W., Thomson, J. (2007):
“Small firm credit market discrimination, SBA guar-
anteed lending, and local market economic perfor-
mance”. Annals of the American Association of Po-
litical and Social Science, 613. 73-94.
Cressy, R. (1996): “Are business start-ups debt ra-
tioned?”. Economic Journal, 106. 1253-1270.
Cumming, D., G. Fleming and A. Schwienbacher
(2009). "Style Drift in Private Equity". Journal of
Business Finance & Accounting 36(5-6): 645-678.
Cumming, D. J. (2010). "Review Essay: Public Pol-
icy and the Creation of Active Venture Capital Mar-
kets and Some Comments on 'Boulevard of Broken
Dreams: Why Public Efforts to Boost Entrepreneur-
ship and Venture Capital Have Failed and What to
Do About It,' by Josh Lerner." Venture Capital: An
International Journal of Entrepreneurial Finance,
Forthcoming.
Cumming, D. J. and J. G. MacIntosh (2003): “Mutual
funds that invest in private equity? An analysis of
labour-sponsored investment funds”. University of
Alberta; University of Toronto.
Cumming, D. J., MacIntosh, J. G. (2006). "Crowding
out private equity: Canadian evidence". Journal of
Business Venturing 21(5): 569-609.
Da Rin, M., G. Nicodano and A. Sembenelli (2004).
"Public Policy and the Creation of Active Venture
Capital Markets" RICAFE Working Paper No 013.
DAMVAD (2013): ”The Danish Growth Fund’s
(DGF) activities - Mapping the effects of DGF”.
Devinney, T. (1986): “Rationing in the theory of the
banking firm”. Springer-Verlag. Berlin.
Dimov, D. and Murray G. (2008). "Determinants of
the Incidence and Scale of Seed Capital Invest-
ments by Venture Capital Firms" Small Business
Economics 30(2): 127-152.
E. R. A. C. (ERAC) (2012): “Peer-Review of the
Danish Research and Innovation System: Strength-
ening innovation performance”. E. Commission.
Brussels, Belgium and Copenhagen, Denmark.
European Commission (2012a): “European Com-
mission SBA Fact Sheet 2012”. Brussels, Belgium.
European Commission (2012b): “European Com-
mission 2012 Peer-Review of the Danish Research
and Innovation System”. Brussels, Belgium.
124 EVALUATION OF THE DANISH GROWTH FUND | DAMVAD.COM
European Commission (2013): “Innovation Union
Scoreboard 2013”. Brussels, Belgium.
European Private Equity and Venture Capital Asso-
ciation (EVCA) (2013): “Yearbook 2012 - Activity
Data on Fundraising, Investments and Divestments
by Private Equity and Venture Capital Firms in Eu-
rope”.
European Private Equity and Venture Capital Asso-
ciation (EVCA) (2013): “2012 Pan-European Private
Equity Performance Benchmarks Study”.
Erlich, Y. (2001): “The Israeli Venture Capital Indus-
try”. Presentation at London Business School, UK.
Financial Conduct Agency (2014): “The Financial
Conduct Authority places consumer protection at
the heart of Crowdfunding”. Press Release 6th
March 2014. London, FCA.
Ghatak, M., Morelli, M., Sjostrom, T. (2002):
“Credit rationing. wealth inequality, and allocation
of talent”. London School of Economics Discussion
Paper No.TE/02/441.
Gilson, R. J. (2003): "Engineering a Venture Capital
Market: Lessons from the American Experience".
Stanford Law Review Vol. 55, ((4)): p. 1067-1103.
Gompers, P., Kovner, A. and Lerner, J. (2009):
"Specialization and Success: Evidence from Ven-
ture Capital". Journal of Economics & Management
Strategy 18(3): 817-844.
Graham, T. (2004): “Graham review of the small
firms loan guarantee – Final report”. HM Treasury.
London.
Griliches, Z. (1992): "The Search for R&D Spillo-
vers". Scandinavian Journal of Economics 94: 29-
47.
Hakim, G. (1989): “Identifying fast growth small
firms”. Employment Gazette, vol. 97, no. 1, pp. 29-
41.
Hanson, D. (1983): “Introduction in Financing State
and Local Economic Development”, Part IV. Mi-
chael Barber. ed. Duke University Press, North
Carolina.
Hellman, T. and Puri, M. (2000): "The interaction be-
tween product marketing and financing strategy:
The role of venture capital". Review of Financial
Studies 13: p. 959-984.
Isenberg, D. J. (2010): “The public policy forum
2012”. Quebec City Conference October 24th,
2012.
Jaffe, Adam B. (1996): “Economic Analysis of Re-
search Spillovers: Implications for the Advanced
Technology Program”. Economic Assessment Of-
fice, The Advanced Technology Program, National
Institutes of Standards and Technology, U.S. De-
partment of Commerce.
Jensen, Michael C. and Meckling, William H.,
(1976): “Theory of the Firm: Managerial Behavior,
Agency Costs and Ownership Structure”. Journal of
Financial Economics.
Jääskeläinen, M., Maula, M. and Murray, G. (2007):
“Profit distribution and compensation structures in
publicly and privately funded hybrid venture capital
funds”. Research Policy.
Kaplan, S. N., Martel, F. and Stromberg, P. (2007):
"How do Legal Differences and Experience Affect
Financial Contracts?". Journal of Financial Interme-
diation.
Kenney, M. and U. von Burg (1999): "Technology
and Path Dependence: The Divergence between
Silicon Valley and Route 128". Industrial and Corpo-
rate Change.
Keuschnigg, C. and Nielsen, S. B. (2004): "Start-
ups, venture capitalists, and the capital gains
tax": Journal of Public Economics.
Klapper, LF., Mendoza, JC., Beck, T. (2007):
“World – Partial Credit Guarantee Survey”. World
Bank Microdata.
Li, Y. and Zahra, S. A. (2012): "Formal institutions,
culture, and venture capital activity: A cross-country
analysis". Journal of Business Venturing 27(1): 95-
111.
EVALUATION OF THE DANISH GROWTH FUND | DAMVAD.COM 125
Lerner, J. and Khortum (2000): "Assessing the con-
tribution of Venture Capital to Innovation". RAND
Journal for Economics 31(4).
Lerner, J. and Tag, J. (2012): “Institutions and Ven-
ture Capital”. Swedish Entrepreneurship Forum.
Lerner, J. and Hellmann, T. (2012): “The changing
landscape on new venture finance”. Presentation at
the Quebec City Conference 24th October, 2012.
Li, Y. (2006): “Banks, private money and govern-
ment regulation”. Journal of Monetary Economics,
53. 2067-2083.
Lithander, J., A. Isaksson and J. Mansson (2010):
“The State and Risk Capital - Interim Report 1: Pro-
cedural Description and Knowledge Survey”. T. S.
A. f. G. P. Analysis. Ostersund, Sweden.
Luukkonen, T., Deschryvere, M. and Bertoni, F.
(2013): "The value added by government venture
capital funds compared with independent venture
capital funds". Technovation 33(4–5): 154-162.
Mollick, E. (2013): “The dynamics of Crowdfunding;
an exploratory study”. Journal of Business Ventur-
ing.
Murray, G., M. Cowling and W. Liu (2010): “An In-
dependent Econometric Analysis of the “Innovation
Investment Fund Programme (IIF)” of the Australian
Commonwealth Government: Findings and Implica-
tions”. Canberra, Australia, Department of Innova-
tion, Industry, Science and Research, Australian
Government.
Murray, G., Marriott, R. (1998): "Why Has the In-
vestment Performance of Technology-Specialist,
European Venture Capital Funds Beed So Poor?".
Research Policy 27(9): 947-976.
Murray, G. C., Lingelbach, D. C. (2009). "Twelve
Meditations on Venture Capital: Some Heretical Ob-
servations on the Dissonance between Theory and
Practice When Applied to Public/Private Collabora-
tions on Entrepreneurial Finance Policy". SSRN eLi-
brary.
Napier, G., Hansen, C. (2011): “Ecoystems for High
Growth Young Firms”. FORA.
NESTA (2012): “Crowding In”. London, NESTA.
NESTA (2013): “Access to Finance: Impacts of
Publicly Supported Venture Capital and Loan
Guarantees”. Nesta Working Paper No.13/02
OECD (1991): “Principles for evaluation of develop-
ment assistance”. Development Assistance Com-
mittee.
OECD (2011): "Financing High Growth Firms: the
role of angel investors".
OECD (2013): "Credit Guarantee Schemes: A Tool
to Promote SME Growth and Innovation in the
MENA Region – report and guidelines". MENA-
OECD Investment Programme Working Paper.
OECD (2013): “Entrepreneurial ecosystems and
growth-oriented entrepreneurship”. OECD Paris.
OECD (2013): “OECD Science, Technology and In-
dustry Scoreboard 2013”. Paris. France.
OECD (2014a): “OECD Economic Surveys DEN-
MARK”. Paris, France.
OECD (2014b): “OECD Country Report Denmark,
2014”. Paris. France.
Oviatt, B. M. and P. P. McDougall (2005): "Defining
international entrepreneurship and modeling the
speed of internationalization". Entrepreneurship
Theory and Practice 29(5): 537-553.
Pierakis, Y. and Collins, L. (2013): “Peer–to–peer
lending to business: Evidence from Funding Circle”.
London, NESTA.
Porter, M. E. (1990): "The Competitive Advantage
of Nations". Harvard Business Review: 73-93.
Riding, A. (2006): “Incrementality of SME loan
guarantees”. Small Business Economics, 29. 47-
61.
Rigby, J. and R. Ramlogan (2013): "Access to Fi-
nance: Impacts of Publicly Supported Venture Cap-
ital and Loan Guarantees". Nesta Working Paper
No. 13/02.
126 EVALUATION OF THE DANISH GROWTH FUND | DAMVAD.COM
Rosa, C., D. Machado and K. Raade (2006): “Prof-
itability of venture capital investments in Europe and
the United States. European Economy”. Brussels,
Directorate-General for Economic and Financial Af-
fairs, European Commission.
Ruhnka, J. C. and J. E. Young (1987): "A Venture
Capital Model of the Development Process for New
Ventures". Journal of Business Venturing 2(2): 167-
184.
Sapienza, H. (1992): "When Do Venture Capitalists
Add Value?". Journal of Business Venturing 7(1): 9-
27.
Services, C. f. S. E. (2012): “Evaluation of member
State Policies to Facilitate Access to Finance for
SMEs - Final Report”. Kent, UK.
Sofianos, G, Wachtel, P, Melnik, A (1990): “Loan
Commitments and Monetary Policy”. Journal of
Banking and Finance, 14, October. 677-689.
Sohl, J. E. (2003): "The private equity market in the
USA: lessons from volatility". Venture Capital: An In-
ternational Journal of Entrepreneurial Finance 5(1):
29 – 46
Stiglitz, J. E. & Weiss, A. (1981): “Credit rationing in
markets with imperfect information”. American Eco-
nomic Review, vol. 71(3), pages 393-410, June.
Swedish Agency for Growth Policy Analysis (2009):
“The State and Risk Capital Interim Report 1: Pro-
cedural Description and Knolwedge Survey”. Oster-
sund, Sweden.
The Treasury and the Department of Industry, I.,
Science, Research and Tertiary Education (2012):
“Review of Venture Capital and Entrepreneurial
Skills - Final report”. Canberra, Australia.
Tykvova, T., Borell, M., Kroencke, T. (2012): “Po-
tential of Venture Capital in the European Union”.
Directorate-General for Internal Policies, Policy De-
partment A, Economic and Scientific Policy, Euro-
pean Parliament. February, Brussels.
Wadhwa, V., B. Rissing, A. Saxenian and G. Gereffi
(2007): “Education, Entrepreneurship and Immigra-
tion: America's New Immigrant Entrepreneurs, Part
II”. T. K. Foundation.
Wilson, K. and F. Silva (2013). Policies for Seed and
Early Finance, Findings from the 2012 OECD Fi-
nancing Questionnaire. OECD Science, technology
and Industry Policy Papers No. 9, Paris, OECD.
EVALUATION OF THE DANISH GROWTH FUND | DAMVAD.COM 127
Cornerstone investor: Usually large institutional
investors or well-known individuals to whom a share
of a future fund is allocated in order to signal to the
market that the fund and its management team are
an interesting investment and worthwhile for other
investors.
Direct investment: Equity investments made di-
rectly by the investor in a company.
Entrepreneurial ecosystem: In a broader sense
this refers to the environment affecting the local/re-
gional entrepreneurship. Entrepreneurial policies
aim to affect the ecosystem by adjusting the frame-
work conditions.
Expansion capital: Capital invested in up-scaling a
company or business model.
Follow-on investment: Secondary investments in
a company made by the investor. Secondary invest-
ments will generally be larger than initial invest-
ments because they are typically made to enable
the company to upscale its business, invest in R&D
and enter new markets.
General partner: Owners of a partnership with un-
limited liability. A general partner is also commonly
a managing partner, which means that this person
is active in the day-to-day operations of the busi-
ness. Because any partner in a general partnership
can act on behalf of the entire business without the
knowledge or permission of the other partners, be-
ing a general partner offers poor asset protection.
Indirect investment: Equity investments made by
the investor in a company through a fund managed
by general partners. The investor acts as a limited
partner in the partnership.
Initial investment: The first investment in a com-
pany made by the investor. Venture capitalists gen-
erally make initial investments to enable the com-
pany to develop its business and prove to the mar-
ket that it is scalable.
Limited partner: A partner whose liability is limited
to the extent of the partner's share of ownership.
Limited partners generally do not have any kind of
management responsibility in the partnership in
which they invest and are not responsible for its debt
obligations. For this reason, limited partners are not
considered to be material participants.
Pari passu: In finance, the term refers to loans,
bonds or classes of shares that have equal rights of
payment, or equal seniority. In addition, secondary
issues of shares that have equal rights with existing
shares rank pari passu.
Seed: The initial capital used to start a business.
The amount of money is usually relatively small be-
cause the business is still in the idea or conceptual
stage. Such a venture is generally at a pre-revenue
stage and seed capital is needed for R&D to cover
initial operating expenses until a product or service
can start generating revenue, and to attract the at-
tention of venture capitalists.
Syndicated loans: A loan offered by a group of
lenders (called a syndicate) who work together to
provide funds for a single borrower. The main goal
of syndicated lending is to spread the risk of a bor-
rower defaulting across multiple lenders (such as
banks) or institutional investors like pension funds
and hedge funds.
Venture capital: Money provided by investors to
start-up firms and small businesses with perceived
long-term growth potential. This is a crucial source
of funding for start-ups that do not have access to
capital markets. It typically entails a high risk for the
8 Glossary

128 EVALUATION OF THE DANISH GROWTH FUND | DAMVAD.COM
investor, but has the potential for above-average re-
turns.

EVALUATION OF THE DANISH GROWTH FUND | DAMVAD.COM 129
9.0 Appendix A: Interviews
As part of the evaluation a series of interviews was
conducted with key stakeholders in the Danish VC
environment (see Appendix B for complete list of in-
terview respondents). This includes those compa-
nies who have had access to VC, trade organisa-
tions and other VC providers and intermediaries.
Respondents were identified in cooperation with
DGF and the Ministry of Business and Growth. A to-
tal of 30 key people were interviewed.
The interviews were conducted in person or by tel-
ephone. Given the differences in the respondent
group, it was decided not to develop a questionnaire
or interview guide.
The purpose of the interviews was to:
provide knowledge and insight on the Danish
VC market;
to elaborate on the results of the completed
questionnaire; and
gain insight into the dynamics of the Danish VC
market, and the role of Vækstfonden.
The interviews in themselves provide some
knowledge but also contributed knowledge to the
evaluators, and also helped to qualify the interpre-
tation of the results of the quantitative studies and
the results of the survey.
However, the primary outcome of the interviews
was a better understanding of the role of DGF in the
Danish VC market, based on the input from different
VC market stakeholders, both public and private.
9 Appendix
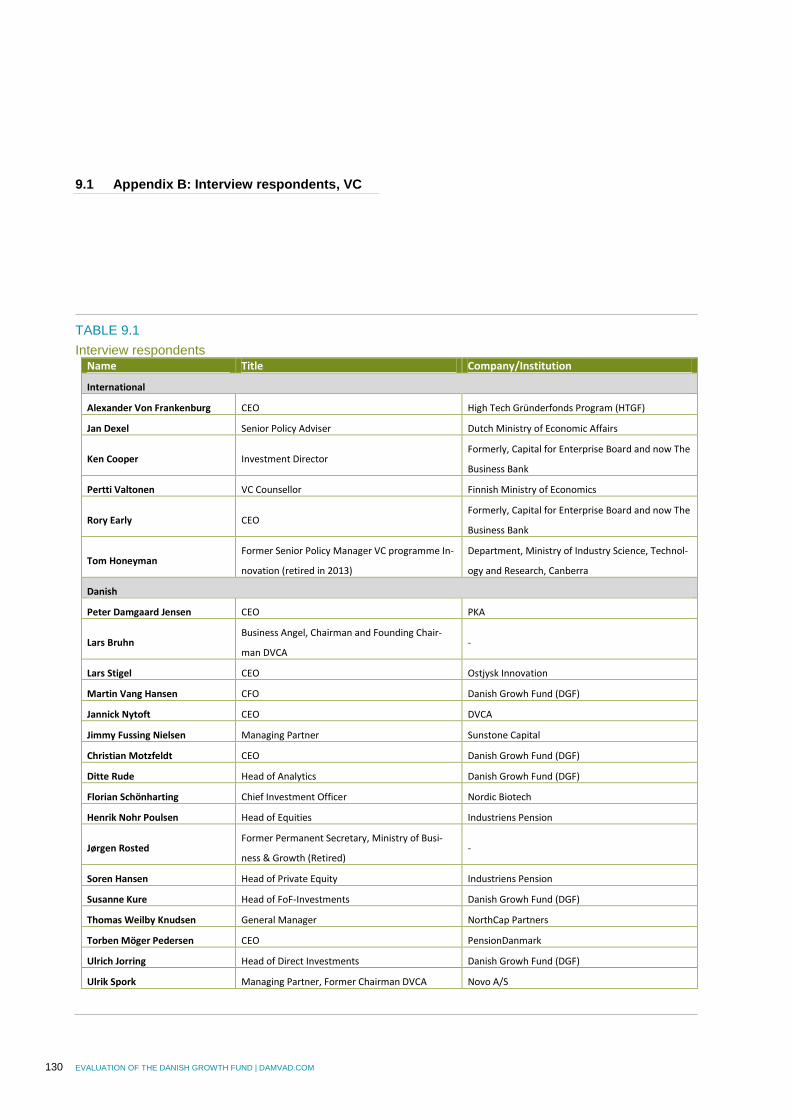
130 EVALUATION OF THE DANISH GROWTH FUND | DAMVAD.COM
9.1 Appendix B: Interview respondents, VC
TABLE 9.1
Interview respondents Name Title Company/Institution
International
Alexander Von Frankenburg CEO High Tech Gründerfonds Program (HTGF)
Jan Dexel Senior Policy Adviser Dutch Ministry of Economic Affairs
Ken Cooper Investment Director Formerly, Capital for Enterprise Board and now The
Business Bank
Pertti Valtonen VC Counsellor Finnish Ministry of Economics
Rory Early CEO Formerly, Capital for Enterprise Board and now The
Business Bank
Tom Honeyman Former Senior Policy Manager VC programme In-
novation (retired in 2013)
Department, Ministry of Industry Science, Technol-
ogy and Research, Canberra
Danish
Peter Damgaard Jensen CEO PKA
Lars Bruhn Business Angel, Chairman and Founding Chair-
man DVCA -
Lars Stigel CEO Ostjysk Innovation
Martin Vang Hansen CFO Danish Growh Fund (DGF)
Jannick Nytoft CEO DVCA
Jimmy Fussing Nielsen Managing Partner Sunstone Capital
Christian Motzfeldt CEO Danish Growh Fund (DGF)
Ditte Rude Head of Analytics Danish Growh Fund (DGF)
Florian Schönharting Chief Investment Officer Nordic Biotech
Henrik Nohr Poulsen Head of Equities Industriens Pension
Jørgen Rosted Former Permanent Secretary, Ministry of Busi-
ness & Growth (Retired) -
Soren Hansen Head of Private Equity Industriens Pension
Susanne Kure Head of FoF-Investments Danish Growh Fund (DGF)
Thomas Weilby Knudsen General Manager NorthCap Partners
Torben Möger Pedersen CEO PensionDanmark
Ulrich Jorring Head of Direct Investments Danish Growh Fund (DGF)
Ulrik Spork Managing Partner, Former Chairman DVCA Novo A/S
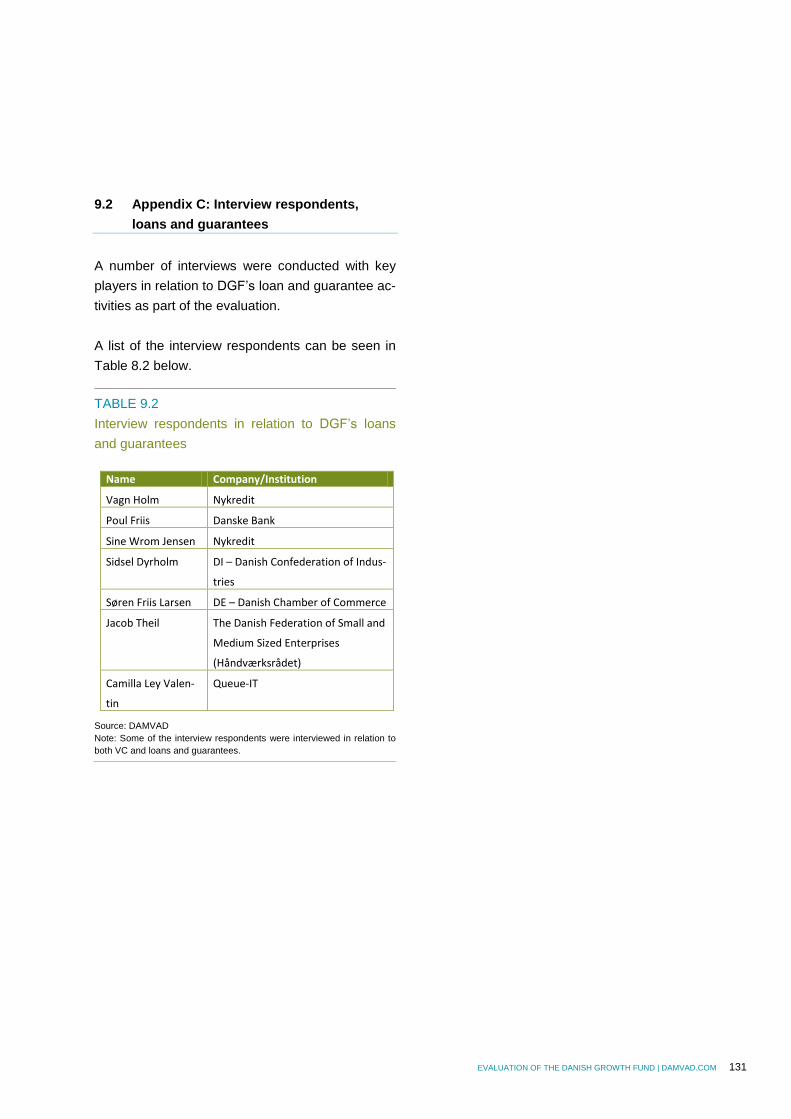
EVALUATION OF THE DANISH GROWTH FUND | DAMVAD.COM 131
9.2 Appendix C: Interview respondents,
loans and guarantees
A number of interviews were conducted with key
players in relation to DGF’s loan and guarantee ac-
tivities as part of the evaluation.
A list of the interview respondents can be seen in
Table 8.2 below.
TABLE 9.2
Interview respondents in relation to DGF’s loans
and guarantees
Name Company/Institution
Vagn Holm Nykredit
Poul Friis Danske Bank
Sine Wrom Jensen Nykredit
Sidsel Dyrholm DI – Danish Confederation of Indus-
tries
Søren Friis Larsen DE – Danish Chamber of Commerce
Jacob Theil The Danish Federation of Small and
Medium Sized Enterprises
(Håndværksrådet)
Camilla Ley Valen-
tin
Queue-IT
Source: DAMVAD
Note: Some of the interview respondents were interviewed in relation to
both VC and loans and guarantees.
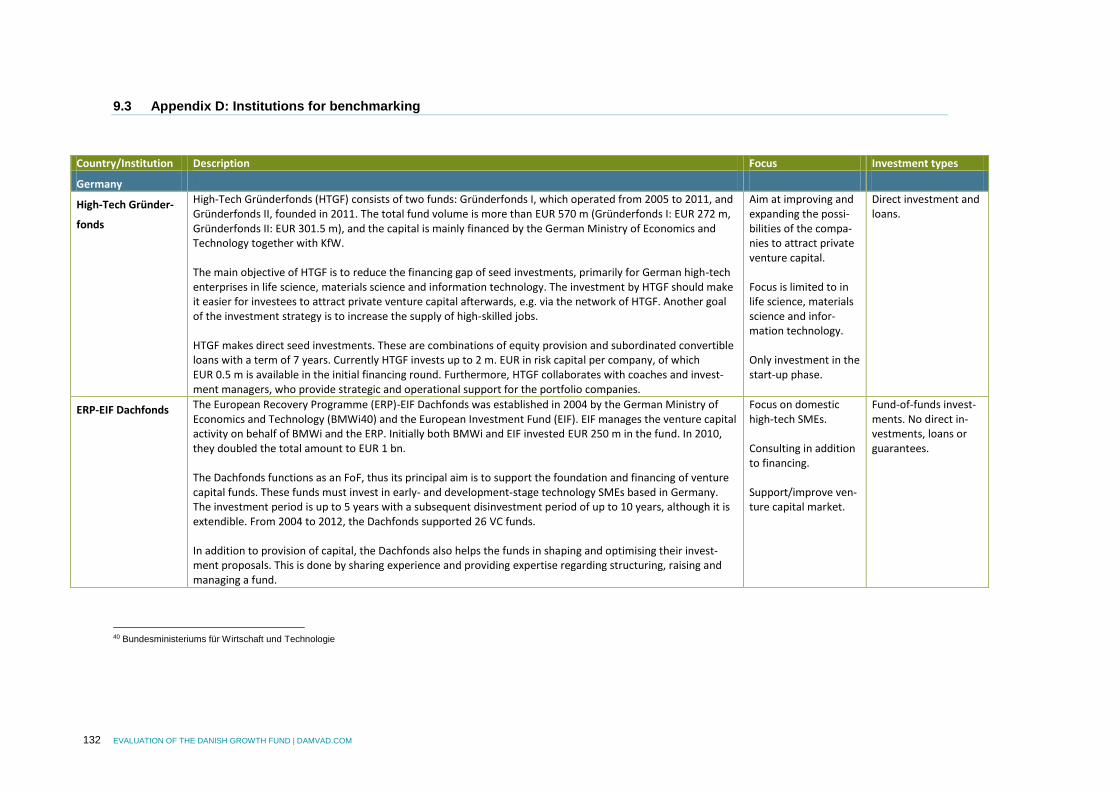
132 EVALUATION OF THE DANISH GROWTH FUND | DAMVAD.COM
9.3 Appendix D: Institutions for benchmarking
Country/Institution Description Focus Investment types
Germany
High-Tech Gründer-
fonds
High-Tech Gründerfonds (HTGF) consists of two funds: Gründerfonds I, which operated from 2005 to 2011, and Gründerfonds II, founded in 2011. The total fund volume is more than EUR 570 m (Gründerfonds I: EUR 272 m, Gründerfonds II: EUR 301.5 m), and the capital is mainly financed by the German Ministry of Economics and Technology together with KfW. The main objective of HTGF is to reduce the financing gap of seed investments, primarily for German high-tech enterprises in life science, materials science and information technology. The investment by HTGF should make it easier for investees to attract private venture capital afterwards, e.g. via the network of HTGF. Another goal of the investment strategy is to increase the supply of high-skilled jobs. HTGF makes direct seed investments. These are combinations of equity provision and subordinated convertible loans with a term of 7 years. Currently HTGF invests up to 2 m. EUR in risk capital per company, of which EUR 0.5 m is available in the initial financing round. Furthermore, HTGF collaborates with coaches and invest-ment managers, who provide strategic and operational support for the portfolio companies.
Aim at improving and expanding the possi-bilities of the compa-nies to attract private venture capital. Focus is limited to in life science, materials science and infor-mation technology. Only investment in the start-up phase.
Direct investment and loans.
ERP-EIF Dachfonds The European Recovery Programme (ERP)-EIF Dachfonds was established in 2004 by the German Ministry of Economics and Technology (BMWi40) and the European Investment Fund (EIF). EIF manages the venture capital activity on behalf of BMWi and the ERP. Initially both BMWi and EIF invested EUR 250 m in the fund. In 2010, they doubled the total amount to EUR 1 bn. The Dachfonds functions as an FoF, thus its principal aim is to support the foundation and financing of venture capital funds. These funds must invest in early- and development-stage technology SMEs based in Germany. The investment period is up to 5 years with a subsequent disinvestment period of up to 10 years, although it is extendible. From 2004 to 2012, the Dachfonds supported 26 VC funds. In addition to provision of capital, the Dachfonds also helps the funds in shaping and optimising their invest-ment proposals. This is done by sharing experience and providing expertise regarding structuring, raising and managing a fund.
Focus on domestic high-tech SMEs. Consulting in addition to financing. Support/improve ven-ture capital market.
Fund-of-funds invest-ments. No direct in-vestments, loans or guarantees.
40 Bundesministeriums für Wirtschaft und Technologie

EVALUATION OF THE DANISH GROWTH FUND | DAMVAD.COM 133
KfW Mittelstands-
bank
KfW Mittelstandsbank is part of the government-owned KfW Banking Group and was established in 2003 in the wake of the merge between KfW and DtA (Deutsche Ausgleichsbank). The objective of the Mittelstandsbank is to promote German SMEs, which are in the seed or start-up phases, including individual entrepreneurs and start-ups. To improve the financing situation for these enterprises, the Mittelstandsbank supplies both loans, guarantees, mezzanine financing, advice and fund-of-funds investments, e.g. through the ERP Start Fund and German SME Equity Fund.
Objective of promot-ing domestic SMEs. No specific focus on the development of a self-sustaining venture capital market.
Wide range of prod-ucts, including both loans, guarantees, ad-vice and fund-of-fund investment.
Sweden
Industrifonden Industrifonden was founded in 1979 by the Swedish state with a one-off payment. The fund acts on market conditions, and today the capital under management amounts to EUR 405m, of which EUR 169m have been invested. A unique feature of the fund is its “evergreen” status. This means that there is no fixed closing date. Thereby the foundation can have a long-term perspective and does not have to sell off an investment at an inappropri-ate time. Originally, Industrifonden was set up with EUR 112m EUR to support large firm exports. However, over time the mandate of the fund has changed to SMEs. The purpose of this shift was to share the risk with private sector venture capital funds and fill the funding gap. The investments are targeted SMEs in start-up and expansion phases within IT, telecom, internet/media, electronics, industry and Cleantech. Industrifonden invests in the form of equity and loans (e.g. options and convertibles). Besides, they provide technical and commercial competences.
SME focus but limited industry scope. Aims to fill the funding gap on VC markets.
Only direct invest-ments – no FoF or fund investments. Evergreen fund.
Almi Almi was founded in 1994 as an amalgamation of regional public financial institutions. In 2012 approximately 3,600 companies was provided loans worth SEK 2.1bn and Almi made 50 new investments in companies. The total portfolio includes 119 companies. A majority of the portfolio companies (95%) are start-ups or are in the early stage/expansion phase. In 2012 more than 4,500 new companies were established with some sort of help from Almi. Loans: Almi complements the market by providing risk bearing loans. Almi's role is to take slightly larger risks. To compensate for the higher risk and to avoid competing with the private market, Almi charges higher interest than the average bank rate. Almi offers corporate loans, micro-loans and financing for companies operating in international markets, as well as specifically adapted forms of financing for innovators. Credit is provided in col-laboration with other credit providers and the banks are important partners.
The overall objective of Almi is to promote the development of competitive SMEs and stimulate new enter-prise with the aim of creating growth and innovation in Swedish business.
Loans (subordinate), VC (seed and expan-sion) and Incubation.
Norway
Investinor Investinor started in 2008 as an evergreen investment company, owned and funded by the Norwegian govern-ment. The company is organised into two divisions: a Venture Team, which handles many, but smaller invest-ments and a Growth Equity Team, which encompasses few, but larger investments. In 2012, the fund managed a capital stock of NOK ??462m of which approx. NOK?? 107m were invested in portfolio companies.
No explicit SME focus. Broad industry focus.
Direct investments. No funds-of-fund or fund investments. Subordinate loans.
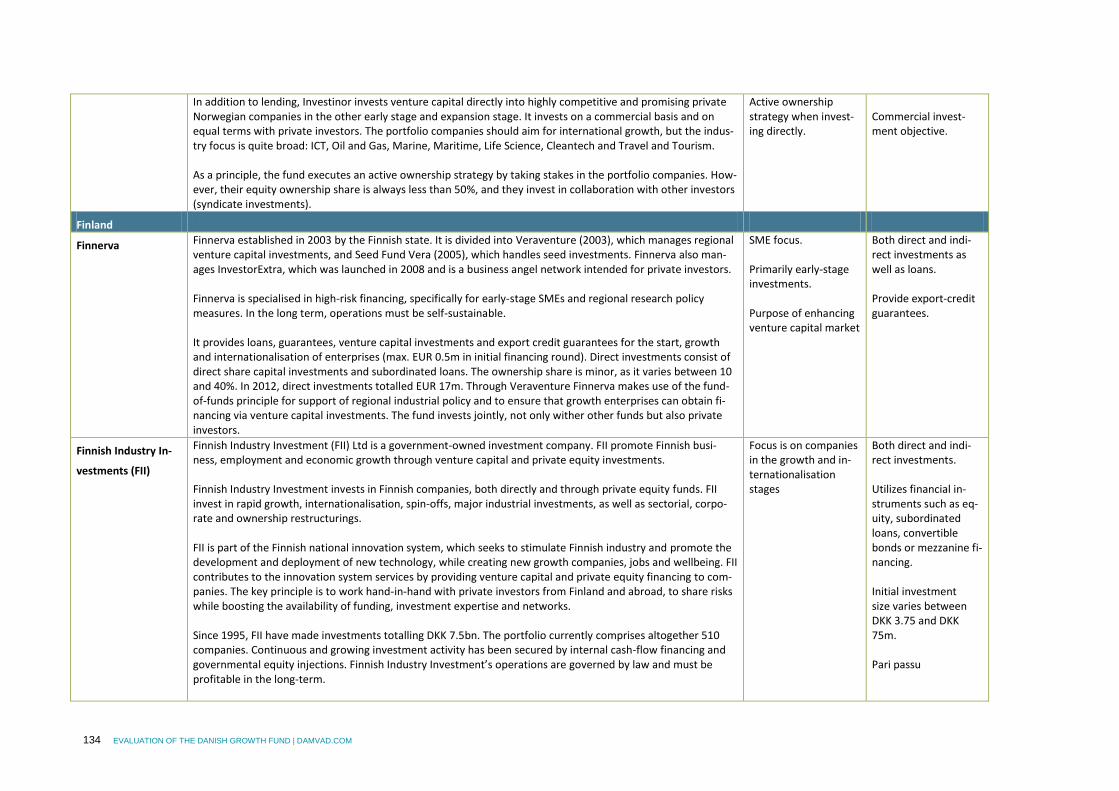
134 EVALUATION OF THE DANISH GROWTH FUND | DAMVAD.COM
In addition to lending, Investinor invests venture capital directly into highly competitive and promising private Norwegian companies in the other early stage and expansion stage. It invests on a commercial basis and on equal terms with private investors. The portfolio companies should aim for international growth, but the indus-try focus is quite broad: ICT, Oil and Gas, Marine, Maritime, Life Science, Cleantech and Travel and Tourism. As a principle, the fund executes an active ownership strategy by taking stakes in the portfolio companies. How-ever, their equity ownership share is always less than 50%, and they invest in collaboration with other investors (syndicate investments).
Active ownership strategy when invest-ing directly.
Commercial invest-ment objective.
Finland
Finnerva Finnerva established in 2003 by the Finnish state. It is divided into Veraventure (2003), which manages regional venture capital investments, and Seed Fund Vera (2005), which handles seed investments. Finnerva also man-ages InvestorExtra, which was launched in 2008 and is a business angel network intended for private investors. Finnerva is specialised in high-risk financing, specifically for early-stage SMEs and regional research policy measures. In the long term, operations must be self-sustainable. It provides loans, guarantees, venture capital investments and export credit guarantees for the start, growth and internationalisation of enterprises (max. EUR 0.5m in initial financing round). Direct investments consist of direct share capital investments and subordinated loans. The ownership share is minor, as it varies between 10 and 40%. In 2012, direct investments totalled EUR 17m. Through Veraventure Finnerva makes use of the fund-of-funds principle for support of regional industrial policy and to ensure that growth enterprises can obtain fi-nancing via venture capital investments. The fund invests jointly, not only wither other funds but also private investors.
SME focus. Primarily early-stage investments. Purpose of enhancing venture capital market
Both direct and indi-rect investments as well as loans. Provide export-credit guarantees.
Finnish Industry In-
vestments (FII)
Finnish Industry Investment (FII) Ltd is a government-owned investment company. FII promote Finnish busi-ness, employment and economic growth through venture capital and private equity investments. Finnish Industry Investment invests in Finnish companies, both directly and through private equity funds. FII invest in rapid growth, internationalisation, spin-offs, major industrial investments, as well as sectorial, corpo-rate and ownership restructurings. FII is part of the Finnish national innovation system, which seeks to stimulate Finnish industry and promote the development and deployment of new technology, while creating new growth companies, jobs and wellbeing. FII contributes to the innovation system services by providing venture capital and private equity financing to com-panies. The key principle is to work hand-in-hand with private investors from Finland and abroad, to share risks while boosting the availability of funding, investment expertise and networks. Since 1995, FII have made investments totalling DKK 7.5bn. The portfolio currently comprises altogether 510 companies. Continuous and growing investment activity has been secured by internal cash-flow financing and governmental equity injections. Finnish Industry Investment’s operations are governed by law and must be profitable in the long-term.
Focus is on companies in the growth and in-ternationalisation stages
Both direct and indi-rect investments. Utilizes financial in-struments such as eq-uity, subordinated loans, convertible bonds or mezzanine fi-nancing. Initial investment size varies between DKK 3.75 and DKK 75m. Pari passu
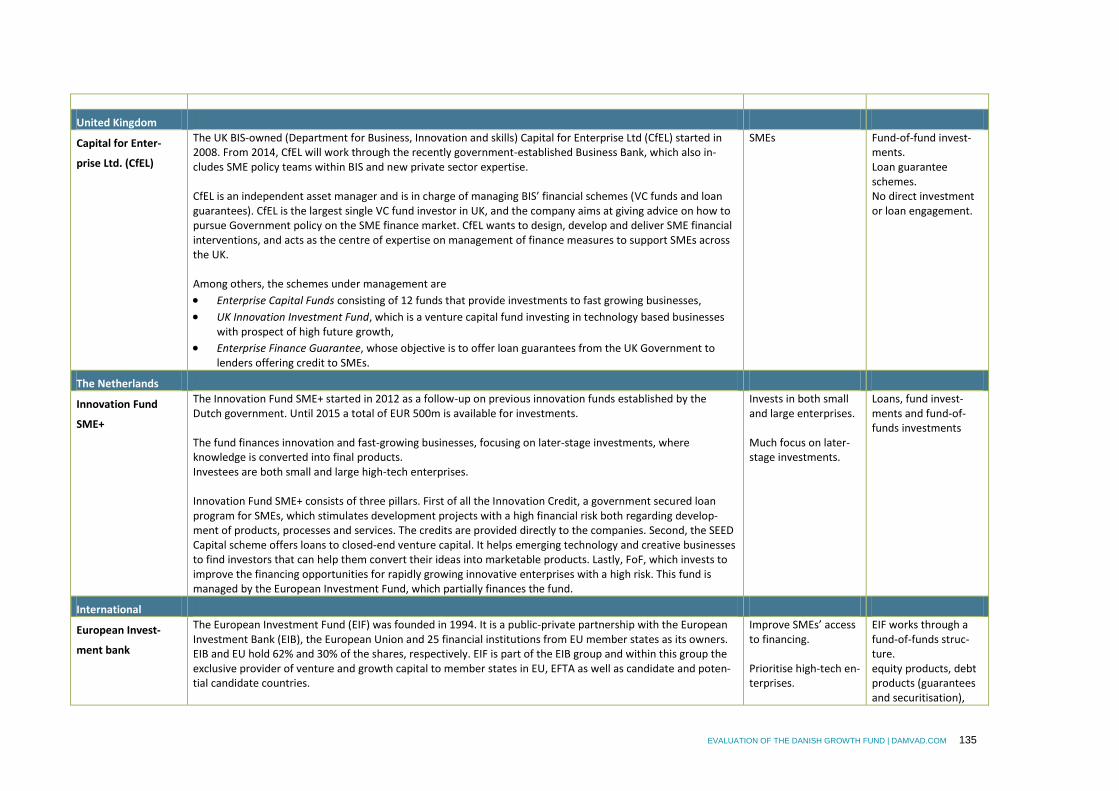
EVALUATION OF THE DANISH GROWTH FUND | DAMVAD.COM 135
United Kingdom
Capital for Enter-
prise Ltd. (CfEL)
The UK BIS-owned (Department for Business, Innovation and skills) Capital for Enterprise Ltd (CfEL) started in 2008. From 2014, CfEL will work through the recently government-established Business Bank, which also in-cludes SME policy teams within BIS and new private sector expertise. CfEL is an independent asset manager and is in charge of managing BIS’ financial schemes (VC funds and loan guarantees). CfEL is the largest single VC fund investor in UK, and the company aims at giving advice on how to pursue Government policy on the SME finance market. CfEL wants to design, develop and deliver SME financial interventions, and acts as the centre of expertise on management of finance measures to support SMEs across the UK. Among others, the schemes under management are
Enterprise Capital Funds consisting of 12 funds that provide investments to fast growing businesses,
UK Innovation Investment Fund, which is a venture capital fund investing in technology based businesses with prospect of high future growth,
Enterprise Finance Guarantee, whose objective is to offer loan guarantees from the UK Government to lenders offering credit to SMEs.
SMEs Fund-of-fund invest-ments. Loan guarantee schemes. No direct investment or loan engagement.
The Netherlands
Innovation Fund
SME+
The Innovation Fund SME+ started in 2012 as a follow-up on previous innovation funds established by the Dutch government. Until 2015 a total of EUR 500m is available for investments. The fund finances innovation and fast-growing businesses, focusing on later-stage investments, where knowledge is converted into final products. Investees are both small and large high-tech enterprises. Innovation Fund SME+ consists of three pillars. First of all the Innovation Credit, a government secured loan program for SMEs, which stimulates development projects with a high financial risk both regarding develop-ment of products, processes and services. The credits are provided directly to the companies. Second, the SEED Capital scheme offers loans to closed-end venture capital. It helps emerging technology and creative businesses to find investors that can help them convert their ideas into marketable products. Lastly, FoF, which invests to improve the financing opportunities for rapidly growing innovative enterprises with a high risk. This fund is managed by the European Investment Fund, which partially finances the fund.
Invests in both small and large enterprises. Much focus on later-stage investments.
Loans, fund invest-ments and fund-of-funds investments
International
European Invest-
ment bank
The European Investment Fund (EIF) was founded in 1994. It is a public-private partnership with the European Investment Bank (EIB), the European Union and 25 financial institutions from EU member states as its owners. EIB and EU hold 62% and 30% of the shares, respectively. EIF is part of the EIB group and within this group the exclusive provider of venture and growth capital to member states in EU, EFTA as well as candidate and poten-tial candidate countries.
Improve SMEs’ access to financing. Prioritise high-tech en-terprises.
EIF works through a fund-of-funds struc-ture. equity products, debt products (guarantees and securitisation),

136 EVALUATION OF THE DANISH GROWTH FUND | DAMVAD.COM
The focus of EIF is to support Europe’s SMEs by helping them to access finance to foster EU objectives of entre-preneurship, growth, innovation, R&D, employment and regional development. In addition, EIF should generate an appropriate return for its shareholders. It aims at investing in funds targeting early-stage enterprises, which are likely to develop or apply advanced technologies in industries and services. EIF’s expertise lies in the Life Sciences, Cleantech and ICT sectors. As indicated above, EIF acts on the fund-of-funds principle, where it takes significant minority stakes. It divides its products into four categories: equity products, debt products (guarantees and securitisation), microfinance and regional development.
Sciences, Cleantech and ICT sectors.
microfinance and re-gional development
EVALUATION OF THE DANISH GROWTH FUND | DAMVAD.COM 137
9.4 Appendix E: Survey
Methodology
To assess how companies that received funding
from the Growth Fund assess the significance of
this funding, a survey has been carried out. The sur-
vey is conducted via Enalyzer’s web-based survey
platform.
The survey respondents were identified as compa-
nies that have received indirect funding from DGF.
Direct funding is either loans, guarantees or direct
equity investments from DGF. A total of 631 compa-
nies were identified and received the questionnaire.
Subsequently, a reminder was sent out via the web-
based survey platform to companies that did not re-
spond.
In total, 103 companies (17%) completed the ques-
tionnaire.
Questionnaire
Questionnaire for companies that received funding
from DGF as either loans, guarantees or VC.
The questionnaire is adapted and translated from
the web-based version developed on the Ena-
lyzer.com platform.
Question 1.
What is the company's specific commitment in rela-
tion to DGF? (Multiple X allowed).
We received a Get Started loan (KIG loan) from
the Growth Fund through our bank
We received a guarantee from the Growth Fund
The Danish Growth Fund invested in our com-
pany
Question 2.
How does the capital injection by the Danish Growth
Fund affect the future growth potential of the com-
pany?
The capital increase has meant that the com-
pany is experiencing positive development and
has the potential to generate more jobs in the
near future
The capital increase has meant that the com-
pany is experiencing positive development and
has the potential to generate more revenues in
the near future
The capital increase has meant that the com-
pany is experiencing positive development and
has the potential to increase exports in the near
future
The respondents could choose one of the following
five options (fully agree, agree, either or, disagree,
fully disagree) or answer, “don’t know”.
Question 3.
How does DGF’s funding of the company influence
possible development in the short term? (tick one X
per sub-question).
The capital injection has meant that the com-
pany has been able to make new investments
The capital injection has meant that the com-
pany has been able to develop new technology,
products or knowledge
The capital injection has meant that the com-
pany has been able to increase the number of
employees
The capital injection has meant that the com-
pany has been able to increase productivity
The capital injection has meant that the com-
pany has been able to increase revenue
The capital injection has meant that the com-
pany has been able to increase sales to export
markets
138 EVALUATION OF THE DANISH GROWTH FUND | DAMVAD.COM
The capital injection has enabled the company
to “open” new export markets
The capital injection has enabled the company
to cover capital shortfall
The respondents could choose one of the following
five options (fully agree, agree, either or, disagree,
fully disagree) or answer, “don’t know”.
Question 4.
What effect did DGF’s capital injection have on the
company?
The company could have attracted alternative
capital/financing and realised the company in
the same form and scale without capital/funding
from the Growth Fund
The Danish Growth Fund's commitment had a
positive impact in terms of attracting other in-
vestors or providing to access other debt financ-
ing
The Danish Growth Fund's commitment was
essential for attracting investors and/or financ-
ing.
The respondents could choose one of the following
five options (fully agree, agree, either or, disagree,
fully disagree) or answer, “don’t know”.

Sørkedalsveien 10A
N-0369 Oslo
Frederik Langes Gate 20
N-9008 Tromsø
Badstuestræde 20
DK-1209 Copenhagen K