DGF 2014 Presentation
29
Copyright 2014 by Richmont Mines TSX - NYSE MKT: RIC 1 TSX – NYSE MKT: RIC www.richmont-mines.com
-
Upload
richmontminesinc2016 -
Category
Investor Relations
-
view
3.333 -
download
1
Transcript of DGF 2014 Presentation

Copyright 2014 by Richmont Mines
TSX - NYSE MKT: RIC
1
TSX – NYSE MKT: RIC ww
w.r
ich
mo
nt-
min
es.
com

Copyright 2014 by Richmont Mines
TSX - NYSE MKT: RIC
2 2
Safe harbor statement & cautionary note to U.S. investors concerning resource estimates
This presentation contains forward-looking statements that include risks and uncertainties. The factors that could cause actual results to differ materially from those indicated in such forward-looking statements include changes in the prevailing price of gold, the Canadian-U.S. exchange rate, grade of ore mined and unforeseen difficulties in mining operations that could affect revenue and production costs. Other factors such as uncertainties regarding government regulations could also affect the results. Other risks may be detailed from time to time in Richmont Mines Inc.’s periodic reports and annual notice.
The resource estimates in this presentation were prepared in accordance with Regulation 43-101 adopted by the Canadian Securities Administrators. The requirements of Regulation 43-101 differ significantly from the requirements of the United States Securities and Exchange Commission (the “SEC”). In this presentation, we use the terms “Measured”, “Indicated” and “Inferred” Resources. Although these terms are recognized and required in Canada, the SEC does not recognize them. The SEC permits U.S. mining companies, in their filings with the SEC, to disclose only those mineral deposits that constitute “Reserves”. Under United States standards, mineralization may not be classified as a Reserve unless the determination has been made that the mineralization could be economically and legally extracted at the time the determination is made. United States investors should not assume that all or any portion of a Measured or Indicated Resource will ever be converted into “Reserves”. Further, “Inferred Resources” have a great amount of uncertainty as to their existence and whether they can be mined economically or legally, and United States investors should not assume that “Inferred Resources” exist or can be legally or economically mined, or that they will ever be upgraded to a higher category.
U.S. Investors are urged to consider the disclosure in our annual report on Form 20-F, File No. 001-14598, which may be obtained from us or from the SEC’s web site: http://sec.gov/edgar.shtml.
TSX - NYSE MKT: RIC Copyright 2014 by Richmont Mines

Copyright 2014 by Richmont Mines
TSX - NYSE MKT: RIC
3
Highlights
Track Record of Sustainable Production
Gold producer since 1991, over 1.4 million ounces produced
History of organic growth through discovery and development
48,171 ounces of gold produced in the first half of 2014
75,000 - 85,000 ounce targeted gold production for 2014
Quality Asset Base
Mines in low-risk jurisdictions: Ontario and Quebec
Developing new 1.1 million ounce inferred resource below operating Island Gold mine, grade of 9.3 g/t Au
Global gold resource of over 5 million ounces
Strong Balance Sheet, Tight Capital Structure
$35.7 million of cash & term deposits, debt < $5 million, at June 30, 2014
47.6 million shares on TSX and NYSE MKT
Copyright 2014 by Richmont Mines
3 TSX - NYSE MKT: RIC

Copyright 2014 by Richmont Mines
TSX - NYSE MKT: RIC
4 TSX - NYSE MKT: RIC 4
Veteran Operator Numerous Successful Mine Openings & Closings
Copyright 2014 by Richmont Mines
1991 1993 1997 2001
2007 2013
Island Gold Mine
Francoeur Mine
Monique Mine
2001
Camflo Mill Beaufor Mine Nugget Pond Mine
2006
East Amphi Mine Hammerdown Mine
2006 – 2007 production ~ 37,350 Au ozs produced
2001 - 2004 production: ~ 143,500 Au ozs
In operation: ~303,000 Au ozs produced to date
In operation: ~ 9,900 Au ozs produced to date
In operation: ~500,000 + Au ozs produced to date
Mill in operation: Processes ore from Beaufor & Monique
1991-2001 production: ~345,000 Au ozs
1998-2001 production: ~170,000 Au ozs

Copyright 2014 by Richmont Mines
TSX - NYSE MKT: RIC
5 TSX - NYSE MKT: RIC 5
Current Operations
Island Gold Mine
2014 Production Forecast ~ 40,000 Au ozs
On-site 850 tpd mill
Copyright 2014 by Richmont Mines
Wawa Area
Val-d’Or Area
Beaufor Mine Property Monique Mine
2014 Production Forecast ~ 35,000 – 40,000 Au ozs
1,200 Tpd Camflo Mill (50 km away)
Ontario Quebec

Copyright 2014 by Richmont Mines
TSX - NYSE MKT: RIC
6
Corporate Overview
TSX - NYSE MKT: RIC 6
RIC: (Sep. 10, 2014) TSX (CAN$) NYSE MKT (US$)
Closing Price $2.48 $2.29
52-week trading range $1.00 - $3.07 $0.94 - $2.82
Market capitalization $118 million $109 million
Average 3 month daily trading volume (shares) ~ 135,000 ~ 233,900
Cash & Term Deposits (Jun 30, 2014) $35.7 million
Long-term Debt (June 30, 2014) $4.9 million
Current Enterprise Value $99 million
H1 2014 Operating Cash Flow (per share) $0.37
H1 2014 Net Free Cash Flow1 (per share) $0.12
Shares outstanding (millions) 47.6
Management and Director Ownership (%) ~11%
Number of employees (June 30, 2014) 414
Copyright 2014 by Richmont Mines
(1) Calculated as operating cash flows less capital expenditures divided by shares outstanding.

Copyright 2014 by Richmont Mines
TSX - NYSE MKT: RIC
7 TSX - NYSE MKT: RIC 7
FINANCIAL HIGHLIGHTS FY 2013 (12 mos. ended Dec. 31, 2013)
Q2 2014 (3 mos. ended June 30, 2014)
Gold sales 63,443 ozs 27,790 ozs
Average cash cost per ounce US $1,095 US $779
Average selling price per ounce US $1,378 US $1,283
Revenue $90.2 million $39 million
Operating Cash Flow $3.5 million $13.4 million
Cash & term deposits $17.6 million $35.7 million
Long-term debt $5.2 million $4.9 million
Adjusted EPS (loss)
($0.26) 1
$0.12 2
Operating cash flow per share
$0.09 $0.29
(1) FY2013 EPS is Adjusted EPS, a non-IFRS Financial Performance Measure, and excludes a non-cash write-down of the W Zone Mine assets, a write-off of deferred income and mining tax assets, a write-off of financing costs following the termination of a debt-financing agreement and severance charges. (2) Q2 2014 EPS is Adjusted EPS, a non-IFRS Financial Performance Measure, and excludes severance costs related to the departure of the President and CEO of $1.05 million ($0.98 million after-tax).
Copyright 2014 by Richmont Mines
Record Quarterly Performance Strong Revenue & Operating Cash Flow

Copyright 2014 by Richmont Mines
TSX - NYSE MKT: RIC
8
BOARD OF DIRECTORS
Greg Chamandy, Exec Chairman Co-Founder and Former CEO of Gildan Activewear
Elaine Ellingham, PGeo, MSc, MBA Previously TSX, IAMGOLD, Campbell Resources, Rio Algom
Dr. Jim Gill, BSc, MSc, PhD Founder of Aur Resources Inc.
René Marion, Eng. Former CEO AuRico Gold
Michael Pesner, CA President of Hermitage Canada Finance, previously KPMG
Directors and Management Senior Credentials in a Junior
TSX - NYSE MKT: RIC 8 Copyright 2014 by Richmont Mines
MANAGEMENT TEAM
Elaine Ellingham, P. Geo. M. Sc, MBA Interim President and CEO
Pierre Rougeau, B. Sc., M. Sc Finance Executive V. P. and CFO - Former CFO of Abitibi Consolidated
Rosaire Émond, Eng. V. P. and COO - Experience: Placer Dome and Agnico-Eagle
Daniel Adam, Geo., PhD V. P. Exploration - Experience: Selbaie Mines
Nicole Veilleux, CPA, CA Finance Director - Experience: Auditor at KPMG LLP, Norbord Industries
Jean Bastien, Eng., MBA Manager, Island Gold Mine - Experience: Cambior, Agnico-Eagle and Aurizon
Marc-André Lavergne, Eng. Manager, Beaufor & Monique mines - Experience: Cambior, Agnico-Eagle,
North American Palladium

Copyright 2014 by Richmont Mines
TSX - NYSE MKT: RIC
9 TSX - NYSE MKT: RIC 9 Copyright 2014 by Richmont Mines
Long-term Producer Experienced Operators
$0
$200
$400
$600
$800
$1,000
$1,200
$1,400
$1,600
$1,800
$2,000
0
10,000
20,000
30,000
40,000
50,000
60,000
70,000
80,000
90,000
100,000
2008 2009 2010 2011 2012 2013 H1 2014
Cas
h c
ost
/oz
(US$
)
Ou
nce
s o
f go
ld
Ounces Gold Sold Cash cost/oz (US$)
H2 2014 Forecast
Gold Production
$ 898
Copyright 2014 by Richmont Mines
TSX - NYSE MKT: RIC
10
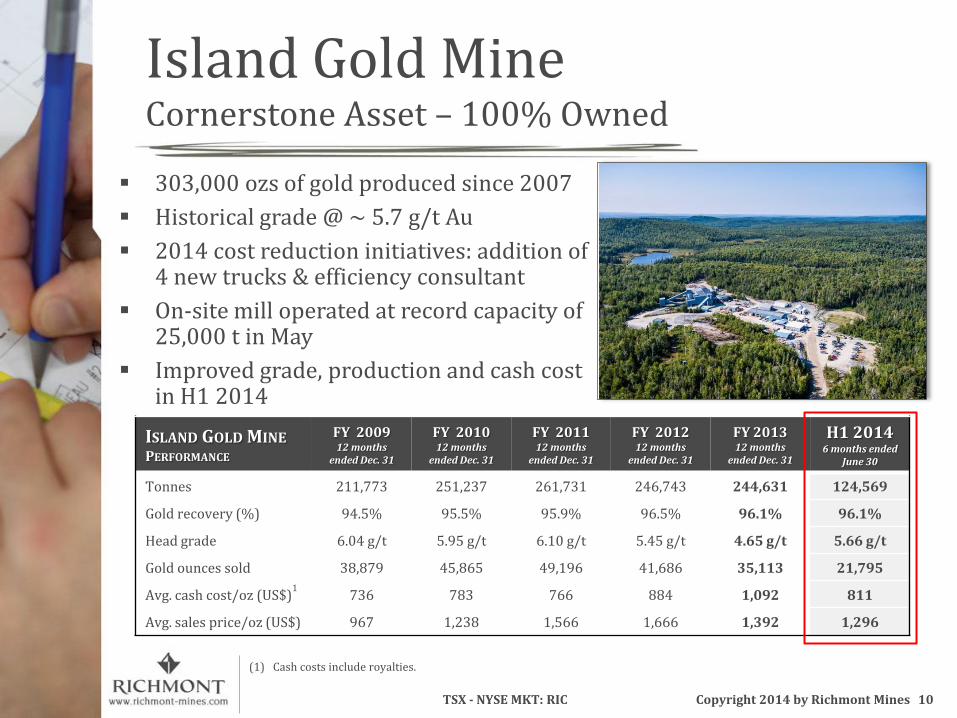
303,000 ozs of gold produced since 2007
Historical grade @ ~ 5.7 g/t Au
2014 cost reduction initiatives: addition of 4 new trucks & efficiency consultant
On-site mill operated at record capacity of 25,000 t in May
Improved grade, production and cash cost in H1 2014
Island Gold Mine Cornerstone Asset – 100% Owned
ISLAND GOLD MINE PERFORMANCE
FY 2009 12 months
ended Dec. 31
FY 2010 12 months
ended Dec. 31
FY 2011 12 months
ended Dec. 31
FY 2012 12 months
ended Dec. 31
FY 2013 12 months
ended Dec. 31
H1 2014 6 months ended
June 30
Tonnes 211,773 251,237 261,731 246,743 244,631 124,569
Gold recovery (%) 94.5% 95.5% 95.9% 96.5% 96.1% 96.1%
Head grade 6.04 g/t 5.95 g/t 6.10 g/t 5.45 g/t 4.65 g/t 5.66 g/t
Gold ounces sold 38,879 45,865 49,196 41,686 35,113 21,795
Avg. cash cost/oz (US$)1
736 783 766 884 1,092 811
Avg. sales price/oz (US$) 967 1,238 1,566 1,666 1,392 1,296
TSX - NYSE MKT: RIC 10 Copyright 2014 by Richmont Mines
(1) Cash costs include royalties.

Copyright 2014 by Richmont Mines
TSX - NYSE MKT: RIC
11
Island Gold Mine Established Base for Future Growth
11
Copyright 2014 by Richmont Mines TSX - NYSE MKT: RIC
49,196 oz
(US$) (Ounces)
841 806 766 884
1,092
811
1,104
1,275
1,566
1,666
1,392
1,296
0
500
1,000
1,500
2,000
0
10,000
20,000
30,000
40,000
50,000
60,000
2009 2010 2011 2012 2013 H1 2014
Ounces of gold sold Cash cost per ounce Selling price
H2 2014 Forecast
Gold Production

Copyright 2014 by Richmont Mines
TSX - NYSE MKT: RIC
12 TSX - NYSE MKT: RIC 12
Island Gold Mine Location Map
Lake Superior
Marathon
White River
17
25 km
Proterozoic Plutonic and Volcanic Rocks Archean Granitoid Plutons Archean Metasedimentary Terranes Archean Greenstone Terranes Fault Past Gold Producer
Gold Producer
HEMLO
ISLAND GOLD MINE
RENABIE
EDWARDS
EAGLE RIVER
MISHI
Copyright 2014 by Richmont Mines
Argonaut – Magino (~5.2 m ozs @1.03 g/t)
MAGINO

Copyright 2014 by Richmont Mines
TSX - NYSE MKT: RIC
13
Stockpiles
Stora ge
Scrap
Island Gold Mine Site Map and Infrastructure
Tailing pond
Portal Main Ramp
Mill
ISLAND GOLD MINE
Lochalsh Zone
Office Core Shack
Waste pad A
rgo
na
ut
Richmont / Argonaut 0.5 km
KREMZAR MINE 306,000 T at 4.8 g/t Au 47,000 Au ozs
MAGINO OPEN PIT (resource) ~130 MT at 1.03 g/t Au 5.2 million Au ozs
TSX - NYSE MKT: RIC 13 Copyright 2014 by Richmont Mines
Goudreau Zone
MAGINO MINE 803,000 T at 4.4 g/t Au 114,000 Au ozs

Copyright 2014 by Richmont Mines
TSX - NYSE MKT: RIC
14
Island Gold Mine Longitudinal Section
190 Level
Crown pillar
W E
- 1,000 m
- 500 m
GOUDREAU LOCHALSH ISLAND EXT1 EXT2
Island Deep 1.1 million ounce resource
Indicated 456,000 t at 11.52 g Au/t 169,000 ozs Inferred 3,200,000 t at 9.29 g Au/t 955,000 ozs
Open
Open
Production to Date (above 400 m)
303,000 ozs of gold, avg. 5.7 g/t Au Reserves & Resources
Proven & Probable: 143,506 ozs @ 6.09 g/t Measured & Indicated: 64,433 ozs @ 7.06 g/t Inferred resources: 82,744 ozs @ 7.09 g/t
• Open along strike in both directions and at depth • Significant number of > 12 g Au/t intersections
Open
TSX - NYSE MKT: RIC 14 Copyright 2014 by Richmont Mines
Drillhole Intersections > 12g/t Au (cut 95g minimum 2 m true width)
Drillhole Intersections
Reserves / Resources
Mined Out
Actual Ramp and Drifts
Interpreted Axis of Plunge

Copyright 2014 by Richmont Mines
TSX - NYSE MKT: RIC
15
Island Gold Mine Metal factor (grade x width)
Crown pillar
W E
- 1,000 m
- 500 m
LOCHALSH ISLAND EXT1 EXT2
Cut off (3.75 g/t Au / 2.0 m)
Interpreted Axis of Plunge
327
30
20
10
5
0
TSX - NYSE MKT: RIC 15 Copyright 2014 by Richmont Mines
Metal Factor Grade (g Au/t) x true width (metres)
Average mining grade (5.84 g/t Au / 2.4 m)

Copyright 2014 by Richmont Mines
TSX - NYSE MKT: RIC
16
Island Gold Mine Comparison with Major Gold Mines
HEMLO Ontario
LA RONDE Quebec
Williams Golden Giant
David Bell
3 km
Penna LaRonde 2
LaRonde 4
LaRonde 1 #1 Shaft #3 Shaft Reid
#2 Shaft
ISLAND GOLD MINE
Island Ramp
1
km 2 km
RED LAKE Ontario
303,000 Au ozs produced
Schematic Longitudinal Sections
Agnico Eagle Barrick Gold Corp. Goldcorp Richmont
1.1 million oz resource
TSX - NYSE MKT: RIC 16 Copyright 2014 by Richmont Mines

Copyright 2014 by Richmont Mines
TSX - NYSE MKT: RIC
17
1.1 million ounce inferred resource immediately below fully permitted, staffed and producing Island Gold Mine
Ramp exposed mineralization at 560 m level at depth along 92 m:
Face chip sampling averaged 12.7 g Au/t over 2.92 m
Opportunity for long life mine with higher annual production levels
Capacity of on-site CIP mill can be increased
Deposit open at depth and along strike in both directions
Island Gold Discovery A “Game-Changer”
TSX - NYSE MKT: RIC 17 Copyright 2014 by Richmont Mines
New Zone Upper Mine
Gold grade (average) 9.3 g/t Au 5.7 g/t Au
Zone width (average) 4.5 metres 2.7 metres
Structural Alteration Corridor 100 m 50 m

Copyright 2014 by Richmont Mines
TSX - NYSE MKT: RIC
18 TSX - NYSE MKT: RIC 18
2013 Development at Island Gold:
Ramp to Island Deep at a vertical depth of 574 m at year-end 2013
62,210 m of exploration drilling completed
Added 615,338 ounces to gold resources
2014 Development:
$16.3 million capex
11,000 m exploration drilling + 23,000 m definition drilling
Ramp extended to 620 m vertical depth as of June 30, 2014
Development on 5 levels (depths of 535, 560, 585, 610 & 635 metres)
Expect to mine first stope in extension in the second half of this year
Near-term incremental ramping is relatively low capex and can be funded from current cash position
Copyright 2014 by Richmont Mines
Island Gold Mine Progress Report

Copyright 2014 by Richmont Mines
TSX - NYSE MKT: RIC
19 TSX - NYSE MKT: RIC 19 Copyright 2014 by Richmont Mines
Beaufor Mine Produced over 500,000 oz Gold
High-grade underground mine in production since 1996 Strategically located near infrastructure…
50 km from Camflo Mill
and central to a well established mining hub... 25 km from Val-d’Or, Quebec
H1 2014
Head grade 7.14 g/t Cash operating cost per ounce US$854
Camflo Mill
Cost reductions achieved by increasing room & pillar mining and reducing long-hole stoping

Copyright 2014 by Richmont Mines
TSX - NYSE MKT: RIC
20
Beaufor Mine Progress Report
49,196 oz
49,196 oz 41,686 oz
2014 Objectives:
Maintain operating efficiency to generate cash flow
Continue to extend mine life
Begin mining the newly developed “M Zone” where grade expectations are good
Commence development drift to the near surface 350 zone
Evaluate potential of deep Q Zone
Includes:
21,500 m of exploration drilling
10,000 m of definition drilling
TSX - NYSE MKT: RIC 20 Copyright 2014 by Richmont Mines
Mining and Development Exploration

Copyright 2014 by Richmont Mines
TSX - NYSE MKT: RIC
21
800
600
400
800
1000
200
600
1175
1350
400
RIC
HM
ON
T
Glo
be
x
Horne-Creek fault
Resources as of December 31, 2012 Cut-off: 1.5 g/t Au
Measured & Indicated Resources: 15,251,529 T at 2.86 g/t Au ; 1,402,263 ozs
Inferred Resources: 18,758,786 T at 2.66 g/t Au ; 1,605,388 ozs
Wasamac Gold Property “Untapped” 3 Million oz Resource
Near infrastructure: 15 km west of Rouyn-Noranda, Quebec
Past production of 252,923 Au ozs @ 4.16 g/t (1965-1971)
Preliminary Economic Assessment completed in March 2012
Good optionality on gold price
100% owned, no royalties
TSX - NYSE MKT: RIC 21 Copyright 2014 by Richmont Mines
Copyright 2014 by Richmont Mines
TSX - NYSE MKT: RIC
22 TSX - NYSE MKT: RIC 22
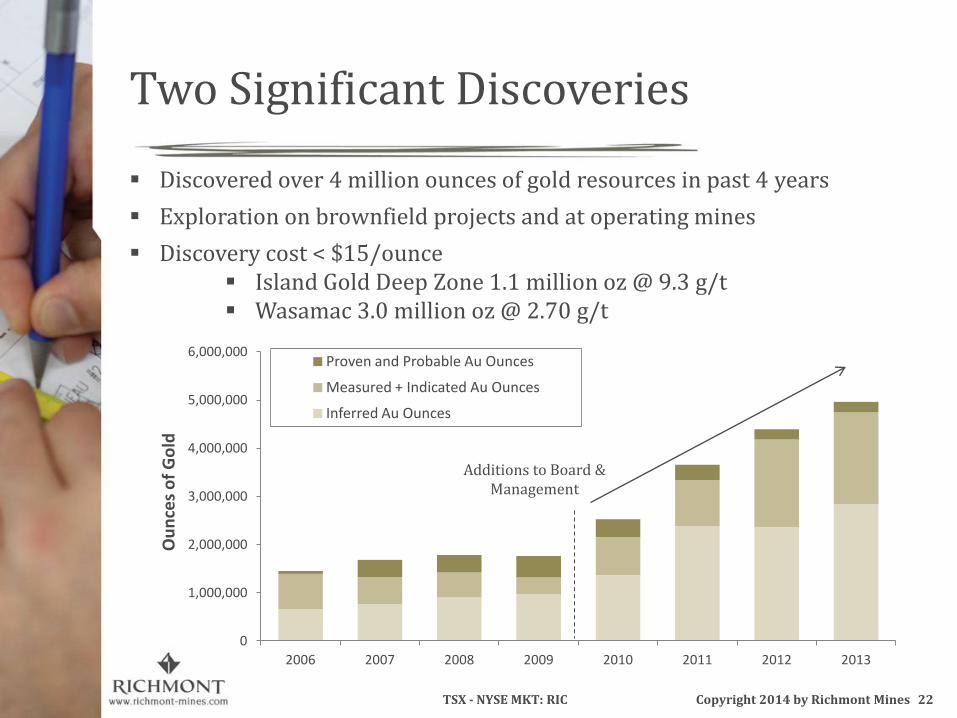
Two Significant Discoveries
Copyright 2014 by Richmont Mines
0
1,000,000
2,000,000
3,000,000
4,000,000
5,000,000
6,000,000
2006 2007 2008 2009 2010 2011 2012 2013
Ou
nce
s o
f G
old
Proven and Probable Au Ounces
Measured + Indicated Au Ounces
Inferred Au Ounces
Discovered over 4 million ounces of gold resources in past 4 years
Exploration on brownfield projects and at operating mines
Discovery cost < $15/ounce Island Gold Deep Zone 1.1 million oz @ 9.3 g/t Wasamac 3.0 million oz @ 2.70 g/t
Additions to Board & Management

Copyright 2014 by Richmont Mines
TSX - NYSE MKT: RIC
23
Relative Grade Among Highest Grades in Peer Group
TSX - NYSE MKT: RIC 23 Copyright 2014 by Richmont Mines
(1) Source: Company reports
0 2 4 6 8 10 12 14 16 18 20
Holloway Mine (St. Andrew Goldfields)
Timmins West Mine (Lakeshore)
Bell Creek Mine (Lakeshore)
Casa Berardi (Hecla)
Seabee Gold (Claude)
Rice Lake Mine (San Gold)
Lapa (Agnico Eagle)
Island Gold (Richmont)
Beaufor Mine (Richmont)
Eagle River (Wesdome)
Island Deep (Richmont)*
Macassa (Kirkland Lake)
Reserve Grade1 (g/t gold)
* Indicated Resource

Copyright 2014 by Richmont Mines
TSX - NYSE MKT: RIC
24 TSX - NYSE MKT: RIC 24
Island Gold – Important New Discovery Will lead to expansion of the producing Island Gold Mine Potential to develop into a higher-grade, long-life asset
Sound Balance Sheet, Tight Capital Structure $35.7 million cash & term deposits at June 30, 2014 47.6 million shares outstanding
Track Record of Success Consistent operating history plus continued organic growth Over 1.4 million ounces of gold produced since 1991
Quality Asset Base Targeted production of 75,000 – 85,000 ounces of gold for 2014 Global gold resource of over 5 million ounces in very stable jurisdictions
Richmont Mines Well Positioned for Growth
Copyright 2014 by Richmont Mines

Copyright 2014 by Richmont Mines
TSX - NYSE MKT: RIC
25 TSX - NYSE MKT: RIC 25
Elaine Ellingham Interim President & CEO [email protected] 416-473-5351 Jennifer Aitken Manager, Investor Relations [email protected] 514-397-1410 x101
Copyright 2014 by Richmont Mines
Richmont Mines Inc.

Copyright 2014 by Richmont Mines
TSX - NYSE MKT: RIC
26 TSX - NYSE MKT: RIC 26
Appendices
Copyright 2014 by Richmont Mines

Copyright 2014 by Richmont Mines
TSX - NYSE MKT: RIC
27
Financial Review
Key Metric (in CAN$ thousands, ex. per share data and where noted)
FY 2012 (12 mos. ended Dec. 31)
FY 2013 (12 mos. ended Dec. 31)
Q1 2014 (3 mos. ended Mar. 31)
Q2 2014 (3 mos. ended June 30)
Gold sales (ounces) 60,741 63,443 20,412 27,790
Average selling price (US$/oz) $1,666 $1,378 $1,306 $1,283
Average cash cost (US$/oz) $1,044 $1,095 $1,060 $779
Net earnings (loss) ($2,977) ($33,162) ($1,903) $4,676
Adjusted net earnings (loss) ($1,521) 1 ($10,341) 2 ($1,903) $5,659 3
Adjusted EPS ($0.04) 1 ($0.26) 2 ($0.05) $0.12 3
Operating Cash Flow $7,656 $3,456 $2,379 $13,371
Total Assets 148,244 123,328 121,272 139,135
Shareholders Equity 118,363 86,353 84,779 100,739
(1)FY2012 Adjusted Net Loss is a non-IFRS Financial Performance Measure. This number excludes a $49,066 ($42,038 after-tax) loss from the discontinued Francoeur Mine operation, and the payment of $1,986 ($1,456 after-tax) of severance compensation to the Corporation’s ex-President and CEO. (2)FY2013 Adjusted net loss is a non-IFRS Financial Performance Measure. This number excludes a $1,098 loss from the discontinued Francoeur Mine operation, a write-down of the W Zone Mine of $13,472, a write-off of deferred income and mining tax assets of $7,484, a write-off of financing costs of $1,165 and severance costs of $700. (3)Q2 2014 Adjusted net earnings is a non-IFRS Financial Performance Measure. This number excludes a $1,050 severance cost related to the departure of the President and CEO.
TSX - NYSE MKT: RIC 27 Copyright 2014 by Richmont Mines

Copyright 2014 by Richmont Mines
TSX - NYSE MKT: RIC
28
49,196 oz
(1) Resources are exclusive of Reserves, and do not have demonstrated economic viability at this time. (2) Established on Dec. 31/13, using a gold price of US$1,225/oz and an exchange rate of CAN$1.06=US$1.00 in 2013 (a US$1,450/oz gold price and a 1.00 exchange rate were used in 2012). Island Gold Deep Resources established Jan. 21/14. (3) Open-pit Reserves are based on a pit design established in 2012. Indicated Resources are underground, directly beneath the open-pit. (4) Underground Resources established as of Dec. 31/12. (5) Francoeur Mine closed in November 2012.
RESERVES + RESOURCES1
AS OF DEC. 31, 2013 AS OF DEC. 31, 2012
Tonnes (metric)
Grade (g/t Au)
Au oz contained
Tonnes (metric)
Grade (g/t Au)
Au oz contained
Island Gold Mine2
P & P Reserves 733,347 6.09 143,506 785,221 5.60 141,456
M & I Resources 283,687 7.06 64,433 502,910 6.86 110,958
Inferred Resources 362,858 7.09 82,744 279,569 6.20 55,744
Island Deep2 Indicated Resources 456,013 11.52 168,897 - - -
Inferred Resources 3,196,114 9.29 954,583 1,473,658 10.73 508,142
Beaufor Mine2
P & P Reserves 142,299 6.81 31,133 196,145 6.20 39,114
M & I Resources 765,144 6.32 155,439 774,280 6.44 160,263
Inferred Resources 904,249 6.49 188,679 901,568 6.46 187,274
Monique2,3
P & P Reserves 415,860 2.30 30,702 - - -
Indicated Resources 107,531 4.88 16,858 728,164 2.35 55,112
Inferred Resources - - 11,605 0.97 362
W Zone
P & P Reserves 70,207 5.68 12,832 132,251 7.21 30,680
M & I Resources 145,931 7.04 33,051 107,511 6.76 23,377
Inferred Resources 2,186 7.55 531 5,589 7.95 1,429
Francoeur5
Proven Reserves - - - 8,439 4.52 1,226
M & I Resources 320,066 6.47 66,587 320,066 6.47 66,587
Inferred Resources 17,949 7.17 4,135 17,949 7.17 4,135
Wasamac4 M & I Resources 15,251,529 2.86 1,402,263 15,251,529 2.86 1,402,263
Inferred Resources 18,758,786 2.66 1,605,388 18,758,786 2.66 1,605,388
TOTAL GOLD
P & P Reserves 1,361,713 4.98 218,172 1,122,056 5.89 212,476
M & I Resources 17,329,901 3.42 1,907,528 17,684,460 3.20 1,818,560
Inferred Resources 23,242,142 3.80 2,836,060 21,448,724 3.43 2,362,474
28
Copyright 2014 by Richmont Mines
TSX - NYSE MKT: RIC
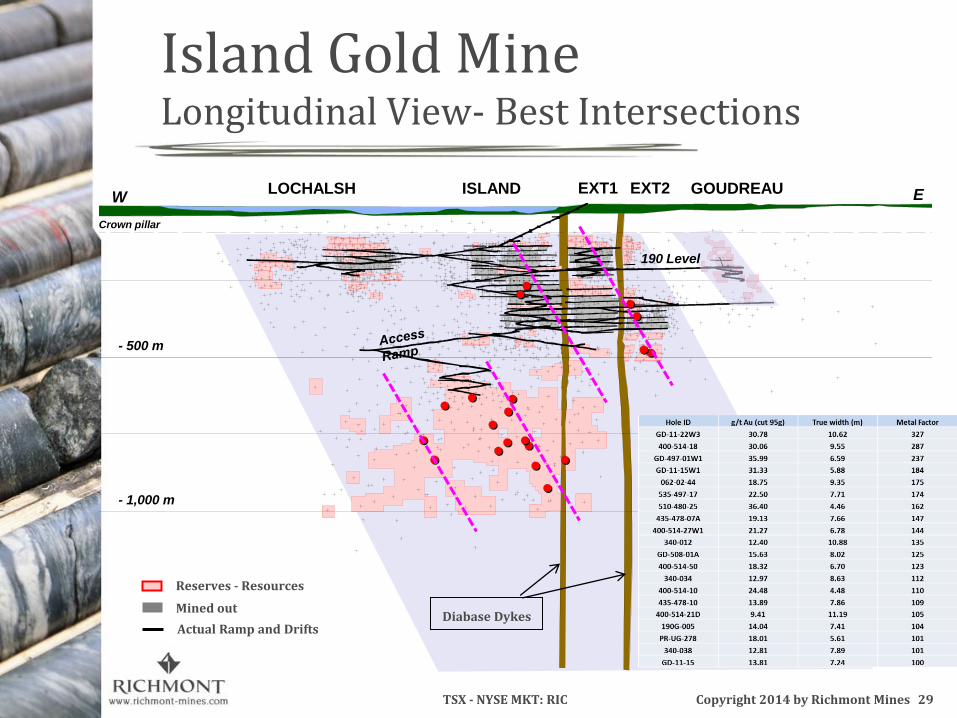
29
Island Gold Mine Longitudinal View- Best Intersections
190 Level
Crown pillar
W E
- 1,000 m
- 500 m
GOUDREAU LOCHALSH ISLAND EXT1 EXT2
Mined out
Reserves - Resources
Actual Ramp and Drifts
TSX - NYSE MKT: RIC 29 Copyright 2014 by Richmont Mines
Diabase Dykes