DFW INDUSTRIAL MARKET BRIEF 3Q2016 · DFW INDUSTRIAL MARKET BRIEF 3Q2016. DFW INDUSTRIAL MARKET...
15
DFW INDUSTRIAL MARKET BRIEF 3Q2016
Transcript of DFW INDUSTRIAL MARKET BRIEF 3Q2016 · DFW INDUSTRIAL MARKET BRIEF 3Q2016. DFW INDUSTRIAL MARKET...
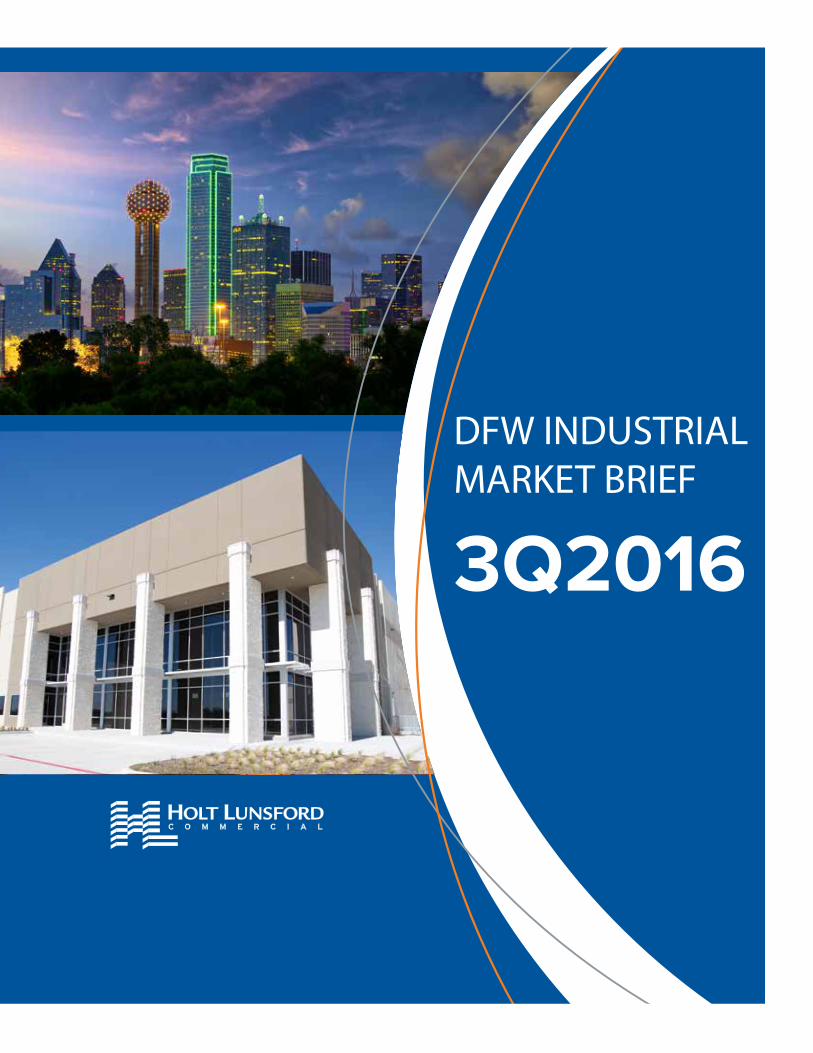
DFW INDUSTRIAL MARKET BRIEF
3Q2016
DFW INDUSTRIAL MARKET BRIEF 3Q 2016
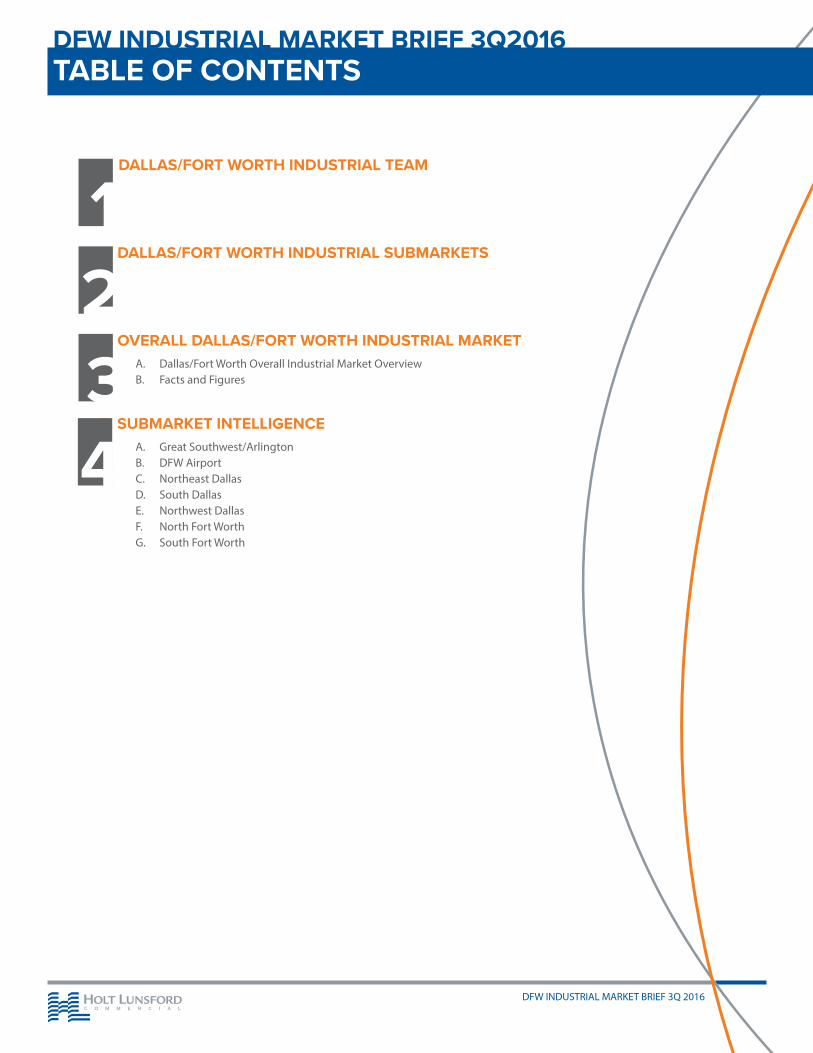
DFW INDUSTRIAL MARKET BRIEF 3Q2016TABLE OF CONTENTS
1. DALLAS/FORT WORTH INDUSTRIAL TEAM
2. DALLAS/FORT WORTH INDUSTRIAL SUBMARKETS
2. OVERALL DALLAS/FORT WORTH INDUSTRIAL MARKET A. Dallas/Fort Worth Overall Industrial Market Overview B. Facts and Figures
3. SUBMARKET INTELLIGENCE A. Great Southwest/Arlington B. DFW Airport C. Northeast Dallas D. South Dallas E. Northwest Dallas F. North Fort Worth G. South Fort Worth
1234
DFW INDUSTRIAL MARKET BRIEF 3Q 20161
HLC INDUSTRIAL DALLAS/FORT WORTHTEAM
JIM BRICEPartner - Texas Leasing
[email protected] 972.280.8328
MATT CARTHEYPartner
[email protected] 817.710.1111
CANON SHOULTSManaging Principal
[email protected] 972.280.8328
JOHN GORMANPrincipal
[email protected] 214.920.9800
DONNIE RHODEMarketing Director
[email protected] 817.710.7058
J. SCOTT MOOREMarketing Director
[email protected] 972.381.3201
JOSHUA BARNESMarketing Director
[email protected] 972.280.8353
ANDREW GILBERTMarketing [email protected]
972.381.8312
CLAY BALCHMarketing [email protected]
972.421.1956
CHANCE OLINMarketing Director
[email protected] 817.710.1112
JAKE NEALMarketing Associate
[email protected] 817.284.5555
THOMAS GRAFTONMarketing Associate
[email protected] 817.632.6152
BEN WALLACEMarketing Analyst
[email protected] 972.421.1966
VICTORIA JOHNSONSenior Marketing Coordinator
[email protected] 972.280.8305
GEORGE JENNINGSMarketing Associate
[email protected] 817.632.6151
MATT MCWILLIAMSMarketing Associate
[email protected] 972.280.8325
GRANT WHITTLEMarketing Associate
[email protected] 972.381.3219
DFW INDUSTRIAL MARKET BRIEF 3Q 2016 2
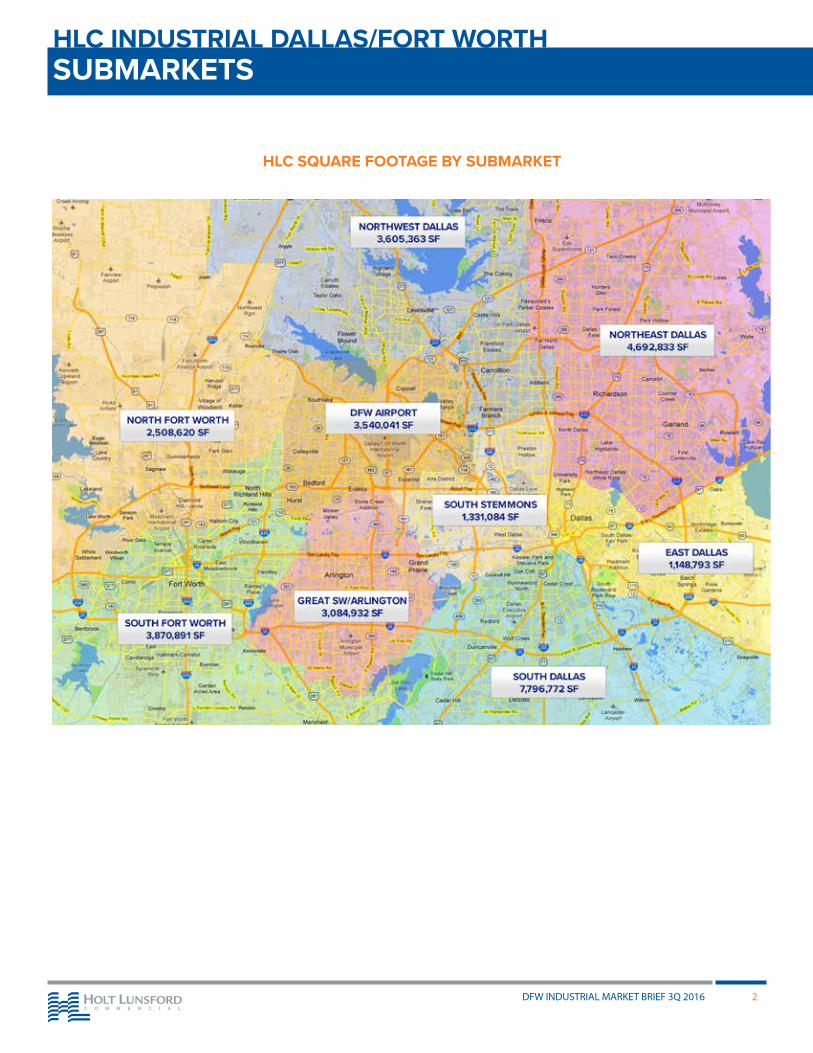
HLC INDUSTRIAL DALLAS/FORT WORTHSUBMARKETS
HLC SQUARE FOOTAGE BY SUBMARKET
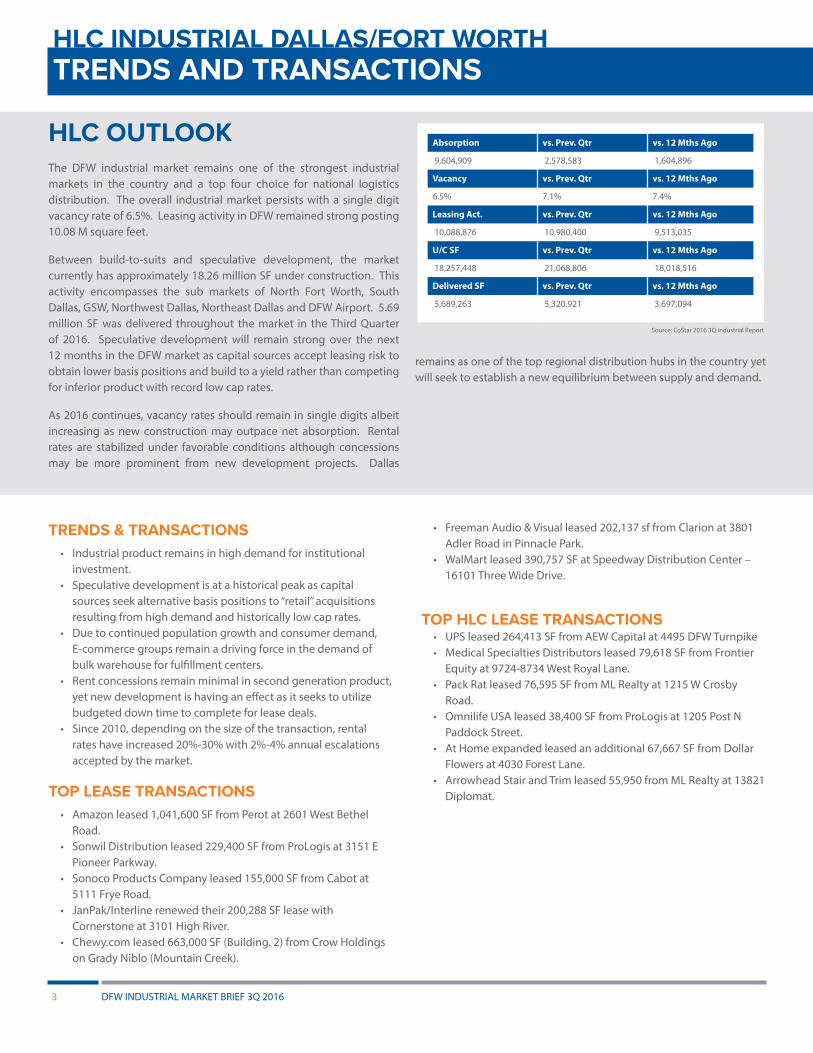
HLC OUTLOOK The DFW industrial market remains one of the strongest industrial markets in the country and a top four choice for national logistics distribution. The overall industrial market persists with a single digit vacancy rate of 6.5%. Leasing activity in DFW remained strong posting 10.08 M square feet.
Between build-to-suits and speculative development, the market currently has approximately 18.26 million SF under construction. This activity encompasses the sub markets of North Fort Worth, South Dallas, GSW, Northwest Dallas, Northeast Dallas and DFW Airport. 5.69 million SF was delivered throughout the market in the Third Quarter of 2016. Speculative development will remain strong over the next 12 months in the DFW market as capital sources accept leasing risk to obtain lower basis positions and build to a yield rather than competing for inferior product with record low cap rates.
As 2016 continues, vacancy rates should remain in single digits albeit increasing as new construction may outpace net absorption. Rental rates are stabilized under favorable conditions although concessions may be more prominent from new development projects. Dallas
remains as one of the top regional distribution hubs in the country yet will seek to establish a new equilibrium between supply and demand.
Absorption vs. Prev. Qtr vs. 12 Mths Ago
9,604,909 2,578,583 1,604,896
Vacancy vs. Prev. Qtr vs. 12 Mths Ago
6.5% 7.1% 7.4%
Leasing Act. vs. Prev. Qtr vs. 12 Mths Ago
10,088,876 10,980,400 9,513,035
U/C SF vs. Prev. Qtr vs. 12 Mths Ago
18,257,448 21,068,806 18,018,516
Delivered SF vs. Prev. Qtr vs. 12 Mths Ago
5,689,263 5,320,921 3,697,094
Source: CoStar 2016 3Q Industrial Report
TRENDS & TRANSACTIONS• Industrial product remains in high demand for institutional
investment.• Speculative development is at a historical peak as capital
sources seek alternative basis positions to “retail” acquisitions resulting from high demand and historically low cap rates.
• Due to continued population growth and consumer demand, E-commerce groups remain a driving force in the demand of bulk warehouse for fulfillment centers.
• Rent concessions remain minimal in second generation product, yet new development is having an effect as it seeks to utilize budgeted down time to complete for lease deals.
• Since 2010, depending on the size of the transaction, rental rates have increased 20%-30% with 2%-4% annual escalations accepted by the market.
TOP LEASE TRANSACTIONS• Amazon leased 1,041,600 SF from Perot at 2601 West Bethel
Road.• Sonwil Distribution leased 229,400 SF from ProLogis at 3151 E
Pioneer Parkway.• Sonoco Products Company leased 155,000 SF from Cabot at
5111 Frye Road.• JanPak/Interline renewed their 200,288 SF lease with
Cornerstone at 3101 High River.• Chewy.com leased 663,000 SF (Building. 2) from Crow Holdings
on Grady Niblo (Mountain Creek).
• Freeman Audio & Visual leased 202,137 sf from Clarion at 3801 Adler Road in Pinnacle Park.
• WalMart leased 390,757 SF at Speedway Distribution Center – 16101 Three Wide Drive.
TOP HLC LEASE TRANSACTIONS• UPS leased 264,413 SF from AEW Capital at 4495 DFW Turnpike• Medical Specialties Distributors leased 79,618 SF from Frontier
Equity at 9724-8734 West Royal Lane.• Pack Rat leased 76,595 SF from ML Realty at 1215 W Crosby
Road.• Omnilife USA leased 38,400 SF from ProLogis at 1205 Post N
Paddock Street.• At Home expanded leased an additional 67,667 SF from Dollar
Flowers at 4030 Forest Lane.• Arrowhead Stair and Trim leased 55,950 from ML Realty at 13821
Diplomat.
HLC INDUSTRIAL DALLAS/FORT WORTHTRENDS AND TRANSACTIONS
DFW INDUSTRIAL MARKET BRIEF 3Q 20163
DFW INDUSTRIAL MARKET BRIEF 3Q 2016 4
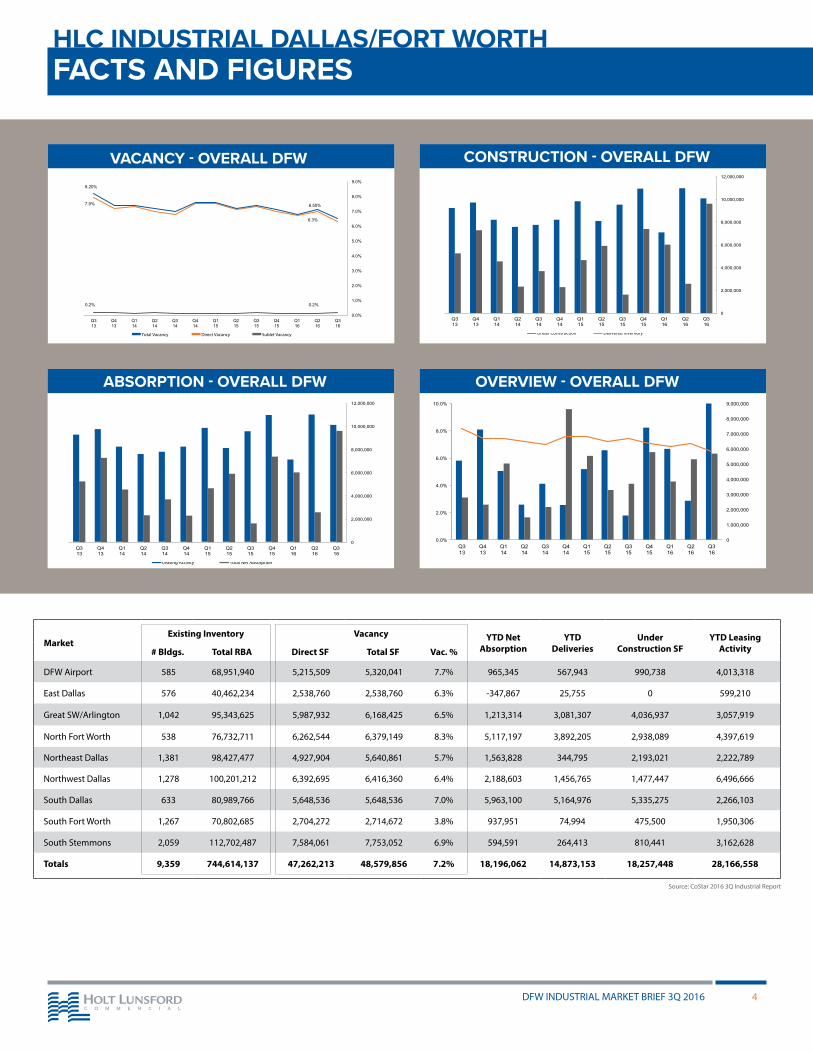
HLC INDUSTRIAL DALLAS/FORT WORTHFACTS AND FIGURES
MarketExisting Inventory Vacancy YTD Net
AbsorptionYTD
DeliveriesUnder
Construction SFYTD Leasing
Activity# Bldgs. Total RBA Direct SF Total SF Vac. %
DFW Airport 585 68,951,940 5,215,509 5,320,041 7.7% 965,345 567,943 990,738 4,013,318
East Dallas 576 40,462,234 2,538,760 2,538,760 6.3% -347,867 25,755 0 599,210
Great SW/Arlington 1,042 95,343,625 5,987,932 6,168,425 6.5% 1,213,314 3,081,307 4,036,937 3,057,919
North Fort Worth 538 76,732,711 6,262,544 6,379,149 8.3% 5,117,197 3,892,205 2,938,089 4,397,619
Northeast Dallas 1,381 98,427,477 4,927,904 5,640,861 5.7% 1,563,828 344,795 2,193,021 2,222,789
Northwest Dallas 1,278 100,201,212 6,392,695 6,416,360 6.4% 2,188,603 1,456,765 1,477,447 6,496,666
South Dallas 633 80,989,766 5,648,536 5,648,536 7.0% 5,963,100 5,164,976 5,335,275 2,266,103
South Fort Worth 1,267 70,802,685 2,704,272 2,714,672 3.8% 937,951 74,994 475,500 1,950,306
South Stemmons 2,059 112,702,487 7,584,061 7,753,052 6.9% 594,591 264,413 810,441 3,162,628
Totals 9,359 744,614,137 47,262,213 48,579,856 7.2% 18,196,062 14,873,153 18,257,448 28,166,558
6.3%
7.9%
0.2% 0.2%
6.50%
8.20%
0.0%
1.0%
2.0%
3.0%
4.0%
5.0%
6.0%
7.0%
8.0%
9.0%
Q3 16
Q2 16
Q1 16
Q4 15
Q3 15
Q2 15
Q1 15
Q4 14
Q3 14
Q2 14
Q1 14
Q4 13
Q3 13
Total Vacancy Direct Vacancy Sublet Vacancy
VACANCY - OVERALL DFW
Under Construction Delivered Inventory
0
2,000,000
4,000,000
6,000,000
8,000,000
10,000,000
12,000,000
Q3 16
Q2 16
Q1 16
Q4 15
Q3 15
Q2 15
Q1 15
Q4 14
Q3 14
Q2 14
Q1 14
Q4 13
Q3 13
CONSTRUCTION - OVERALL DFW
Leasing Activity Total Net Absorption
0
2,000,000
4,000,000
6,000,000
8,000,000
10,000,000
12,000,000
Q3 16
Q2 16
Q1 16
Q4 15
Q3 15
Q2 15
Q1 15
Q4 14
Q3 14
Q2 14
Q1 14
Q4 13
Q3 13
ABSORPTION - OVERALL DFW
Absorption Vacancy Deliveries
0.0%
2.0%
4.0%
6.0%
8.0%
10.0%
0
1,000,000
2,000,000
3,000,000
4,000,000
5,000,000
6,000,000
7,000,000
8,000,000
9,000,000
Q3 13
Q4 13
Q1 14
Q2 14
Q3 14
Q4 14
Q1 15
Q2 15
Q3 15
Q4 15
Q1 16
Q2 16
Q3 16
OVERVIEW - OVERALL DFW
Source: CoStar 2016 3Q Industrial Report
SUBMARKET INTELLIGENCE GREAT SOUTHWEST/ARLINGTON
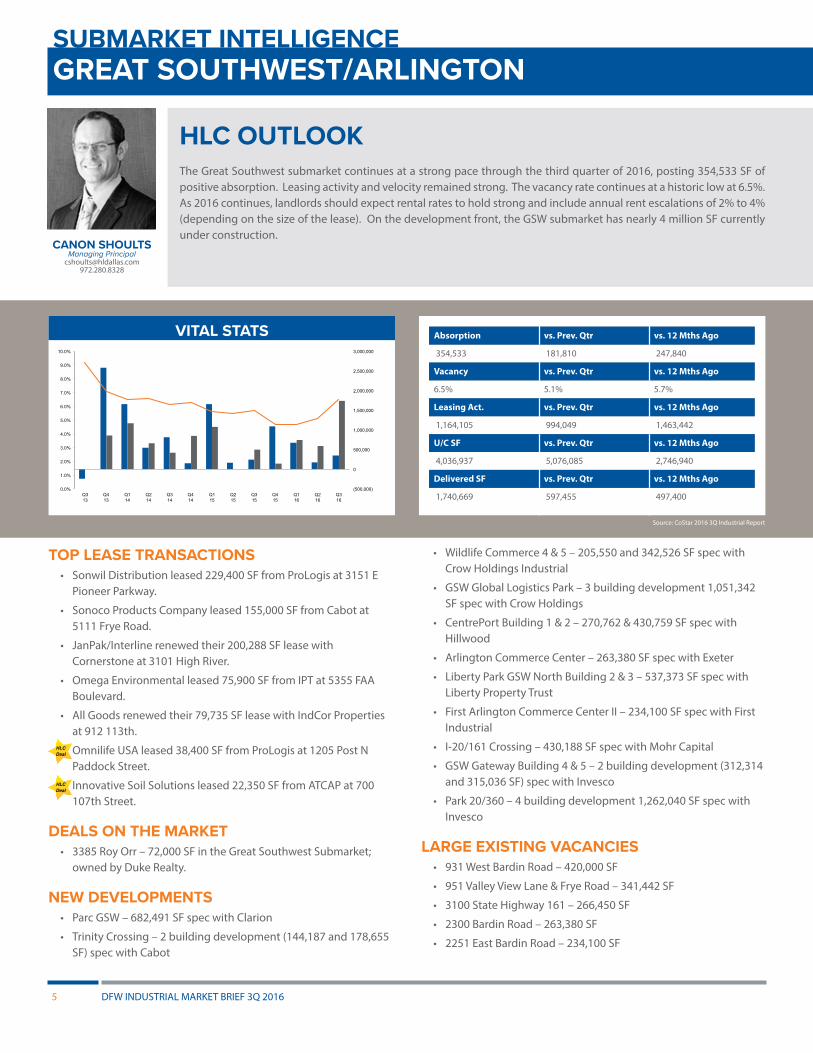
HLC OUTLOOK The Great Southwest submarket continues at a strong pace through the third quarter of 2016, posting 354,533 SF of positive absorption. Leasing activity and velocity remained strong. The vacancy rate continues at a historic low at 6.5%. As 2016 continues, landlords should expect rental rates to hold strong and include annual rent escalations of 2% to 4% (depending on the size of the lease). On the development front, the GSW submarket has nearly 4 million SF currently under construction.
CANON SHOULTSManaging Principal
[email protected] 972.280.8328
Absorption vs. Prev. Qtr vs. 12 Mths Ago
354,533 181,810 247,840
Vacancy vs. Prev. Qtr vs. 12 Mths Ago
6.5% 5.1% 5.7%
Leasing Act. vs. Prev. Qtr vs. 12 Mths Ago
1,164,105 994,049 1,463,442
U/C SF vs. Prev. Qtr vs. 12 Mths Ago
4,036,937 5,076,085 2,746,940
Delivered SF vs. Prev. Qtr vs. 12 Mths Ago
1,740,669 597,455 497,400
Source: CoStar 2016 3Q Industrial Report
TOP LEASE TRANSACTIONS• Sonwil Distribution leased 229,400 SF from ProLogis at 3151 E
Pioneer Parkway.
• Sonoco Products Company leased 155,000 SF from Cabot at 5111 Frye Road.
• JanPak/Interline renewed their 200,288 SF lease with Cornerstone at 3101 High River.
• Omega Environmental leased 75,900 SF from IPT at 5355 FAA Boulevard.
• All Goods renewed their 79,735 SF lease with IndCor Properties at 912 113th.
• Omnilife USA leased 38,400 SF from ProLogis at 1205 Post N Paddock Street.
• Innovative Soil Solutions leased 22,350 SF from ATCAP at 700 107th Street.
DEALS ON THE MARKET• 3385 Roy Orr – 72,000 SF in the Great Southwest Submarket;
owned by Duke Realty.
NEW DEVELOPMENTS• Parc GSW – 682,491 SF spec with Clarion
• Trinity Crossing – 2 building development (144,187 and 178,655 SF) spec with Cabot
• Wildlife Commerce 4 & 5 – 205,550 and 342,526 SF spec with Crow Holdings Industrial
• GSW Global Logistics Park – 3 building development 1,051,342 SF spec with Crow Holdings
• CentrePort Building 1 & 2 – 270,762 & 430,759 SF spec with Hillwood
• Arlington Commerce Center – 263,380 SF spec with Exeter
• Liberty Park GSW North Building 2 & 3 – 537,373 SF spec with Liberty Property Trust
• First Arlington Commerce Center II – 234,100 SF spec with First Industrial
• I-20/161 Crossing – 430,188 SF spec with Mohr Capital
• GSW Gateway Building 4 & 5 – 2 building development (312,314 and 315,036 SF) spec with Invesco
• Park 20/360 – 4 building development 1,262,040 SF spec with Invesco
LARGE EXISTING VACANCIES• 931 West Bardin Road – 420,000 SF
• 951 Valley View Lane & Frye Road – 341,442 SF
• 3100 State Highway 161 – 266,450 SF
• 2300 Bardin Road – 263,380 SF
• 2251 East Bardin Road – 234,100 SF
Absorption Deliveries Vacancy
0.0%
1.0%
2.0%
3.0%
4.0%
5.0%
6.0%
7.0%
8.0%
9.0%
10.0%
(500,000)
0
500,000
1,000,000
1,500,000
2,000,000
2,500,000
3,000,000
Q3 13
Q4 13
Q1 14
Q2 14
Q3 14
Q4 14
Q1 15
Q2 15
Q3 15
Q4 15
Q1 16
Q2 16
Q3 16
VITAL STATS
DFW INDUSTRIAL MARKET BRIEF 3Q 20165
HLC Deal
HLC Deal
DFW INDUSTRIAL MARKET BRIEF 3Q 2016 6
SUBMARKET INTELLIGENCE DFW AIRPORT
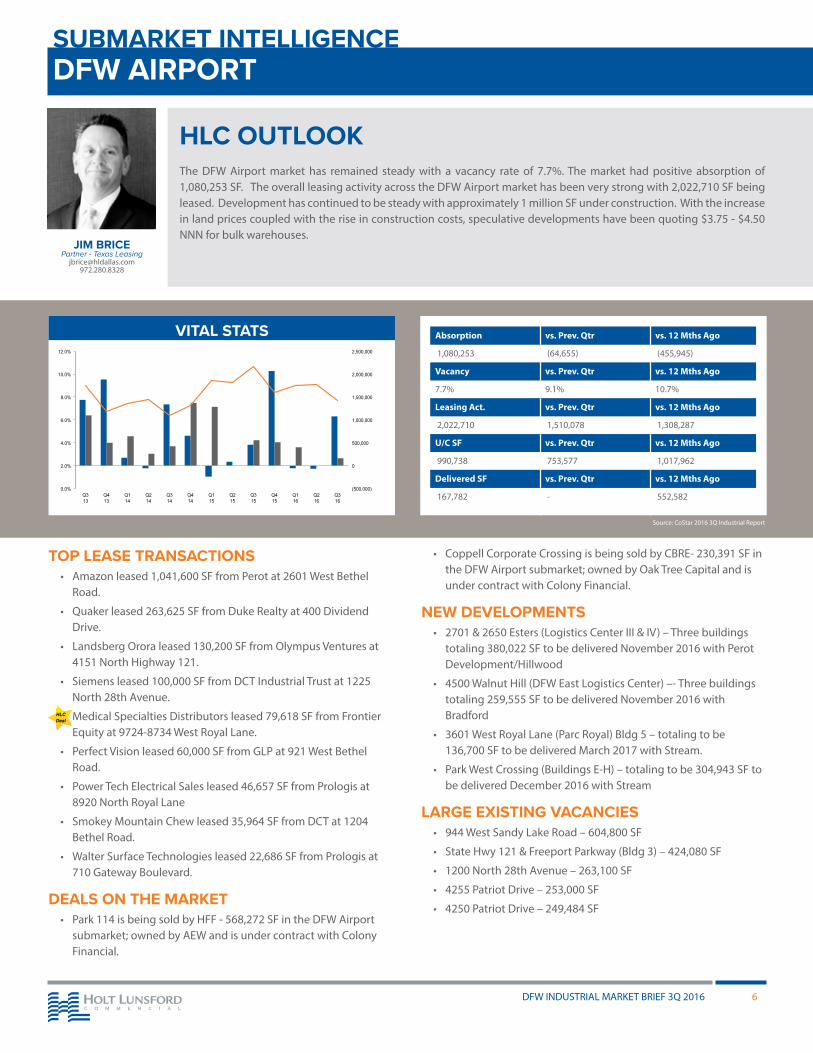
HLC OUTLOOK The DFW Airport market has remained steady with a vacancy rate of 7.7%. The market had positive absorption of 1,080,253 SF. The overall leasing activity across the DFW Airport market has been very strong with 2,022,710 SF being leased. Development has continued to be steady with approximately 1 million SF under construction. With the increase in land prices coupled with the rise in construction costs, speculative developments have been quoting $3.75 - $4.50 NNN for bulk warehouses.
JIM BRICEPartner - Texas Leasing
[email protected] 972.280.8328
Absorption vs. Prev. Qtr vs. 12 Mths Ago
1,080,253 (64,655) (455,945)
Vacancy vs. Prev. Qtr vs. 12 Mths Ago
7.7% 9.1% 10.7%
Leasing Act. vs. Prev. Qtr vs. 12 Mths Ago
2,022,710 1,510,078 1,308,287
U/C SF vs. Prev. Qtr vs. 12 Mths Ago
990,738 753,577 1,017,962
Delivered SF vs. Prev. Qtr vs. 12 Mths Ago
167,782 - 552,582
Source: CoStar 2016 3Q Industrial Report
TOP LEASE TRANSACTIONS• Amazon leased 1,041,600 SF from Perot at 2601 West Bethel
Road.
• Quaker leased 263,625 SF from Duke Realty at 400 Dividend Drive.
• Landsberg Orora leased 130,200 SF from Olympus Ventures at 4151 North Highway 121.
• Siemens leased 100,000 SF from DCT Industrial Trust at 1225 North 28th Avenue.
• Medical Specialties Distributors leased 79,618 SF from Frontier Equity at 9724-8734 West Royal Lane.
• Perfect Vision leased 60,000 SF from GLP at 921 West Bethel Road.
• Power Tech Electrical Sales leased 46,657 SF from Prologis at 8920 North Royal Lane
• Smokey Mountain Chew leased 35,964 SF from DCT at 1204 Bethel Road.
• Walter Surface Technologies leased 22,686 SF from Prologis at 710 Gateway Boulevard.
DEALS ON THE MARKET• Park 114 is being sold by HFF - 568,272 SF in the DFW Airport
submarket; owned by AEW and is under contract with Colony Financial.
• Coppell Corporate Crossing is being sold by CBRE- 230,391 SF in the DFW Airport submarket; owned by Oak Tree Capital and is under contract with Colony Financial.
NEW DEVELOPMENTS• 2701 & 2650 Esters (Logistics Center III & IV) – Three buildings
totaling 380,022 SF to be delivered November 2016 with Perot Development/Hillwood
• 4500 Walnut Hill (DFW East Logistics Center) –- Three buildings totaling 259,555 SF to be delivered November 2016 with Bradford
• 3601 West Royal Lane (Parc Royal) Bldg 5 – totaling to be 136,700 SF to be delivered March 2017 with Stream.
• Park West Crossing (Buildings E-H) – totaling to be 304,943 SF to be delivered December 2016 with Stream
LARGE EXISTING VACANCIES• 944 West Sandy Lake Road – 604,800 SF
• State Hwy 121 & Freeport Parkway (Bldg 3) – 424,080 SF
• 1200 North 28th Avenue – 263,100 SF
• 4255 Patriot Drive – 253,000 SF
• 4250 Patriot Drive – 249,484 SF
Absorption Deliveries Vacancy
0.0%
2.0%
4.0%
6.0%
8.0%
10.0%
12.0%
(500,000)
0
500,000
1,000,000
1,500,000
2,000,000
2,500,000
Q3 13
Q4 13
Q1 14
Q2 14
Q3 14
Q4 14
Q1 15
Q2 15
Q3 15
Q4 15
Q1 16
Q2 16
Q3 16
VITAL STATS
HLC Deal
SUBMARKET INTELLIGENCE NORTHEAST AND EAST DALLAS
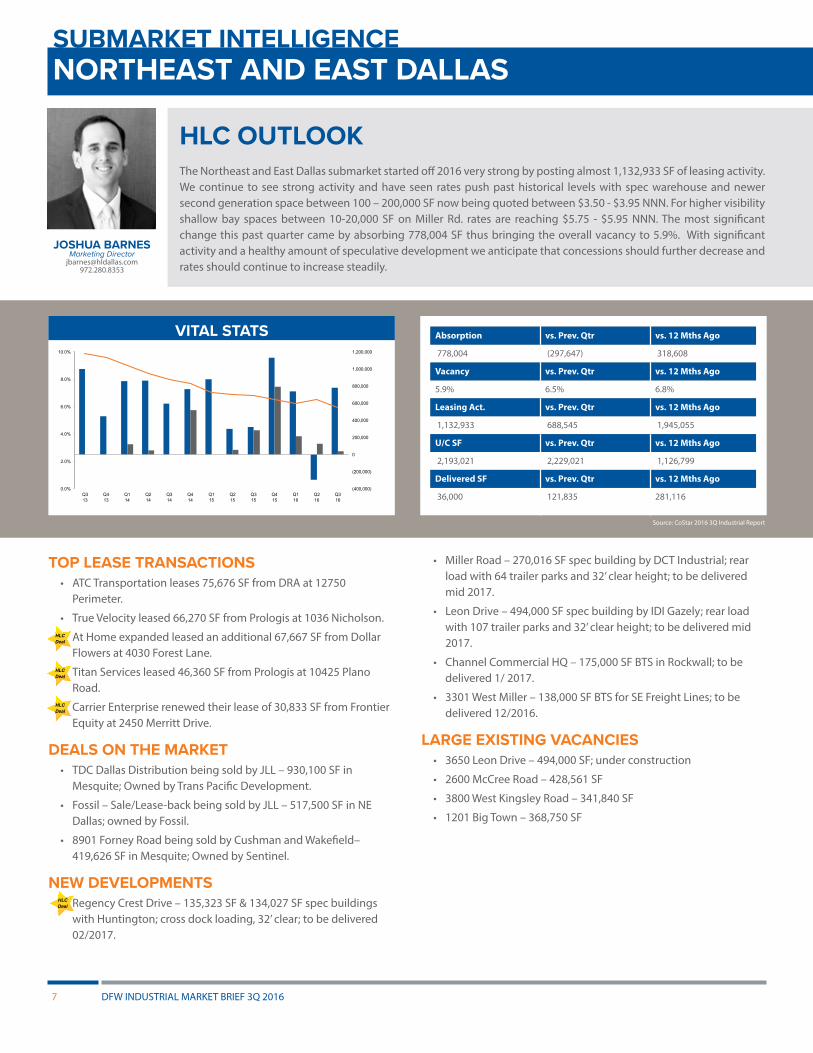
HLC OUTLOOK The Northeast and East Dallas submarket started off 2016 very strong by posting almost 1,132,933 SF of leasing activity. We continue to see strong activity and have seen rates push past historical levels with spec warehouse and newer second generation space between 100 – 200,000 SF now being quoted between $3.50 - $3.95 NNN. For higher visibility shallow bay spaces between 10-20,000 SF on Miller Rd. rates are reaching $5.75 - $5.95 NNN. The most significant change this past quarter came by absorbing 778,004 SF thus bringing the overall vacancy to 5.9%. With significant activity and a healthy amount of speculative development we anticipate that concessions should further decrease and rates should continue to increase steadily.
JOSHUA BARNESMarketing Director
[email protected] 972.280.8353
Absorption vs. Prev. Qtr vs. 12 Mths Ago
778,004 (297,647) 318,608
Vacancy vs. Prev. Qtr vs. 12 Mths Ago
5.9% 6.5% 6.8%
Leasing Act. vs. Prev. Qtr vs. 12 Mths Ago
1,132,933 688,545 1,945,055
U/C SF vs. Prev. Qtr vs. 12 Mths Ago
2,193,021 2,229,021 1,126,799
Delivered SF vs. Prev. Qtr vs. 12 Mths Ago
36,000 121,835 281,116
Source: CoStar 2016 3Q Industrial Report
TOP LEASE TRANSACTIONS• ATC Transportation leases 75,676 SF from DRA at 12750
Perimeter.
• True Velocity leased 66,270 SF from Prologis at 1036 Nicholson.
• At Home expanded leased an additional 67,667 SF from Dollar Flowers at 4030 Forest Lane.
• Titan Services leased 46,360 SF from Prologis at 10425 Plano Road.
• Carrier Enterprise renewed their lease of 30,833 SF from Frontier Equity at 2450 Merritt Drive.
DEALS ON THE MARKET• TDC Dallas Distribution being sold by JLL – 930,100 SF in
Mesquite; Owned by Trans Pacific Development.
• Fossil – Sale/Lease-back being sold by JLL – 517,500 SF in NE Dallas; owned by Fossil.
• 8901 Forney Road being sold by Cushman and Wakefield– 419,626 SF in Mesquite; Owned by Sentinel.
NEW DEVELOPMENTS• Regency Crest Drive – 135,323 SF & 134,027 SF spec buildings
with Huntington; cross dock loading, 32’ clear; to be delivered 02/2017.
• Miller Road – 270,016 SF spec building by DCT Industrial; rear load with 64 trailer parks and 32’ clear height; to be delivered mid 2017.
• Leon Drive – 494,000 SF spec building by IDI Gazely; rear load with 107 trailer parks and 32’ clear height; to be delivered mid 2017.
• Channel Commercial HQ – 175,000 SF BTS in Rockwall; to be delivered 1/ 2017.
• 3301 West Miller – 138,000 SF BTS for SE Freight Lines; to be delivered 12/2016.
LARGE EXISTING VACANCIES• 3650 Leon Drive – 494,000 SF; under construction
• 2600 McCree Road – 428,561 SF
• 3800 West Kingsley Road – 341,840 SF
• 1201 Big Town – 368,750 SF
Absorption Deliveries Vacancy
0.0%
2.0%
4.0%
6.0%
8.0%
10.0%
(400,000)
(200,000)
0
200,000
400,000
600,000
800,000
1,000,000
1,200,000
Q3 13
Q4 13
Q1 14
Q2 14
Q3 14
Q4 14
Q1 15
Q2 15
Q3 15
Q4 15
Q1 16
Q2 16
Q3 16
VITAL STATS
DFW INDUSTRIAL MARKET BRIEF 3Q 20167
HLC Deal
HLC Deal
HLC Deal
HLC Deal
DFW INDUSTRIAL MARKET BRIEF 3Q 2016 8
SUBMARKET INTELLIGENCE SOUTH DALLAS
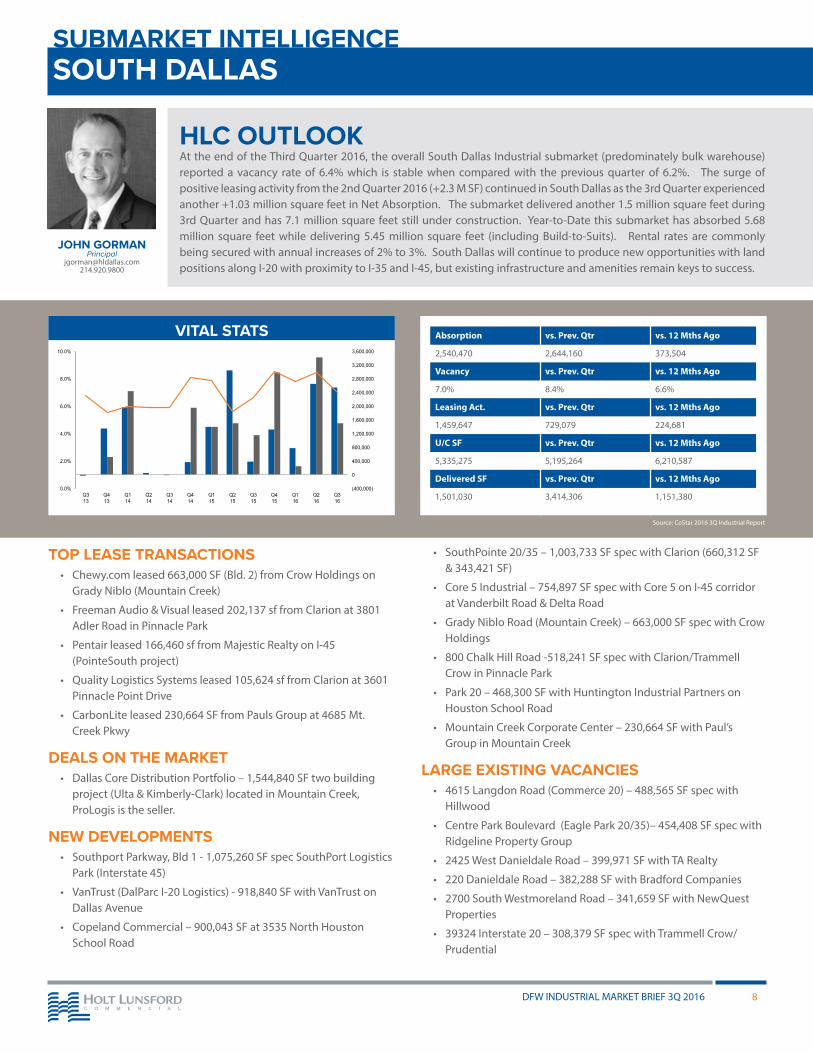
HLC OUTLOOK At the end of the Third Quarter 2016, the overall South Dallas Industrial submarket (predominately bulk warehouse) reported a vacancy rate of 6.4% which is stable when compared with the previous quarter of 6.2%. The surge of positive leasing activity from the 2nd Quarter 2016 (+2.3 M SF) continued in South Dallas as the 3rd Quarter experienced another +1.03 million square feet in Net Absorption. The submarket delivered another 1.5 million square feet during 3rd Quarter and has 7.1 million square feet still under construction. Year-to-Date this submarket has absorbed 5.68 million square feet while delivering 5.45 million square feet (including Build-to-Suits). Rental rates are commonly being secured with annual increases of 2% to 3%. South Dallas will continue to produce new opportunities with land positions along I-20 with proximity to I-35 and I-45, but existing infrastructure and amenities remain keys to success.
JOHN GORMANPrincipal
[email protected] 214.920.9800
Absorption vs. Prev. Qtr vs. 12 Mths Ago
2,540,470 2,644,160 373,504
Vacancy vs. Prev. Qtr vs. 12 Mths Ago
7.0% 8.4% 6.6%
Leasing Act. vs. Prev. Qtr vs. 12 Mths Ago
1,459,647 729,079 224,681
U/C SF vs. Prev. Qtr vs. 12 Mths Ago
5,335,275 5,195,264 6,210,587
Delivered SF vs. Prev. Qtr vs. 12 Mths Ago
1,501,030 3,414,306 1,151,380
Source: CoStar 2016 3Q Industrial Report
TOP LEASE TRANSACTIONS• Chewy.com leased 663,000 SF (Bld. 2) from Crow Holdings on
Grady Niblo (Mountain Creek)
• Freeman Audio & Visual leased 202,137 sf from Clarion at 3801 Adler Road in Pinnacle Park
• Pentair leased 166,460 sf from Majestic Realty on I-45 (PointeSouth project)
• Quality Logistics Systems leased 105,624 sf from Clarion at 3601 Pinnacle Point Drive
• CarbonLite leased 230,664 SF from Pauls Group at 4685 Mt. Creek Pkwy
DEALS ON THE MARKET• Dallas Core Distribution Portfolio – 1,544,840 SF two building
project (Ulta & Kimberly-Clark) located in Mountain Creek, ProLogis is the seller.
NEW DEVELOPMENTS• Southport Parkway, Bld 1 - 1,075,260 SF spec SouthPort Logistics
Park (Interstate 45)
• VanTrust (DalParc I-20 Logistics) - 918,840 SF with VanTrust on Dallas Avenue
• Copeland Commercial – 900,043 SF at 3535 North Houston School Road
• SouthPointe 20/35 – 1,003,733 SF spec with Clarion (660,312 SF & 343,421 SF)
• Core 5 Industrial – 754,897 SF spec with Core 5 on I-45 corridor at Vanderbilt Road & Delta Road
• Grady Niblo Road (Mountain Creek) – 663,000 SF spec with Crow Holdings
• 800 Chalk Hill Road -518,241 SF spec with Clarion/Trammell Crow in Pinnacle Park
• Park 20 – 468,300 SF with Huntington Industrial Partners on Houston School Road
• Mountain Creek Corporate Center – 230,664 SF with Paul’s Group in Mountain Creek
LARGE EXISTING VACANCIES• 4615 Langdon Road (Commerce 20) – 488,565 SF spec with
Hillwood
• Centre Park Boulevard (Eagle Park 20/35)– 454,408 SF spec with Ridgeline Property Group
• 2425 West Danieldale Road – 399,971 SF with TA Realty
• 220 Danieldale Road – 382,288 SF with Bradford Companies
• 2700 South Westmoreland Road – 341,659 SF with NewQuest Properties
• 39324 Interstate 20 – 308,379 SF spec with Trammell Crow/Prudential
Absorption Deliveries Vacancy
0.0%
2.0%
4.0%
6.0%
8.0%
10.0%
(400,000)
0
400,000
800,000
1,200,000
1,600,000
2,000,000
2,400,000
2,800,000
3,200,000
3,600,000
Q3 13
Q4 13
Q1 14
Q2 14
Q3 14
Q4 14
Q1 15
Q2 15
Q3 15
Q4 15
Q1 16
Q2 16
Q3 16
VITAL STATS
SUBMARKET INTELLIGENCE NORTHWEST DALLAS
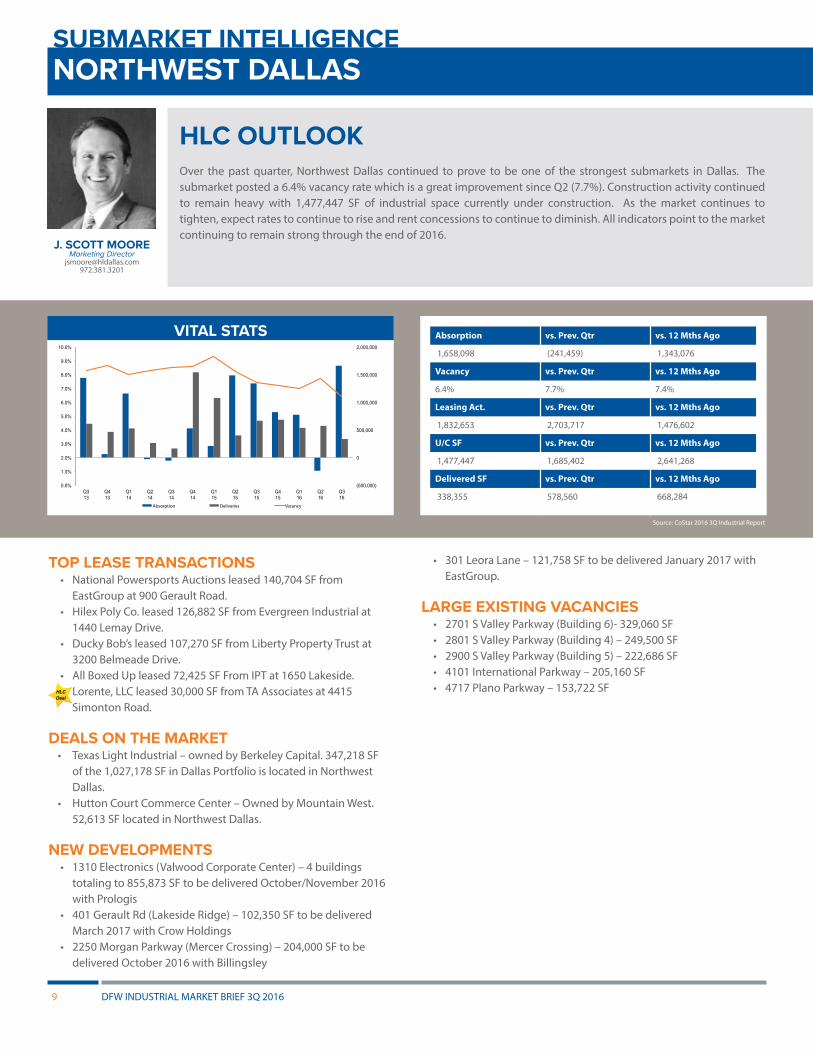
HLC OUTLOOK Over the past quarter, Northwest Dallas continued to prove to be one of the strongest submarkets in Dallas. The submarket posted a 6.4% vacancy rate which is a great improvement since Q2 (7.7%). Construction activity continued to remain heavy with 1,477,447 SF of industrial space currently under construction. As the market continues to tighten, expect rates to continue to rise and rent concessions to continue to diminish. All indicators point to the market continuing to remain strong through the end of 2016.
J. SCOTT MOOREMarketing Director
[email protected] 972.381.3201
Absorption vs. Prev. Qtr vs. 12 Mths Ago
1,658,098 (241,459) 1,343,076
Vacancy vs. Prev. Qtr vs. 12 Mths Ago
6.4% 7.7% 7.4%
Leasing Act. vs. Prev. Qtr vs. 12 Mths Ago
1,832,653 2,703,717 1,476,602
U/C SF vs. Prev. Qtr vs. 12 Mths Ago
1,477,447 1,685,402 2,641,268
Delivered SF vs. Prev. Qtr vs. 12 Mths Ago
338,355 578,560 668,284
Source: CoStar 2016 3Q Industrial Report
TOP LEASE TRANSACTIONS• National Powersports Auctions leased 140,704 SF from
EastGroup at 900 Gerault Road. • Hilex Poly Co. leased 126,882 SF from Evergreen Industrial at
1440 Lemay Drive. • Ducky Bob’s leased 107,270 SF from Liberty Property Trust at
3200 Belmeade Drive.• All Boxed Up leased 72,425 SF From IPT at 1650 Lakeside. • Lorente, LLC leased 30,000 SF from TA Associates at 4415
Simonton Road.
DEALS ON THE MARKET• Texas Light Industrial – owned by Berkeley Capital. 347,218 SF
of the 1,027,178 SF in Dallas Portfolio is located in Northwest Dallas.
• Hutton Court Commerce Center – Owned by Mountain West. 52,613 SF located in Northwest Dallas.
NEW DEVELOPMENTS
• 1310 Electronics (Valwood Corporate Center) – 4 buildings totaling to 855,873 SF to be delivered October/November 2016 with Prologis
• 401 Gerault Rd (Lakeside Ridge) – 102,350 SF to be delivered March 2017 with Crow Holdings
• 2250 Morgan Parkway (Mercer Crossing) – 204,000 SF to be delivered October 2016 with Billingsley
• 301 Leora Lane – 121,758 SF to be delivered January 2017 with EastGroup.
LARGE EXISTING VACANCIES• 2701 S Valley Parkway (Building 6)- 329,060 SF• 2801 S Valley Parkway (Building 4) – 249,500 SF• 2900 S Valley Parkway (Building 5) – 222,686 SF• 4101 International Parkway – 205,160 SF• 4717 Plano Parkway – 153,722 SF
Absorption Deliveries Vacancy
0.0%
1.0%
2.0%
3.0%
4.0%
5.0%
6.0%
7.0%
8.0%
9.0%
10.0%
(500,000)
0
500,000
1,000,000
1,500,000
2,000,000
Q3 13
Q4 13
Q1 14
Q2 14
Q3 14
Q4 14
Q1 15
Q2 15
Q3 15
Q4 15
Q1 16
Q2 16
Q3 16
VITAL STATS
DFW INDUSTRIAL MARKET BRIEF 3Q 20169
HLC Deal
DFW INDUSTRIAL MARKET BRIEF 3Q 2016 10
SUBMARKET INTELLIGENCE SOUTH STEMMONS
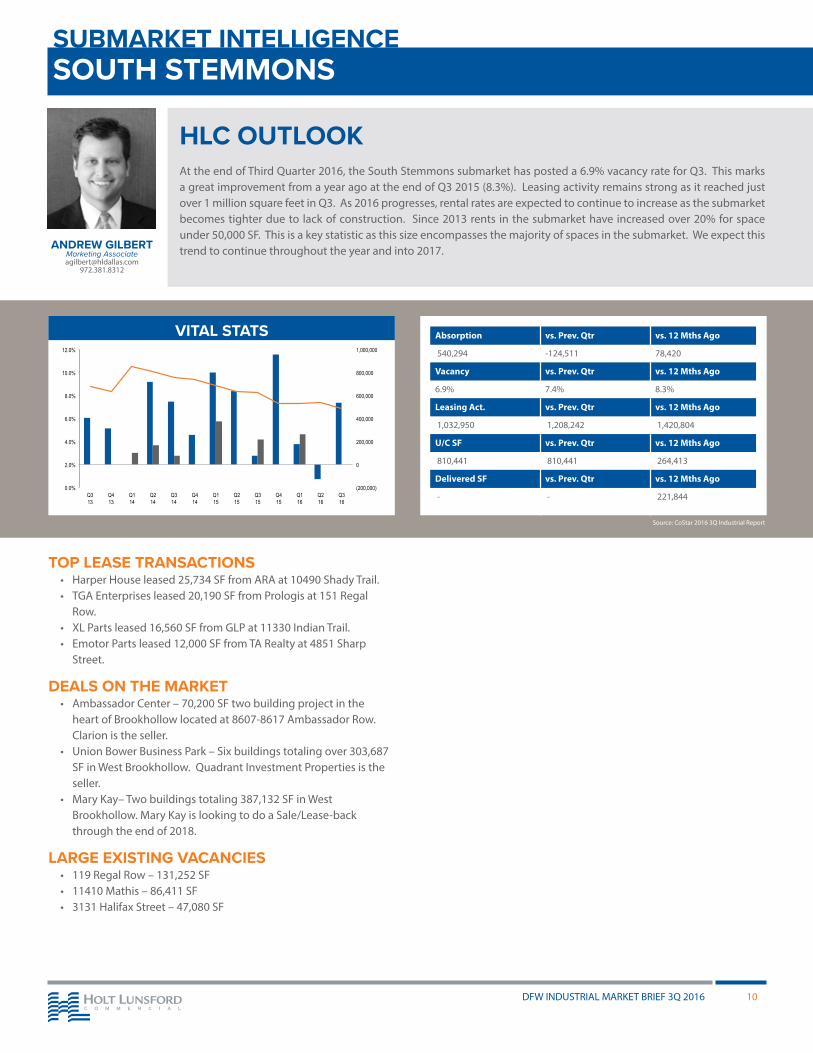
HLC OUTLOOK At the end of Third Quarter 2016, the South Stemmons submarket has posted a 6.9% vacancy rate for Q3. This marks a great improvement from a year ago at the end of Q3 2015 (8.3%). Leasing activity remains strong as it reached just over 1 million square feet in Q3. As 2016 progresses, rental rates are expected to continue to increase as the submarket becomes tighter due to lack of construction. Since 2013 rents in the submarket have increased over 20% for space under 50,000 SF. This is a key statistic as this size encompasses the majority of spaces in the submarket. We expect this trend to continue throughout the year and into 2017.ANDREW GILBERT
Marketing [email protected]
972.381.8312
Absorption vs. Prev. Qtr vs. 12 Mths Ago
540,294 -124,511 78,420
Vacancy vs. Prev. Qtr vs. 12 Mths Ago
6.9% 7.4% 8.3%
Leasing Act. vs. Prev. Qtr vs. 12 Mths Ago
1,032,950 1,208,242 1,420,804
U/C SF vs. Prev. Qtr vs. 12 Mths Ago
810,441 810,441 264,413
Delivered SF vs. Prev. Qtr vs. 12 Mths Ago
- - 221,844
Source: CoStar 2016 3Q Industrial Report
TOP LEASE TRANSACTIONS• Harper House leased 25,734 SF from ARA at 10490 Shady Trail.• TGA Enterprises leased 20,190 SF from Prologis at 151 Regal
Row.• XL Parts leased 16,560 SF from GLP at 11330 Indian Trail. • Emotor Parts leased 12,000 SF from TA Realty at 4851 Sharp
Street.
DEALS ON THE MARKET• Ambassador Center – 70,200 SF two building project in the
heart of Brookhollow located at 8607-8617 Ambassador Row. Clarion is the seller.
• Union Bower Business Park – Six buildings totaling over 303,687 SF in West Brookhollow. Quadrant Investment Properties is the seller.
• Mary Kay– Two buildings totaling 387,132 SF in West Brookhollow. Mary Kay is looking to do a Sale/Lease-back through the end of 2018.
LARGE EXISTING VACANCIES• 119 Regal Row – 131,252 SF• 11410 Mathis – 86,411 SF• 3131 Halifax Street – 47,080 SF
Absorption Deliveries Vacancy
0.0%
2.0%
4.0%
6.0%
8.0%
10.0%
12.0%
(200,000)
0
200,000
400,000
600,000
800,000
1,000,000
Q3 13
Q4 13
Q1 14
Q2 14
Q3 14
Q4 14
Q1 15
Q2 15
Q3 15
Q4 15
Q1 16
Q2 16
Q3 16
VITAL STATS
SUBMARKET INTELLIGENCE NORTH FORT WORTH
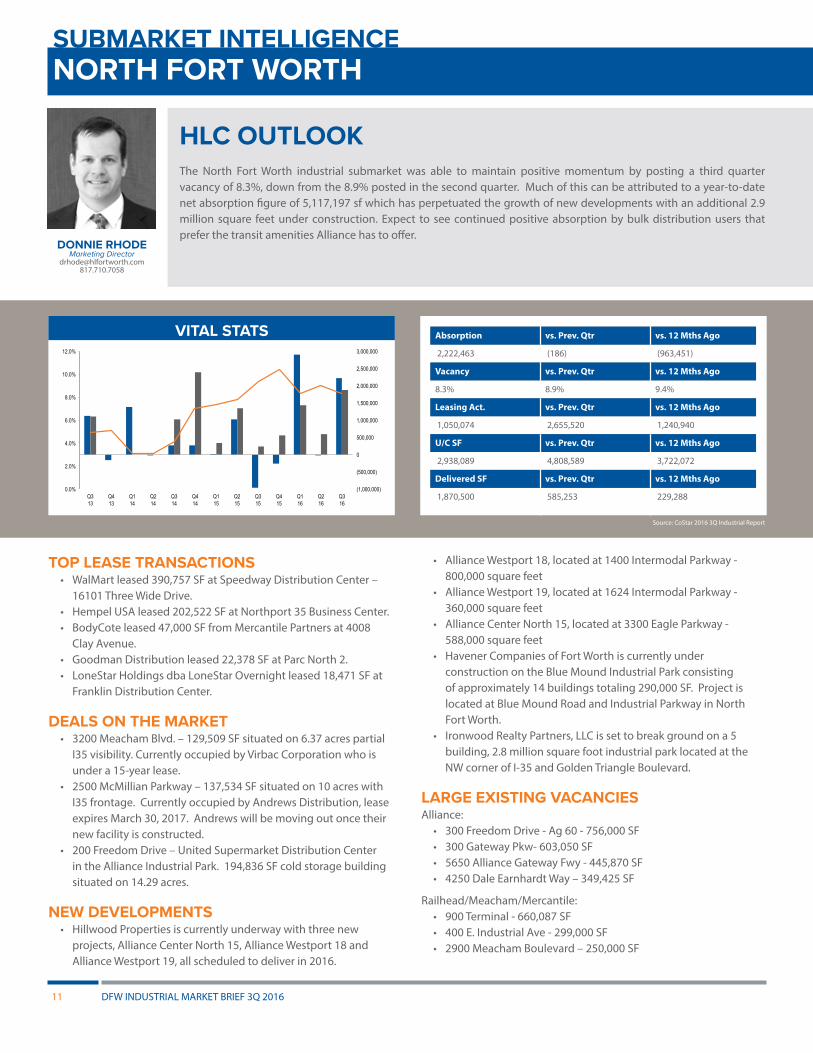
HLC OUTLOOK The North Fort Worth industrial submarket was able to maintain positive momentum by posting a third quarter vacancy of 8.3%, down from the 8.9% posted in the second quarter. Much of this can be attributed to a year-to-date net absorption figure of 5,117,197 sf which has perpetuated the growth of new developments with an additional 2.9 million square feet under construction. Expect to see continued positive absorption by bulk distribution users that prefer the transit amenities Alliance has to offer.
DONNIE RHODEMarketing Director
[email protected] 817.710.7058
Absorption vs. Prev. Qtr vs. 12 Mths Ago
2,222,463 (186) (963,451)
Vacancy vs. Prev. Qtr vs. 12 Mths Ago
8.3% 8.9% 9.4%
Leasing Act. vs. Prev. Qtr vs. 12 Mths Ago
1,050,074 2,655,520 1,240,940
U/C SF vs. Prev. Qtr vs. 12 Mths Ago
2,938,089 4,808,589 3,722,072
Delivered SF vs. Prev. Qtr vs. 12 Mths Ago
1,870,500 585,253 229,288
Source: CoStar 2016 3Q Industrial Report
TOP LEASE TRANSACTIONS• WalMart leased 390,757 SF at Speedway Distribution Center –
16101 Three Wide Drive.• Hempel USA leased 202,522 SF at Northport 35 Business Center.• BodyCote leased 47,000 SF from Mercantile Partners at 4008
Clay Avenue. • Goodman Distribution leased 22,378 SF at Parc North 2.• LoneStar Holdings dba LoneStar Overnight leased 18,471 SF at
Franklin Distribution Center.
DEALS ON THE MARKET• 3200 Meacham Blvd. – 129,509 SF situated on 6.37 acres partial
I35 visibility. Currently occupied by Virbac Corporation who is under a 15-year lease.
• 2500 McMillian Parkway – 137,534 SF situated on 10 acres with I35 frontage. Currently occupied by Andrews Distribution, lease expires March 30, 2017. Andrews will be moving out once their new facility is constructed.
• 200 Freedom Drive – United Supermarket Distribution Center in the Alliance Industrial Park. 194,836 SF cold storage building situated on 14.29 acres.
NEW DEVELOPMENTS• Hillwood Properties is currently underway with three new
projects, Alliance Center North 15, Alliance Westport 18 and Alliance Westport 19, all scheduled to deliver in 2016.
• Alliance Westport 18, located at 1400 Intermodal Parkway - 800,000 square feet
• Alliance Westport 19, located at 1624 Intermodal Parkway - 360,000 square feet
• Alliance Center North 15, located at 3300 Eagle Parkway - 588,000 square feet
• Havener Companies of Fort Worth is currently under construction on the Blue Mound Industrial Park consisting of approximately 14 buildings totaling 290,000 SF. Project is located at Blue Mound Road and Industrial Parkway in North Fort Worth.
• Ironwood Realty Partners, LLC is set to break ground on a 5 building, 2.8 million square foot industrial park located at the NW corner of I-35 and Golden Triangle Boulevard.
LARGE EXISTING VACANCIESAlliance:
• 300 Freedom Drive - Ag 60 - 756,000 SF• 300 Gateway Pkw- 603,050 SF• 5650 Alliance Gateway Fwy - 445,870 SF• 4250 Dale Earnhardt Way – 349,425 SF
Railhead/Meacham/Mercantile:• 900 Terminal - 660,087 SF• 400 E. Industrial Ave - 299,000 SF• 2900 Meacham Boulevard – 250,000 SF
Absorption Deliveries Vacancy
0.0%
2.0%
4.0%
6.0%
8.0%
10.0%
12.0%
(1,000,000)
(500,000)
0
500,000
1,000,000
1,500,000
2,000,000
2,500,000
3,000,000
Q3 13
Q4 13
Q1 14
Q2 14
Q3 14
Q4 14
Q1 15
Q2 15
Q3 15
Q4 15
Q1 16
Q2 16
Q3 16
VITAL STATS
DFW INDUSTRIAL MARKET BRIEF 3Q 201611
DFW INDUSTRIAL MARKET BRIEF 3Q 2016 12
SUBMARKET INTELLIGENCE SOUTH FORT WORTH
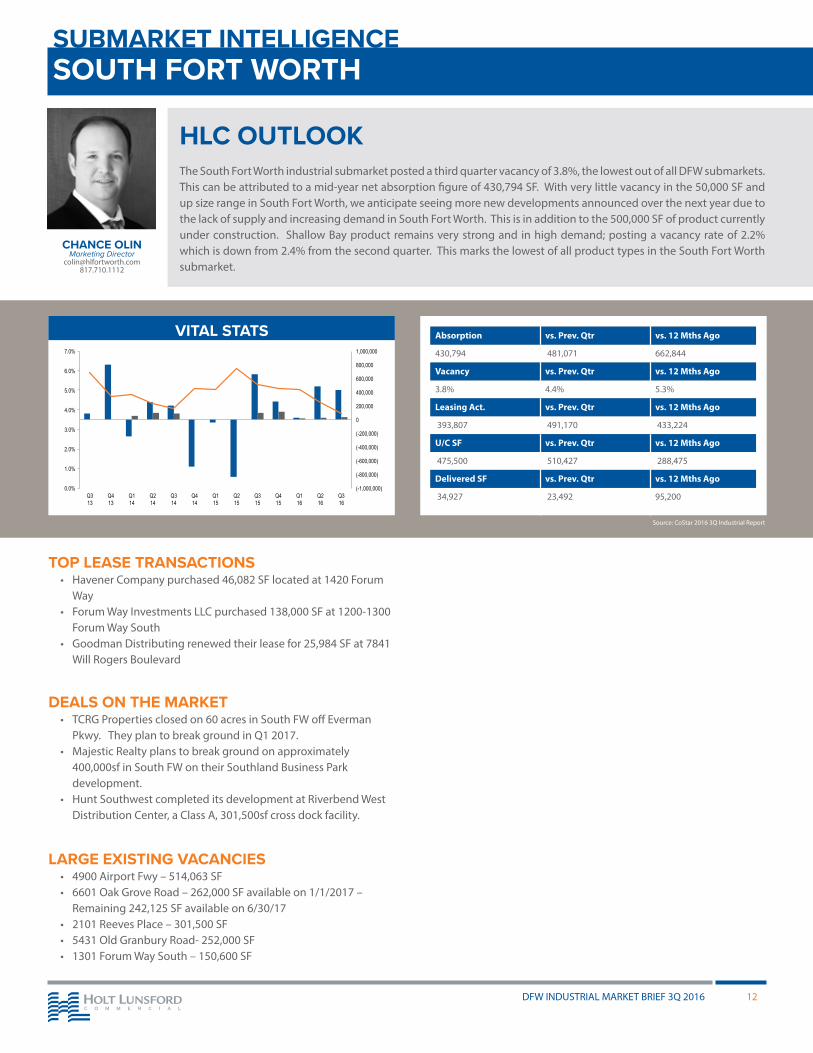
HLC OUTLOOK The South Fort Worth industrial submarket posted a third quarter vacancy of 3.8%, the lowest out of all DFW submarkets. This can be attributed to a mid-year net absorption figure of 430,794 SF. With very little vacancy in the 50,000 SF and up size range in South Fort Worth, we anticipate seeing more new developments announced over the next year due to the lack of supply and increasing demand in South Fort Worth. This is in addition to the 500,000 SF of product currently under construction. Shallow Bay product remains very strong and in high demand; posting a vacancy rate of 2.2% which is down from 2.4% from the second quarter. This marks the lowest of all product types in the South Fort Worth submarket.
CHANCE OLINMarketing Director
[email protected] 817.710.1112
Absorption vs. Prev. Qtr vs. 12 Mths Ago
430,794 481,071 662,844
Vacancy vs. Prev. Qtr vs. 12 Mths Ago
3.8% 4.4% 5.3%
Leasing Act. vs. Prev. Qtr vs. 12 Mths Ago
393,807 491,170 433,224
U/C SF vs. Prev. Qtr vs. 12 Mths Ago
475,500 510,427 288,475
Delivered SF vs. Prev. Qtr vs. 12 Mths Ago
34,927 23,492 95,200
Source: CoStar 2016 3Q Industrial Report
TOP LEASE TRANSACTIONS• Havener Company purchased 46,082 SF located at 1420 Forum
Way • Forum Way Investments LLC purchased 138,000 SF at 1200-1300
Forum Way South• Goodman Distributing renewed their lease for 25,984 SF at 7841
Will Rogers Boulevard
DEALS ON THE MARKET• TCRG Properties closed on 60 acres in South FW off Everman
Pkwy. They plan to break ground in Q1 2017.• Majestic Realty plans to break ground on approximately
400,000sf in South FW on their Southland Business Park development.
• Hunt Southwest completed its development at Riverbend West Distribution Center, a Class A, 301,500sf cross dock facility.
LARGE EXISTING VACANCIES• 4900 Airport Fwy – 514,063 SF• 6601 Oak Grove Road – 262,000 SF available on 1/1/2017 –
Remaining 242,125 SF available on 6/30/17• 2101 Reeves Place – 301,500 SF• 5431 Old Granbury Road- 252,000 SF• 1301 Forum Way South – 150,600 SF
Absorption Deliveries Vacancy
0.0%
1.0%
2.0%
3.0%
4.0%
5.0%
6.0%
7.0%
Q3 13
Q4 13
Q1 14
Q2 14
Q3 14
Q4 14
Q1 15
Q2 15
Q3 15
Q4 15
Q1 16
Q2 16
Q3 16
(-1,000,000)
(-800,000)
(-600,000)
(-400,000)
(-200,000)
0
200,000
400,000
600,000
800,000
1,000,000
VITAL STATS
DALLAS5055 Keller Springs Road
Suite 300Addison, Texas 75001
T 972.241.8300F 972.241.7955
HOUSTON11757 Katy Freeway
Suite 250Houston, Texas 77079
T 713.850.8500F 713.850.8550
FORT WORTH300 Throckmorton Street
Suite 550Fort Worth, Texas 76102
T 817.710.1110F 817.810.9017